Port Arthur, TX (Texas) Houses and Residents
| Port Arthur: | $97,117 |
| Texas: | $275,400 |
Total population: 54,548 (All urban)
Houses: 25,303 (20,627 occupied: 12,020 owner occupied, 8,994 renter occupied)
| % of renters here: | 43% |
| State: | 38% |
Housing density: 305 houses/condos per square mile
Median price asked for vacant for-sale houses and condos in 2022: $142,725.
Median contract rent in 2022: $742 (lower quartile is $318, upper quartile is $1,025)
Median rent asked for vacant for-rent units in 2022: $1,316
Median gross rent in Port Arthur, TX in 2022: $938
Housing units in Port Arthur with a mortgage: 3,583 (186 second mortgage, 0 home equity loan, 153 both second mortgage and home equity loan)
Houses without a mortgage: 206
Median household income for houses/condos with a mortgage: $71,005
Median household income for apartments without a mortgage: $52,162
Median monthly housing costs: $712
Compare current foreclosures in Port Arthur, TX:
| Photo | Address | Area | Beds / Baths | Price | Details |
|---|---|---|---|---|---|

|
#1
Griffing Dr
Port Arthur, TX 77642
|
1,670 sq. feet
|
- baths - beds |
show details | |

|
#2
Grand Ave
Port Arthur, TX 77642
|
1,517 sq. feet
|
- baths - beds |
show details | |

|
#3
Drexel Ave
Port Arthur, TX 77642
|
1,325 sq. feet
|
- baths - beds |
show details | |

|
#4
Sharon Dr
Port Arthur, TX 77640
|
- sq. feet
|
- baths - beds |
show details | |

|
#5
3rd Ave
Port Arthur, TX 77642
|
1,356 sq. feet
|
- baths - beds |
show details | |

|
#6
12th St
Port Arthur, TX 77642
|
1,472 sq. feet
|
- baths - beds |
show details | |

|
#7
Chimney Rock Ct
Port Arthur, TX 77642
|
- sq. feet
|
- baths - beds |
show details | |

|
#8
Pat Ave
Port Arthur, TX 77640
|
1,037 sq. feet
|
- baths - beds |
show details | |

|
#9
Chandelle Ln
Port Arthur, TX 77642
|
1,870 sq. feet
|
- baths - beds |
show details | |

|
#10
9th Ave Apt 144
Port Arthur, TX 77642
|
- sq. feet
|
- baths - beds |
show details |
| Photo | Address | Area | Beds / Baths | Price | Details |
|---|---|---|---|---|---|

|
#11
58th St
Port Arthur, TX 77640
|
- sq. feet
|
- baths - beds |
show details | |

|
#12
W 17th St
Port Arthur, TX 77640
|
1,177 sq. feet
|
- baths - beds |
show details | |

|
#13
Glenwood Dr
Port Arthur, TX 77642
|
1,176 sq. feet
|
- baths - beds |
show details | |

|
#14
Oaklawn Ave
Port Arthur, TX 77642
|
1,228 sq. feet
|
- baths - beds |
show details | |

|
#15
15th St
Port Arthur, TX 77640
|
2,400 sq. feet
|
- baths - beds |
show details | |

|
#16
Lakeshore Dr
Port Arthur, TX 77640
|
2,348 sq. feet
|
- baths - beds |
show details | |

|
#17
Woodrow Dr
Port Arthur, TX 77642
|
1,986 sq. feet
|
- baths - beds |
show details | |

|
#18
Glenwood Dr
Port Arthur, TX 77642
|
2,592 sq. feet
|
- baths - beds |
show details | |

|
#19
Glacier Dr
Port Arthur, TX 77640
|
3,747 sq. feet
|
- baths - beds |
show details | |

|
#20
Bay St
Port Arthur, TX 77642
|
1,570 sq. feet
|
- baths - beds |
show details |
| Photo | Address | Area | Beds / Baths | Price | Details |
|---|---|---|---|---|---|

|
#21
7th St
Port Arthur, TX 77642
|
1,091 sq. feet
|
- baths - beds |
show details | |

|
#22
Glenwood Dr
Port Arthur, TX 77642
|
2,592 sq. feet
|
- baths - beds |
show details | |

|
#23
6th St
Port Arthur, TX 77642
|
- sq. feet
|
- baths - beds |
show details | |

|
#24
Lombardy Dr
Port Arthur, TX 77642
|
1,774 sq. feet
|
- baths - beds |
show details | |

|
#25
Rachel Ave
Port Arthur, TX 77642
|
1,762 sq. feet
|
- baths - beds |
show details | |

|
#26
Brittany Ave
Port Arthur, TX 77642
|
2,269 sq. feet
|
- baths - beds |
show details | |

|
#27
Lakeside Dr
Port Arthur, TX 77642
|
- sq. feet
|
- baths - beds |
show details | |

|
#28
Heatherbrook Trl Apt 205
Port Arthur, TX 77642
|
- sq. feet
|
- baths - beds |
show details | |

|
#29
14th St
Port Arthur, TX 77640
|
1,136 sq. feet
|
- baths - beds |
show details | |

|
#30
23rd St
Port Arthur, TX 77640
|
- sq. feet
|
- baths - beds |
show details |
| Photo | Address | Area | Beds / Baths | Price | Details |
|---|---|---|---|---|---|

|
#31
11th St
Port Arthur, TX 77642
|
1,025 sq. feet
|
- baths - beds |
show details | |

|
#32
10th St
Port Arthur, TX 77642
|
- sq. feet
|
- baths - beds |
show details | |

|
#33
Fort Worth Ave
Port Arthur, TX 77640
|
1,494 sq. feet
|
- baths - beds |
show details | |

|
#34
Greenbriar Ln
Port Arthur, TX 77642
|
1,872 sq. feet
|
- baths - beds |
show details | |

|
#35
14th St
Port Arthur, TX 77642
|
960 sq. feet
|
- baths - beds |
show details | |

|
#36
Shirley St
Port Arthur, TX 77640
|
- sq. feet
|
- baths - beds |
show details | |

|
#37
19th St
Port Arthur, TX 77640
|
1,752 sq. feet
|
- baths - beds |
show details | |

|
#38
Garnet Ave
Port Arthur, TX 77640
|
2,291 sq. feet
|
- baths - beds |
show details | |

|
#39
Lakeside Dr
Port Arthur, TX 77642
|
1,272 sq. feet
|
- baths - beds |
show details | |

|
#40
Lexington Ave
Port Arthur, TX 77642
|
1,794 sq. feet
|
- baths - beds |
show details |
| Photo | Address | Area | Beds / Baths | Price | Details |
|---|---|---|---|---|---|

|
#41
Lavender St
Port Arthur, TX 77640
|
1,601 sq. feet
|
- baths - beds |
show details | |

|
#42
Orleans Ave
Port Arthur, TX 77640
|
- sq. feet
|
- baths - beds |
show details | |

|
#43
Laura Ln
Port Arthur, TX 77640
|
2,342 sq. feet
|
- baths - beds |
show details | |

|
#44
Lakeshore Dr
Port Arthur, TX 77642
|
1,397 sq. feet
|
- baths - beds |
show details | |

|
#45
Robinhood Ave
Port Arthur, TX 77640
|
875 sq. feet
|
- baths - beds |
show details | |

|
#46
Highway 73 Apt 1513
Port Arthur, TX 77642
|
- sq. feet
|
- baths - beds |
show details | |

|
#47
27th St
Port Arthur, TX 77642
|
1,392 sq. feet
|
- baths - beds |
show details | |

|
#48
34th St
Port Arthur, TX 77642
|
1,641 sq. feet
|
- baths - beds |
show details | |

|
#49
Cox St
Port Arthur, TX 77640
|
- sq. feet
|
- baths - beds |
show details | |

|
Check over 1 million property listings on Foreclosure.com!
|
browse all offers | |||


 | Cost of living in different parts of Texas (31 replies) |
| Texas will become California (351 replies) |
| Trying to find a reason to stay in Texas (186 replies) |
| Thinking of moving from Maryland to Texas, pros and cons? (87 replies) |
| East TX “like third world”? (70 replies) |
| Having to relocate to Orange, Tx for work - Apartments? (7 replies) |
Median year apartment built: 1987
Household type by relationship:
Households: 54,995- Male householders: 9,045 (3,387 living alone), Female householders: 10,989 (2,975 living alone)
7,538 spouses (7,509 opposite-sex spouses), 1,080 unmarried partners, (1,043 opposite-sex unmarried partners), 19,661 children (18,764 natural, 167 adopted, 730 stepchildren), 1,825 grandchildren, 943 brothers or sisters, 1,066 parents, 45 foster children, 903 other relatives, 1,207 non-relatives
- In group quarters: 688
Size of family households: 5,593 2-persons, 3,421 3-persons, 2,605 4-persons, 1,508 5-persons, 708 6-persons, 421 7-or-more-persons.
Size of nonfamily households: 5,961 1-person, 741 2-persons, 28 3-persons, 34 4-persons, 4 5-persons, 10 6-persons.
5,772 married couples with children.
7,861 single-parent households (1,846 men, 6,015 women).
64.8% of residents of Port Arthur speak English at home.
28.8% of residents speak Spanish at home (55% speak English very well, 20% speak English well, 16% speak English not well, 9% don't speak English at all).
1.8% of residents speak other Indo-European language at home (69% speak English very well, 21% speak English well, 4% speak English not well, 6% don't speak English at all).
4.2% of residents speak Asian or Pacific Island language at home (51% speak English very well, 20% speak English well, 20% speak English not well, 10% don't speak English at all).
Foreign born population: 11,342 (20.6%)
(36.3% of them are naturalized citizens)
| Here: | 5.9 |
| State: | 6.3 |
| Here: | 4.4 |
| State: | 4.0 |
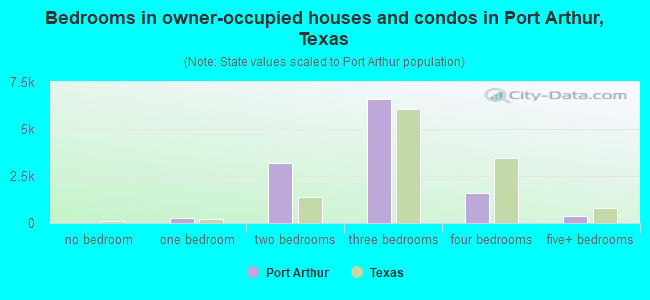
- Bedrooms in owner-occupied houses and condos in Port Arthur, Texas
- 19no bedroom
- 2651 bedroom
- 3,1742 bedrooms
- 6,6013 bedrooms
- 1,5944 bedrooms
- 3665+ bedrooms
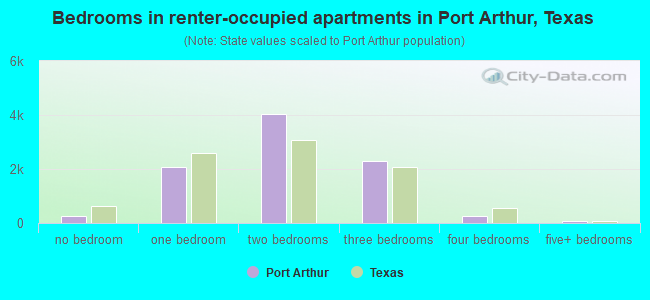
- Bedrooms in renter-occupied apartments in Port Arthur, Texas
- 251no bedroom
- 2,0721 bedroom
- 4,0302 bedrooms
- 2,3073 bedrooms
- 2604 bedrooms
- 745+ bedrooms
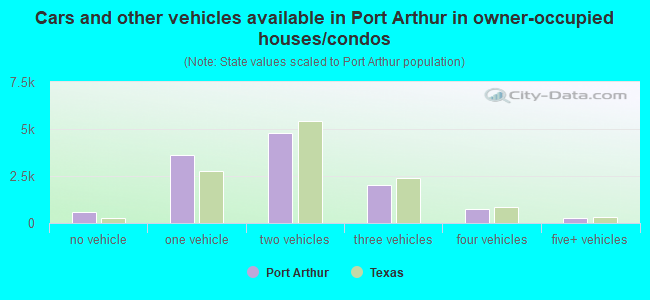
- Cars and other vehicles available in Port Arthur in owner-occupied houses/condos
- 610no vehicle
- 3,6001 vehicle
- 4,7652 vehicles
- 2,0263 vehicles
- 7464 vehicles
- 2735+ vehicles
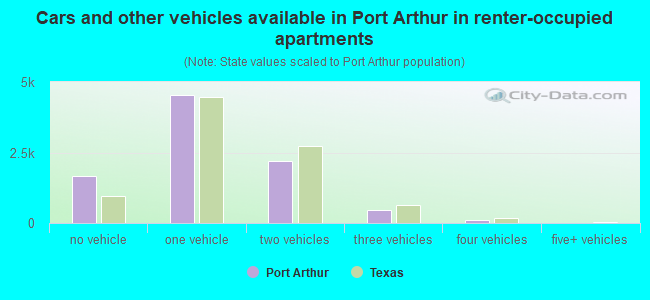
- Cars and other vehicles available in Port Arthur in renter-occupied apartments
- 1,674no vehicle
- 4,5481 vehicle
- 2,2032 vehicles
- 4643 vehicles
- 1054 vehicles
- 05+ vehicles
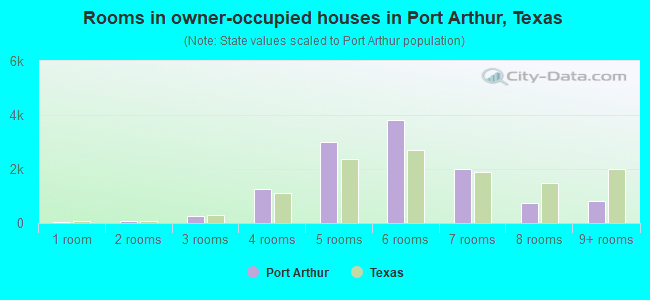
- Rooms in owner-occupied houses in Port Arthur, Texas
- 191 room
- 832 rooms
- 2633 rooms
- 1,2724 rooms
- 2,9985 rooms
- 3,8166 rooms
- 1,9997 rooms
- 7388 rooms
- 8339+ rooms
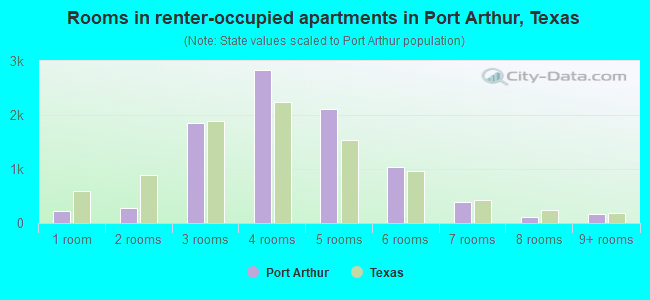
- Rooms in renter-occupied apartments in Port Arthur, Texas
- 2271 room
- 2782 rooms
- 1,8613 rooms
- 2,8294 rooms
- 2,1095 rooms
- 1,0326 rooms
- 3897 rooms
- 1108 rooms
- 1609+ rooms
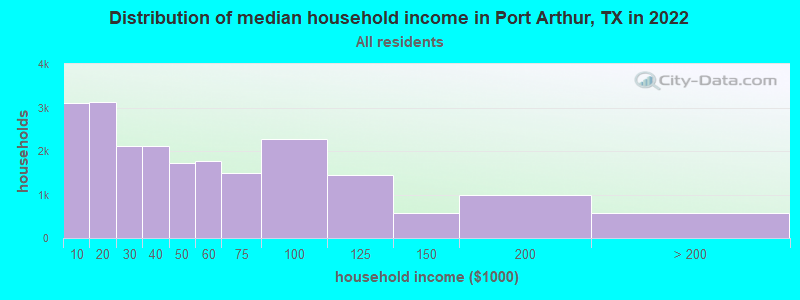
Port Arthur, TX household income distribution

- 3,092Less than $10,000
- 3,134$10,000 to $19,999
- 2,117$20,000 to $29,999
- 2,121$30,000 to $39,999
- 1,715$40,000 to $49,999
- 1,775$50,000 to $59,999
- 1,501$60,000 to $74,999
- 2,285$75,000 to $99,999
- 1,442$100,000 to $124,999
- 585$125,000 to $149,999
- 989$150,000 to $199,999
- 564$200,000 or more
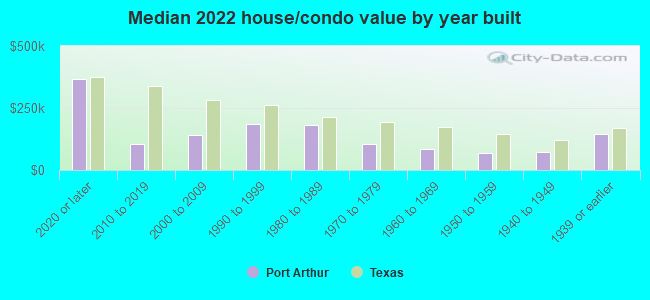
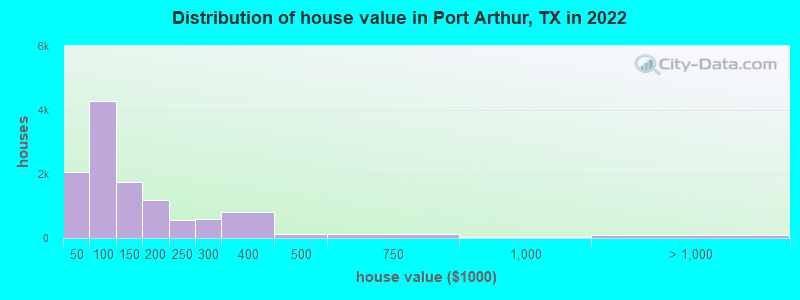
Home value of owner - occupied houses in 2022 in Port Arthur, TX
-
- 83Less than $10,000
- 32$10,000 to $14,999
- 105$15,000 to $19,999
- 284$20,000 to $24,999
- 208$25,000 to $29,999
- 501$30,000 to $34,999
- 383$35,000 to $39,999
- 466$40,000 to $49,999
- 522$50,000 to $59,999
- 881$60,000 to $69,999
- 845$70,000 to $79,999
- 914$80,000 to $89,999
- 665$90,000 to $99,999
- 1,076$100,000 to $124,999
- 688$125,000 to $149,999
- 761$150,000 to $174,999
- 427$175,000 to $199,999
- 553$200,000 to $249,999
- 603$250,000 to $299,999
- 821$300,000 to $399,999
- 121$400,000 to $499,999
- 114$500,000 to $749,999
- 27$750,000 to $999,999
- 6$1,000,000 to $1,499,999
- 84$2,000,000 or more
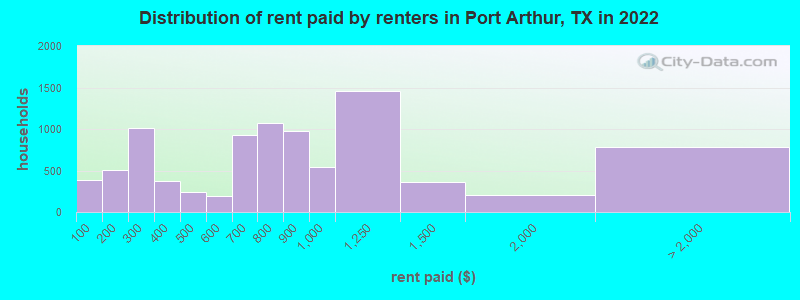
Rent paid by renters in 2022 in Port Arthur, TX
-
- 380Less than $100
- 150$100 to $149
- 360$150 to $199
- 738$200 to $249
- 271$250 to $299
- 309$300 to $349
- 61$350 to $399
- 172$400 to $449
- 67$450 to $499
- 59$500 to $549
- 127$550 to $599
- 242$600 to $649
- 690$650 to $699
- 675$700 to $749
- 391$750 to $799
- 971$800 to $899
- 537$900 to $999
- 1,453$1,000 to $1,249
- 356$1,250 to $1,499
- 205$1,500 to $1,999
- 86$2,000 to $2,499
- 24$3,500 or more
- 675No cash rent
Percentage of workers working in this county: 85.9%
Number of people working at home: 244 (1.2% of all workers)
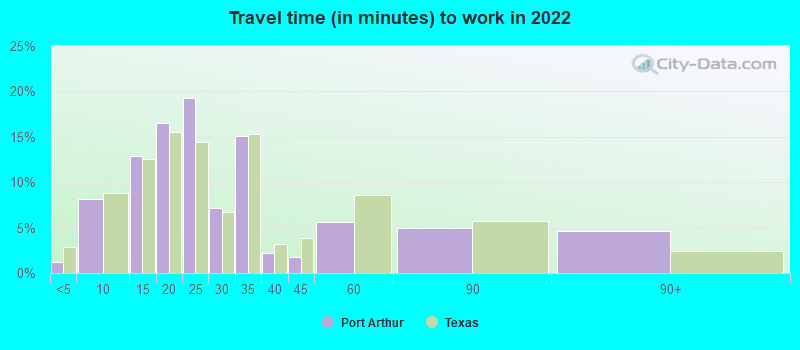
Travel time to work (commute)
- Less than 5 minutes: 145
- 5 to 9 minutes: 1,543
- 10 to 14 minutes: 2,141
- 15 to 19 minutes: 3,691
- 20 to 24 minutes: 4,751
- 25 to 29 minutes: 908
- 30 to 34 minutes: 3,202
- 35 to 39 minutes: 388
- 40 to 44 minutes: 343
- 45 to 59 minutes: 471
- 60 to 89 minutes: 973
- 90 or more minutes: 664
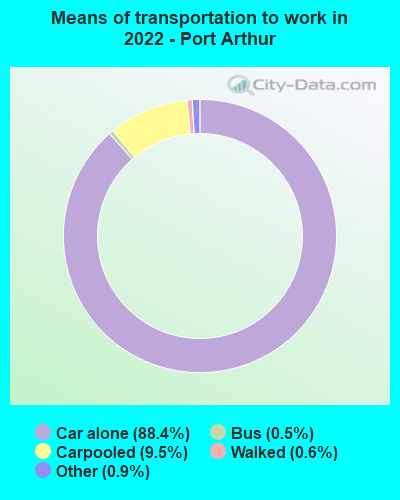
Means of transportation to work:
- Drove a car alone: 22,147 (83.3%)
- Carpooled: 2,576 (9.7%)
- Bus: 119 (0.4%)
- Taxi: 285 (1.1%)
- Bicycle: 1 (0.0%)
- Walked: 166 (0.6%)
- Worked at home: 244 (0.9%)
- Unemployment by race in 2022
- Unemployment rate for White non-Hispanic residents
- 8.2%Males
- 5.2%Females
- Unemployment rate for Black residents
- 10.1%Males
- 3.4%Females
- Unemployment rate for American Indian and Alaska Native residents
- 37.9%Females
- Unemployment rate for Asian residents
- 4.9%Males
- 2.5%Females
- Unemployment rate for other race residents
- 13.3%Males
- 1.9%Females
- Unemployment rate for two or more race residents
- 14.6%Males
- 2.7%Females
- Unemployment rate for Hispanic or Latino residents
- 6.7%Males
- 5.5%Females
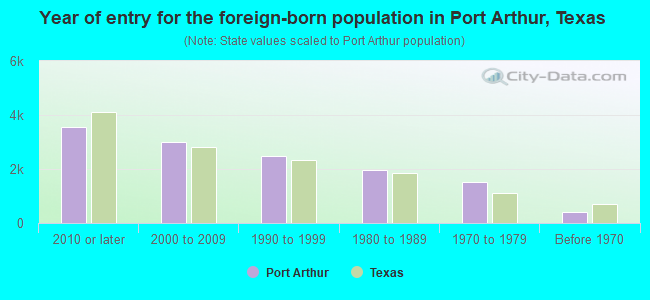
- Year of entry for the foreign-born population in Port Arthur, Texas
- 3,5542010 or later
- 2,9912000 to 2009
- 2,4961990 to 1999
- 1,9571980 to 1989
- 1,5181970 to 1979
- 407Before 1970
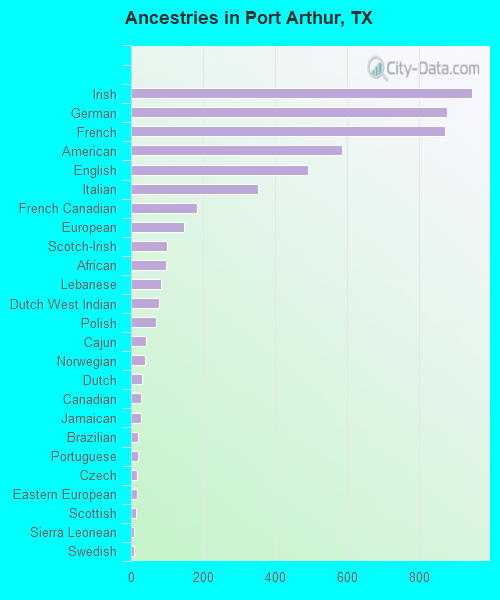
First ancestries reported:
- Irish: 946 (2.1%)
- German: 878 (2.0%)
- French: 872 (2.0%)
- American: 585 (1.3%)
- English: 492 (1.1%)
- Italian: 353 (0.8%)
- French Canadian: 183 (0.4%)
- European: 146 (0.3%)
- Scotch-Irish: 101 (0.2%)
- African: 98 (0.2%)
- Lebanese: 82 (0.2%)
- Dutch West Indian: 78 (0.2%)
- Polish: 69 (0.2%)
- Cajun: 41 (0.09%)
- Norwegian: 38 (0.09%)
- Dutch: 30 (0.07%)
- Canadian: 29 (0.07%)
- Jamaican: 27 (0.06%)
- Brazilian: 20 (0.05%)
- Portuguese: 19 (0.04%)
- Czech: 18 (0.04%)
- Eastern European: 16 (0.04%)
- Scottish: 14 (0.03%)
- Sierra Leonean: 9 (0.02%)
- Swedish: 9 (0.02%)
- British: 7 (0.02%)
- Danish: 7 (0.02%)
- Iranian: 5 (0.01%)
- Welsh: 5 (0.01%)
Most common places of birth for foreign-born residents (%):
| Port Arthur: | 53.2% (6,321) |
| Texas: | 48.4% (2,411,723) |
| Port Arthur: | 10.1% (1,202) |
| Texas: | 3.7% (184,770) |
| Port Arthur: | 8.2% (971) |
| Texas: | 0.4% (18,642) |
| Port Arthur: | 6.6% (786) |
| Texas: | 3.0% (147,182) |
| Port Arthur: | 4.8% (568) |
| Texas: | 6.1% (306,347) |
| Port Arthur: | 2.7% (323) |
| Texas: | 1.3% (62,978) |
| Port Arthur: | 2.5% (292) |
| Texas: | 1.2% (62,159) |
| Port Arthur: | 1.8% (213) |
| Texas: | 2.1% (103,148) |
| Port Arthur: | 1.8% (213) |
| Texas: | 4.5% (224,455) |
Place of birth for U.S.-born residents:
- This state: 34,711
- Other state: 8,172
- Northeast: 497
- Midwest: 1,065
- South: 5,398
- West: 1,202
90.8% of Port Arthur residents lived in the same house 1 years ago.
Out of people who lived in different houses, 40.5% lived in this county.
Out of people who lived in different counties, 81.1% lived in Texas.
| Port Arthur: | 90.8% |
| State average: | 85.7% |
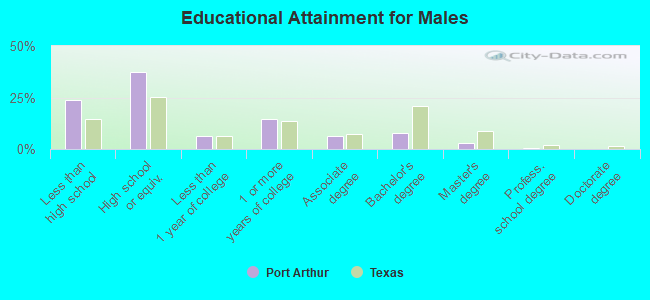
Education attainment for males 25 years and older:
- No schooling: 801
- Nursery to 4th grade: 190
- 5th and 6th grade: 507
- 7th and 8th grade: 479
- 9th grade: 666
- 10th grade: 493
- 11th grade: 385
- 12th grade, no diploma: 356
- High school graduate (or equivalency): 6,055
- Less than 1 year of college: 1,003
- Some college more than 1 year, no degree: 2,372
- Associate degree: 1,026
- Bachelor's degree: 1,266
- Master's degree: 438
- Professional school degree: 116
- Doctorate degree: 29
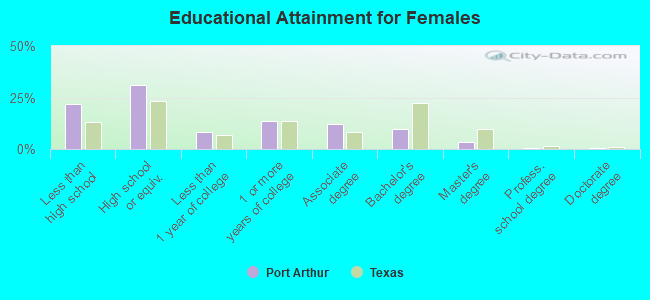
Education attainment for females 25 years and older:
- No schooling: 655
- Nursery to 4th grade: 209
- 5th and 6th grade: 333
- 7th and 8th grade: 684
- 9th grade: 182
- 10th grade: 935
- 11th grade: 428
- 12th grade, no diploma: 348
- High school graduate (or equivalency): 5,409
- Less than 1 year of college: 1,479
- Some college more than 1 year, no degree: 2,329
- Associate degree: 2,080
- Bachelor's degree: 1,684
- Master's degree: 557
- Professional school degree: 73
- Doctorate degree: 62
Housing units in structures:
- One, detached: 17,549
- One, attached: 384
- Two: 499
- 3 or 4: 1,232
- 5 to 9: 2,422
- 10 to 19: 1,860
- 20 to 49: 498
- 50 or more: 537
- Mobile homes: 305
- Boats, RVs, vans, etc.: 11
Median worth of mobile homes: $31,778
Housing units lacking complete kitchen facilities in 2022: 5.0%
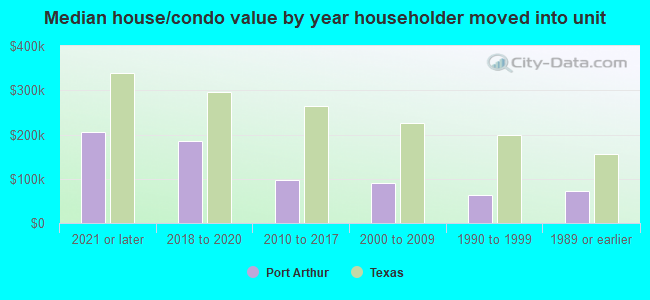
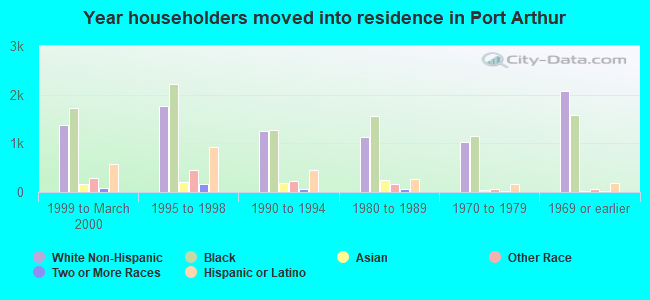
House/condo owner moved in on average 13 years ago
Renter moved in on average 3 years ago
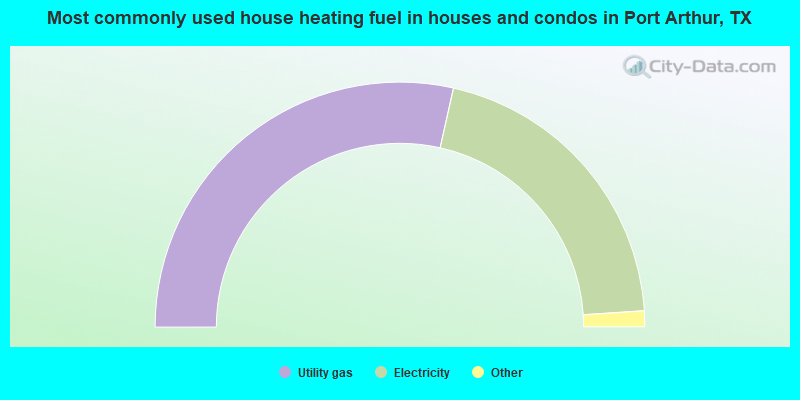
- 57.1%Utility gas
- 40.9%Electricity
- 1.1%No fuel used
- 0.8%Bottled, tank, or LP gas
- 0.2%Fuel oil, kerosene, etc.
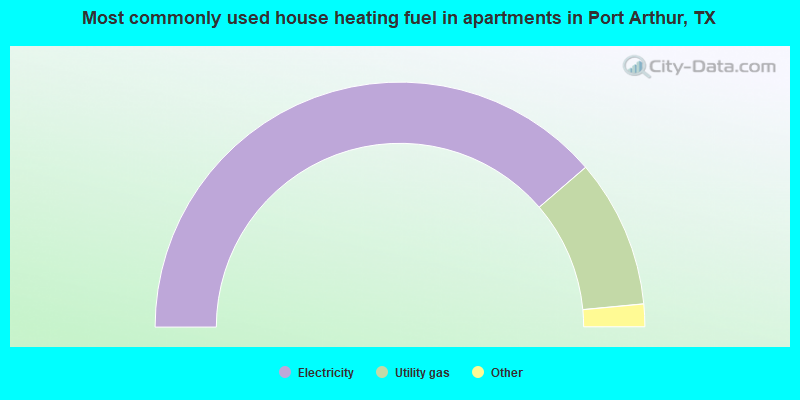
- 77.4%Electricity
- 19.6%Utility gas
- 2.1%No fuel used
- 0.4%Solar energy
- 0.4%Bottled, tank, or LP gas
- 0.1%Fuel oil, kerosene, etc.
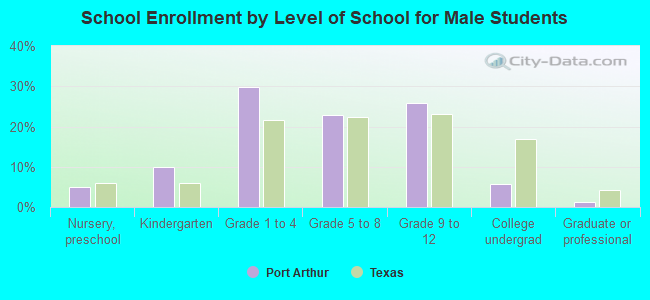
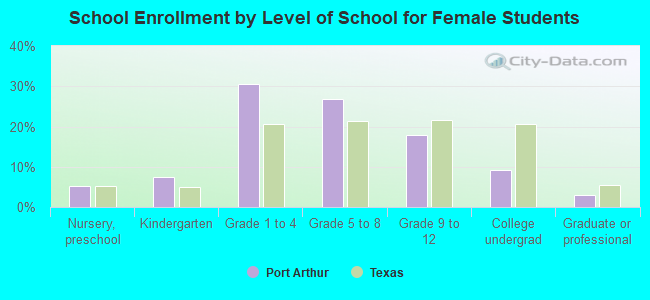
Private vs. public school enrollment:
| Here: | 3.6% |
| Texas: | 8.8% |
| Here: | 7.0% |
| Texas: | 8.0% |
| Here: | 28.8% |
| Texas: | 16.2% |