Rockledge, FL (Florida) Houses and Residents
| Rockledge: | $343,827 |
| Florida: | $354,100 |
Mean price in 2022:
Detached houses: $358,274
Here: $358,274 State: $500,941 Townhouses or other attached units: $375,800
Here: $375,800 State: $370,869 In 3-to-4-unit structures: $50,034
Here: $50,034 State: $309,944 In 5-or-more-unit structures: $143,536
Here: $143,536 State: $447,145 Mobile homes: $47,848
Here: $47,848 State: $113,202
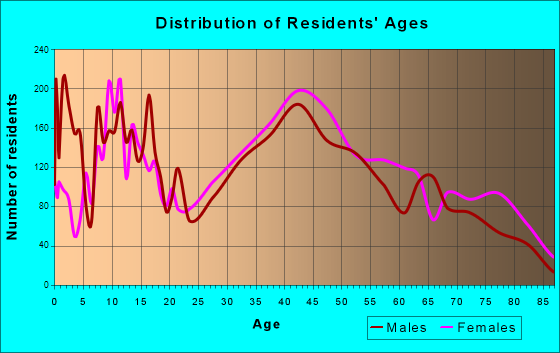
Total population: 26,071 (Urban population: 20,123, Rural population: 0)
Houses: 13,170 (11,344 occupied: 9,169 owner occupied, 2,246 renter occupied)
| % of renters here: | 20% |
| State: | 33% |
Housing density: 1,230 houses/condos per square mile
Median price asked for vacant for-sale houses and condos in 2022: $241,658.
Median contract rent in 2022: $1,460 (lower quartile is $1,122, upper quartile is $1,790)
Median rent asked for vacant for-rent units in 2022: $1,628
Median gross rent in Rockledge, FL in 2022: $1,636
Housing units in Rockledge with a mortgage: 6,013 (630 second mortgage, 0 home equity loan, 497 both second mortgage and home equity loan)
Houses without a mortgage: 180
Median household income for houses/condos with a mortgage: $95,445
Median household income for apartments without a mortgage: $82,013
Median monthly housing costs: $1,418
Compare current foreclosures near Rockledge, FL:
| Photo | Address | Area | Beds / Baths | Price | Details |
|---|---|---|---|---|---|

|
#1
White Pine Ave
Rockledge, FL 32955
|
1,401 sq. feet
|
2 baths 3 beds |
show details | |

|
#2
Sycamore Dr
Rockledge, FL 32955
|
1,396 sq. feet
|
2 baths 3 beds |
show details | |

|
#3
Sun Gazer Dr
Rockledge, FL 32955
|
1,913 sq. feet
|
2 baths 3 beds |
show details | |

|
#4
Levitt Pkwy
Rockledge, FL 32955
|
1,800 sq. feet
|
2 baths 3 beds |
show details | |

|
#5
Duskywing Dr
Rockledge, FL 32955
|
1,911 sq. feet
|
2 baths 4 beds |
show details | |

|
#6
Renee Ct
Rockledge, FL 32955
|
1,718 sq. feet
|
2 baths 3 beds |
show details | |

|
#7
Littlejohn Ln
Rockledge, FL 32955
|
1,327 sq. feet
|
1 baths 3 beds |
show details | |

|
#8
Brookcrest Cir
Rockledge, FL 32955
|
2,416 sq. feet
|
3 baths 3 beds |
show details | |

|
#9
Juniper Cir
Rockledge, FL 32955
|
1,670 sq. feet
|
2 baths 3 beds |
show details | |

|
#10
Sleepy Hollow Ln
Rockledge, FL 32955
|
1,720 sq. feet
|
2 baths 3 beds |
show details |
| Photo | Address | Area | Beds / Baths | Price | Details |
|---|---|---|---|---|---|

|
#11
Jacaranda Cir
Rockledge, FL 32955
|
2,125 sq. feet
|
2 baths 3 beds |
show details | |

|
#12
Brunswick Ln
Rockledge, FL 32955
|
1,392 sq. feet
|
2 baths 3 beds |
show details | |

|
#13
Jamestown Dr
Rockledge, FL 32955
|
1,865 sq. feet
|
2 baths 3 beds |
show details | |

|
#14
Siderwheel Dr
Rockledge, FL 32955
|
1,772 sq. feet
|
2 baths 3 beds |
show details | |

|
#15
Sarazen Dr
Rockledge, FL 32955
|
1,162 sq. feet
|
3 baths - beds |
show details | |

|
#16
Worcester Way
Rockledge, FL 32955
|
- sq. feet
|
- baths - beds |
show details | |

|
#17
Fairlawn Dr
Rockledge, FL 32955
|
- sq. feet
|
- baths - beds |
show details | |

|
#18
Barton Blvd # 403
Rockledge, FL 32955
|
- sq. feet
|
- baths - beds |
show details | |

|
#19
San Antonio Way Apt 105
Rockledge, FL 32955
|
- sq. feet
|
- baths - beds |
show details | |

|
#20
Chardonnay Dr
Rockledge, FL 32955
|
- sq. feet
|
- baths - beds |
show details |
| Photo | Address | Area | Beds / Baths | Price | Details |
|---|---|---|---|---|---|

|
#21
Plover Ln # 1-34
Rockledge, FL 32955
|
1,690 sq. feet
|
- baths - beds |
show details | |

|
#22
Bougainvillea Dr
Rockledge, FL 32955
|
- sq. feet
|
- baths - beds |
show details | |

|
#23
Rocky Wood Cir Apt 103
Rockledge, FL 32955
|
782 sq. feet
|
- baths - beds |
show details | |

|
#24
Winding Meadows Rd
Rockledge, FL 32955
|
- sq. feet
|
- baths - beds |
show details | |

|
#25
Sedge Dr
Rockledge, FL 32955
|
- sq. feet
|
- baths - beds |
show details | |

|
#26
Kensington Dr
Cocoa, FL 32922
|
1,388 sq. feet
|
3 baths 3 beds |
$300,000
|
show details |

|
#27
NE 2nd St
Satellite Beach, FL 32937
|
1,639 sq. feet
|
2 baths 3 beds |
show details | |

|
#28
Kirkland Dr
Cocoa, FL 32922
|
984 sq. feet
|
1 baths 3 beds |
show details | |

|
#29
Galleon St
Cocoa, FL 32927
|
1,635 sq. feet
|
2 baths 3 beds |
show details | |

|
#30
Song Dr
Cocoa, FL 32927
|
1,232 sq. feet
|
2 baths 3 beds |
show details |
| Photo | Address | Area | Beds / Baths | Price | Details |
|---|---|---|---|---|---|

|
#31
Belfast Ave
Cocoa, FL 32927
|
1,756 sq. feet
|
2 baths 3 beds |
show details | |

|
#32
Corto Rd
Cocoa, FL 32927
|
1,622 sq. feet
|
2 baths 3 beds |
show details | |

|
#33
Briggs Ave
Cocoa, FL 32927
|
1,438 sq. feet
|
2 baths 3 beds |
show details | |

|
#34
Banos Ave
Cocoa, FL 32927
|
1,634 sq. feet
|
2 baths 3 beds |
show details | |

|
#35
Campus Cir
Melbourne, FL 32935
|
1,368 sq. feet
|
2 baths 3 beds |
show details | |

|
#36
Fairchild Ave
Cocoa, FL 32927
|
1,500 sq. feet
|
2 baths 3 beds |
show details | |

|
#37
Slone Blvd
Melbourne, FL 32935
|
1,481 sq. feet
|
2 baths 3 beds |
show details | |

|
#38
Rena Ave
Cocoa, FL 32927
|
1,252 sq. feet
|
2 baths 3 beds |
show details | |

|
#39
Logan Ave
Cocoa, FL 32927
|
2,036 sq. feet
|
3 baths 5 beds |
show details | |

|
#40
Adobe Ave
Cocoa, FL 32927
|
1,385 sq. feet
|
2 baths 3 beds |
show details |
| Photo | Address | Area | Beds / Baths | Price | Details |
|---|---|---|---|---|---|

|
#41
Greenville St
Cocoa, FL 32926
|
1,229 sq. feet
|
2 baths 3 beds |
show details | |

|
#42
Hickory Creek Rd
Melbourne, FL 32935
|
1,721 sq. feet
|
2 baths 3 beds |
show details | |

|
#43
Seattle St
Cocoa, FL 32927
|
1,183 sq. feet
|
2 baths 3 beds |
show details | |

|
#44
N Tropical Trl
Merritt Island, FL 32953
|
2,771 sq. feet
|
3 baths 4 beds |
show details | |

|
#45
Fan Palm Ave
Cocoa, FL 32927
|
2,290 sq. feet
|
3 baths 3 beds |
show details | |

|
#46
Ocean Garden Ln
Cape Canaveral, FL 32920
|
1,525 sq. feet
|
3 baths 3 beds |
show details | |

|
#47
Kings Way
Merritt Island, FL 32953
|
1,524 sq. feet
|
2 baths 3 beds |
show details | |

|
#48
Tangerine St
Cocoa, FL 32926
|
1,632 sq. feet
|
2 baths 3 beds |
show details | |

|
#49
Nicklaus Cir
Cocoa, FL 32927
|
1,512 sq. feet
|
2 baths 3 beds |
show details | |

|
Check over 1 million property listings on Foreclosure.com!
|
browse all offers | |||

Latest news about housing in Rockledge, FL collected exclusively by city-data.com from local newspapers, TV, and radio stations


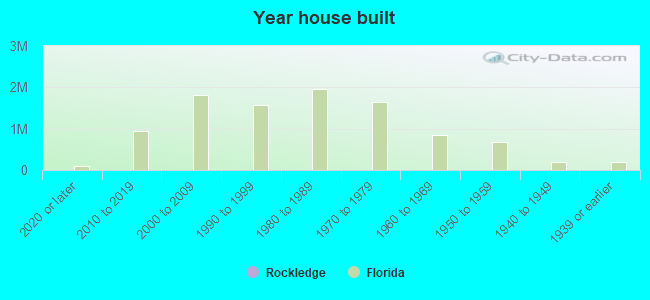
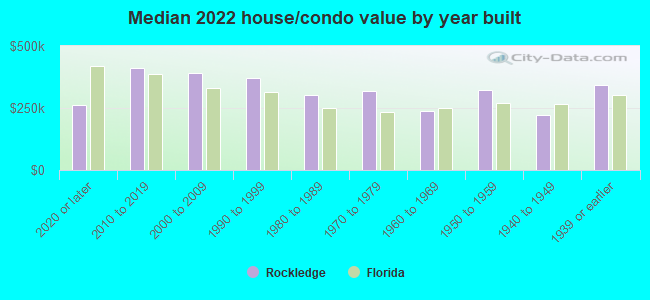
Median year apartment built: 1993
Household type by relationship:
Households: 28,717- Male householders: 5,577 (1,173 living alone), Female householders: 5,793 (1,848 living alone)
5,728 spouses (5,626 opposite-sex spouses), 832 unmarried partners, (754 opposite-sex unmarried partners), 7,983 children (7,231 natural, 142 adopted, 609 stepchildren), 497 grandchildren, 241 brothers or sisters, 735 parents, 30 foster children, 317 other relatives, 611 non-relatives
- In group quarters: 367
Size of family households: 3,834 2-persons, 1,764 3-persons, 1,372 4-persons, 584 5-persons, 92 6-persons, 32 7-or-more-persons.
Size of nonfamily households: 2,963 1-person, 749 2-persons.
2,901 married couples with children.
1,445 single-parent households (396 men, 1,049 women).
90.4% of residents of Rockledge speak English at home.
5.3% of residents speak Spanish at home (82% speak English very well, 15% speak English well, 2% speak English not well).
2.7% of residents speak other Indo-European language at home (80% speak English very well, 19% speak English well, 2% speak English not well).
0.8% of residents speak Asian or Pacific Island language at home (64% speak English very well, 17% speak English well, 19% speak English not well).
0.2% of residents speak other language at home (28% speak English very well, 32% speak English well, 40% speak English not well).
Foreign born population: 1,927 (6.7%)
(73.4% of them are naturalized citizens)
| Here: | 6.2 |
| State: | 5.9 |
| Here: | 5.0 |
| State: | 4.2 |
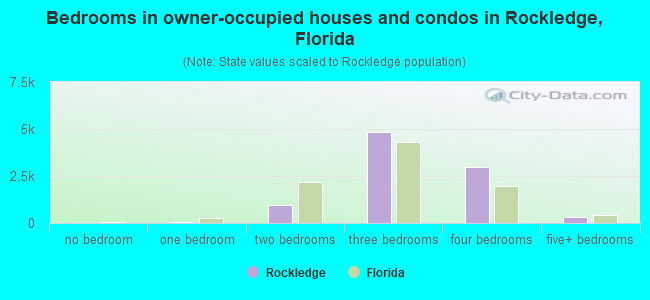
- Bedrooms in owner-occupied houses and condos in Rockledge, Florida
- 23no bedroom
- 581 bedroom
- 9522 bedrooms
- 4,8443 bedrooms
- 2,9954 bedrooms
- 2985+ bedrooms
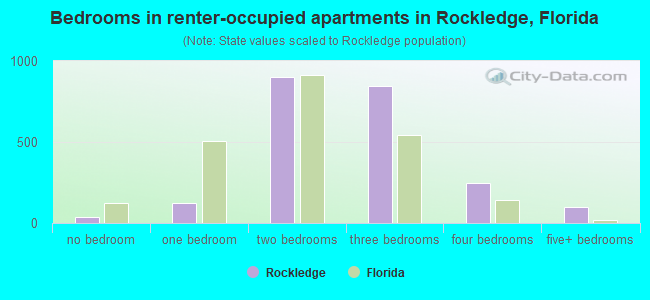
- Bedrooms in renter-occupied apartments in Rockledge, Florida
- 34no bedroom
- 1221 bedroom
- 9012 bedrooms
- 8483 bedrooms
- 2454 bedrooms
- 965+ bedrooms
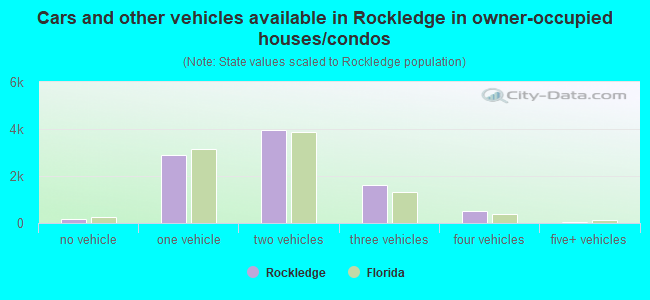
- Cars and other vehicles available in Rockledge in owner-occupied houses/condos
- 158no vehicle
- 2,9021 vehicle
- 3,9722 vehicles
- 1,6003 vehicles
- 5014 vehicles
- 375+ vehicles
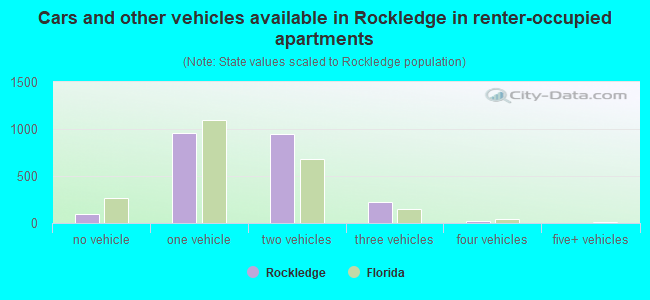
- Cars and other vehicles available in Rockledge in renter-occupied apartments
- 92no vehicle
- 9601 vehicle
- 9492 vehicles
- 2273 vehicles
- 194 vehicles
- 05+ vehicles
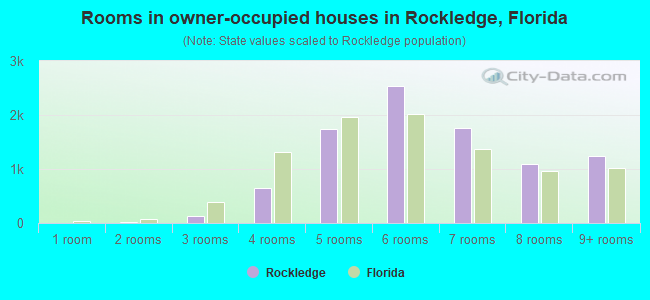
- Rooms in owner-occupied houses in Rockledge, Florida
- 01 room
- 202 rooms
- 1223 rooms
- 6504 rooms
- 1,7375 rooms
- 2,5286 rooms
- 1,7657 rooms
- 1,0988 rooms
- 1,2509+ rooms
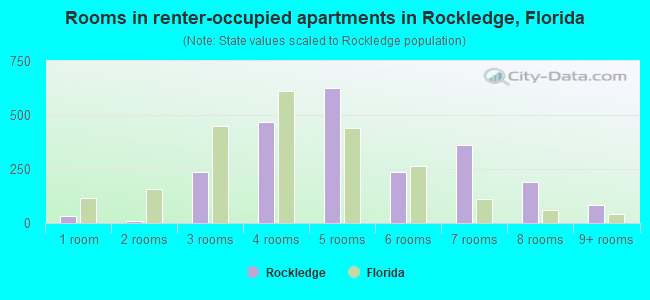
- Rooms in renter-occupied apartments in Rockledge, Florida
- 341 room
- 102 rooms
- 2383 rooms
- 4664 rooms
- 6275 rooms
- 2376 rooms
- 3617 rooms
- 1898 rooms
- 849+ rooms
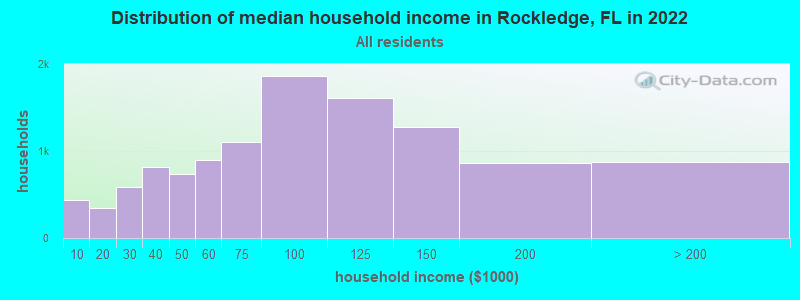
Rockledge, FL household income distribution

- 441Less than $10,000
- 346$10,000 to $19,999
- 588$20,000 to $29,999
- 812$30,000 to $39,999
- 731$40,000 to $49,999
- 902$50,000 to $59,999
- 1,106$60,000 to $74,999
- 1,865$75,000 to $99,999
- 1,613$100,000 to $124,999
- 1,281$125,000 to $149,999
- 865$150,000 to $199,999
- 873$200,000 or more
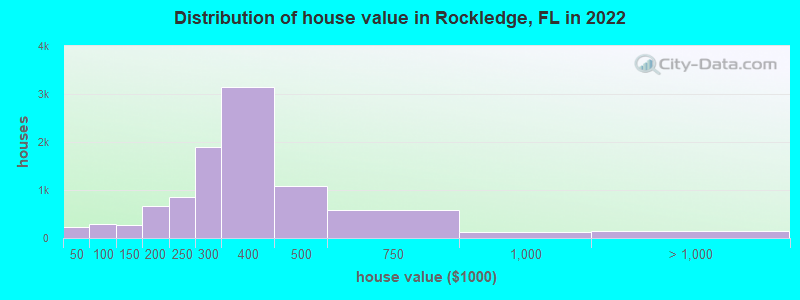
Home value of owner - occupied houses in 2022 in Rockledge, FL
-
- 51Less than $10,000
- 40$25,000 to $29,999
- 26$30,000 to $34,999
- 76$35,000 to $39,999
- 39$40,000 to $49,999
- 4$50,000 to $59,999
- 40$60,000 to $69,999
- 57$70,000 to $79,999
- 49$80,000 to $89,999
- 94$90,000 to $99,999
- 136$100,000 to $124,999
- 126$125,000 to $149,999
- 331$150,000 to $174,999
- 336$175,000 to $199,999
- 858$200,000 to $249,999
- 1,891$250,000 to $299,999
- 3,141$300,000 to $399,999
- 1,090$400,000 to $499,999
- 582$500,000 to $749,999
- 126$750,000 to $999,999
- 111$1,000,000 to $1,499,999
- 18$1,500,000 to $1,999,999
- 11$2,000,000 or more
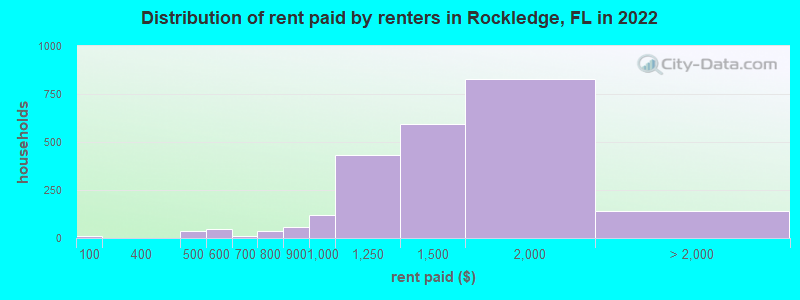
Rent paid by renters in 2022 in Rockledge, FL
-
- 13Less than $100
- 35$450 to $499
- 44$500 to $549
- 7$600 to $649
- 33$700 to $749
- 54$800 to $899
- 120$900 to $999
- 433$1,000 to $1,249
- 596$1,250 to $1,499
- 829$1,500 to $1,999
- 55$2,000 to $2,499
- 6$2,500 to $2,999
- 77No cash rent
Percentage of workers working in this county: 93.6%
Number of people working at home: 2,319 (15.5% of all workers)
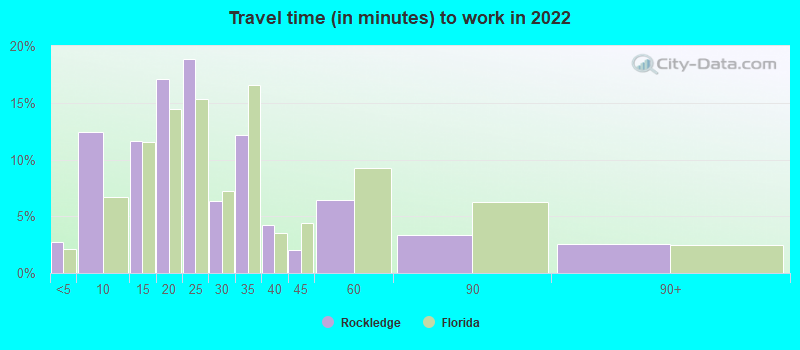
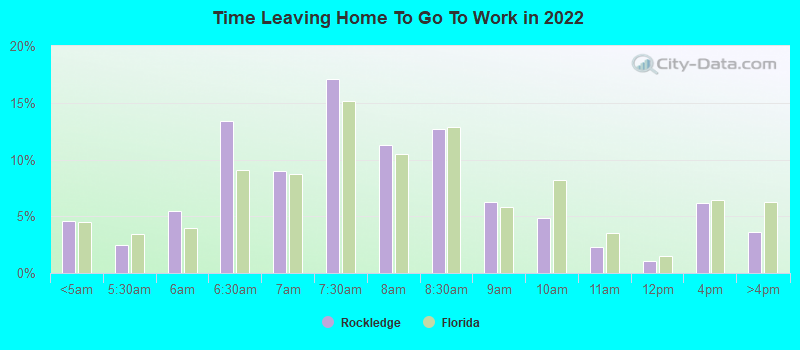
Travel time to work (commute)
- Less than 5 minutes: 394
- 5 to 9 minutes: 1,268
- 10 to 14 minutes: 1,435
- 15 to 19 minutes: 1,667
- 20 to 24 minutes: 1,946
- 25 to 29 minutes: 1,307
- 30 to 34 minutes: 2,153
- 35 to 39 minutes: 571
- 40 to 44 minutes: 386
- 45 to 59 minutes: 750
- 60 to 89 minutes: 350
- 90 or more minutes: 342
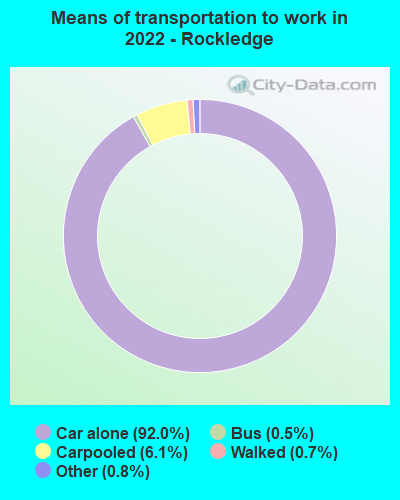
Means of transportation to work:
- Drove a car alone: 9,464 (74.4%)
- Carpooled: 643 (5.1%)
- Bus: 82 (0.6%)
- Taxi: 114 (0.9%)
- Walked: 80 (0.6%)
- Worked at home: 2,319 (18.2%)
- Unemployment by race in 2022
- Unemployment rate for White non-Hispanic residents
- 3.3%Males
- 2.6%Females
- Unemployment rate for Black residents
- 1.5%Males
- 7.2%Females
- Unemployment rate for Asian residents
- 8.1%Males
- 5.2%Females
- Unemployment rate for two or more race residents
- 6.4%Males
- 2.2%Females
- Unemployment rate for Hispanic or Latino residents
- 1.4%Males
- 4.7%Females
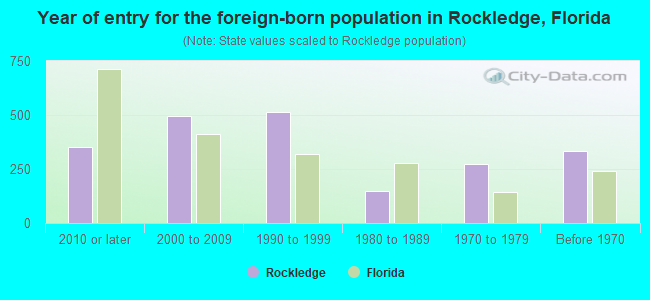
- Year of entry for the foreign-born population in Rockledge, Florida
- 3502010 or later
- 4942000 to 2009
- 5131990 to 1999
- 1461980 to 1989
- 2751970 to 1979
- 335Before 1970
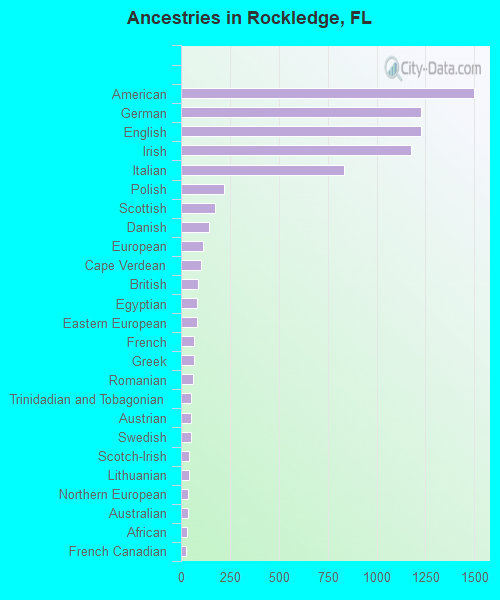
First ancestries reported:
- American: 1,500 (12.5%)
- German: 1,228 (10.2%)
- English: 1,225 (10.2%)
- Irish: 1,174 (9.8%)
- Italian: 832 (6.9%)
- Polish: 218 (1.8%)
- Scottish: 173 (1.4%)
- Danish: 145 (1.2%)
- European: 115 (1.0%)
- Cape Verdean: 102 (0.9%)
- British: 86 (0.7%)
- Egyptian: 84 (0.7%)
- Eastern European: 81 (0.7%)
- French: 69 (0.6%)
- Greek: 68 (0.6%)
- Romanian: 60 (0.5%)
- Trinidadian and Tobagonian: 52 (0.4%)
- Austrian: 51 (0.4%)
- Swedish: 51 (0.4%)
- Scotch-Irish: 43 (0.4%)
- Lithuanian: 39 (0.3%)
- Northern European: 38 (0.3%)
- Australian: 35 (0.3%)
- African: 29 (0.2%)
- French Canadian: 28 (0.2%)
- Dutch: 28 (0.2%)
- Russian: 27 (0.2%)
- Portuguese: 26 (0.2%)
- Slavic: 24 (0.2%)
- Croatian: 20 (0.2%)
- Scandinavian: 18 (0.2%)
- Finnish: 16 (0.1%)
- Turkish: 13 (0.1%)
- Iranian: 13 (0.1%)
- Ukrainian: 10 (0.08%)
- Norwegian: 9 (0.08%)
- West Indian: 6 (0.05%)
- Icelander: 3 (0.03%)
- Albanian: 2 (0.02%)
Most common places of birth for foreign-born residents (%):
| Rockledge: | 10.5% (190) |
| Florida: | 2.1% (94,349) |
| Rockledge: | 9.1% (164) |
| Florida: | 2.4% (109,132) |
| Rockledge: | 8.8% (159) |
| Florida: | 6.5% (298,669) |
| Rockledge: | 5.8% (106) |
| Florida: | 0.1% (2,578) |
| Rockledge: | 5.3% (96) |
| Florida: | 5.6% (257,152) |
| Rockledge: | 5.2% (94) |
| Florida: | 1.2% (54,272) |
| Rockledge: | 4.4% (80) |
| Florida: | 0.3% (13,998) |
| Rockledge: | 3.2% (58) |
| Florida: | 0.3% (14,943) |
| Rockledge: | 3.1% (56) |
| Florida: | 2.3% (105,066) |
| Rockledge: | 2.8% (51) |
| Florida: | 0.8% (37,723) |
| Rockledge: | 2.4% (43) |
| Florida: | 0.1% (5,190) |
| Rockledge: | 2.0% (36) |
| Florida: | 1.8% (84,403) |
| Rockledge: | 1.9% (35) |
| Florida: | 0.5% (22,972) |
| Rockledge: | 1.8% (33) |
| Florida: | 1.0% (43,642) |
| Rockledge: | 1.8% (33) |
| Florida: | 1.3% (57,263) |
| Rockledge: | 1.7% (31) |
| Florida: | 5.7% (262,042) |
| Rockledge: | 1.7% (30) |
| Florida: | 1.2% (56,071) |
| Rockledge: | 1.5% (28) |
| Florida: | 1.3% (60,604) |
| Rockledge: | 1.5% (28) |
| Florida: | 0.2% (10,969) |
Place of birth for U.S.-born residents:
- This state: 10,796
- Other state: 14,892
- Northeast: 5,718
- Midwest: 3,201
- South: 4,061
- West: 1,895
89.2% of Rockledge residents lived in the same house 1 years ago.
Out of people who lived in different houses, 37.2% lived in this county.
Out of people who lived in different counties, 49.6% lived in Florida.
| Rockledge: | 89.2% |
| State average: | 86.3% |
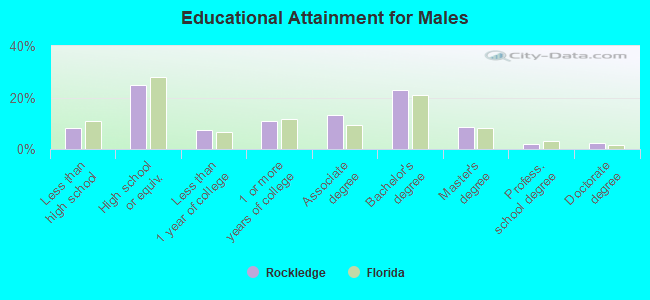
Education attainment for males 25 years and older:
- No schooling: 142
- Nursery to 4th grade: 16
- 5th and 6th grade: 15
- 7th and 8th grade: 160
- 9th grade: 154
- 10th grade: 110
- 11th grade: 155
- 12th grade, no diploma: 83
- High school graduate (or equivalency): 2,520
- Less than 1 year of college: 746
- Some college more than 1 year, no degree: 1,110
- Associate degree: 1,340
- Bachelor's degree: 2,330
- Master's degree: 860
- Professional school degree: 207
- Doctorate degree: 233
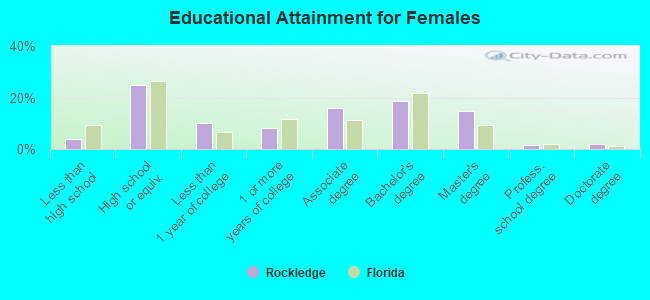
Education attainment for females 25 years and older:
- No schooling: 19
- Nursery to 4th grade: 53
- 5th and 6th grade: 17
- 7th and 8th grade: 23
- 9th grade: 5
- 10th grade: 94
- 11th grade: 45
- 12th grade, no diploma: 189
- High school graduate (or equivalency): 2,794
- Less than 1 year of college: 1,121
- Some college more than 1 year, no degree: 896
- Associate degree: 1,795
- Bachelor's degree: 2,074
- Master's degree: 1,672
- Professional school degree: 193
- Doctorate degree: 220
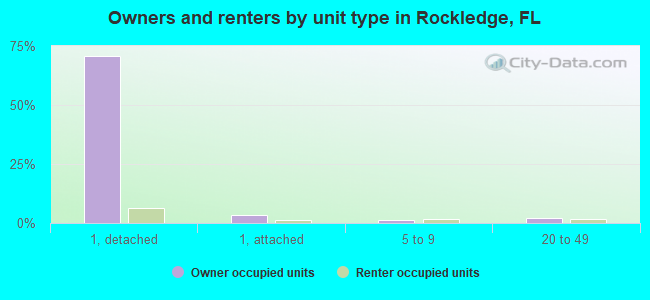
Housing units in structures:
- One, detached: 9,715
- One, attached: 601
- Two: 276
- 3 or 4: 242
- 5 to 9: 703
- 10 to 19: 591
- 20 to 49: 498
- 50 or more: 282
- Mobile homes: 258
Median worth of mobile homes: $56,289
Housing units lacking complete kitchen facilities in 2022: 0.2%
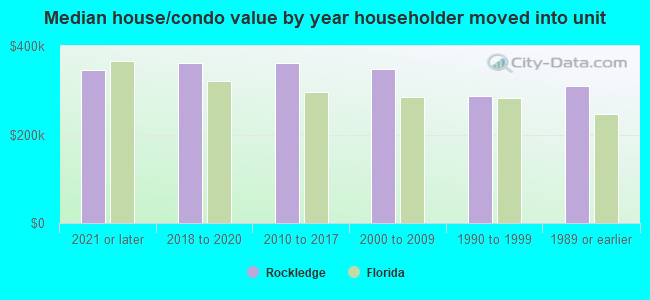
House/condo owner moved in on average 12 years ago
Renter moved in on average 2 years ago
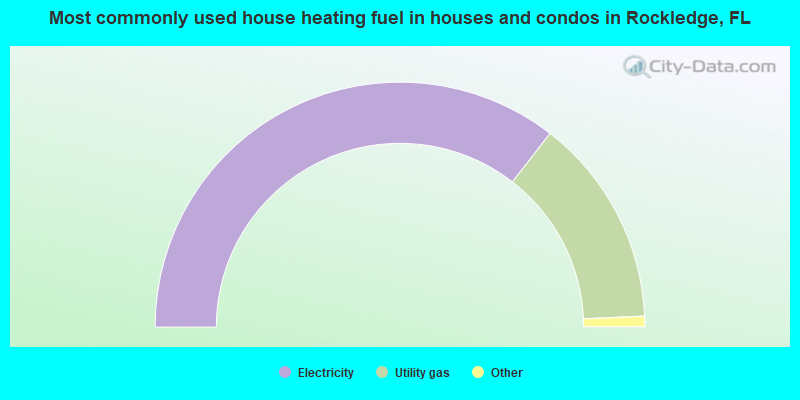
- 71.0%Electricity
- 27.6%Utility gas
- 0.7%Bottled, tank, or LP gas
- 0.3%Wood
- 0.2%Fuel oil, kerosene, etc.
- 0.2%No fuel used
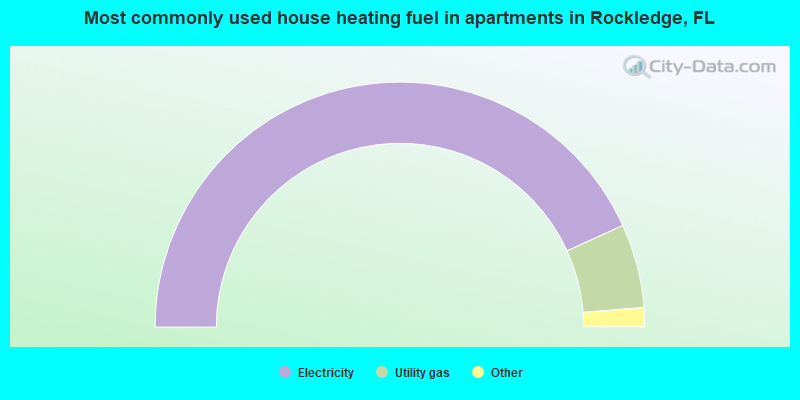
- 86.4%Electricity
- 11.1%Utility gas
- 1.6%No fuel used
- 0.6%Bottled, tank, or LP gas
- 0.3%Fuel oil, kerosene, etc.
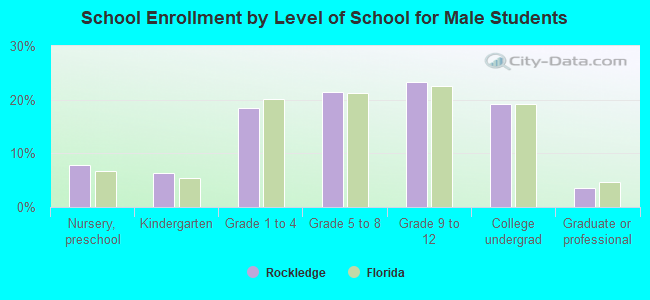
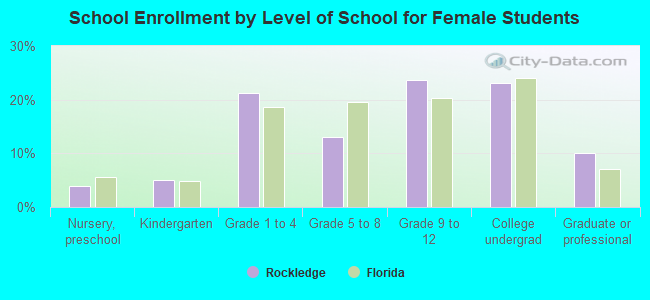
Private vs. public school enrollment:
| Here: | 27.2% |
| Florida: | 15.8% |
| Here: | 0.7% |
| Florida: | 12.9% |
| Here: | 17.5% |
| Florida: | 23.6% |