Safety Harbor, FL (Florida) Houses and Residents
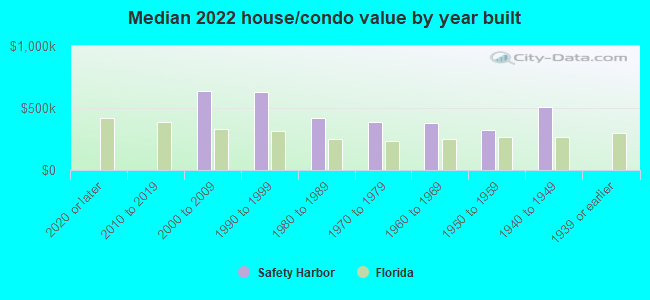
| Safety Harbor: | $466,095 |
| Florida: | $354,100 |
Mean price in 2022:
Detached houses: $523,589
Here: $523,589 State: $500,941 Townhouses or other attached units: $277,988
Here: $277,988 State: $370,869 In 2-unit structures: $229,666
Here: $229,666 State: $423,188 In 3-to-4-unit structures: $197,773
Here: $197,773 State: $309,944 In 5-or-more-unit structures: $342,056
Here: $342,056 State: $447,145 Mobile homes: $107,297
Here: $107,297 State: $113,202
Total population: 17,234 (Urban population: 17,090, Rural population: 0)
Houses: 7,570 (6,836 occupied: 5,662 owner occupied, 1,232 renter occupied)
| % of renters here: | 18% |
| State: | 33% |
Housing density: 1,539 houses/condos per square mile
Median price asked for vacant for-sale houses and condos in 2022: $2,439,223.
Median contract rent in 2022: $1,497 (lower quartile is $1,179, upper quartile is over $2,000)
Median rent asked for vacant for-rent units in 2022: $2,522
Median gross rent in Safety Harbor, FL in 2022: $1,782
Housing units in Safety Harbor with a mortgage: 3,374 (279 second mortgage, 66 home equity loan, 173 both second mortgage and home equity loan)
Houses without a mortgage: 140
Median household income for houses/condos with a mortgage: $125,852
Median household income for apartments without a mortgage: $92,086
Median monthly housing costs: $1,512
Compare current foreclosures near Safety Harbor, FL:
| Photo | Address | Area | Beds / Baths | Price | Details |
|---|---|---|---|---|---|

|
#1
Harbor Hill Dr
Safety Harbor, FL 34695
|
1,227 sq. feet
|
1 baths 2 beds |
show details | |

|
#2
Clubview Dr
Safety Harbor, FL 34695
|
1,248 sq. feet
|
2 baths - beds |
show details | |

|
#3
Vinewood Dr
Safety Harbor, FL 34695
|
1,344 sq. feet
|
2 baths - beds |
show details | |

|
#4
Hampton Ln W
Safety Harbor, FL 34695
|
3,702 sq. feet
|
4 baths - beds |
show details | |

|
#5
Clubview Dr
Safety Harbor, FL 34695
|
1,056 sq. feet
|
2 baths - beds |
show details | |

|
#6
Bow Ln
Safety Harbor, FL 34695
|
4,664 sq. feet
|
5 baths - beds |
show details | |

|
#7
Philippe Pkwy, Apt 168
Safety Harbor, FL 34695
|
- sq. feet
|
- baths - beds |
show details | |

|
#8
State Road 580, Lot 212
Safety Harbor, FL 34695
|
- sq. feet
|
- baths - beds |
show details | |

|
#9
Oakridge Dr
Palm Harbor, FL 34685
|
2,344 sq. feet
|
3 baths 4 beds |
$710,000
|
show details |

|
#10
83rd Ave N Apt 120
Saint Petersburg, FL 33702
|
1,000 sq. feet
|
2 baths 2 beds |
$152,000
|
show details |
| Photo | Address | Area | Beds / Baths | Price | Details |
|---|---|---|---|---|---|

|
#11
Kibler Ln
Holiday, FL 34691
|
1,457 sq. feet
|
1 baths 2 beds |
$160,000
|
show details |

|
#12
Grayton Dr
New Port Richey, FL 34652
|
1,200 sq. feet
|
2 baths 2 beds |
show details | |

|
#13
Ulmerton Rd Apt 4e
Largo, FL 33771
|
1,260 sq. feet
|
3 baths 3 beds |
show details | |

|
#14
34th Ave N
Saint Petersburg, FL 33710
|
1,517 sq. feet
|
2 baths 3 beds |
show details | |

|
#15
Hickory Gate Dr W
Dunedin, FL 34698
|
3,348 sq. feet
|
4 baths 4 beds |
show details | |

|
#16
Orange Sunset Dr Unit 201
Tampa, FL 33618
|
644 sq. feet
|
1 baths 1 beds |
show details | |

|
#17
N Oregon Ave
Tampa, FL 33604
|
1,421 sq. feet
|
1 baths 2 beds |
show details | |

|
#18
Spring St
Largo, FL 33774
|
6,672 sq. feet
|
5 baths 6 beds |
show details | |

|
#19
Starkey Rd Apt 2405
Largo, FL 33771
|
1,562 sq. feet
|
3 baths 3 beds |
show details | |

|
#20
Sand Key Estates Ct
Clearwater Beach, FL 33767
|
2,114 sq. feet
|
3 baths 3 beds |
show details |
| Photo | Address | Area | Beds / Baths | Price | Details |
|---|---|---|---|---|---|

|
#21
Ulmerton Rd Apt 13e
Largo, FL 33771
|
- sq. feet
|
2 baths 2 beds |
show details | |

|
#22
57th Ave N
Saint Petersburg, FL 33714
|
984 sq. feet
|
2 baths 3 beds |
show details | |

|
#23
N Gunlock Ave
Tampa, FL 33614
|
1,326 sq. feet
|
2 baths 3 beds |
show details | |

|
#24
Hemingway Cir
Tampa, FL 33602
|
2,537 sq. feet
|
2 baths 3 beds |
show details | |

|
#25
W Nassau St
Tampa, FL 33607
|
1,066 sq. feet
|
1 baths 2 beds |
show details | |

|
#26
94th St
Seminole, FL 33777
|
1,380 sq. feet
|
2 baths 3 beds |
show details | |

|
#27
N Cortez Ave
Tampa, FL 33614
|
962 sq. feet
|
1 baths 2 beds |
show details | |

|
#28
Oldgate Pl
Tampa, FL 33624
|
2,138 sq. feet
|
2 baths 3 beds |
show details | |

|
#29
Winners Cir
Odessa, FL 33556
|
3,662 sq. feet
|
3 baths 5 beds |
show details | |

|
#30
Madison St
New Port Richey, FL 34652
|
1,375 sq. feet
|
2 baths 3 beds |
show details |
| Photo | Address | Area | Beds / Baths | Price | Details |
|---|---|---|---|---|---|

|
#31
43rd Ave N
Saint Petersburg, FL 33709
|
785 sq. feet
|
1 baths 2 beds |
show details | |

|
#32
Swenson Ter
Lutz, FL 33549
|
1,816 sq. feet
|
2 baths 3 beds |
show details | |

|
#33
E Giddens Ave
Tampa, FL 33610
|
1,210 sq. feet
|
2 baths 2 beds |
show details | |

|
#34
N 20th St
Lutz, FL 33549
|
1,678 sq. feet
|
2 baths 3 beds |
show details | |

|
#35
N Manhattan Ave Apt 2121
Tampa, FL 33614
|
1,363 sq. feet
|
2 baths 4 beds |
show details | |

|
#36
Alton Rd
Tampa, FL 33615
|
1,306 sq. feet
|
2 baths 2 beds |
show details | |

|
#37
Larmon St
Tampa, FL 33634
|
1,163 sq. feet
|
1 baths 2 beds |
show details | |

|
#38
W Chestnut St
Tampa, FL 33607
|
1,250 sq. feet
|
1 baths 2 beds |
show details | |

|
#39
W Abdella St
Tampa, FL 33607
|
984 sq. feet
|
1 baths 2 beds |
show details | |

|
#40
Kepner Dr
Holiday, FL 34691
|
1,296 sq. feet
|
2 baths 1 beds |
show details |
| Photo | Address | Area | Beds / Baths | Price | Details |
|---|---|---|---|---|---|

|
#41
Fountain Ave
Tampa, FL 33634
|
1,159 sq. feet
|
2 baths 3 beds |
show details | |

|
#42
E Course Dr
Tampa, FL 33624
|
2,555 sq. feet
|
2 baths 4 beds |
show details | |

|
#43
Delaware Ave
New Port Richey, FL 34653
|
1,608 sq. feet
|
3 baths 2 beds |
show details | |

|
#44
Stoneybrook Ln
Tampa, FL 33618
|
3,654 sq. feet
|
3 baths 4 beds |
show details | |

|
#45
N Arrawana Ave
Tampa, FL 33614
|
1,362 sq. feet
|
2 baths 2 beds |
show details | |

|
#46
Swenson Ter
Lutz, FL 33549
|
1,816 sq. feet
|
2 baths 3 beds |
show details | |

|
#47
W Mcelroy Ave # F205
Tampa, FL 33611
|
1,020 sq. feet
|
2 baths 2 beds |
show details | |

|
#48
White Elk Loop
Tampa, FL 33626
|
1,857 sq. feet
|
2 baths 3 beds |
show details | |

|
#49
Hanley Rd
Tampa, FL 33634
|
1,359 sq. feet
|
2 baths 3 beds |
show details | |

|
Check over 1 million property listings on Foreclosure.com!
|
browse all offers | |||


 | Rental Homes Safety Harbor (2 replies) |
| Los Prados condos and Enclave apartments (0 replies) |
| Areas with Newer Homes in Safety Harbor (0 replies) |
| Thinking about a house in Safety Harbor. (7 replies) |
| Safety Harbor vs. East Lake vs. Palm Harbor (27 replies) |
| Apartment and House rentals (0 replies) |
Median year apartment built: 1984
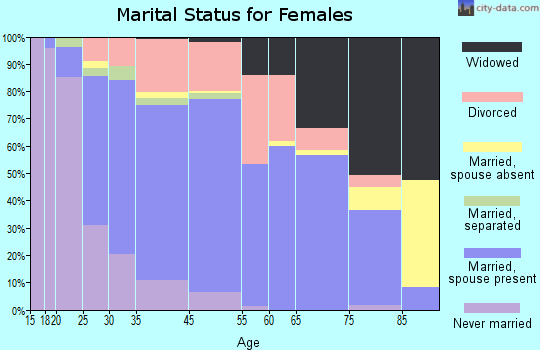
Household type by relationship:
Households: 17,119- Male householders: 3,064 (663 living alone), Female householders: 3,737 (1,207 living alone)
3,553 spouses (3,482 opposite-sex spouses), 446 unmarried partners, (309 opposite-sex unmarried partners), 4,542 children (4,146 natural, 130 adopted, 265 stepchildren), 403 grandchildren, 285 brothers or sisters, 282 parents, 0 foster children, 167 other relatives, 398 non-relatives
- In group quarters: 236
Size of family households: 2,338 2-persons, 928 3-persons, 727 4-persons, 255 5-persons, 123 6-persons.
Size of nonfamily households: 2,026 1-person, 298 2-persons, 41 3-persons.
2,172 married couples with children.
911 single-parent households (313 men, 598 women).
91.8% of residents of Safety Harbor speak English at home.
4.4% of residents speak Spanish at home (56% speak English very well, 25% speak English well, 18% speak English not well).
2.2% of residents speak other Indo-European language at home (100% speak English very well).
0.8% of residents speak Asian or Pacific Island language at home (62% speak English very well, 26% speak English well, 12% speak English not well).
0.4% of residents speak other language at home (70% speak English very well, 30% speak English well).
Foreign born population: 1,578 (9.2%)
(57.0% of them are naturalized citizens)
| Here: | 6.2 |
| State: | 5.9 |
| Here: | 4.6 |
| State: | 4.2 |
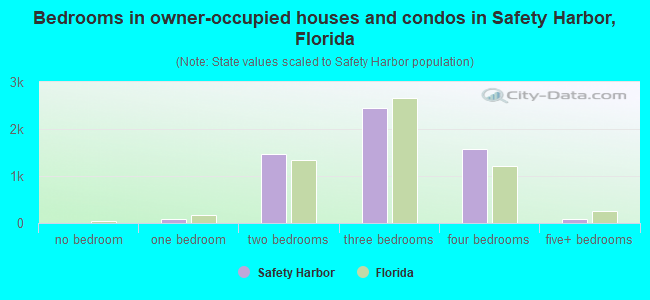
- Bedrooms in owner-occupied houses and condos in Safety Harbor, Florida
- 0no bedroom
- 771 bedroom
- 1,4602 bedrooms
- 2,4543 bedrooms
- 1,5754 bedrooms
- 955+ bedrooms
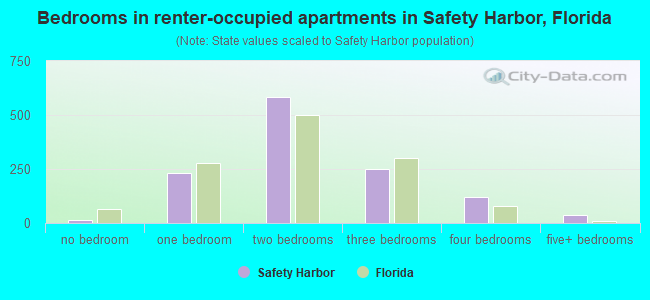
- Bedrooms in renter-occupied apartments in Safety Harbor, Florida
- 15no bedroom
- 2311 bedroom
- 5852 bedrooms
- 2483 bedrooms
- 1194 bedrooms
- 365+ bedrooms
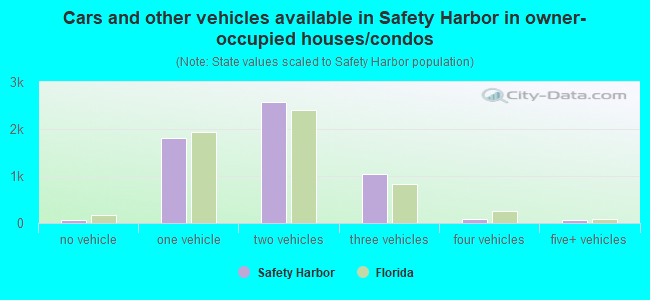
- Cars and other vehicles available in Safety Harbor in owner-occupied houses/condos
- 70no vehicle
- 1,8181 vehicle
- 2,5842 vehicles
- 1,0363 vehicles
- 934 vehicles
- 615+ vehicles
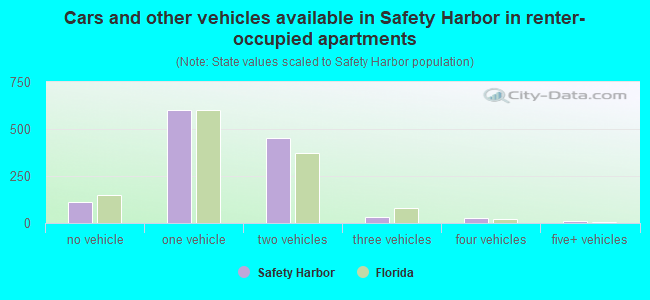
- Cars and other vehicles available in Safety Harbor in renter-occupied apartments
- 114no vehicle
- 5991 vehicle
- 4512 vehicles
- 343 vehicles
- 264 vehicles
- 95+ vehicles
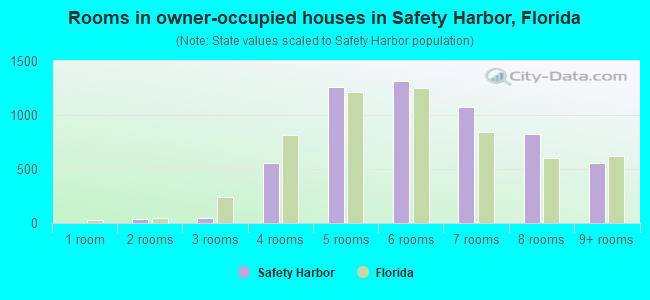
- Rooms in owner-occupied houses in Safety Harbor, Florida
- 01 room
- 352 rooms
- 503 rooms
- 5524 rooms
- 1,2615 rooms
- 1,3126 rooms
- 1,0707 rooms
- 8288 rooms
- 5549+ rooms
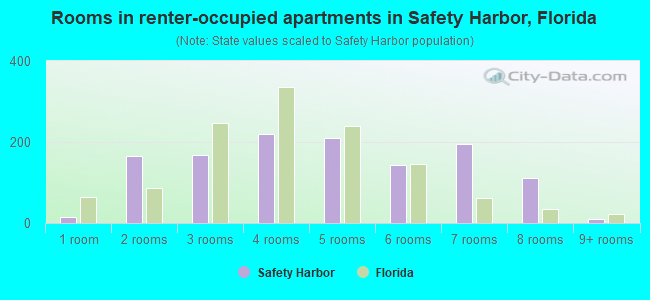
- Rooms in renter-occupied apartments in Safety Harbor, Florida
- 151 room
- 1652 rooms
- 1673 rooms
- 2194 rooms
- 2105 rooms
- 1426 rooms
- 1967 rooms
- 1108 rooms
- 99+ rooms
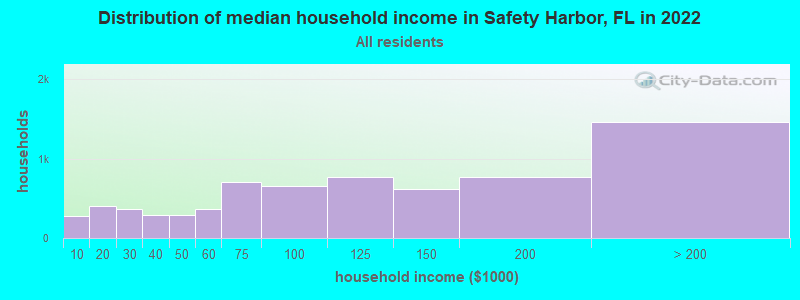
Safety Harbor, FL household income distribution

- 282Less than $10,000
- 409$10,000 to $19,999
- 361$20,000 to $29,999
- 294$30,000 to $39,999
- 290$40,000 to $49,999
- 364$50,000 to $59,999
- 709$60,000 to $74,999
- 658$75,000 to $99,999
- 766$100,000 to $124,999
- 619$125,000 to $149,999
- 767$150,000 to $199,999
- 1,461$200,000 or more
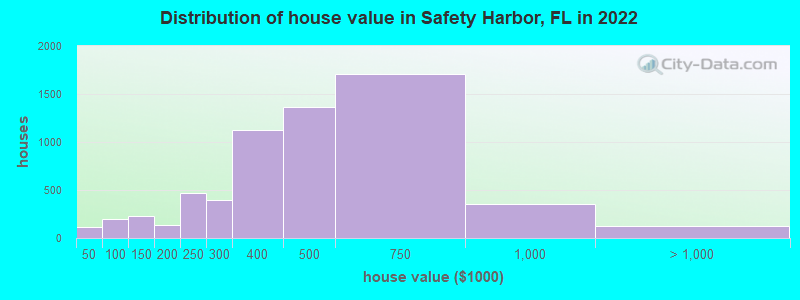
Home value of owner - occupied houses in 2022 in Safety Harbor, FL
-
- 8$10,000 to $14,999
- 7$15,000 to $19,999
- 7$20,000 to $24,999
- 46$30,000 to $34,999
- 7$35,000 to $39,999
- 34$40,000 to $49,999
- 61$50,000 to $59,999
- 33$60,000 to $69,999
- 23$80,000 to $89,999
- 46$90,000 to $99,999
- 100$100,000 to $124,999
- 133$125,000 to $149,999
- 90$150,000 to $174,999
- 42$175,000 to $199,999
- 464$200,000 to $249,999
- 393$250,000 to $299,999
- 1,124$300,000 to $399,999
- 1,361$400,000 to $499,999
- 1,709$500,000 to $749,999
- 355$750,000 to $999,999
- 85$1,000,000 to $1,499,999
- 17$1,500,000 to $1,999,999
- 17$2,000,000 or more
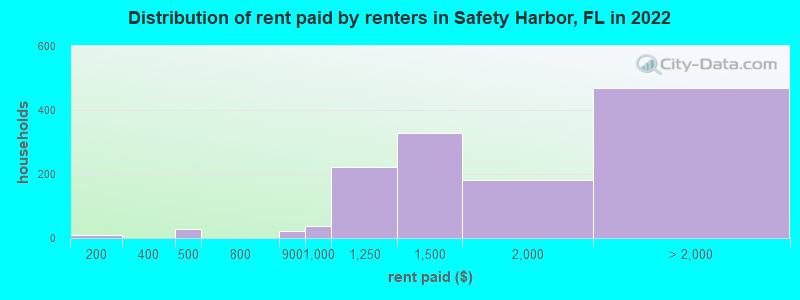
Rent paid by renters in 2022 in Safety Harbor, FL
-
- 9$150 to $199
- 29$450 to $499
- 22$800 to $899
- 38$900 to $999
- 221$1,000 to $1,249
- 327$1,250 to $1,499
- 181$1,500 to $1,999
- 157$2,000 to $2,499
- 145$2,500 to $2,999
- 10$3,500 or more
- 156No cash rent
Percentage of workers working in this county: 83.8%
Number of people working at home: 2,276 (27.7% of all workers)
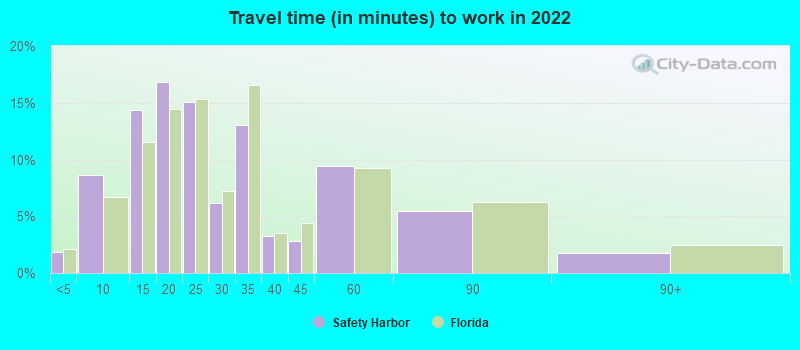
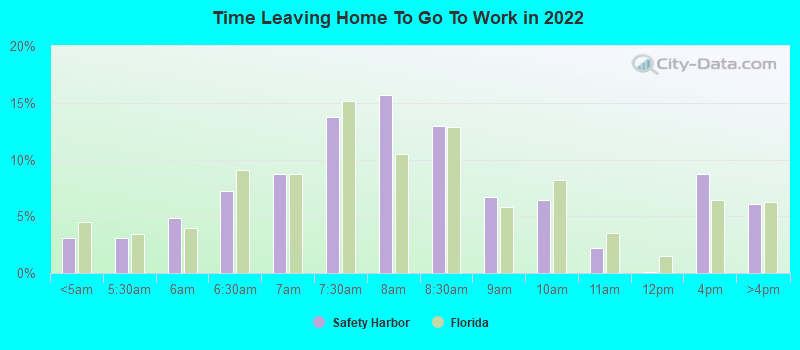
Travel time to work (commute)
- Less than 5 minutes: 60
- 5 to 9 minutes: 346
- 10 to 14 minutes: 786
- 15 to 19 minutes: 1,064
- 20 to 24 minutes: 696
- 25 to 29 minutes: 811
- 30 to 34 minutes: 1,254
- 35 to 39 minutes: 254
- 40 to 44 minutes: 276
- 45 to 59 minutes: 227
- 60 to 89 minutes: 188
- 90 or more minutes: 171
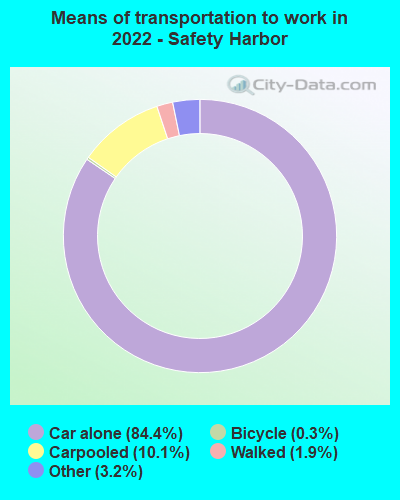
Means of transportation to work:
- Drove a car alone: 5,758 (63.3%)
- Carpooled: 802 (8.8%)
- Taxi: 270 (3.0%)
- Bicycle: 24 (0.3%)
- Walked: 144 (1.6%)
- Worked at home: 2,276 (25.0%)
- Unemployment by race in 2022
- Unemployment rate for White non-Hispanic residents
- 1.8%Males
- 4.7%Females
- Unemployment rate for two or more race residents
- 12.3%Females
- Unemployment rate for Hispanic or Latino residents
- 6.6%Males
- 3.4%Females
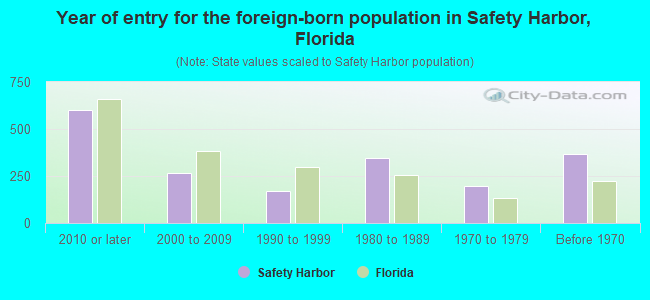
- Year of entry for the foreign-born population in Safety Harbor, Florida
- 6022010 or later
- 2642000 to 2009
- 1711990 to 1999
- 3461980 to 1989
- 1981970 to 1979
- 369Before 1970
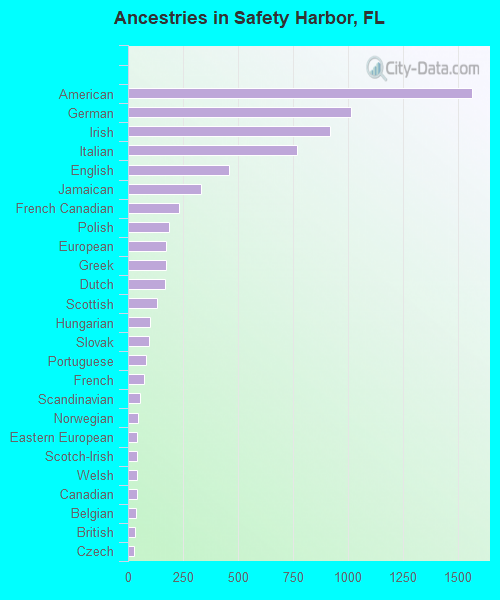
First ancestries reported:
- American: 1,563 (18.2%)
- German: 1,016 (11.8%)
- Irish: 919 (10.7%)
- Italian: 767 (8.9%)
- English: 457 (5.3%)
- Jamaican: 334 (3.9%)
- French Canadian: 231 (2.7%)
- Polish: 187 (2.2%)
- European: 175 (2.0%)
- Greek: 174 (2.0%)
- Dutch: 168 (2.0%)
- Scottish: 130 (1.5%)
- Hungarian: 99 (1.2%)
- Slovak: 94 (1.1%)
- Portuguese: 82 (1.0%)
- French: 71 (0.8%)
- Scandinavian: 55 (0.6%)
- Norwegian: 45 (0.5%)
- Eastern European: 43 (0.5%)
- Scotch-Irish: 42 (0.5%)
- Welsh: 42 (0.5%)
- Canadian: 40 (0.5%)
- Belgian: 36 (0.4%)
- British: 30 (0.3%)
- Czech: 29 (0.3%)
- Turkish: 27 (0.3%)
- Austrian: 22 (0.3%)
- Brazilian: 22 (0.3%)
- Swiss: 14 (0.2%)
- Lebanese: 13 (0.2%)
- Swedish: 11 (0.1%)
- Trinidadian and Tobagonian: 9 (0.1%)
- Yugoslavian: 8 (0.09%)
- Serbian: 5 (0.06%)
- Croatian: 3 (0.03%)
Most common places of birth for foreign-born residents (%):
| Safety Harbor: | 24.2% (385) |
| Florida: | 5.0% (227,319) |
| Safety Harbor: | 9.4% (150) |
| Florida: | 2.4% (109,132) |
| Safety Harbor: | 9.2% (146) |
| Florida: | 2.1% (94,349) |
| Safety Harbor: | 6.5% (104) |
| Florida: | 2.7% (122,906) |
| Safety Harbor: | 6.1% (98) |
| Florida: | 22.0% (1,006,576) |
| Safety Harbor: | 5.6% (89) |
| Florida: | 1.3% (57,263) |
| Safety Harbor: | 5.4% (86) |
| Florida: | 1.2% (54,272) |
| Safety Harbor: | 3.8% (60) |
| Florida: | 1.3% (60,604) |
| Safety Harbor: | 3.1% (49) |
| Florida: | 0.1% (2,456) |
| Safety Harbor: | 3.0% (48) |
| Florida: | 1.2% (56,071) |
| Safety Harbor: | 2.7% (43) |
| Florida: | 5.6% (257,152) |
| Safety Harbor: | 2.0% (32) |
| Florida: | 0.2% (10,425) |
| Safety Harbor: | 1.7% (27) |
| Florida: | 0.2% (11,243) |
| Safety Harbor: | 1.6% (26) |
| Florida: | 0.1% (3,268) |
| Safety Harbor: | 1.6% (25) |
| Florida: | 0.8% (37,723) |
Place of birth for U.S.-born residents:
- This state: 5,720
- Other state: 9,499
- Northeast: 3,810
- Midwest: 2,935
- South: 2,141
- West: 603
91.4% of Safety Harbor residents lived in the same house 1 years ago.
Out of people who lived in different houses, 31.6% lived in this county.
Out of people who lived in different counties, 53.2% lived in Florida.
| Safety Harbor: | 91.4% |
| State average: | 86.3% |
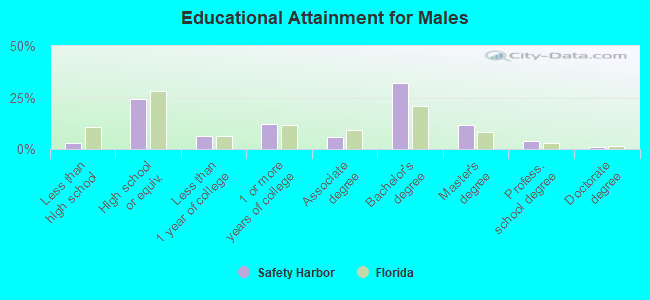
Education attainment for males 25 years and older:
- No schooling: 39
- Nursery to 4th grade: 0
- 5th and 6th grade: 0
- 7th and 8th grade: 0
- 9th grade: 19
- 10th grade: 18
- 11th grade: 0
- 12th grade, no diploma: 96
- High school graduate (or equivalency): 1,473
- Less than 1 year of college: 377
- Some college more than 1 year, no degree: 742
- Associate degree: 347
- Bachelor's degree: 1,939
- Master's degree: 703
- Professional school degree: 226
- Doctorate degree: 50
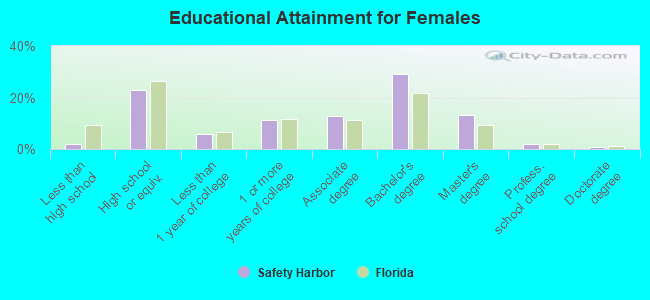
Education attainment for females 25 years and older:
- No schooling: 18
- Nursery to 4th grade: 0
- 5th and 6th grade: 0
- 7th and 8th grade: 0
- 9th grade: 0
- 10th grade: 55
- 11th grade: 0
- 12th grade, no diploma: 62
- High school graduate (or equivalency): 1,602
- Less than 1 year of college: 407
- Some college more than 1 year, no degree: 772
- Associate degree: 880
- Bachelor's degree: 2,011
- Master's degree: 926
- Professional school degree: 148
- Doctorate degree: 60
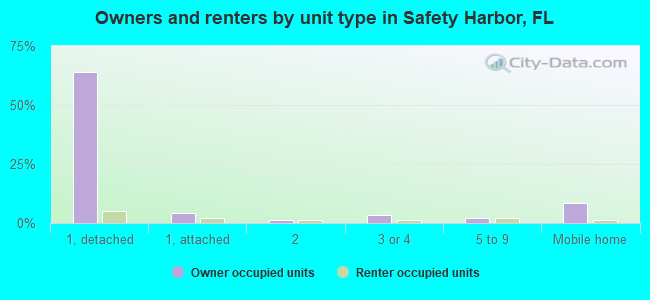
Housing units in structures:
- One, detached: 4,995
- One, attached: 617
- Two: 32
- 3 or 4: 425
- 5 to 9: 251
- 10 to 19: 67
- 20 to 49: 162
- 50 or more: 303
- Mobile homes: 714
Median worth of mobile homes: $125,254
Housing units lacking complete kitchen facilities in 2022: 3.1%
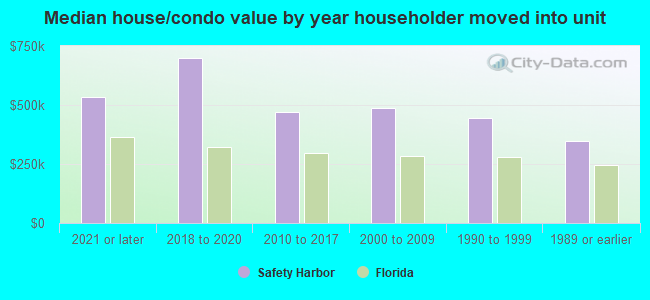
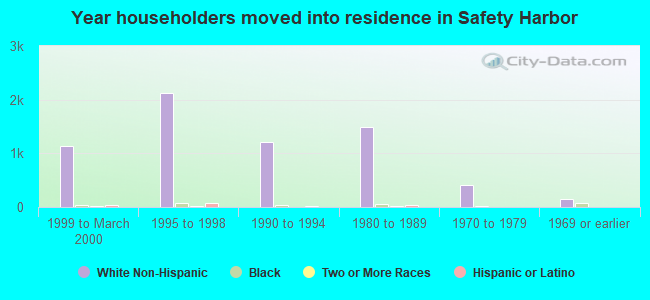
House/condo owner moved in on average 11 years ago
Renter moved in on average 4 years ago
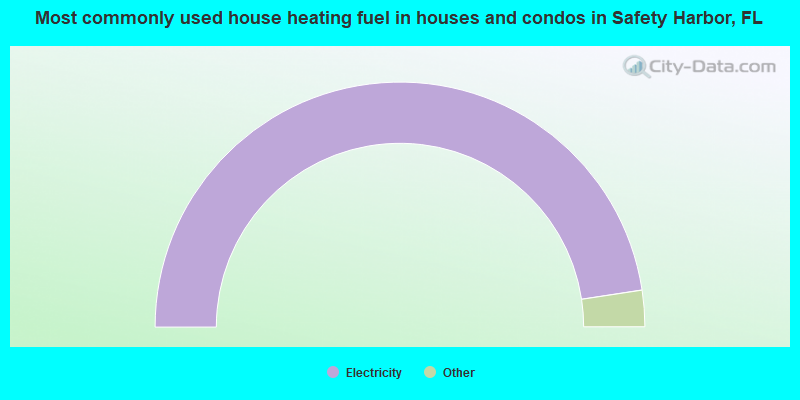
- 95.2%Electricity
- 2.9%Utility gas
- 0.8%No fuel used
- 0.5%Solar energy
- 0.3%Bottled, tank, or LP gas
- 0.2%Wood
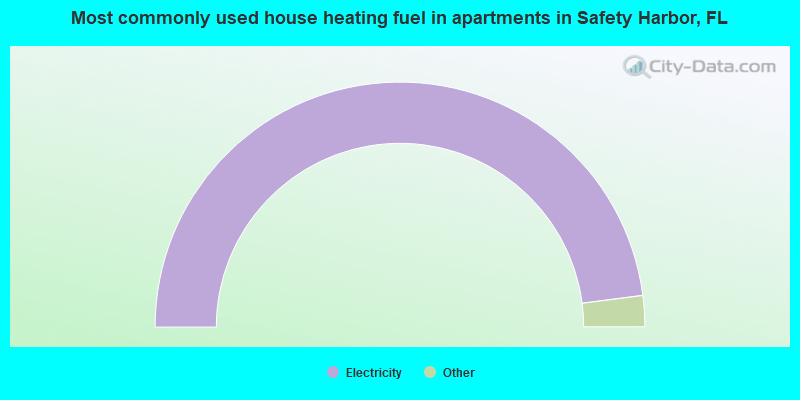
- 95.9%Electricity
- 2.1%Fuel oil, kerosene, etc.
- 2.0%Utility gas
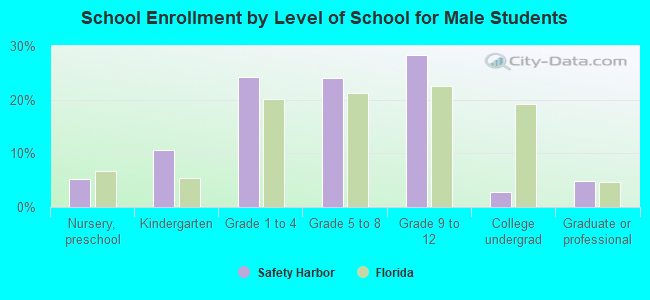
Private vs. public school enrollment:
| Here: | 20.1% |
| Florida: | 15.8% |
| Here: | 27.9% |
| Florida: | 12.9% |
| Here: | 12.6% |
| Florida: | 23.6% |