Sandy, UT (Utah) Houses and Residents
Estimated median house or condo value in 2022: $614,900 (it was $180,700 in 2000 )
Sandy:
$614,900Utah:
$499,500
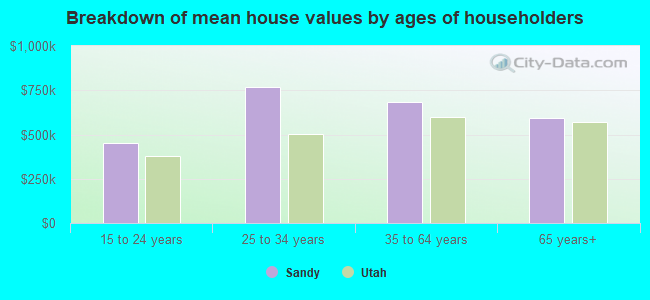
Lower value quartile - upper value quartile: $471,300 - $768,800Mean price in 2022: Detached houses: $660,455 Here:
$660,455State:
$607,750
Townhouses or other attached units: $476,949 Here:
$476,949State:
$444,505
In 2-unit structures: $431,247 Here:
$431,247State:
$433,540
In 3-to-4-unit structures: $357,083 Here:
$357,083State:
$362,850
In 5-or-more-unit structures: $262,879 Here:
$262,879State:
$412,810
Mobile homes: $94,914 Here:
$94,914State:
$113,475
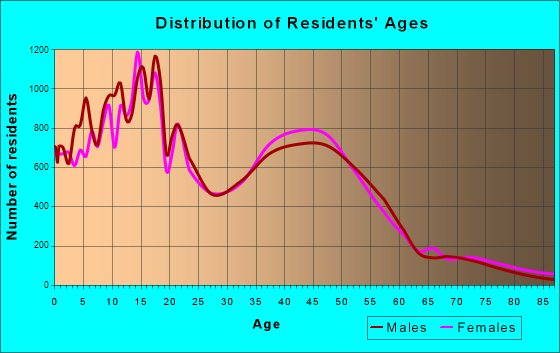
Total population: 91,148 (Urban population: 88,001, Rural population: 258 (all nonfarm) )
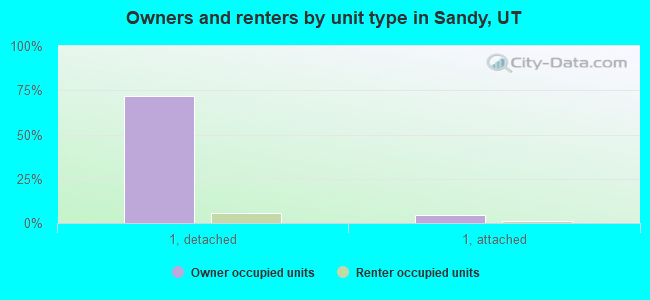
Houses: 34,729 (33,129 occupied: 24,628 owner occupied, 8,501 renter occupied )
% of renters here:
26%State:
29%
Housing density: 1,556 houses/condos per square mile
Median price asked for vacant for-sale houses and condos in 2022: $1,099,467.
Median contract rent in 2022: $1,507 (lower quartile is $1,280, upper quartile is $1,918)
Median rent asked for vacant for-rent units in 2022: $1,985
Median gross rent in Sandy, UT in 2022: $1,669
Housing units in Sandy with a mortgage: 15,829 (2,579 second mortgage, 148 home equity loan, 2,071 both second mortgage and home equity loan )Houses without a mortgage: 1,102
Median household income for houses/condos with a mortgage: $125,193
Median household income for apartments without a mortgage: $103,383
Median monthly housing costs: $1,510
Data:
Median house or condo value ($)
Median house or condo value ($ change since 2000)
Median house or condo value ($) - White
Median house or condo value ($) - Black or African American
Median house or condo value ($) - Asian
Median house or condo value ($) - Hispanic or Latino
Median house or condo value ($) - American Indian and Alaska Native
Median house or condo value ($) - Multirace
Median house or condo value ($) - Other Race
Median price asked for mobile homes ($)
Household density (households per square mile)
Mean house or condo value by units in structure - 1, detached ($)
Mean house or condo value by units in structure - 1, attached ($)
Mean house or condo value by units in structure - 2 ($)
Mean house or condo value by units in structure by units in structure - 3 or 4 ($)
Mean house or condo value by units in structure - 5 or more ($)
Mean house or condo value by units in structure - Boat, RV, van, etc. ($)
Mean house or condo value by units in structure - Mobile home ($)
Median contract rent ($)
Median contract rent - Lower quartile ($)
Median contract rent - Upper quartile ($)
Median gross rent ($)
Urban houses (%)
Rural houses (%)
Houses occupied (%)
Houses occupied (% change since 2000)
Houses owner occupied (%)
Houses owner occupied (% change since 2000)
Houses renter occupied (%)
Houses renter occupied (% change since 2000)
Vacant housing units - For rent (%)
Vacant housing units - For rent (% change since 2000)
Vacant housing units - For sale only (%)
Vacant housing units - For sale only (% change since 2000)
Vacant housing units - Rented or sold, not occupied (%)
Vacant housing units - Rented or sold, not occupied (% change since 2000)
Vacant housing units - For seasonal, recreational, or occasional use (%)
Vacant housing units - For seasonal, recreational, or occasional use (% change since 2000)
Vacant housing units - For migrant workers (%)
Vacant housing units - For migrant workers (% change since 2000)
Vacant housing units - Other vacant (%)
Vacant housing units - Other vacant (% change since 2000)
Median monthly housing costs ($)
Median household income for houses/condos with a mortgage ($)
Median household income for houses/condos without a mortgage ($)
Median household income ($)
Median household income ($) - White
Median household income ($) - Black or African American
Median household income ($) - Asian
Median household income ($) - Hispanic or Latino
Median household income ($) - American Indian and Alaska Native
Median household income ($) - Multirace
Median household income ($) - Other Race
Mortgage status - with mortgage (%)
Mortgage status - with second mortgage (%)
Mortgage status - with home equity loan (%)
Mortgage status - with both second mortgage and home equity loan (%)
Mortgage status - without a mortgage (%)
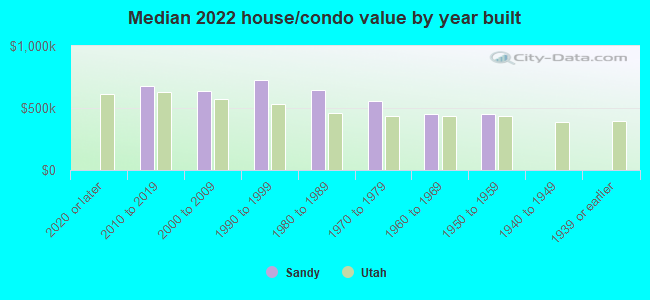
Median year house/condo built
Median year apartment built
Household type by relationship - Male householder living alone (%)
Household type by relationship - Male householder not living alone (%)
Household type by relationship - Female householder living alone (%)
Household type by relationship - Female householder not living alone (%)
Household type by relationship - Opposite-Sex spouse (%)
Household type by relationship - Same-Sex spouse (%)
Household type by relationship - Opposite-Sex unmarried partner (%)
Household type by relationship - Same-Sex unmarried partner (%)
Household type by relationship - In group quarters (%)
Size of family households - 2-person household (%)
Size of family households - 3-person household (%)
Size of family households - 4-person household (%)
Size of family households - 5-person household (%)
Size of family households - 6-person household (%)
Size of family households - 7-or-more-person household (%)
Size of nonfamily households - 1-person household (%)
Size of nonfamily households - 2-person household (%)
Size of nonfamily households - 3-person household (%)
Size of nonfamily households - 4-person household (%)
Size of nonfamily households - 5-person household (%)
Size of nonfamily households - 6-person household (%)
Size of nonfamily households - 7-or-moreperson household (%)
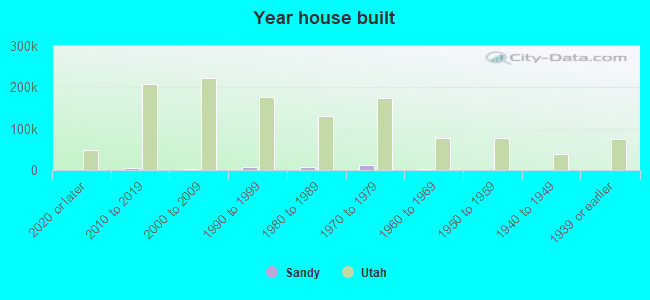
Year house built - Built 2010 or later (%)
Year house built - Built 2000 to 2009 (%)
Year house built - Built 1990 to 1999 (%)
Year house built - Built 1980 to 1989 (%)
Year house built - Built 1970 to 1979 (%)
Year house built - Built 1960 to 1969 (%)
Year house built - Built 1950 to 1959 (%)
Year house built - Built 1940 to 1949 (%)
Year house built - Built 1939 or earlier (%)
Median number of rooms in houses and condos
Median number of rooms in apartments
Median number of bedrooms in owner occupied houses
Mean number of bedrooms in owner occupied houses
Median number of bedrooms in renter occupied houses
Mean number of bedrooms in renter occupied houses
Median number of vehichles in owner occupied houses
Mean number of vehichles in owner occupied houses
Median number of vehichles in renter occupied houses
Mean number of vehichles in renter occupied houses
Rooms in owner-occupied houses - 1 room (%)
Rooms in owner-occupied houses - 2 rooms (%)
Rooms in owner-occupied houses - 3 rooms (%)
Rooms in owner-occupied houses - 4 rooms (%)
Rooms in owner-occupied houses - 5 rooms (%)
Rooms in owner-occupied houses - 6 rooms (%)
Rooms in owner-occupied houses - 7 rooms (%)
Rooms in owner-occupied houses - 8 rooms (%)
Rooms in owner-occupied houses - 9+ rooms (%)
Rooms in renter-occupied houses - 1 room (%)
Rooms in renter-occupied houses - 2 rooms (%)
Rooms in renter-occupied houses - 3 rooms (%)
Rooms in renter-occupied houses - 4 rooms (%)
Rooms in renter-occupied houses - 5 rooms (%)
Rooms in renter-occupied houses - 6 rooms (%)
Rooms in renter-occupied houses - 7 rooms (%)
Rooms in renter-occupied houses - 8 rooms (%)
Rooms in renter-occupied houses - 9+ rooms (%)
Bedrooms in owner-occupied houses - no bedrooms (%)
Bedrooms in owner-occupied houses - 1 bedroom (%)
Bedrooms in owner-occupied houses - 2 bedrooms (%)
Bedrooms in owner-occupied houses - 3 bedrooms (%)
Bedrooms in owner-occupied houses - 4 bedrooms (%)
Bedrooms in owner-occupied houses - 5+ bedrooms (%)
Bedrooms in renter-occupied houses - no bedrooms (%)
Bedrooms in renter-occupied houses - 1 bedroom (%)
Bedrooms in renter-occupied houses - 2 bedrooms (%)
Bedrooms in renter-occupied houses - 3 bedrooms (%)
Bedrooms in renter-occupied houses - 4 bedrooms (%)
Bedrooms in renter-occupied houses - 5+ bedrooms (%)
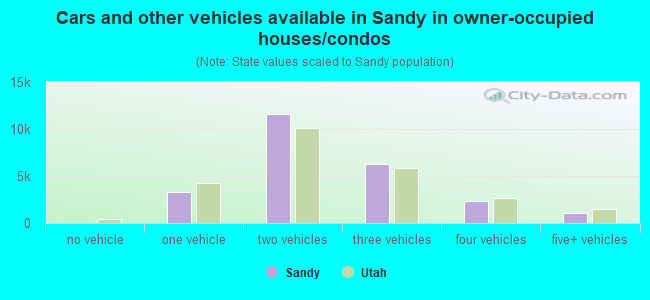
Vehicles available in owner-occupied houses - no vehicle available (%)
Vehicles available in owner-occupied houses - 1 vehicle available(%)
Vehicles available in owner-occupied houses - 2 Vehicles available (%)
Vehicles available in owner-occupied houses - 3 Vehicles available (%)
Vehicles available in owner-occupied houses - 4 Vehicles available (%)
Vehicles available in owner-occupied houses - 5+ Vehicles available (%)
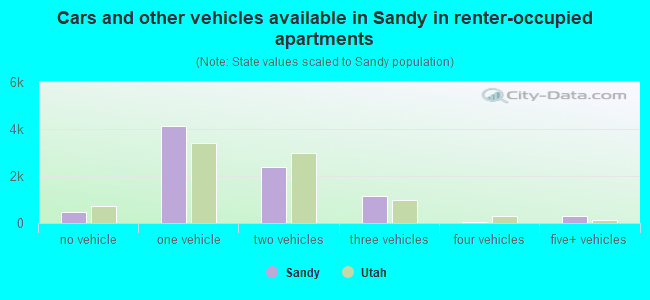
Vehicles available in renter-occupied houses - no vehicle available (%)
Vehicles available in renter-occupied houses - 1 vehicle available (%)
Vehicles available in renter-occupied houses - 2 Vehicles available (%)
Vehicles available in renter-occupied houses - 3 Vehicles available (%)
Vehicles available in renter-occupied houses - 4 Vehicles available (%)
Vehicles available in renter-occupied houses - 5+ Vehicles available (%)
Housing units in structures - 1, detached (%)
Housing units in structures - 1, attached (%)
Housing units in structures - 2 (%)
Housing units in structures - 3 or 4 (%)
Housing units in structures - 5 to 9 (%)
Housing units in structures - 10 to 19 (%)
Housing units in structures - 20 to 49 (%)
Housing units in structures - 50 or more (%)
Housing units in structures - Mobile home (%)
Housing units in structures - Boat, RV, van, etc. (%)
Housing units in structures - Owners - 1, detached (%)
Housing units in structures - Owners - 1, attached (%)
Housing units in structures - Owners - 2 (%)
Housing units in structures - Owners - 3 or 4 (%)
Housing units in structures - Owners - 5 to 9 (%)
Housing units in structures - Owners - 10 to 19 (%)
Housing units in structures - Owners - 20 to 49 (%)
Housing units in structures - Owners - 50 or more (%)
Housing units in structures - Owners - Mobile home (%)
Housing units in structures - Owners - Boat, RV, van, etc. (%)
Housing units in structures - Renters - 1, detached (%)
Housing units in structures - Renters - 1, attached (%)
Housing units in structures - Renters - 2 (%)
Housing units in structures - Renters - 3 or 4 (%)
Housing units in structures - Renters - 5 to 9 (%)
Housing units in structures - Renters - 10 to 19 (%)
Housing units in structures - Renters - 20 to 49 (%)
Housing units in structures - Renters - 50 or more (%)
Housing units in structures - Renters - Mobile home (%)
Housing units in structures - Renters - Boat, RV, van, etc. (%)
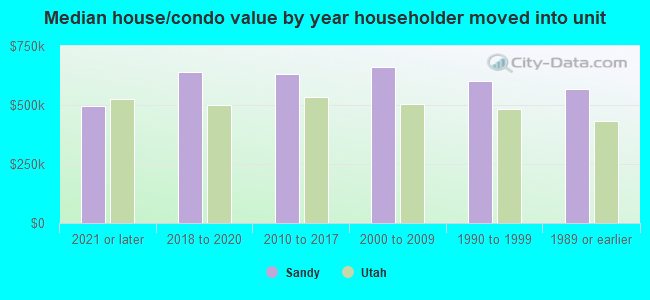
House/condo owner moved in on average (years ago)
Renter moved in on average (years ago)
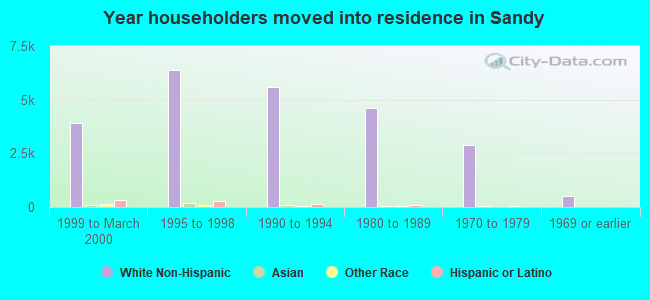
Year householder moved into unit - Moved in 1999 to March 2000 (%)
Year householder moved into unit - Moved in 1999 to March 2000 (%) - White
Year householder moved into unit - Moved in 1999 to March 2000 (%) - Black or African American
Year householder moved into unit - Moved in 1999 to March 2000 (%) - Asian
Year householder moved into unit - Moved in 1999 to March 2000 (%) - Hispanic or Latino
Year householder moved into unit - Moved in 1999 to March 2000 (%) - American Indian and Alaska Native
Year householder moved into unit - Moved in 1999 to March 2000 (%) - Multirace
Year householder moved into unit - Moved in 1999 to March 2000 (%) - Other Race
Year householder moved into unit - Moved in 1995 to 1998 (%)
Year householder moved into unit - Moved in 1995 to 1998 (%) - White
Year householder moved into unit - Moved in 1995 to 1998 (%) - Black or African American
Year householder moved into unit - Moved in 1995 to 1998 (%) - Asian
Year householder moved into unit - Moved in 1995 to 1998 (%) - Hispanic or Latino
Year householder moved into unit - Moved in 1995 to 1998 (%) - American Indian and Alaska Native
Year householder moved into unit - Moved in 1995 to 1998 (%) - Multirace
Year householder moved into unit - Moved in 1995 to 1998 (%) - Other Race
Year householder moved into unit - Moved in 1990 to 1994 (%)
Year householder moved into unit - Moved in 1990 to 1994 (%) - White
Year householder moved into unit - Moved in 1990 to 1994 (%) - Black or African American
Year householder moved into unit - Moved in 1990 to 1994 (%) - Asian
Year householder moved into unit - Moved in 1990 to 1994 (%) - Hispanic or Latino
Year householder moved into unit - Moved in 1990 to 1994 (%) - American Indian and Alaska Native
Year householder moved into unit - Moved in 1990 to 1994 (%) - Multirace
Year householder moved into unit - Moved in 1990 to 1994 (%) - Other Race
Year householder moved into unit - Moved in 1980 to 1989 (%)
Year householder moved into unit - Moved in 1980 to 1989 (%) - White
Year householder moved into unit - Moved in 1980 to 1989 (%) - Black or African American
Year householder moved into unit - Moved in 1980 to 1989 (%) - Asian
Year householder moved into unit - Moved in 1980 to 1989 (%) - Hispanic or Latino
Year householder moved into unit - Moved in 1980 to 1989 (%) - American Indian and Alaska Native
Year householder moved into unit - Moved in 1980 to 1989 (%) - Multirace
Year householder moved into unit - Moved in 1980 to 1989 (%) - Other Race
Year householder moved into unit - Moved in 1970 to 1979 (%)
Year householder moved into unit - Moved in 1970 to 1979 (%) - White
Year householder moved into unit - Moved in 1970 to 1979 (%) - Black or African American
Year householder moved into unit - Moved in 1970 to 1979 (%) - Asian
Year householder moved into unit - Moved in 1970 to 1979 (%) - Hispanic or Latino
Year householder moved into unit - Moved in 1970 to 1979 (%) - American Indian and Alaska Native
Year householder moved into unit - Moved in 1970 to 1979 (%) - Multirace
Year householder moved into unit - Moved in 1970 to 1979 (%) - Other Race
Year householder moved into unit - Moved in 1969 or earlier (%)
Year householder moved into unit - Moved in 1969 or earlier (%) - White
Year householder moved into unit - Moved in 1969 or earlier (%) - Black or African American
Year householder moved into unit - Moved in 1969 or earlier (%) - Asian
Year householder moved into unit - Moved in 1969 or earlier (%) - Hispanic or Latino
Year householder moved into unit - Moved in 1969 or earlier (%) - American Indian and Alaska Native
Year householder moved into unit - Moved in 1969 or earlier (%) - Multirace
Year householder moved into unit - Moved in 1969 or earlier (%) - Other Race
Housing units lacking complete plumbing facilities (%)
Housing units lacking complete kitchen facilities (%)
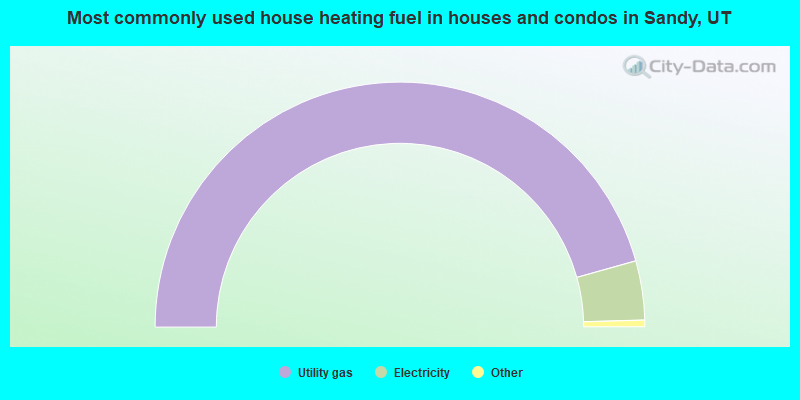
House heating fuel used in houses and condos - Utility gas (%)
House heating fuel used in houses and condos - Bottled, tank, or LP gas (%)
House heating fuel used in houses and condos - Electricity (%)
House heating fuel used in houses and condos - Fuel oil, kerosene, etc. (%)
House heating fuel used in houses and condos - Coal or coke (%)
House heating fuel used in houses and condos - Wood (%)
House heating fuel used in houses and condos - Solar energy (%)
House heating fuel used in houses and condos - Other fuel (%)
House heating fuel used in houses and condos - No fuel used (%)
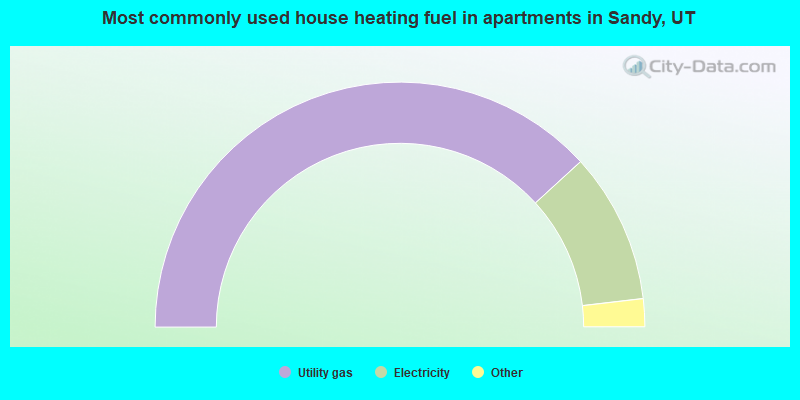
House heating fuel used in apartments - Utility gas (%)
House heating fuel used in apartments - Bottled, tank, or LP gas (%)
House heating fuel used in apartments - Electricity (%)
House heating fuel used in apartments - Fuel oil, kerosene, etc. (%)
House heating fuel used in apartments - Coal or coke (%)
House heating fuel used in apartments - Wood (%)
House heating fuel used in apartments - Solar energy (%)
House heating fuel used in apartments - Other fuel (%)
House heating fuel used in apartments - No fuel used (%)
Latest news about housing in Sandy, UT collected exclusively by city-data.com from local newspapers, TV, and radio stations
Median year house/condo built: 1981Median year apartment built: 1999Household type by relationship:
Households: 93,029
Male householders: 15,917 (2,039 living alone ), Female householders: 17,212 (3,471 living alone )19,520 spouses (19,341 opposite-sex spouses ), 2,392 unmarried partners , (2,043 opposite-sex unmarried partners ), 29,188 children (27,376 natural , 741 adopted , 1,071 stepchildren ), 2,807 grandchildren , 1,254 brothers or sisters , 1,119 parents , 0 foster children , 1,439 other relatives , 1,850 non-relatives In group quarters: 331
Size of family households: 11,189 2-persons , 5,577 3-persons , 4,426 4-persons , 2,649 5-persons , 1,361 6-persons , 547 7-or-more-persons .
Size of nonfamily households: 5,510 1-person , 1,477 2-persons , 224 3-persons , 121 4-persons , 48 5-persons .
14,714 married couples with children. single-parent households (1,328 men , 4,388 women ).
84.3% of residents of Sandy speak English at home. of residents speak Spanish at home (58% speak English very well , 21% speak English well , 10% speak English not well , 11% don't speak English at all ).of residents speak other Indo-European language at home (77% speak English very well , 10% speak English well , 10% speak English not well , 3% don't speak English at all ).of residents speak Asian or Pacific Island language at home (64% speak English very well , 16% speak English well , 13% speak English not well , 7% don't speak English at all ).of residents speak other language at home (91% speak English very well , 9% speak English well ).
Foreign born population: 8,841 (9.5%)of them are naturalized citizens )
Median number of rooms in houses and condos:
Median number of rooms in apartments
Owner-occupied Renter-occupied
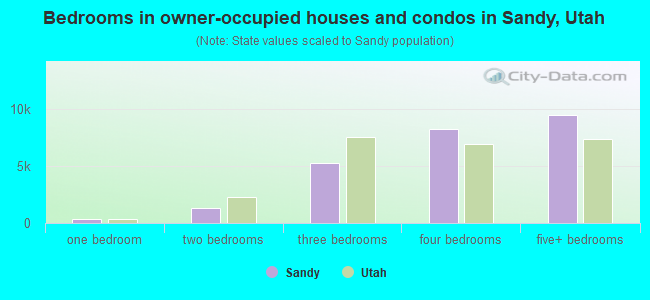
Bedrooms in owner-occupied houses and condos in Sandy, Utah
0 no bedroom 323 1 bedroom 1,302 2 bedrooms 5,282 3 bedrooms 8,242 4 bedrooms 9,479 5+ bedrooms
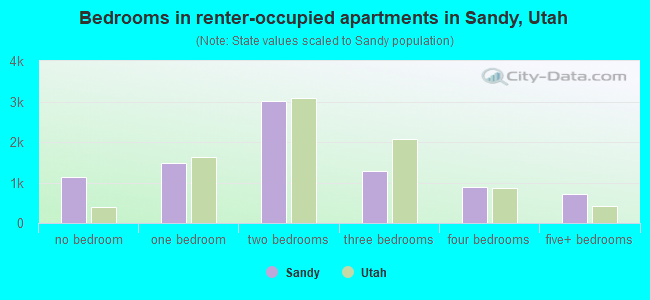
Bedrooms in renter-occupied apartments in Sandy, Utah
1,130 no bedroom 1,482 1 bedroom 3,016 2 bedrooms 1,274 3 bedrooms 882 4 bedrooms 717 5+ bedrooms
Owner-occupied Renter-occupied
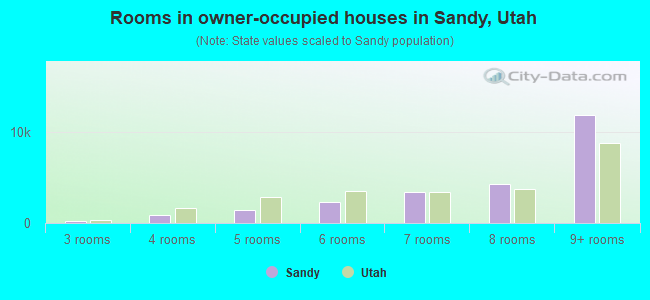
Rooms in owner-occupied houses in Sandy, Utah
0 1 room 87 2 rooms 224 3 rooms 866 4 rooms 1,446 5 rooms 2,362 6 rooms 3,426 7 rooms 4,298 8 rooms 11,919 9+ rooms
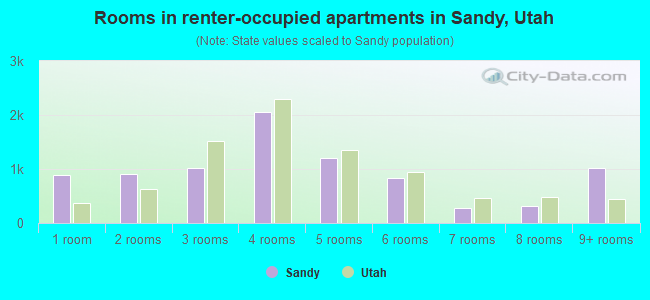
Rooms in renter-occupied apartments in Sandy, Utah
889 1 room 901 2 rooms 1,024 3 rooms 2,049 4 rooms 1,205 5 rooms 840 6 rooms 269 7 rooms 309 8 rooms 1,015 9+ rooms
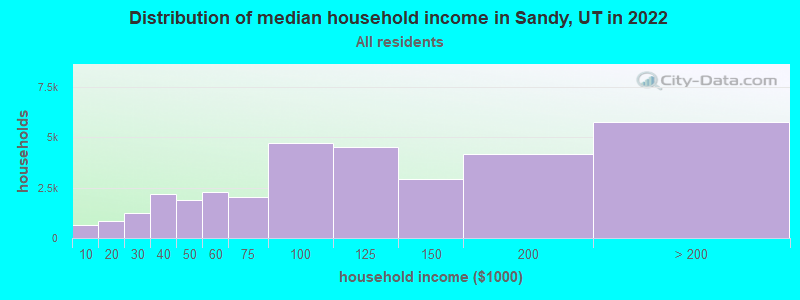
Sandy, UT household income distribution 640 Less than $10,000862 $10,000 to $19,9991,254 $20,000 to $29,9992,187 $30,000 to $39,9991,869 $40,000 to $49,9992,260 $50,000 to $59,9992,009 $60,000 to $74,9994,723 $75,000 to $99,9994,491 $100,000 to $124,9992,910 $125,000 to $149,9994,176 $150,000 to $199,9995,748 $200,000 or more
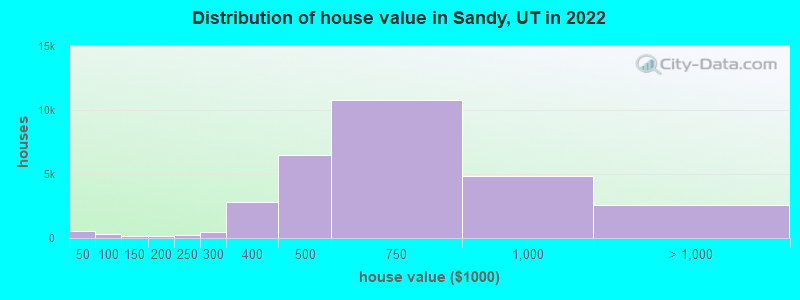
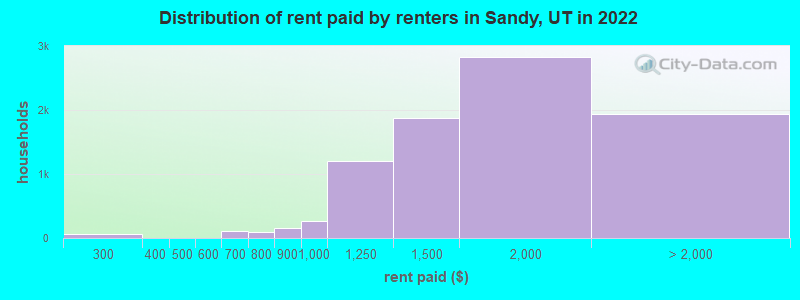
Home value of owner - occupied houses in 2022 in Sandy, UT 100 Less than $10,00050 $10,000 to $14,99912 $15,000 to $19,999120 $25,000 to $29,99918 $30,000 to $34,999122 $35,000 to $39,999100 $40,000 to $49,99931 $50,000 to $59,99996 $60,000 to $69,9999 $70,000 to $79,99913 $80,000 to $89,99968 $90,000 to $99,999159 $100,000 to $124,9995 $125,000 to $149,999133 $150,000 to $174,99959 $175,000 to $199,999261 $200,000 to $249,999441 $250,000 to $299,9992,810 $300,000 to $399,9996,450 $400,000 to $499,99910,753 $500,000 to $749,9994,878 $750,000 to $999,9991,685 $1,000,000 to $1,499,999467 $1,500,000 to $1,999,999395 $2,000,000 or moreRent paid by renters in 2022 in Sandy, UT 53 $200 to $2498 $250 to $2994 $400 to $4492 $550 to $599116 $600 to $64931 $700 to $74966 $750 to $799155 $800 to $899269 $900 to $9991,199 $1,000 to $1,2491,874 $1,250 to $1,4992,829 $1,500 to $1,9991,232 $2,000 to $2,499270 $2,500 to $2,99989 $3,000 to $3,499191 $3,500 or more148 No cash rent
Percentage of workers working in this county: 93.9%Number of people working at home: 11,330 (22.0% of all workers )
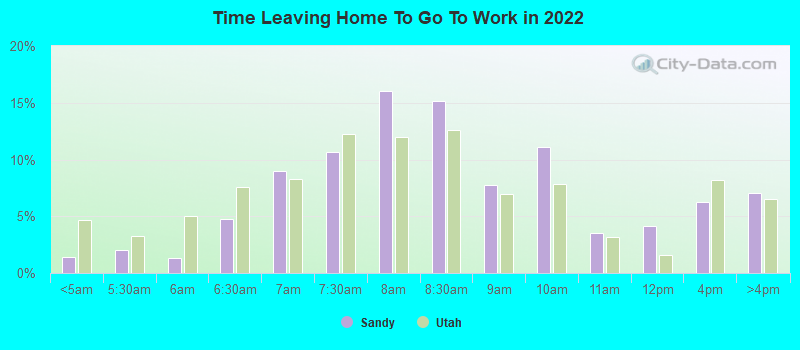
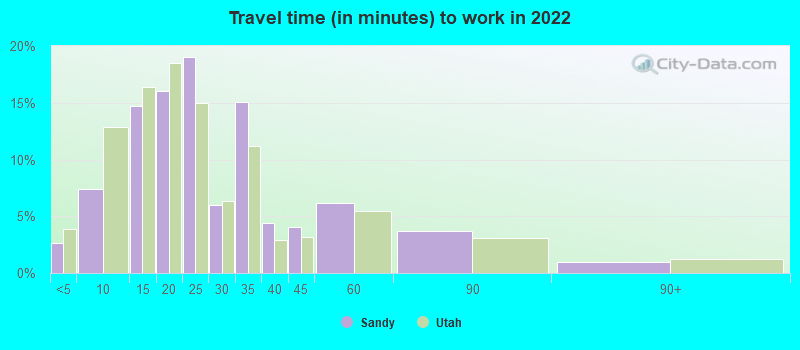
Travel time to work (commute)
Less than 5 minutes: 5715 to 9 minutes: 1,98510 to 14 minutes: 6,20915 to 19 minutes: 5,93220 to 24 minutes: 6,46625 to 29 minutes: 3,85430 to 34 minutes: 6,43135 to 39 minutes: 62540 to 44 minutes: 1,32945 to 59 minutes: 2,24360 to 89 minutes: 37990 or more minutes: 650
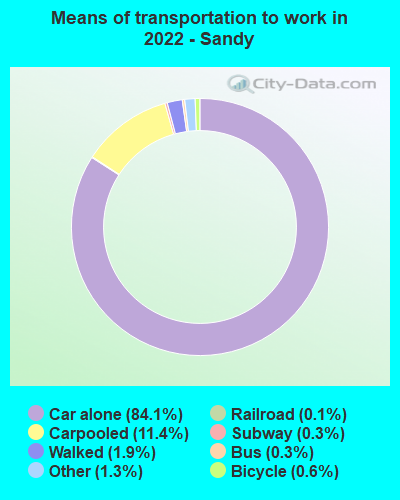
Means of transportation to work:
Drove a car alone: 32,241 (65.9%)Carpooled: 4,694 (9.6%)Bus : 77 (0.2%)Subway or elevated rail : 13 (0.0%)Long-distance train or commuter rail : 64 (0.1%)Light rail, streetcar or trolley : 32 (0.1%)Taxi: 510 (1.0%)Bicycle: 202 (0.4%)Walked: 754 (1.5%)Worked at home: 11,330 (23.2%)
Unemployment by race in 2022
Unemployment rate for White non-Hispanic residents 1.3% Males2.6% FemalesUnemployment rate for Black residents 1.7% MalesUnemployment rate for Asian residents 2.8% MalesUnemployment rate for other race residents 1.2% FemalesUnemployment rate for two or more race residents 1.2% Males6.3% FemalesUnemployment rate for Hispanic or Latino residents 0.9% Males6.4% Females
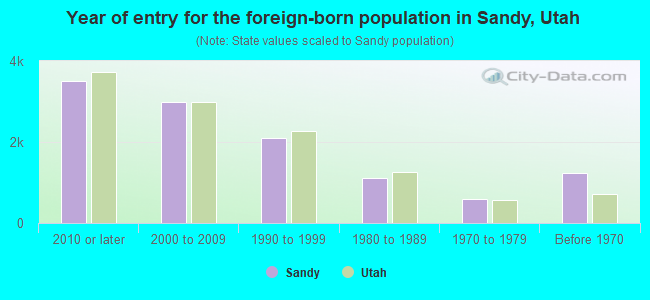
Year of entry for the foreign-born population in Sandy, Utah
3,499 2010 or later 2,994 2000 to 2009 2,097 1990 to 1999 1,117 1980 to 1989 599 1970 to 1979 1,225 Before 1970
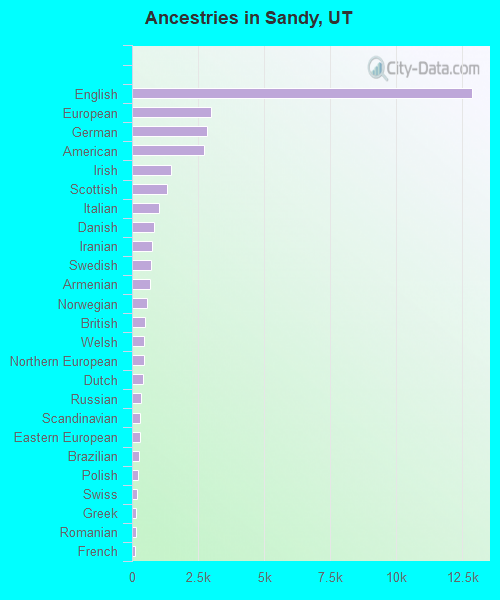
First ancestries reported:
English: 12,873 (27.5%)
European: 3,002 (6.4%)
German: 2,837 (6.1%)
American: 2,720 (5.8%)
Irish: 1,471 (3.1%)
Scottish: 1,326 (2.8%)
Italian: 1,009 (2.2%)
Danish: 830 (1.8%)
Iranian: 771 (1.6%)
Swedish: 706 (1.5%)
Armenian: 689 (1.5%)
Norwegian: 550 (1.2%)
British: 495 (1.1%)
Welsh: 460 (1.0%)
Northern European: 451 (1.0%)
Dutch: 421 (0.9%)
Russian: 328 (0.7%)
Scandinavian: 298 (0.6%)
Eastern European: 285 (0.6%)
Brazilian: 266 (0.6%)
Polish: 242 (0.5%)
Swiss: 187 (0.4%)
Greek: 167 (0.4%)
Romanian: 162 (0.3%)
French: 129 (0.3%)
Scotch-Irish: 119 (0.3%)
Ukrainian: 116 (0.2%)
Canadian: 113 (0.2%)
Nigerian: 105 (0.2%)
Yugoslavian: 104 (0.2%)
Portuguese: 91 (0.2%)
Austrian: 82 (0.2%)
French Canadian: 80 (0.2%)
South African: 66 (0.1%)
Lebanese: 61 (0.1%)
Iraqi: 60 (0.1%)
Serbian: 48 (0.1%)
Basque: 48 (0.1%)
Zimbabwean: 44 (0.09%)
Czech: 40 (0.09%)
Australian: 36 (0.08%)
Belgian: 29 (0.06%)
Lithuanian: 26 (0.06%)
Egyptian: 25 (0.05%)
Hungarian: 23 (0.05%)
Arab: 21 (0.04%)
Slovak: 18 (0.04%)
Palestinian: 18 (0.04%)
Syrian: 16 (0.03%)
Cypriot: 16 (0.03%)
Finnish: 15 (0.03%)
Slovene: 14 (0.03%)
Croatian: 10 (0.02%)
African: 8 (0.02%)
Pennsylvania German: 8 (0.02%)
Czechoslovakian: 7 (0.01%)
Icelander: 7 (0.01%)
Bulgarian: 4 (0.01%)
Most common places of birth for foreign-born residents (%): Mexico Sandy:
17.3% (1,852)Utah:
36.1% (99,740)
Venezuela Sandy:
11.0% (1,169)Utah:
3.2% (8,804)
China, excluding Hong Kong and Taiwan Sandy:
7.9% (847)Utah:
2.9% (8,017)
Brazil Sandy:
6.2% (664)Utah:
2.8% (7,644)
Iran Sandy:
5.5% (591)Utah:
0.8% (2,137)
Vietnam Sandy:
3.7% (396)Utah:
2.6% (7,211)
India Sandy:
3.6% (383)Utah:
3.0% (8,294)
Korea Sandy:
3.3% (352)Utah:
1.6% (4,524)
Colombia Sandy:
2.9% (312)Utah:
2.0% (5,555)
Canada Sandy:
2.4% (261)Utah:
3.0% (8,341)
Other Eastern Europe Sandy:
2.4% (253)Utah:
0.4% (1,143)
Philippines Sandy:
2.3% (250)Utah:
2.3% (6,468)
Germany Sandy:
2.0% (218)Utah:
1.5% (4,247)
Argentina Sandy:
2.0% (214)Utah:
1.3% (3,570)
Russia Sandy:
2.0% (214)Utah:
0.6% (1,555)
Peru Sandy:
1.9% (205)Utah:
2.9% (7,901)
Chile Sandy:
1.6% (169)Utah:
1.3% (3,479)
Place of birth for U.S.-born residents:
This state: 54,541Other state: 28,937Northeast: 5,188Midwest: 3,975South: 4,871West: 14,903 86.9% of Sandy residents lived in the same house 1 years ago.
Out of people who lived in different houses, 40.7% lived in this county.
Out of people who lived in different counties, 43.0% lived in Utah.
Sandy:
86.9%State average:
85.7%
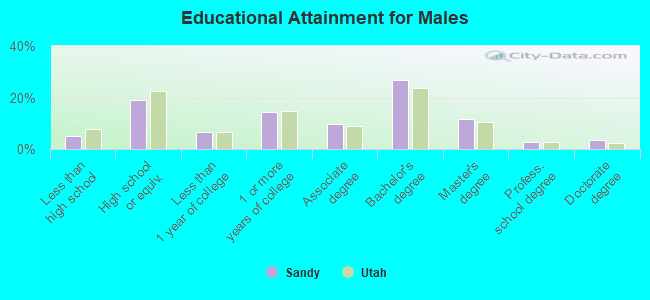
Education attainment for males 25 years and older:
No schooling: 115Nursery to 4th grade: 235th and 6th grade: 3067th and 8th grade: 09th grade: 37410th grade: 4311th grade: 19612th grade, no diploma: 494High school graduate (or equivalency): 5,646Less than 1 year of college: 1,943Some college more than 1 year, no degree: 4,236Associate degree: 2,894Bachelor's degree: 7,989Master's degree: 3,509Professional school degree: 797Doctorate degree: 1,077
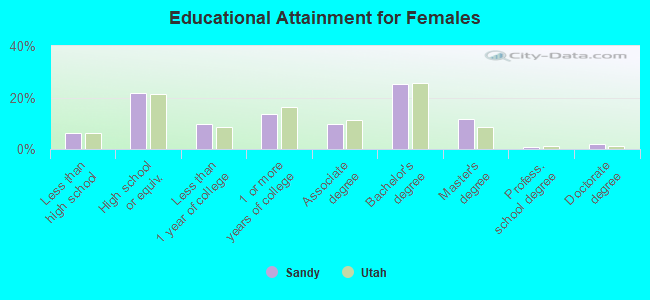
Education attainment for females 25 years and older:
No schooling: 228Nursery to 4th grade: 1155th and 6th grade: 07th and 8th grade: 1149th grade: 38810th grade: 31311th grade: 7712th grade, no diploma: 798High school graduate (or equivalency): 7,225Less than 1 year of college: 3,269Some college more than 1 year, no degree: 4,465Associate degree: 3,246Bachelor's degree: 8,358Master's degree: 3,884Professional school degree: 221Doctorate degree: 617
Housing units in structures:
One, detached: 24,389One, attached: 2,173Two: 8203 or 4: 5315 to 9: 24910 to 19: 74920 to 49: 1,59250 or more: 3,146Mobile homes: 1,080Housing units lacking complete plumbing facilities in 2022: 0.4%Housing units lacking complete kitchen facilities in 2022: 2.6%House/condo owner moved in on average 15 years ago
Renter moved in on average 2 years ago
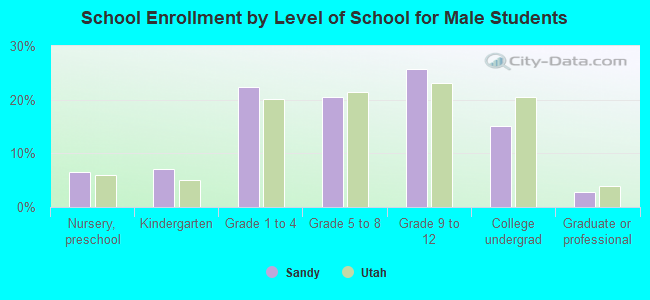
Private vs. public school enrollment:
Students in private schools in grades 1 to 8 (elementary and middle school): 1,405 Students in private schools in grades 9 to 12 (high school): 506 Students in private undergraduate colleges: 449