Sherman, TX (Texas) Houses and Residents
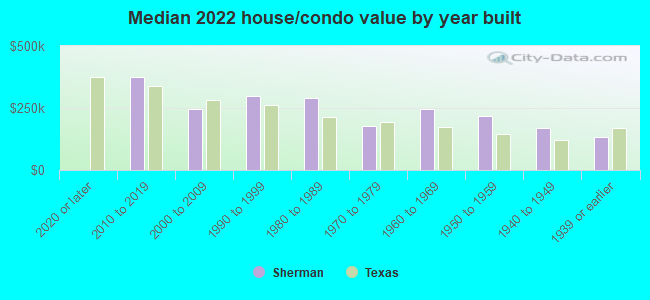
| Sherman: | $238,998 |
| Texas: | $275,400 |
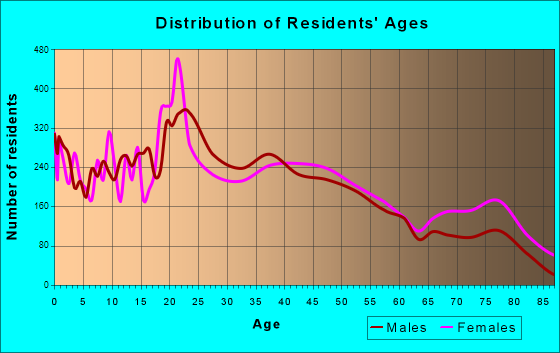
Total population: 39,943 (Urban population: 33,634, Rural population: 1,323 (all nonfarm))
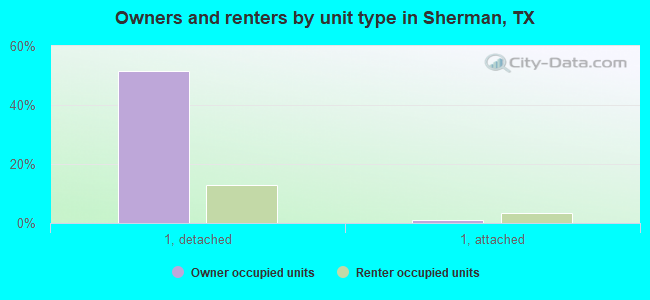
Houses: 19,232 (17,422 occupied: 9,151 owner occupied, 8,365 renter occupied)
| % of renters here: | 48% |
| State: | 38% |
Housing density: 499 houses/condos per square mile
Median price asked for vacant for-sale houses and condos in 2022: $245,790.
Median contract rent in 2022: $1,071 (lower quartile is $843, upper quartile is $1,249)
Median rent asked for vacant for-rent units in 2022: $1,134
Median gross rent in Sherman, TX in 2022: $1,256
Housing units in Sherman with a mortgage: 5,281 (36 second mortgage, 0 home equity loan, 12 both second mortgage and home equity loan)
Houses without a mortgage: 25
Median household income for houses/condos with a mortgage: $95,124
Median household income for apartments without a mortgage: $57,484
Median monthly housing costs: $1,167
Compare current foreclosures in Sherman, TX:
| Photo | Address | Area | Beds / Baths | Price | Details |
|---|---|---|---|---|---|

|
#1
N Andrews Ave
Sherman, TX 75090
|
- sq. feet
|
2 baths 3 beds |
show details | |

|
#2
W Houston St
Sherman, TX 75092
|
2,137 sq. feet
|
2 baths 3 beds |
show details | |

|
#3
N Brents Ave
Sherman, TX 75090
|
1,028 sq. feet
|
1 baths - beds |
show details | |

|
#4
Pebblebrook Ln
Sherman, TX 75092
|
1,657 sq. feet
|
2 baths - beds |
show details | |

|
#5
Blanton Dr
Sherman, TX 75092
|
1,229 sq. feet
|
1 baths - beds |
show details | |

|
#6
Dauphine Dr
Sherman, TX 75090
|
1,136 sq. feet
|
2 baths - beds |
show details | |

|
#7
Pebblebrook Ln
Sherman, TX 75092
|
2,156 sq. feet
|
2 baths - beds |
show details | |

|
#8
W College St
Sherman, TX 75092
|
2,520 sq. feet
|
1 baths - beds |
show details | |

|
#9
E Pecan St
Sherman, TX 75090
|
1,278 sq. feet
|
1 baths - beds |
show details | |

|
#10
Normandy Dr
Sherman, TX 75090
|
1,194 sq. feet
|
3 baths - beds |
show details |
| Photo | Address | Area | Beds / Baths | Price | Details |
|---|---|---|---|---|---|

|
#11
N Travis St # 8205
Sherman, TX 75092
|
- sq. feet
|
- baths - beds |
show details | |

|
#12
Sherbrooke Pl
Sherman, TX 75092
|
2,385 sq. feet
|
- baths - beds |
show details | |

|
#13
W Taylor St Apt 701
Sherman, TX 75092
|
- sq. feet
|
- baths - beds |
show details | |

|
#14
Whitney Rd
Sherman, TX 75090
|
2,040 sq. feet
|
- baths - beds |
show details | |

|
#15
Mallard Dr
Sherman, TX 75092
|
1,920 sq. feet
|
- baths - beds |
show details | |

|
#16
Park Pl
Sherman, TX 75092
|
- sq. feet
|
- baths - beds |
show details | |

|
#17
N Woods St
Sherman, TX 75092
|
- sq. feet
|
- baths - beds |
show details | |

|
#18
Pikes Pl
Sherman, TX 75092
|
- sq. feet
|
- baths - beds |
show details | |

|
#19
W Dexter St
Sherman, TX 75092
|
1,263 sq. feet
|
- baths - beds |
show details | |

|
#20
Peggeys Cv
Sherman, TX 75092
|
2,280 sq. feet
|
- baths - beds |
show details |
| Photo | Address | Area | Beds / Baths | Price | Details |
|---|---|---|---|---|---|

|
#21
Pheasant Dr
Sherman, TX 75092
|
2,219 sq. feet
|
- baths - beds |
show details | |

|
#22
Fm 902
Sherman, TX 75090
|
- sq. feet
|
- baths - beds |
show details | |

|
#23
La Salle Dr Apt F201
Sherman, TX 75090
|
- sq. feet
|
- baths - beds |
show details | |

|
#24
S Fm 1417 Apt 1517
Sherman, TX 75092
|
- sq. feet
|
- baths - beds |
show details | |

|
#25
S Austin St
Sherman, TX 75090
|
- sq. feet
|
- baths - beds |
show details | |

|
#26
Pintail
Sherman, TX 75092
|
2,395 sq. feet
|
- baths - beds |
show details | |

|
#27
W Lake St
Sherman, TX 75090
|
- sq. feet
|
- baths - beds |
show details | |

|
#28
W Center St Apt 3201
Sherman, TX 75092
|
- sq. feet
|
- baths - beds |
show details | |

|
#29
S Fm 1417 Apt 3106
Sherman, TX 75092
|
- sq. feet
|
- baths - beds |
show details | |

|
#30
Baker Ridge Rd
Sherman, TX 75090
|
2,040 sq. feet
|
- baths - beds |
show details |
| Photo | Address | Area | Beds / Baths | Price | Details |
|---|---|---|---|---|---|

|
#31
S Travis St
Sherman, TX 75090
|
- sq. feet
|
- baths - beds |
show details | |

|
#32
N Sam Rayburn Fwy Apt 123
Sherman, TX 75090
|
- sq. feet
|
- baths - beds |
show details | |

|
#33
E Alma Ave
Sherman, TX 75090
|
1,221 sq. feet
|
- baths - beds |
show details | |

|
#34
N Travis St Apt 231
Sherman, TX 75092
|
- sq. feet
|
- baths - beds |
show details | |

|
#35
High Country Rd
Sherman, TX 75092
|
- sq. feet
|
- baths - beds |
show details | |

|
#36
Park Place, 2228
Sherman, TX 75092
|
- sq. feet
|
- baths - beds |
show details | |

|
#37
N Sam Rayburn Fwy Apt 209
Sherman, TX 75090
|
- sq. feet
|
- baths - beds |
show details | |

|
#38
N Highland Ave
Sherman, TX 75092
|
- sq. feet
|
- baths - beds |
show details | |

|
#39
W Moore St # H1113
Sherman, TX 75092
|
- sq. feet
|
- baths - beds |
show details | |

|
#40
N Fm 1417 Apt 1518
Sherman, TX 75092
|
- sq. feet
|
- baths - beds |
show details |
| Photo | Address | Area | Beds / Baths | Price | Details |
|---|---|---|---|---|---|

|
#41
Rolling Hills Dr
Sherman, TX 75092
|
1,370 sq. feet
|
- baths - beds |
show details | |

|
#42
W Belden St
Sherman, TX 75092
|
- sq. feet
|
- baths - beds |
show details | |

|
#43
Sherbrooke Pl
Sherman, TX 75092
|
2,236 sq. feet
|
- baths - beds |
show details | |

|
#44
N Travis St # 13305
Sherman, TX 75092
|
- sq. feet
|
- baths - beds |
show details | |

|
#45
N Travis St Apt 725
Sherman, TX 75092
|
- sq. feet
|
- baths - beds |
show details | |

|
#46
Monett Dr
Sherman, TX 75092
|
1,574 sq. feet
|
- baths - beds |
show details | |

|
#47
E Fm 1417 # 1113
Sherman, TX 75090
|
- sq. feet
|
- baths - beds |
show details | |

|
#48
Yorkshire Dr
Sherman, TX 75092
|
- sq. feet
|
- baths - beds |
show details | |

|
#49
Delmar Dr
Sherman, TX 75092
|
- sq. feet
|
- baths - beds |
show details | |

|
Check over 1 million property listings on Foreclosure.com!
|
browse all offers | |||

Latest news about housing in Sherman, TX collected exclusively by city-data.com from local newspapers, TV, and radio stations

 | Why are houses in Houston so inexpensive? (83 replies) |
| Prosper home values (58 replies) |
| Dallas Housing Market (217 replies) |
| The DFW housing market is NOT sustainable (685 replies) |
| Sherman, TX - Bel Air, Heritage Ranch (26 replies) |
| Going crazy looking for a house in DFW (45 replies) |
Median year apartment built: 1981
Household type by relationship:
Households: 46,020- Male householders: 7,979 (2,031 living alone), Female householders: 9,571 (3,260 living alone)
7,900 spouses (7,687 opposite-sex spouses), 1,035 unmarried partners, (1,035 opposite-sex unmarried partners), 13,483 children (12,572 natural, 295 adopted, 615 stepchildren), 1,276 grandchildren, 526 brothers or sisters, 798 parents, 24 foster children, 637 other relatives, 1,040 non-relatives
- In group quarters: 1,746
Size of family households: 5,794 2-persons, 2,220 3-persons, 1,786 4-persons, 1,008 5-persons, 319 6-persons, 186 7-or-more-persons.
Size of nonfamily households: 5,378 1-person, 596 2-persons, 127 3-persons, 1 4-persons.
6,532 married couples with children.
3,260 single-parent households (475 men, 2,785 women).
80.1% of residents of Sherman speak English at home.
16.0% of residents speak Spanish at home (60% speak English very well, 20% speak English well, 17% speak English not well, 4% don't speak English at all).
2.0% of residents speak other Indo-European language at home (86% speak English very well, 14% speak English well).
1.3% of residents speak Asian or Pacific Island language at home (44% speak English very well, 24% speak English well, 13% speak English not well, 19% don't speak English at all).
0.3% of residents speak other language at home (100% speak English very well).
Foreign born population: 6,425 (14.0%)
(36.9% of them are naturalized citizens)
| Here: | 6.1 |
| State: | 6.3 |
| Here: | 4.2 |
| State: | 4.0 |
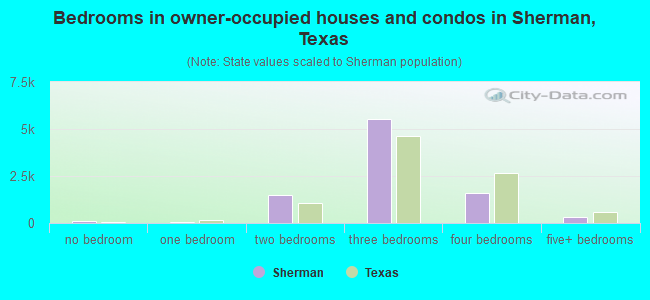
- Bedrooms in owner-occupied houses and condos in Sherman, Texas
- 116no bedroom
- 701 bedroom
- 1,5092 bedrooms
- 5,5453 bedrooms
- 1,5984 bedrooms
- 3145+ bedrooms
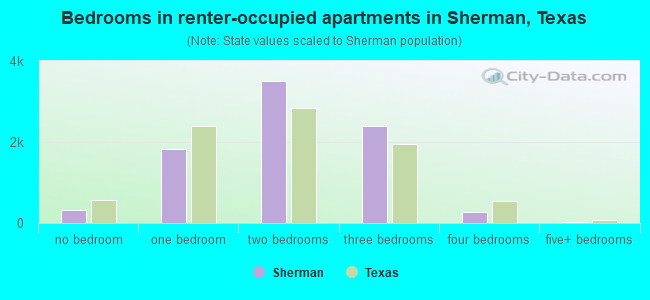
- Bedrooms in renter-occupied apartments in Sherman, Texas
- 326no bedroom
- 1,8331 bedroom
- 3,5152 bedrooms
- 2,3893 bedrooms
- 2764 bedrooms
- 265+ bedrooms
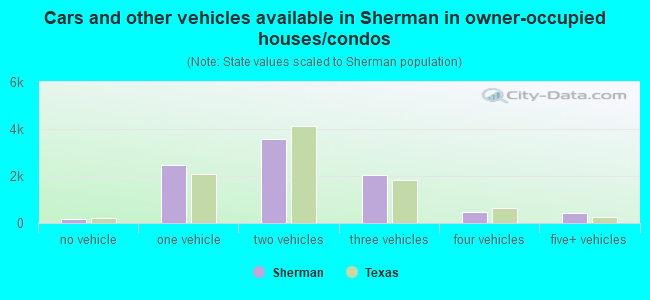
- Cars and other vehicles available in Sherman in owner-occupied houses/condos
- 173no vehicle
- 2,4541 vehicle
- 3,5692 vehicles
- 2,0623 vehicles
- 4814 vehicles
- 4135+ vehicles
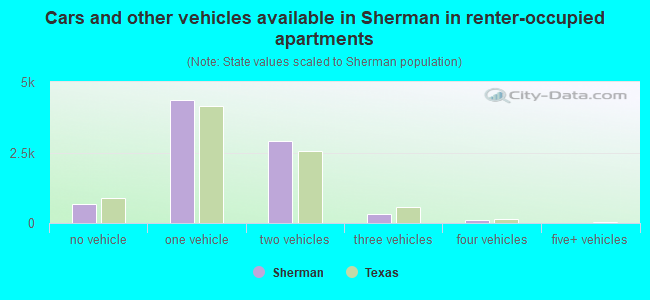
- Cars and other vehicles available in Sherman in renter-occupied apartments
- 669no vehicle
- 4,3671 vehicle
- 2,9072 vehicles
- 3103 vehicles
- 1134 vehicles
- 05+ vehicles
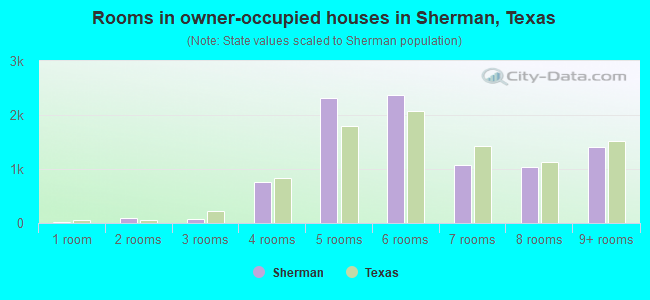
- Rooms in owner-occupied houses in Sherman, Texas
- 141 room
- 892 rooms
- 683 rooms
- 7644 rooms
- 2,3155 rooms
- 2,3716 rooms
- 1,0737 rooms
- 1,0458 rooms
- 1,4149+ rooms
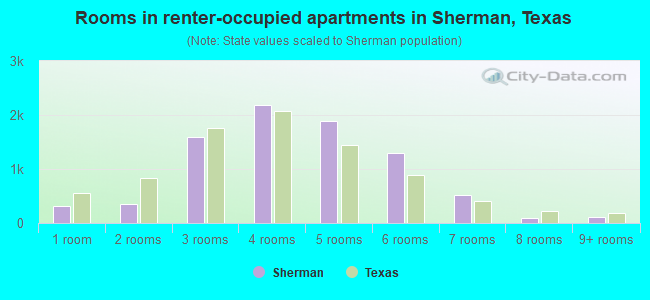
- Rooms in renter-occupied apartments in Sherman, Texas
- 3161 room
- 3492 rooms
- 1,5933 rooms
- 2,1894 rooms
- 1,8935 rooms
- 1,2986 rooms
- 5217 rooms
- 878 rooms
- 1209+ rooms
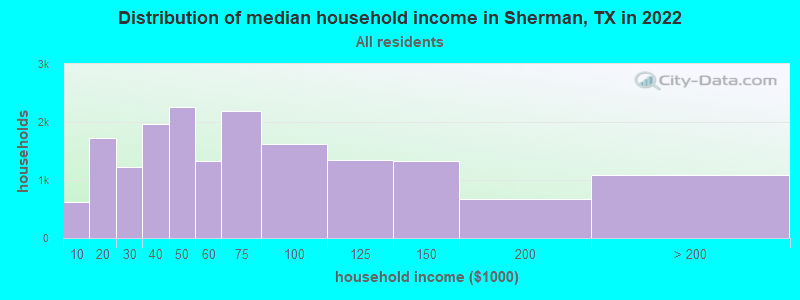
Sherman, TX household income distribution

- 620Less than $10,000
- 1,725$10,000 to $19,999
- 1,229$20,000 to $29,999
- 1,961$30,000 to $39,999
- 2,256$40,000 to $49,999
- 1,323$50,000 to $59,999
- 2,192$60,000 to $74,999
- 1,614$75,000 to $99,999
- 1,344$100,000 to $124,999
- 1,325$125,000 to $149,999
- 680$150,000 to $199,999
- 1,078$200,000 or more
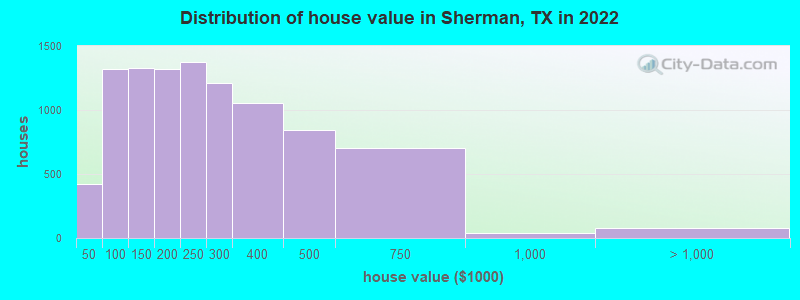
Home value of owner - occupied houses in 2022 in Sherman, TX
-
- 28Less than $10,000
- 25$10,000 to $14,999
- 42$15,000 to $19,999
- 85$20,000 to $24,999
- 74$25,000 to $29,999
- 22$30,000 to $34,999
- 139$40,000 to $49,999
- 187$50,000 to $59,999
- 425$60,000 to $69,999
- 81$70,000 to $79,999
- 223$80,000 to $89,999
- 262$90,000 to $99,999
- 841$100,000 to $124,999
- 486$125,000 to $149,999
- 798$150,000 to $174,999
- 525$175,000 to $199,999
- 1,372$200,000 to $249,999
- 1,209$250,000 to $299,999
- 1,056$300,000 to $399,999
- 844$400,000 to $499,999
- 700$500,000 to $749,999
- 39$750,000 to $999,999
- 25$1,000,000 to $1,499,999
- 51$2,000,000 or more
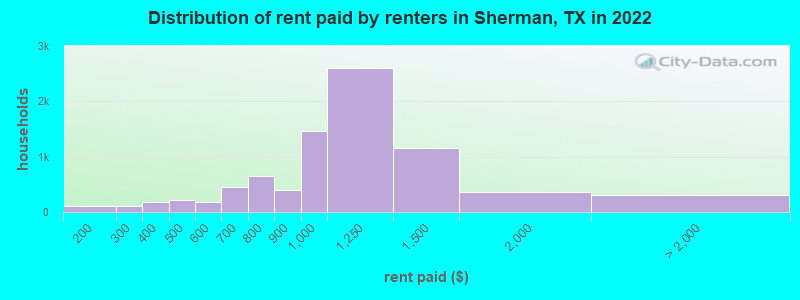
Rent paid by renters in 2022 in Sherman, TX
-
- 6Less than $100
- 47$100 to $149
- 55$150 to $199
- 95$200 to $249
- 13$250 to $299
- 124$300 to $349
- 51$350 to $399
- 57$400 to $449
- 156$450 to $499
- 144$500 to $549
- 27$550 to $599
- 135$600 to $649
- 324$650 to $699
- 248$700 to $749
- 395$750 to $799
- 400$800 to $899
- 1,456$900 to $999
- 2,607$1,000 to $1,249
- 1,163$1,250 to $1,499
- 366$1,500 to $1,999
- 154$2,000 to $2,499
- 24$3,500 or more
- 129No cash rent
Percentage of workers working in this county: 82.9%
Number of people working at home: 2,397 (10.8% of all workers)
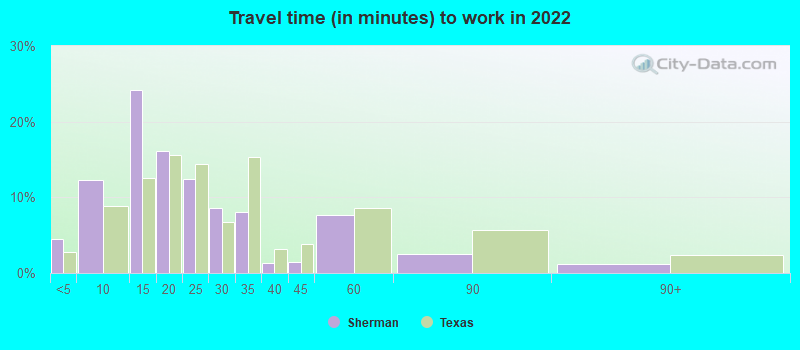
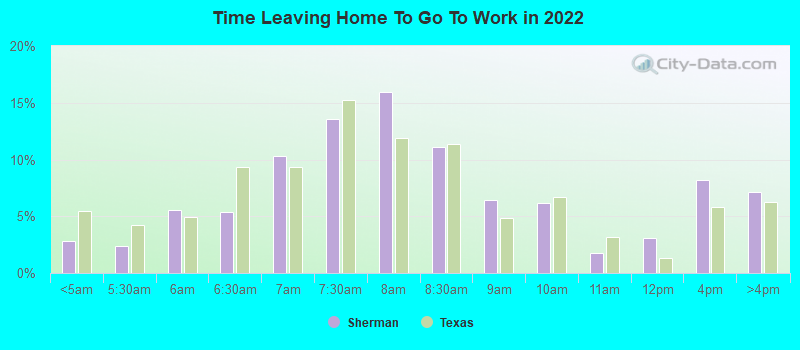
Travel time to work (commute)
- Less than 5 minutes: 674
- 5 to 9 minutes: 3,421
- 10 to 14 minutes: 5,881
- 15 to 19 minutes: 3,389
- 20 to 24 minutes: 1,375
- 25 to 29 minutes: 526
- 30 to 34 minutes: 1,129
- 35 to 39 minutes: 495
- 40 to 44 minutes: 514
- 45 to 59 minutes: 1,058
- 60 to 89 minutes: 737
- 90 or more minutes: 488
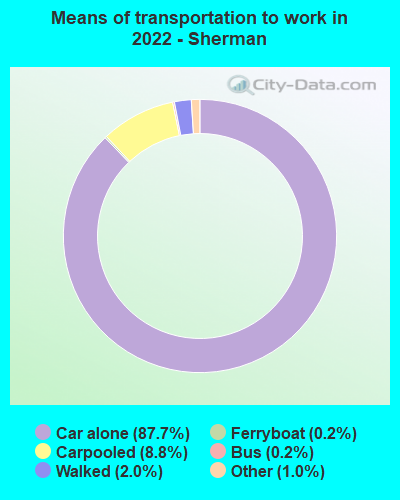
Means of transportation to work:
- Drove a car alone: 24,024 (78.2%)
- Carpooled: 2,632 (8.6%)
- Bus: 55 (0.2%)
- Ferryboat: 54 (0.2%)
- Taxi: 334 (1.1%)
- Bicycle: 25 (0.1%)
- Walked: 574 (1.9%)
- Worked at home: 2,397 (7.8%)
- Unemployment by race in 2022
- Unemployment rate for White non-Hispanic residents
- 2.6%Males
- 2.4%Females
- Unemployment rate for Black residents
- 3.3%Males
- 7.6%Females
- Unemployment rate for Asian residents
- 11.6%Females
- Unemployment rate for other race residents
- 7.8%Males
- Unemployment rate for two or more race residents
- 3.0%Males
- 9.4%Females
- Unemployment rate for Hispanic or Latino residents
- 3.5%Males
- 1.6%Females
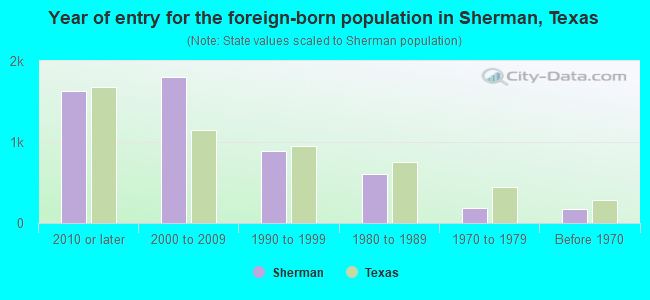
- Year of entry for the foreign-born population in Sherman, Texas
- 1,6292010 or later
- 1,7972000 to 2009
- 8911990 to 1999
- 6051980 to 1989
- 1801970 to 1979
- 172Before 1970
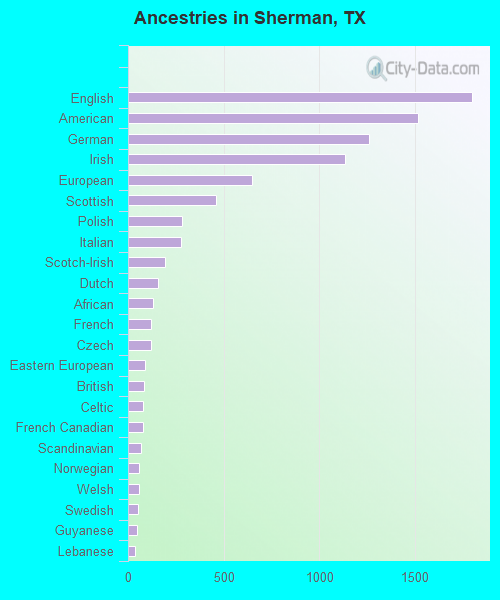
First ancestries reported:
- English: 1,798 (8.5%)
- American: 1,517 (7.2%)
- German: 1,262 (6.0%)
- Irish: 1,133 (5.3%)
- European: 649 (3.1%)
- Scottish: 458 (2.2%)
- Polish: 282 (1.3%)
- Italian: 276 (1.3%)
- Scotch-Irish: 195 (0.9%)
- Dutch: 155 (0.7%)
- African: 129 (0.6%)
- French: 120 (0.6%)
- Czech: 118 (0.6%)
- Eastern European: 91 (0.4%)
- British: 85 (0.4%)
- Celtic: 78 (0.4%)
- French Canadian: 78 (0.4%)
- Scandinavian: 69 (0.3%)
- Norwegian: 60 (0.3%)
- Welsh: 60 (0.3%)
- Swedish: 50 (0.2%)
- Guyanese: 46 (0.2%)
- Lebanese: 34 (0.2%)
- Canadian: 6 (0.03%)
Most common places of birth for foreign-born residents (%):
| Sherman: | 58.6% (3,017) |
| Texas: | 48.4% (2,411,723) |
| Sherman: | 5.5% (282) |
| Texas: | 4.5% (224,455) |
| Sherman: | 4.3% (222) |
| Texas: | 0.8% (37,989) |
| Sherman: | 4.0% (207) |
| Texas: | 6.1% (306,347) |
| Sherman: | 3.4% (176) |
| Texas: | 0.2% (12,200) |
| Sherman: | 3.2% (167) |
| Texas: | 1.1% (55,371) |
| Sherman: | 2.0% (105) |
| Texas: | 1.2% (60,172) |
| Sherman: | 1.8% (92) |
| Texas: | 0.2% (11,205) |
| Sherman: | 1.7% (88) |
| Texas: | 0.6% (27,480) |
Place of birth for U.S.-born residents:
- This state: 27,480
- Other state: 12,272
- Northeast: 1,029
- Midwest: 2,853
- South: 3,824
- West: 4,718
81.1% of Sherman residents lived in the same house 1 years ago.
Out of people who lived in different houses, 28.1% lived in this county.
Out of people who lived in different counties, 79.3% lived in Texas.
| Sherman: | 81.1% |
| State average: | 85.7% |
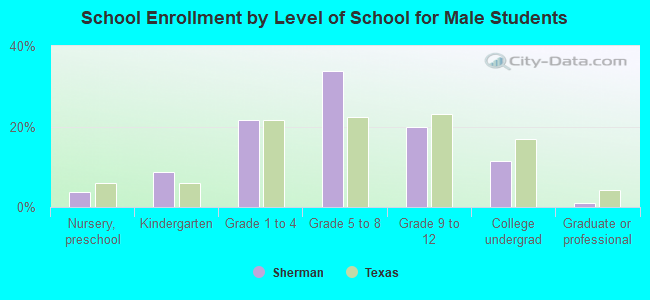
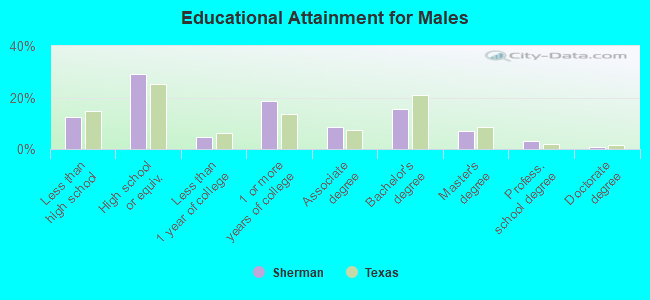
Education attainment for males 25 years and older:
- No schooling: 160
- Nursery to 4th grade: 79
- 5th and 6th grade: 161
- 7th and 8th grade: 325
- 9th grade: 124
- 10th grade: 254
- 11th grade: 174
- 12th grade, no diploma: 492
- High school graduate (or equivalency): 4,165
- Less than 1 year of college: 662
- Some college more than 1 year, no degree: 2,689
- Associate degree: 1,230
- Bachelor's degree: 2,201
- Master's degree: 1,017
- Professional school degree: 468
- Doctorate degree: 121
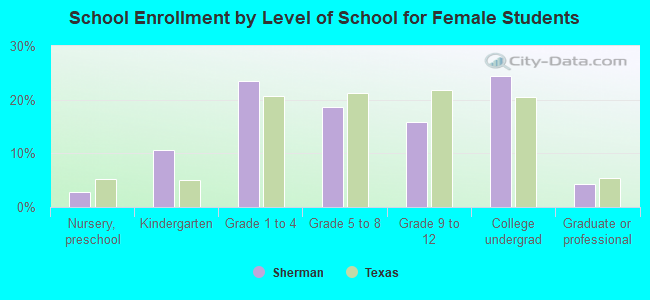
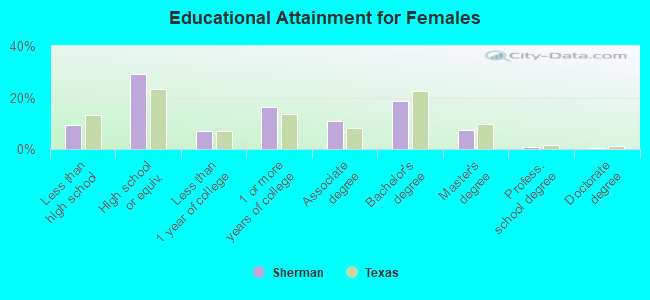
Education attainment for females 25 years and older:
- No schooling: 223
- Nursery to 4th grade: 38
- 5th and 6th grade: 94
- 7th and 8th grade: 254
- 9th grade: 523
- 10th grade: 169
- 11th grade: 59
- 12th grade, no diploma: 129
- High school graduate (or equivalency): 4,630
- Less than 1 year of college: 1,099
- Some college more than 1 year, no degree: 2,613
- Associate degree: 1,758
- Bachelor's degree: 2,973
- Master's degree: 1,152
- Professional school degree: 136
- Doctorate degree: 55
Housing units in structures:
- One, detached: 12,676
- One, attached: 501
- Two: 664
- 3 or 4: 967
- 5 to 9: 1,575
- 10 to 19: 1,198
- 20 to 49: 339
- 50 or more: 839
- Mobile homes: 464
- Boats, RVs, vans, etc.: 4
Housing units lacking complete kitchen facilities in 2022: 2.1%
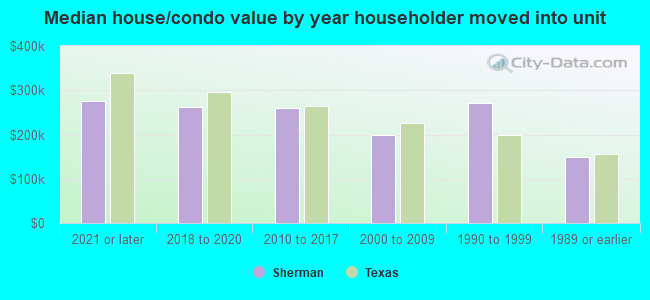
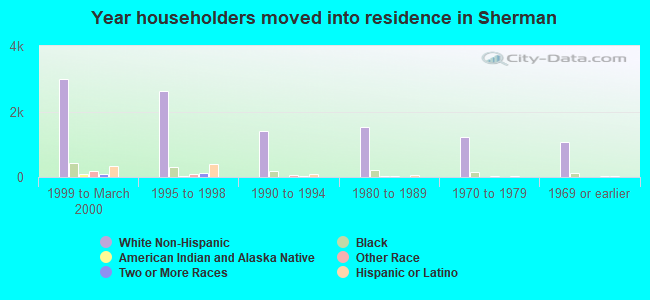
House/condo owner moved in on average 11 years ago
Renter moved in on average 3 years ago
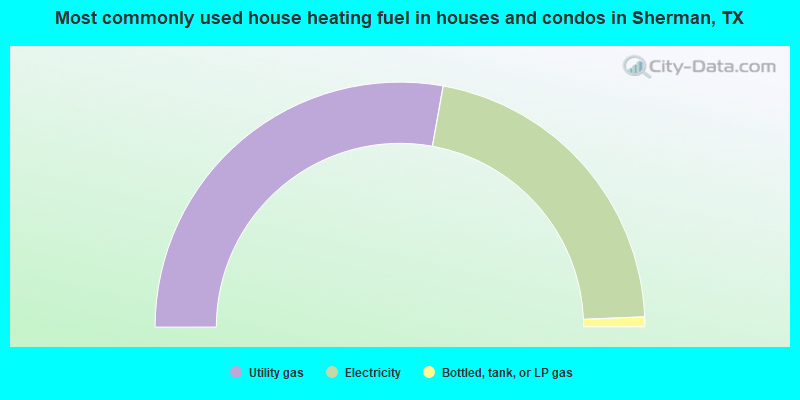
- 55.6%Utility gas
- 43.0%Electricity
- 1.3%Bottled, tank, or LP gas
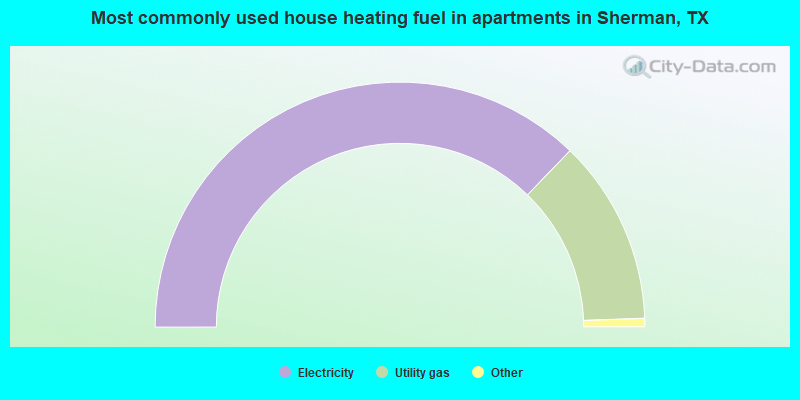
- 74.5%Electricity
- 24.5%Utility gas
- 0.5%Bottled, tank, or LP gas
- 0.4%Fuel oil, kerosene, etc.
- 0.1%Wood
Private vs. public school enrollment:
| Here: | 1.8% |
| Texas: | 8.8% |
| Here: | 5.3% |
| Texas: | 8.0% |
| Here: | 38.4% |
| Texas: | 16.2% |