Sherman, Texas Submit your own pictures of this city and show them to the world
OSM Map
General Map
Google Map
MSN Map
OSM Map
General Map
Google Map
MSN Map
OSM Map
General Map
Google Map
MSN Map
OSM Map
General Map
Google Map
MSN Map
Please wait while loading the map...
Population in 2022: 45,264 (97% urban, 3% rural). Population change since 2000: +29.0%Males: 22,094 Females: 23,170
March 2022 cost of living index in Sherman: 86.4 (less than average, U.S. average is 100) Percentage of residents living in poverty in 2022: 12.8%for White Non-Hispanic residents , 26.7% for Black residents , 12.3% for Hispanic or Latino residents , 15.9% for American Indian residents , 1.3% for other race residents , 22.5% for two or more races residents )
Profiles of local businesses
Business Search - 14 Million verified businesses
Data:
Median household income ($)
Median household income (% change since 2000)
Household income diversity
Ratio of average income to average house value (%)
Ratio of average income to average rent
Median household income ($) - White
Median household income ($) - Black or African American
Median household income ($) - Asian
Median household income ($) - Hispanic or Latino
Median household income ($) - American Indian and Alaska Native
Median household income ($) - Multirace
Median household income ($) - Other Race
Median household income for houses/condos with a mortgage ($)
Median household income for apartments without a mortgage ($)
Races - White alone (%)
Races - White alone (% change since 2000)
Races - Black alone (%)
Races - Black alone (% change since 2000)
Races - American Indian alone (%)
Races - American Indian alone (% change since 2000)
Races - Asian alone (%)
Races - Asian alone (% change since 2000)
Races - Hispanic (%)
Races - Hispanic (% change since 2000)
Races - Native Hawaiian and Other Pacific Islander alone (%)
Races - Native Hawaiian and Other Pacific Islander alone (% change since 2000)
Races - Two or more races (%)
Races - Two or more races (% change since 2000)
Races - Other race alone (%)
Races - Other race alone (% change since 2000)
Racial diversity
Unemployment (%)
Unemployment (% change since 2000)
Unemployment (%) - White
Unemployment (%) - Black or African American
Unemployment (%) - Asian
Unemployment (%) - Hispanic or Latino
Unemployment (%) - American Indian and Alaska Native
Unemployment (%) - Multirace
Unemployment (%) - Other Race
Population density (people per square mile)
Population - Males (%)
Population - Females (%)
Population - Males (%) - White
Population - Males (%) - Black or African American
Population - Males (%) - Asian
Population - Males (%) - Hispanic or Latino
Population - Males (%) - American Indian and Alaska Native
Population - Males (%) - Multirace
Population - Males (%) - Other Race
Population - Females (%) - White
Population - Females (%) - Black or African American
Population - Females (%) - Asian
Population - Females (%) - Hispanic or Latino
Population - Females (%) - American Indian and Alaska Native
Population - Females (%) - Multirace
Population - Females (%) - Other Race
Coronavirus confirmed cases (Apr 27, 2024)
Deaths caused by coronavirus (Apr 27, 2024)
Coronavirus confirmed cases (per 100k population) (Apr 27, 2024)
Deaths caused by coronavirus (per 100k population) (Apr 27, 2024)
Daily increase in number of cases (Apr 27, 2024)
Weekly increase in number of cases (Apr 27, 2024)
Cases doubled (in days) (Apr 27, 2024)
Hospitalized patients (Apr 18, 2022)
Negative test results (Apr 18, 2022)
Total test results (Apr 18, 2022)
COVID Vaccine doses distributed (per 100k population) (Sep 19, 2023)
COVID Vaccine doses administered (per 100k population) (Sep 19, 2023)
COVID Vaccine doses distributed (Sep 19, 2023)
COVID Vaccine doses administered (Sep 19, 2023)
Likely homosexual households (%)
Likely homosexual households (% change since 2000)
Likely homosexual households - Lesbian couples (%)
Likely homosexual households - Lesbian couples (% change since 2000)
Likely homosexual households - Gay men (%)
Likely homosexual households - Gay men (% change since 2000)
Cost of living index
Median gross rent ($)
Median contract rent ($)
Median monthly housing costs ($)
Median house or condo value ($)
Median house or condo value ($ change since 2000)
Mean house or condo value by units in structure - 1, detached ($)
Mean house or condo value by units in structure - 1, attached ($)
Mean house or condo value by units in structure - 2 ($)
Mean house or condo value by units in structure by units in structure - 3 or 4 ($)
Mean house or condo value by units in structure - 5 or more ($)
Mean house or condo value by units in structure - Boat, RV, van, etc. ($)
Mean house or condo value by units in structure - Mobile home ($)
Median house or condo value ($) - White
Median house or condo value ($) - Black or African American
Median house or condo value ($) - Asian
Median house or condo value ($) - Hispanic or Latino
Median house or condo value ($) - American Indian and Alaska Native
Median house or condo value ($) - Multirace
Median house or condo value ($) - Other Race
Median resident age
Resident age diversity
Median resident age - Males
Median resident age - Females
Median resident age - White
Median resident age - Black or African American
Median resident age - Asian
Median resident age - Hispanic or Latino
Median resident age - American Indian and Alaska Native
Median resident age - Multirace
Median resident age - Other Race
Median resident age - Males - White
Median resident age - Males - Black or African American
Median resident age - Males - Asian
Median resident age - Males - Hispanic or Latino
Median resident age - Males - American Indian and Alaska Native
Median resident age - Males - Multirace
Median resident age - Males - Other Race
Median resident age - Females - White
Median resident age - Females - Black or African American
Median resident age - Females - Asian
Median resident age - Females - Hispanic or Latino
Median resident age - Females - American Indian and Alaska Native
Median resident age - Females - Multirace
Median resident age - Females - Other Race
Commute - mean travel time to work (minutes)
Travel time to work - Less than 5 minutes (%)
Travel time to work - Less than 5 minutes (% change since 2000)
Travel time to work - 5 to 9 minutes (%)
Travel time to work - 5 to 9 minutes (% change since 2000)
Travel time to work - 10 to 19 minutes (%)
Travel time to work - 10 to 19 minutes (% change since 2000)
Travel time to work - 20 to 29 minutes (%)
Travel time to work - 20 to 29 minutes (% change since 2000)
Travel time to work - 30 to 39 minutes (%)
Travel time to work - 30 to 39 minutes (% change since 2000)
Travel time to work - 40 to 59 minutes (%)
Travel time to work - 40 to 59 minutes (% change since 2000)
Travel time to work - 60 to 89 minutes (%)
Travel time to work - 60 to 89 minutes (% change since 2000)
Travel time to work - 90 or more minutes (%)
Travel time to work - 90 or more minutes (% change since 2000)
Marital status - Never married (%)
Marital status - Now married (%)
Marital status - Separated (%)
Marital status - Widowed (%)
Marital status - Divorced (%)
Median family income ($)
Median family income (% change since 2000)
Median non-family income ($)
Median non-family income (% change since 2000)
Median per capita income ($)
Median per capita income (% change since 2000)
Median family income ($) - White
Median family income ($) - Black or African American
Median family income ($) - Asian
Median family income ($) - Hispanic or Latino
Median family income ($) - American Indian and Alaska Native
Median family income ($) - Multirace
Median family income ($) - Other Race
Median year house/condo built
Median year apartment built
Year house built - Built 2005 or later (%)
Year house built - Built 2000 to 2004 (%)
Year house built - Built 1990 to 1999 (%)
Year house built - Built 1980 to 1989 (%)
Year house built - Built 1970 to 1979 (%)
Year house built - Built 1960 to 1969 (%)
Year house built - Built 1950 to 1959 (%)
Year house built - Built 1940 to 1949 (%)
Year house built - Built 1939 or earlier (%)
Average household size
Household density (households per square mile)
Average household size - White
Average household size - Black or African American
Average household size - Asian
Average household size - Hispanic or Latino
Average household size - American Indian and Alaska Native
Average household size - Multirace
Average household size - Other Race
Occupied housing units (%)
Vacant housing units (%)
Owner occupied housing units (%)
Renter occupied housing units (%)
Vacancy status - For rent (%)
Vacancy status - For sale only (%)
Vacancy status - Rented or sold, not occupied (%)
Vacancy status - For seasonal, recreational, or occasional use (%)
Vacancy status - For migrant workers (%)
Vacancy status - Other vacant (%)
Residents with income below the poverty level (%)
Residents with income below 50% of the poverty level (%)
Children below poverty level (%)
Poor families by family type - Married-couple family (%)
Poor families by family type - Male, no wife present (%)
Poor families by family type - Female, no husband present (%)
Poverty status for native-born residents (%)
Poverty status for foreign-born residents (%)
Poverty among high school graduates not in families (%)
Poverty among people who did not graduate high school not in families (%)
Residents with income below the poverty level (%) - White
Residents with income below the poverty level (%) - Black or African American
Residents with income below the poverty level (%) - Asian
Residents with income below the poverty level (%) - Hispanic or Latino
Residents with income below the poverty level (%) - American Indian and Alaska Native
Residents with income below the poverty level (%) - Multirace
Residents with income below the poverty level (%) - Other Race
Air pollution - Air Quality Index (AQI)
Air pollution - CO
Air pollution - NO2
Air pollution - SO2
Air pollution - Ozone
Air pollution - PM10
Air pollution - PM25
Air pollution - Pb
Crime - Murders per 100,000 population
Crime - Rapes per 100,000 population
Crime - Robberies per 100,000 population
Crime - Assaults per 100,000 population
Crime - Burglaries per 100,000 population
Crime - Thefts per 100,000 population
Crime - Auto thefts per 100,000 population
Crime - Arson per 100,000 population
Crime - City-data.com crime index
Crime - Violent crime index
Crime - Property crime index
Crime - Murders per 100,000 population (5 year average)
Crime - Rapes per 100,000 population (5 year average)
Crime - Robberies per 100,000 population (5 year average)
Crime - Assaults per 100,000 population (5 year average)
Crime - Burglaries per 100,000 population (5 year average)
Crime - Thefts per 100,000 population (5 year average)
Crime - Auto thefts per 100,000 population (5 year average)
Crime - Arson per 100,000 population (5 year average)
Crime - City-data.com crime index (5 year average)
Crime - Violent crime index (5 year average)
Crime - Property crime index (5 year average)
1996 Presidential Elections Results (%) - Democratic Party (Clinton)
1996 Presidential Elections Results (%) - Republican Party (Dole)
1996 Presidential Elections Results (%) - Other
2000 Presidential Elections Results (%) - Democratic Party (Gore)
2000 Presidential Elections Results (%) - Republican Party (Bush)
2000 Presidential Elections Results (%) - Other
2004 Presidential Elections Results (%) - Democratic Party (Kerry)
2004 Presidential Elections Results (%) - Republican Party (Bush)
2004 Presidential Elections Results (%) - Other
2008 Presidential Elections Results (%) - Democratic Party (Obama)
2008 Presidential Elections Results (%) - Republican Party (McCain)
2008 Presidential Elections Results (%) - Other
2012 Presidential Elections Results (%) - Democratic Party (Obama)
2012 Presidential Elections Results (%) - Republican Party (Romney)
2012 Presidential Elections Results (%) - Other
2016 Presidential Elections Results (%) - Democratic Party (Clinton)
2016 Presidential Elections Results (%) - Republican Party (Trump)
2016 Presidential Elections Results (%) - Other
2020 Presidential Elections Results (%) - Democratic Party (Biden)
2020 Presidential Elections Results (%) - Republican Party (Trump)
2020 Presidential Elections Results (%) - Other
Ancestries Reported - Arab (%)
Ancestries Reported - Czech (%)
Ancestries Reported - Danish (%)
Ancestries Reported - Dutch (%)
Ancestries Reported - English (%)
Ancestries Reported - French (%)
Ancestries Reported - French Canadian (%)
Ancestries Reported - German (%)
Ancestries Reported - Greek (%)
Ancestries Reported - Hungarian (%)
Ancestries Reported - Irish (%)
Ancestries Reported - Italian (%)
Ancestries Reported - Lithuanian (%)
Ancestries Reported - Norwegian (%)
Ancestries Reported - Polish (%)
Ancestries Reported - Portuguese (%)
Ancestries Reported - Russian (%)
Ancestries Reported - Scotch-Irish (%)
Ancestries Reported - Scottish (%)
Ancestries Reported - Slovak (%)
Ancestries Reported - Subsaharan African (%)
Ancestries Reported - Swedish (%)
Ancestries Reported - Swiss (%)
Ancestries Reported - Ukrainian (%)
Ancestries Reported - United States (%)
Ancestries Reported - Welsh (%)
Ancestries Reported - West Indian (%)
Ancestries Reported - Other (%)
Educational Attainment - No schooling completed (%)
Educational Attainment - Less than high school (%)
Educational Attainment - High school or equivalent (%)
Educational Attainment - Less than 1 year of college (%)
Educational Attainment - 1 or more years of college (%)
Educational Attainment - Associate degree (%)
Educational Attainment - Bachelor's degree (%)
Educational Attainment - Master's degree (%)
Educational Attainment - Professional school degree (%)
Educational Attainment - Doctorate degree (%)
School Enrollment - Nursery, preschool (%)
School Enrollment - Kindergarten (%)
School Enrollment - Grade 1 to 4 (%)
School Enrollment - Grade 5 to 8 (%)
School Enrollment - Grade 9 to 12 (%)
School Enrollment - College undergrad (%)
School Enrollment - Graduate or professional (%)
School Enrollment - Not enrolled in school (%)
School enrollment - Public schools (%)
School enrollment - Private schools (%)
School enrollment - Not enrolled (%)
Median number of rooms in houses and condos
Median number of rooms in apartments
Housing units lacking complete plumbing facilities (%)
Housing units lacking complete kitchen facilities (%)
Density of houses
Urban houses (%)
Rural houses (%)
Households with people 60 years and over (%)
Households with people 65 years and over (%)
Households with people 75 years and over (%)
Households with one or more nonrelatives (%)
Households with no nonrelatives (%)
Population in households (%)
Family households (%)
Nonfamily households (%)
Population in families (%)
Family households with own children (%)
Median number of bedrooms in owner occupied houses
Mean number of bedrooms in owner occupied houses
Median number of bedrooms in renter occupied houses
Mean number of bedrooms in renter occupied houses
Median number of vehichles in owner occupied houses
Mean number of vehichles in owner occupied houses
Median number of vehichles in renter occupied houses
Mean number of vehichles in renter occupied houses
Mortgage status - with mortgage (%)
Mortgage status - with second mortgage (%)
Mortgage status - with home equity loan (%)
Mortgage status - with both second mortgage and home equity loan (%)
Mortgage status - without a mortgage (%)
Average family size
Average family size - White
Average family size - Black or African American
Average family size - Asian
Average family size - Hispanic or Latino
Average family size - American Indian and Alaska Native
Average family size - Multirace
Average family size - Other Race
Geographical mobility - Same house 1 year ago (%)
Geographical mobility - Moved within same county (%)
Geographical mobility - Moved from different county within same state (%)
Geographical mobility - Moved from different state (%)
Geographical mobility - Moved from abroad (%)
Place of birth - Born in state of residence (%)
Place of birth - Born in other state (%)
Place of birth - Native, outside of US (%)
Place of birth - Foreign born (%)
Housing units in structures - 1, detached (%)
Housing units in structures - 1, attached (%)
Housing units in structures - 2 (%)
Housing units in structures - 3 or 4 (%)
Housing units in structures - 5 to 9 (%)
Housing units in structures - 10 to 19 (%)
Housing units in structures - 20 to 49 (%)
Housing units in structures - 50 or more (%)
Housing units in structures - Mobile home (%)
Housing units in structures - Boat, RV, van, etc. (%)
House/condo owner moved in on average (years ago)
Renter moved in on average (years ago)
Year householder moved into unit - Moved in 1999 to March 2000 (%)
Year householder moved into unit - Moved in 1995 to 1998 (%)
Year householder moved into unit - Moved in 1990 to 1994 (%)
Year householder moved into unit - Moved in 1980 to 1989 (%)
Year householder moved into unit - Moved in 1970 to 1979 (%)
Year householder moved into unit - Moved in 1969 or earlier (%)
Means of transportation to work - Drove car alone (%)
Means of transportation to work - Carpooled (%)
Means of transportation to work - Public transportation (%)
Means of transportation to work - Bus or trolley bus (%)
Means of transportation to work - Streetcar or trolley car (%)
Means of transportation to work - Subway or elevated (%)
Means of transportation to work - Railroad (%)
Means of transportation to work - Ferryboat (%)
Means of transportation to work - Taxicab (%)
Means of transportation to work - Motorcycle (%)
Means of transportation to work - Bicycle (%)
Means of transportation to work - Walked (%)
Means of transportation to work - Other means (%)
Working at home (%)
Industry diversity
Most Common Industries - Agriculture, forestry, fishing and hunting, and mining (%)
Most Common Industries - Agriculture, forestry, fishing and hunting (%)
Most Common Industries - Mining, quarrying, and oil and gas extraction (%)
Most Common Industries - Construction (%)
Most Common Industries - Manufacturing (%)
Most Common Industries - Wholesale trade (%)
Most Common Industries - Retail trade (%)
Most Common Industries - Transportation and warehousing, and utilities (%)
Most Common Industries - Transportation and warehousing (%)
Most Common Industries - Utilities (%)
Most Common Industries - Information (%)
Most Common Industries - Finance and insurance, and real estate and rental and leasing (%)
Most Common Industries - Finance and insurance (%)
Most Common Industries - Real estate and rental and leasing (%)
Most Common Industries - Professional, scientific, and management, and administrative and waste management services (%)
Most Common Industries - Professional, scientific, and technical services (%)
Most Common Industries - Management of companies and enterprises (%)
Most Common Industries - Administrative and support and waste management services (%)
Most Common Industries - Educational services, and health care and social assistance (%)
Most Common Industries - Educational services (%)
Most Common Industries - Health care and social assistance (%)
Most Common Industries - Arts, entertainment, and recreation, and accommodation and food services (%)
Most Common Industries - Arts, entertainment, and recreation (%)
Most Common Industries - Accommodation and food services (%)
Most Common Industries - Other services, except public administration (%)
Most Common Industries - Public administration (%)
Occupation diversity
Most Common Occupations - Management, business, science, and arts occupations (%)
Most Common Occupations - Management, business, and financial occupations (%)
Most Common Occupations - Management occupations (%)
Most Common Occupations - Business and financial operations occupations (%)
Most Common Occupations - Computer, engineering, and science occupations (%)
Most Common Occupations - Computer and mathematical occupations (%)
Most Common Occupations - Architecture and engineering occupations (%)
Most Common Occupations - Life, physical, and social science occupations (%)
Most Common Occupations - Education, legal, community service, arts, and media occupations (%)
Most Common Occupations - Community and social service occupations (%)
Most Common Occupations - Legal occupations (%)
Most Common Occupations - Education, training, and library occupations (%)
Most Common Occupations - Arts, design, entertainment, sports, and media occupations (%)
Most Common Occupations - Healthcare practitioners and technical occupations (%)
Most Common Occupations - Health diagnosing and treating practitioners and other technical occupations (%)
Most Common Occupations - Health technologists and technicians (%)
Most Common Occupations - Service occupations (%)
Most Common Occupations - Healthcare support occupations (%)
Most Common Occupations - Protective service occupations (%)
Most Common Occupations - Fire fighting and prevention, and other protective service workers including supervisors (%)
Most Common Occupations - Law enforcement workers including supervisors (%)
Most Common Occupations - Food preparation and serving related occupations (%)
Most Common Occupations - Building and grounds cleaning and maintenance occupations (%)
Most Common Occupations - Personal care and service occupations (%)
Most Common Occupations - Sales and office occupations (%)
Most Common Occupations - Sales and related occupations (%)
Most Common Occupations - Office and administrative support occupations (%)
Most Common Occupations - Natural resources, construction, and maintenance occupations (%)
Most Common Occupations - Farming, fishing, and forestry occupations (%)
Most Common Occupations - Construction and extraction occupations (%)
Most Common Occupations - Installation, maintenance, and repair occupations (%)
Most Common Occupations - Production, transportation, and material moving occupations (%)
Most Common Occupations - Production occupations (%)
Most Common Occupations - Transportation occupations (%)
Most Common Occupations - Material moving occupations (%)
People in Group quarters - Institutionalized population (%)
People in Group quarters - Correctional institutions (%)
People in Group quarters - Federal prisons and detention centers (%)
People in Group quarters - Halfway houses (%)
People in Group quarters - Local jails and other confinement facilities (including police lockups) (%)
People in Group quarters - Military disciplinary barracks (%)
People in Group quarters - State prisons (%)
People in Group quarters - Other types of correctional institutions (%)
People in Group quarters - Nursing homes (%)
People in Group quarters - Hospitals/wards, hospices, and schools for the handicapped (%)
People in Group quarters - Hospitals/wards and hospices for chronically ill (%)
People in Group quarters - Hospices or homes for chronically ill (%)
People in Group quarters - Military hospitals or wards for chronically ill (%)
People in Group quarters - Other hospitals or wards for chronically ill (%)
People in Group quarters - Hospitals or wards for drug/alcohol abuse (%)
People in Group quarters - Mental (Psychiatric) hospitals or wards (%)
People in Group quarters - Schools, hospitals, or wards for the mentally retarded (%)
People in Group quarters - Schools, hospitals, or wards for the physically handicapped (%)
People in Group quarters - Institutions for the deaf (%)
People in Group quarters - Institutions for the blind (%)
People in Group quarters - Orthopedic wards and institutions for the physically handicapped (%)
People in Group quarters - Wards in general hospitals for patients who have no usual home elsewhere (%)
People in Group quarters - Wards in military hospitals for patients who have no usual home elsewhere (%)
People in Group quarters - Juvenile institutions (%)
People in Group quarters - Long-term care (%)
People in Group quarters - Homes for abused, dependent, and neglected children (%)
People in Group quarters - Residential treatment centers for emotionally disturbed children (%)
People in Group quarters - Training schools for juvenile delinquents (%)
People in Group quarters - Short-term care, detention or diagnostic centers for delinquent children (%)
People in Group quarters - Type of juvenile institution unknown (%)
People in Group quarters - Noninstitutionalized population (%)
People in Group quarters - College dormitories (includes college quarters off campus) (%)
People in Group quarters - Military quarters (%)
People in Group quarters - On base (%)
People in Group quarters - Barracks, unaccompanied personnel housing (UPH), (Enlisted/Officer), ;and similar group living quarters for military personnel (%)
People in Group quarters - Transient quarters for temporary residents (%)
People in Group quarters - Military ships (%)
People in Group quarters - Group homes (%)
People in Group quarters - Homes or halfway houses for drug/alcohol abuse (%)
People in Group quarters - Homes for the mentally ill (%)
People in Group quarters - Homes for the mentally retarded (%)
People in Group quarters - Homes for the physically handicapped (%)
People in Group quarters - Other group homes (%)
People in Group quarters - Religious group quarters (%)
People in Group quarters - Dormitories (%)
People in Group quarters - Agriculture workers' dormitories on farms (%)
People in Group quarters - Job Corps and vocational training facilities (%)
People in Group quarters - Other workers' dormitories (%)
People in Group quarters - Crews of maritime vessels (%)
People in Group quarters - Other nonhousehold living situations (%)
People in Group quarters - Other noninstitutional group quarters (%)
Residents speaking English at home (%)
Residents speaking English at home - Born in the United States (%)
Residents speaking English at home - Native, born elsewhere (%)
Residents speaking English at home - Foreign born (%)
Residents speaking Spanish at home (%)
Residents speaking Spanish at home - Born in the United States (%)
Residents speaking Spanish at home - Native, born elsewhere (%)
Residents speaking Spanish at home - Foreign born (%)
Residents speaking other language at home (%)
Residents speaking other language at home - Born in the United States (%)
Residents speaking other language at home - Native, born elsewhere (%)
Residents speaking other language at home - Foreign born (%)
Class of Workers - Employee of private company (%)
Class of Workers - Self-employed in own incorporated business (%)
Class of Workers - Private not-for-profit wage and salary workers (%)
Class of Workers - Local government workers (%)
Class of Workers - State government workers (%)
Class of Workers - Federal government workers (%)
Class of Workers - Self-employed workers in own not incorporated business and Unpaid family workers (%)
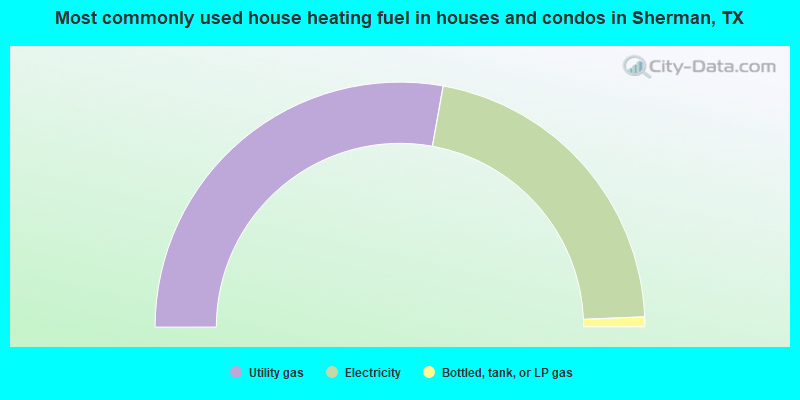
House heating fuel used in houses and condos - Utility gas (%)
House heating fuel used in houses and condos - Bottled, tank, or LP gas (%)
House heating fuel used in houses and condos - Electricity (%)
House heating fuel used in houses and condos - Fuel oil, kerosene, etc. (%)
House heating fuel used in houses and condos - Coal or coke (%)
House heating fuel used in houses and condos - Wood (%)
House heating fuel used in houses and condos - Solar energy (%)
House heating fuel used in houses and condos - Other fuel (%)
House heating fuel used in houses and condos - No fuel used (%)
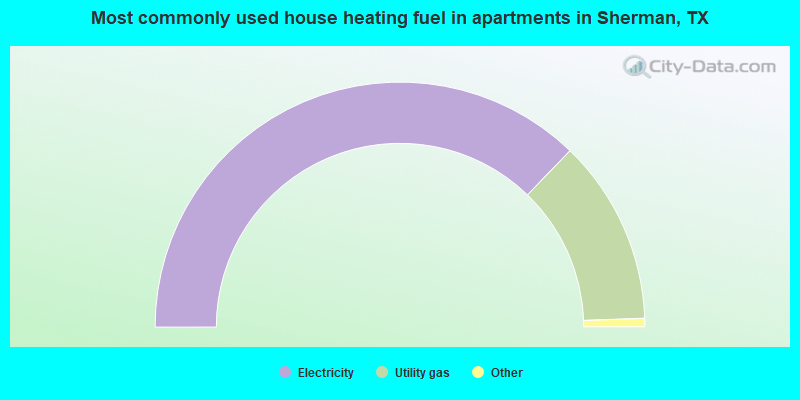
House heating fuel used in apartments - Utility gas (%)
House heating fuel used in apartments - Bottled, tank, or LP gas (%)
House heating fuel used in apartments - Electricity (%)
House heating fuel used in apartments - Fuel oil, kerosene, etc. (%)
House heating fuel used in apartments - Coal or coke (%)
House heating fuel used in apartments - Wood (%)
House heating fuel used in apartments - Solar energy (%)
House heating fuel used in apartments - Other fuel (%)
House heating fuel used in apartments - No fuel used (%)
Armed forces status - In Armed Forces (%)
Armed forces status - Civilian (%)
Armed forces status - Civilian - Veteran (%)
Armed forces status - Civilian - Nonveteran (%)
Fatal accidents locations in years 2005-2021
Fatal accidents locations in 2005
Fatal accidents locations in 2006
Fatal accidents locations in 2007
Fatal accidents locations in 2008
Fatal accidents locations in 2009
Fatal accidents locations in 2010
Fatal accidents locations in 2011
Fatal accidents locations in 2012
Fatal accidents locations in 2013
Fatal accidents locations in 2014
Fatal accidents locations in 2015
Fatal accidents locations in 2016
Fatal accidents locations in 2017
Fatal accidents locations in 2018
Fatal accidents locations in 2019
Fatal accidents locations in 2020
Fatal accidents locations in 2021
Alcohol use - People drinking some alcohol every month (%)
Alcohol use - People not drinking at all (%)
Alcohol use - Average days/month drinking alcohol
Alcohol use - Average drinks/week
Alcohol use - Average days/year people drink much
Audiometry - Average condition of hearing (%)
Audiometry - People that can hear a whisper from across a quiet room (%)
Audiometry - People that can hear normal voice from across a quiet room (%)
Audiometry - Ears ringing, roaring, buzzing (%)
Audiometry - Had a job exposure to loud noise (%)
Audiometry - Had off-work exposure to loud noise (%)
Blood Pressure & Cholesterol - Has high blood pressure (%)
Blood Pressure & Cholesterol - Checking blood pressure at home (%)
Blood Pressure & Cholesterol - Frequently checking blood cholesterol (%)
Blood Pressure & Cholesterol - Has high cholesterol level (%)
Consumer Behavior - Money monthly spent on food at supermarket/grocery store
Consumer Behavior - Money monthly spent on food at other stores
Consumer Behavior - Money monthly spent on eating out
Consumer Behavior - Money monthly spent on carryout/delivered foods
Consumer Behavior - Income spent on food at supermarket/grocery store (%)
Consumer Behavior - Income spent on food at other stores (%)
Consumer Behavior - Income spent on eating out (%)
Consumer Behavior - Income spent on carryout/delivered foods (%)
Current Health Status - General health condition (%)
Current Health Status - Blood donors (%)
Current Health Status - Has blood ever tested for HIV virus (%)
Current Health Status - Left-handed people (%)
Dermatology - People using sunscreen (%)
Diabetes - Diabetics (%)
Diabetes - Had a blood test for high blood sugar (%)
Diabetes - People taking insulin (%)
Diet Behavior & Nutrition - Diet health (%)
Diet Behavior & Nutrition - Milk product consumption (# of products/month)
Diet Behavior & Nutrition - Meals not home prepared (#/week)
Diet Behavior & Nutrition - Meals from fast food or pizza place (#/week)
Diet Behavior & Nutrition - Ready-to-eat foods (#/month)
Diet Behavior & Nutrition - Frozen meals/pizza (#/month)
Drug Use - People that ever used marijuana or hashish (%)
Drug Use - Ever used hard drugs (%)
Drug Use - Ever used any form of cocaine (%)
Drug Use - Ever used heroin (%)
Drug Use - Ever used methamphetamine (%)
Health Insurance - People covered by health insurance (%)
Kidney Conditions-Urology - Avg. # of times urinating at night
Medical Conditions - People with asthma (%)
Medical Conditions - People with anemia (%)
Medical Conditions - People with psoriasis (%)
Medical Conditions - People with overweight (%)
Medical Conditions - Elderly people having difficulties in thinking or remembering (%)
Medical Conditions - People who ever received blood transfusion (%)
Medical Conditions - People having trouble seeing even with glass/contacts (%)
Medical Conditions - People with arthritis (%)
Medical Conditions - People with gout (%)
Medical Conditions - People with congestive heart failure (%)
Medical Conditions - People with coronary heart disease (%)
Medical Conditions - People with angina pectoris (%)
Medical Conditions - People who ever had heart attack (%)
Medical Conditions - People who ever had stroke (%)
Medical Conditions - People with emphysema (%)
Medical Conditions - People with thyroid problem (%)
Medical Conditions - People with chronic bronchitis (%)
Medical Conditions - People with any liver condition (%)
Medical Conditions - People who ever had cancer or malignancy (%)
Mental Health - People who have little interest in doing things (%)
Mental Health - People feeling down, depressed, or hopeless (%)
Mental Health - People who have trouble sleeping or sleeping too much (%)
Mental Health - People feeling tired or having little energy (%)
Mental Health - People with poor appetite or overeating (%)
Mental Health - People feeling bad about themself (%)
Mental Health - People who have trouble concentrating on things (%)
Mental Health - People moving or speaking slowly or too fast (%)
Mental Health - People having thoughts they would be better off dead (%)
Oral Health - Average years since last visit a dentist
Oral Health - People embarrassed because of mouth (%)
Oral Health - People with gum disease (%)
Oral Health - General health of teeth and gums (%)
Oral Health - Average days a week using dental floss/device
Oral Health - Average days a week using mouthwash for dental problem
Oral Health - Average number of teeth
Pesticide Use - Households using pesticides to control insects (%)
Pesticide Use - Households using pesticides to kill weeds (%)
Physical Activity - People doing vigorous-intensity work activities (%)
Physical Activity - People doing moderate-intensity work activities (%)
Physical Activity - People walking or bicycling (%)
Physical Activity - People doing vigorous-intensity recreational activities (%)
Physical Activity - People doing moderate-intensity recreational activities (%)
Physical Activity - Average hours a day doing sedentary activities
Physical Activity - Average hours a day watching TV or videos
Physical Activity - Average hours a day using computer
Physical Functioning - People having limitations keeping them from working (%)
Physical Functioning - People limited in amount of work they can do (%)
Physical Functioning - People that need special equipment to walk (%)
Physical Functioning - People experiencing confusion/memory problems (%)
Physical Functioning - People requiring special healthcare equipment (%)
Prescription Medications - Average number of prescription medicines taking
Preventive Aspirin Use - Adults 40+ taking low-dose aspirin (%)
Reproductive Health - Vaginal deliveries (%)
Reproductive Health - Cesarean deliveries (%)
Reproductive Health - Deliveries resulted in a live birth (%)
Reproductive Health - Pregnancies resulted in a delivery (%)
Reproductive Health - Women breastfeeding newborns (%)
Reproductive Health - Women that had a hysterectomy (%)
Reproductive Health - Women that had both ovaries removed (%)
Reproductive Health - Women that have ever taken birth control pills (%)
Reproductive Health - Women taking birth control pills (%)
Reproductive Health - Women that have ever used Depo-Provera or injectables (%)
Reproductive Health - Women that have ever used female hormones (%)
Sexual Behavior - People 18+ that ever had sex (vaginal, anal, or oral) (%)
Sexual Behavior - Males 18+ that ever had vaginal sex with a woman (%)
Sexual Behavior - Males 18+ that ever performed oral sex on a woman (%)
Sexual Behavior - Males 18+ that ever had anal sex with a woman (%)
Sexual Behavior - Males 18+ that ever had any sex with a man (%)
Sexual Behavior - Females 18+ that ever had vaginal sex with a man (%)
Sexual Behavior - Females 18+ that ever performed oral sex on a man (%)
Sexual Behavior - Females 18+ that ever had anal sex with a man (%)
Sexual Behavior - Females 18+ that ever had any kind of sex with a woman (%)
Sexual Behavior - Average age people first had sex
Sexual Behavior - Average number of female sex partners in lifetime (males 18+)
Sexual Behavior - Average number of female vaginal sex partners in lifetime (males 18+)
Sexual Behavior - Average age people first performed oral sex on a woman (18+)
Sexual Behavior - Average number of woman performed oral sex on in lifetime (18+)
Sexual Behavior - Average number of male sex partners in lifetime (males 18+)
Sexual Behavior - Average number of male anal sex partners in lifetime (males 18+)
Sexual Behavior - Average age people first performed oral sex on a man (18+)
Sexual Behavior - Average number of male oral sex partners in lifetime (18+)
Sexual Behavior - People using protection when performing oral sex (%)
Sexual Behavior - Average number of times people have vaginal or anal sex a year
Sexual Behavior - People having sex without condom (%)
Sexual Behavior - Average number of male sex partners in lifetime (females 18+)
Sexual Behavior - Average number of male vaginal sex partners in lifetime (females 18+)
Sexual Behavior - Average number of female sex partners in lifetime (females 18+)
Sexual Behavior - Circumcised males 18+ (%)
Sleep Disorders - Average hours sleeping at night
Sleep Disorders - People that has trouble sleeping (%)
Smoking-Cigarette Use - People smoking cigarettes (%)
Taste & Smell - People 40+ having problems with smell (%)
Taste & Smell - People 40+ having problems with taste (%)
Taste & Smell - People 40+ that ever had wisdom teeth removed (%)
Taste & Smell - People 40+ that ever had tonsils teeth removed (%)
Taste & Smell - People 40+ that ever had a loss of consciousness because of a head injury (%)
Taste & Smell - People 40+ that ever had a broken nose or other serious injury to face or skull (%)
Taste & Smell - People 40+ that ever had two or more sinus infections (%)
Weight - Average height (inches)
Weight - Average weight (pounds)
Weight - Average BMI
Weight - People that are obese (%)
Weight - People that ever were obese (%)
Weight - People trying to lose weight (%)
According to our research of Texas and other state lists, there were 103 registered sex offenders living in Sherman, Texas as of April 27, 2024 . The ratio of all residents to sex offenders in Sherman is 403 to 1.The ratio of registered sex offenders to all residents in this city is near the state average.
Officers per 1,000 residents here:
1.46Texas average:
2.07
Latest news from Sherman, TX collected exclusively by city-data.com from local newspapers, TV, and radio stations
Ancestries: American (7.6%), English (6.5%), German (5.5%), Irish (5.0%), European (3.7%), Scottish (2.1%).
Current Local Time:
Land area: 38.6 square miles.
Population density: 1,174 people per square mile (low).
5,148 residents are foreign born (7.8% Latin America , 1.6% Asia ).
This city:
11.2%Texas:
17.1%
Median real estate property taxes paid for housing units with mortgages in 2022: $3,518 (1.4%)Median real estate property taxes paid for housing units with no mortgage in 2022: $1,908 (0.9%)
Nearest city with pop. 50,000+: East Grayson, TX (3.5 miles
Nearest city with pop. 200,000+: Plano, TX
Nearest city with pop. 1,000,000+: Dallas, TX
Nearest cities:
Dorchester, TX (3.0 miles),
Latitude: 33.64 N, Longitude: 96.61 W
Daytime population change due to commuting: +8,812 (+19.1%)Workers who live and work in this city: 14,038 (64.1%)
Single-family new house construction building permits:
2022: 815 buildings , average cost: $237,9002020: 294 buildings , average cost: $233,1002019: 225 buildings , average cost: $237,5002018: 194 buildings , average cost: $154,0002017: 170 buildings , average cost: $159,8002016: 101 buildings , average cost: $162,4002015: 128 buildings , average cost: $153,1002014: 119 buildings , average cost: $141,9002013: 87 buildings , average cost: $179,8002012: 48 buildings , average cost: $176,3002011: 29 buildings , average cost: $164,1002010: 35 buildings , average cost: $143,7002009: 44 buildings , average cost: $192,3002008: 113 buildings , average cost: $148,5002007: 138 buildings , average cost: $134,0002006: 165 buildings , average cost: $120,7002005: 191 buildings , average cost: $117,4002004: 168 buildings , average cost: $110,9002003: 166 buildings , average cost: $98,1002002: 184 buildings , average cost: $106,1002001: 111 buildings , average cost: $101,4002000: 60 buildings , average cost: $138,9001999: 70 buildings , average cost: $109,9001998: 66 buildings , average cost: $97,3001997: 47 buildings , average cost: $150,700Unemployment in December 2023:
Population change in the 1990s: +2,803 (+8.7%).
Most common occupations in Sherman, TX (%)
Both Males Females
Other office and administrative support workers, including supervisors (5.3%)
Other production occupations, including supervisors (5.1%)
Building and grounds cleaning and maintenance occupations (4.1%)
Retail sales workers, except cashiers (3.8%)
Metal workers and plastic workers (3.7%)
Other sales and related occupations, including supervisors (3.6%)
Other management occupations, except farmers and farm managers (3.2%)
Other production occupations, including supervisors (6.2%)
Driver/sales workers and truck drivers (5.1%)
Electrical equipment mechanics and other installation, maintenance, and repair workers, including supervisors (5.0%)
Metal workers and plastic workers (5.0%)
Building and grounds cleaning and maintenance occupations (5.0%)
Material recording, scheduling, dispatching, and distributing workers (3.6%)
Retail sales workers, except cashiers (3.2%)
Other office and administrative support workers, including supervisors (9.3%)
Information and record clerks, except customer service representatives (4.5%)
Retail sales workers, except cashiers (4.4%)
Preschool, kindergarten, elementary, and middle school teachers (4.1%)
Secretaries and administrative assistants (4.1%)
Other sales and related occupations, including supervisors (4.0%)
Other production occupations, including supervisors (3.8%)
Air pollution and air quality trends(lower is better)
AQI Ozone
Tornado activity:
Sherman-area historical tornado activity is above Texas state average. It is 144% greater than the overall U.S. average.
On 4/2/1957, a category F4 (max. wind speeds 207-260 mph) tornado 22.5 miles away from the Sherman city center killed 3 people and injured 3 people and caused between $50,000 and $500,000 in damages.
On 4/2/1957, a category F4 tornado 24.9 miles away from the city center killed 2 people and injured 6 people and caused between $500,000 and $5,000,000 in damages.
Earthquake activity:
Sherman-area historical earthquake activity is significantly above Texas state average. It is 569% greater than the overall U.S. average. On 11/6/2011 at 03:53:10, a magnitude 5.7 (5.7 MW, Depth: 3.2 mi, Class: Moderate, Intensity: VI - VII) earthquake occurred 131.1 miles away from the city center On 9/3/2016 at 12:02:44, a magnitude 5.8 (5.8 MW, Depth: 3.5 mi) earthquake occurred 193.4 miles away from the city center On 11/7/2016 at 01:44:24, a magnitude 5.0 (5.0 MW, Depth: 2.8 mi) earthquake occurred 162.9 miles away from the city center On 11/8/2011 at 02:46:57, a magnitude 4.8 (4.8 MW, Depth: 3.1 mi, Class: Light, Intensity: IV - V) earthquake occurred 131.1 miles away from Sherman center On 11/5/2011 at 07:12:45, a magnitude 4.8 (4.8 MW, Depth: 1.9 mi) earthquake occurred 132.3 miles away from Sherman center On 9/6/1997 at 23:38:00, a magnitude 4.5 (4.5 LG, 4.2 LG, Depth: 3.1 mi) earthquake occurred 71.2 miles away from Sherman center Magnitude types: regional Lg-wave magnitude (LG), moment magnitude (MW) Natural disasters: The number of natural disasters in Grayson County (15) is near the US average (15).Major Disasters (Presidential) Declared: 7Emergencies Declared: 7Floods: 5, Storms: 5, Hurricanes: 4, Tornadoes: 4, Fires: 3, Wind: 1, Winter Storm: 1, Other: 2 (Note: some incidents may be assigned to more than one category). Hospitals in Sherman: ALWAYS BETTER CARE HOSPICE (2009 INDEPENDENCE SUITE 100) EVERGREEN CARRIAGE ESTATES COMMUNITY HOME (159 CARRIAGE ESTATES) EVERGREEN NORTHBROOK COMMUNITY HOME (1732 NORTHBROOK) GALLAGHER PARK SURGICENTER (3400 N CALAIS DRIVE) HERITAGE PARK SURGICAL HOSPITAL (Proprietary, provides emergency services, 3601 CALAIS DRIVE) HOME HOSPICE (505 WEST CENTER STREET) REGIONAL HOSPITAL OF TEXOMA (2601 CORNERSTONE) TEXAS HEALTH PRESBYTERIAN HOSPITAL-WNJ (Voluntary non-profit - Other, 500 N HIGHLAND AVENUE) THE HOSPICE CENTER (2001 SKYLINE DRIVE SUITE A115) THE PALLIATIVE HOSPICE CENTER (ONE GRAND CENTRE 1800 N TEAGUE DR #510)
Colleges/Universities in Sherman: Austin College Full-time enrollment: 1,472; Location: 900 N Grand Ave; Private, not-for-profit; Website: www.austincollege.edu; Offers Master's degree )
Diamonds Cosmetology College Full-time enrollment: 49; Location: 1950 North Grand Avenue; Private, for-profit; Website: www.diamondscosmetology.com/)
Colleges/universities with over 2000 students nearest to Sherman:
Grayson College (about 5 miles; Denison, TX ; Full-time enrollment: 2,496)
Southeastern Oklahoma State University (about 29 miles; Durant, OK ; FT enrollment: 3,365)
North Central Texas College (about 33 miles; Gainesville, TX ; FT enrollment: 6,550)
Collin County Community College District (about 34 miles; McKinney, TX ; FT enrollment: 18,044)
Texas Woman's University (about 42 miles; Denton, TX ; FT enrollment: 11,837)
University of North Texas (about 44 miles; Denton, TX ; FT enrollment: 31,694)
The University of Texas at Dallas (about 46 miles; Richardson, TX ; FT enrollment: 16,777)
Public elementary/middle school in Sherman: SHERIDAN EL Location: 5526 FM 2437, Grades: KG-5)
Library in Sherman: SHERMAN PUBLIC LIBRARY Operating income: $831,468; Location: 421 N TRAVIS ST; 122,972 books ; 12,027 audio materials ; 5,406 video materials ; 1 local licensed databases ; 50 state licensed databases ; 9 other licensed databases ; 182 print serial subscriptions ; 18 electronic serial subscriptions )
Notable locations in Sherman: (A) , Sherman Fire Department Station 1Central (B) , Sherman Fire Department Station 2 (C) , Sherman Fire Department Station 5 Northside (D) , Sherman Fire Department Station 3 Pecan Grove (E) , Sherman Fire Department Station 4 Blalock (F) , Red River Historical Museum (G) , Woodman Circle Home (H) , Chase at Texas Lifestar Air Medical (I) , Texoma Medical Center - Behavioral Health Center (J) , Captain Noble Allan Birge House (K) , Old Sherman Public Library (L) . Display/hide their locations on the map
Shopping Center: (1) . Display/hide its location on the map
Churches in Sherman include: (A) , Community Baptist Church (B) , Harvest Time Assembly of God Church (C) , First Temple Assembly of God Church (D) , Bethel Apostolic Church (E) , Payne Chapel African Methodist Episcopal Church (F) , Fellowship Missionary Baptist Church (G) , Fairview Baptist Church (H) , East Sherman Baptist Church (I) . Display/hide their locations on the map
Cemeteries: (1) , West Hill Cemetery (2) , Akers Cemetery (3) . Display/hide their locations on the map
Reservoir: (A) . Display/hide its location on the map
Creeks: (A) , Sand Creek (B) . Display/hide their locations on the map
Parks in Sherman include: (1) , Birge Park (2) , Moore Park (3) , Fielder Park (4) , Ely Park (5) , Old Settlers Park (6) , Washington Park (7) , Cherry Park (8) , Bearcat Stadium (9) . Display/hide their locations on the map
Tourist attractions: (1) , AMEX Associated Travel Agency (Tours & Charters; 2007 Texoma Parkway Suite 126) (2) , Associated Travel (Tours & Charters; 2007 Texoma Pkwy) (3) . Display/hide their approximate locations on the map
Courts: (1) , United States Government Offices - Court System- Federal Magistrate J (Federal Building) (2) , Courts-Federal - District Court- Clerk's Office (101 East Pecan Street) (3) , Courts-Federal - Probation Office (101 East Pecan Street) (4) . Display/hide their approximate locations on the map
Birthplace of: Buck Owens - Country musician, Jeremih - Singer–songwriter, Charles B. Winstead - FBI agent, Curtis Luper - Football player and coach, Elbert Caraway - Football and baseball player and coach, Hunter Smith - 2005 NFL player (Indianapolis Colts, born : Aug 9, 1977), Jimmy Hotz - Musician, Lee Grissom - Baseball player, Ron May (Colorado legislator) - Politician, William Jefferson Blythe, Jr. - Soilder.
Grayson County has a predicted average indoor radon screening level less than 2 pCi/L (pico curies per liter) - Low Potential Drinking water stations with addresses in Sherman and their reported violations in the past:
CARRIAGE HOUSE ESTATES (Population served: 414, Purch surface water):
Past monitoring violations:
Follow-up Or Routine LCR Tap M/R - In OCT-01-2013, Contaminant: Lead and Copper Rule
Follow-up Or Routine LCR Tap M/R - In OCT-01-2010, Contaminant: Lead and Copper Rule
Monitoring, Source Water (GWR) - In SEP-01-2010, Contaminant: E. COLI. Follow-up actions: St Violation/Reminder Notice (NOV-17-2010), St Public Notif requested (NOV-17-2010)
Monitoring and Reporting (DBP) - Between JUL-2010 and SEP-2010, Contaminant: Chlorine. Follow-up actions: St Compliance achieved (JUL-17-2014)
Monitoring and Reporting (DBP) - Between JAN-2007 and MAR-2007, Contaminant: Chlorine. Follow-up actions: St Public Notif requested (JUL-19-2007), St Violation/Reminder Notice (JUL-19-2007), St Compliance achieved (JAN-24-2011)
2 routine major monitoring violations
2 minor monitoring violations
8 other older monitoring violations
Average household size: This city:
2.5 peopleTexas:
2.8 people
Percentage of family households: This city:
63.8%Whole state:
69.9%
Percentage of households with unmarried partners: This city:
6.9%Whole state:
6.0%
Likely homosexual households (counted as self-reported same-sex unmarried-partner households)
Lesbian couples: 0.4% of all households Gay men: 0.3% of all households
People in group quarters in Sherman in 2010:
818 people in college/university student housing
285 people in nursing facilities/skilled-nursing facilities
224 people in local jails and other municipal confinement facilities
21 people in other noninstitutional facilities
6 people in group homes intended for adults
6 people in residential treatment centers for adults
4 people in emergency and transitional shelters (with sleeping facilities) for people experiencing homelessness
4 people in workers' group living quarters and job corps centers
People in group quarters in Sherman in 2000:
771 people in college dormitories (includes college quarters off campus)
552 people in nursing homes
294 people in local jails and other confinement facilities (including police lockups)
62 people in schools, hospitals, or wards for the intellectually disabled
38 people in other noninstitutional group quarters
32 people in orthopedic wards and institutions for the physically handicapped
12 people in other group homes
9 people in other nonhousehold living situations
Banks with most branches in Sherman (2011 data):
American Bank of Texas: 7 branches. Info updated 2006/11/03: Bank assets: $1,140.3 mil, Deposits: $954.9 mil, local headquarters , positive income , Commercial Lending Specialization, 19 total offices , Holding Company: North American Bancshares, Inc.
First Texoma National Bank: Loy Lake Branch at 2626 Loy Lake Rd, branch established on 2005/04/22; Post Oak Crossing Branch at 3401 Highway 1417, branch established on 2004/02/26. Info updated 2006/11/03: Bank assets: $169.7 mil, Deposits: $151.9 mil, headquarters in Durant, OK, negative income in the last year , Commercial Lending Specialization, 7 total offices , Holding Company: Fnb Financial Services, Inc.
BOKF, National Association: Sherman Branch at 307 West Washington, Suite 200, branch established on 1998/07/15; Sherman Albertsons Branch at 100 East Taylor, branch established on 1999/10/08. Info updated 2012/02/28: Bank assets: $25,360.0 mil, Deposits: $19,171.3 mil, headquarters in Tulsa, OK, positive income , Commercial Lending Specialization, 189 total offices , Holding Company: Bok Financial Corporation
JPMorgan Chase Bank, National Association: Sherman Main Branch at 200 North Travis Street, branch established on 1872/09/28. Info updated 2011/11/10: Bank assets: $1,811,678.0 mil, Deposits: $1,190,738.0 mil, headquarters in Columbus, OH, positive income , International Specialization, 5577 total offices , Holding Company: Jpmorgan Chase & Co.
Texas Star Bank: Sherman Branch at 500 North Sam Rayburn Freeway, branch established on 1980/01/24. Info updated 2009/11/12: Bank assets: $282.8 mil, Deposits: $255.0 mil, headquarters in Van Alstyne, TX, positive income , Commercial Lending Specialization, 7 total offices , Holding Company: Van Alstyne Financial Corporation
Landmark Bank, National Association: Sherman Branch at 720 East Peyton Street, branch established on 2001/01/29. Info updated 2011/09/28: Bank assets: $1,675.9 mil, Deposits: $1,490.4 mil, headquarters in Columbia, MO, positive income , Commercial Lending Specialization, 38 total offices , Holding Company: Landrum Company
Woodforest National Bank: Sherman Kroger Branch at 1820 Loy Lake, branch established on 2002/10/09. Info updated 2011/05/10: Bank assets: $3,488.9 mil, Deposits: $3,097.6 mil, headquarters in Houston, TX, positive income , Commercial Lending Specialization, 766 total offices , Holding Company: Woodforest Financial Group Employee Stock Ownership Plan (With 401(K) Provisions)
First National Bank Texas: Sherman Banking Center - Rc 820 at 401 East Highway 82, Box 2, branch established on 1999/11/12. Info updated 2006/11/03: Bank assets: $944.3 mil, Deposits: $815.9 mil, headquarters in Killeen, TX, positive income , Mortgage Lending Specialization, 250 total offices , Holding Company: First Community Bancshares, Inc.
Independent Bank: Sherman Branch at 300 E. Taylor, branch established on 1999/01/25. Info updated 2010/10/06: Bank assets: $1,237.6 mil, Deposits: $1,035.0 mil, headquarters in Mckinney, TX, positive income , Commercial Lending Specialization, 27 total offices , Holding Company: Independent Bank Group, Inc.
For population 15 years and over in Sherman:
Never married: 29.9%Now married: 49.0%Separated: 3.0%Widowed: 4.8%Divorced: 13.3% For population 25 years and over in Sherman:
High school or higher: 89.2%Bachelor's degree or higher: 22.6%Graduate or professional degree: 8.4%Unemployed: 5.3%Mean travel time to work (commute): 18.3 minutes
Education Gini index (Inequality in education) Here:
11.3Texas average:
14.0
Religion statistics for Sherman, TX (based on Grayson County data)
Religion Adherents Congregations Evangelical Protestant 50,271 174 Mainline Protestant 9,066 33 Catholic 5,952 4 Other 3,844 7 Black Protestant 2,380 14 Orthodox 120 1 None 49,244 -
Source: Clifford Grammich, Kirk Hadaway, Richard Houseal, Dale E.Jones, Alexei Krindatch, Richie Stanley and Richard H.Taylor. 2012. 2010 U.S.Religion Census: Religious Congregations & Membership Study. Association of Statisticians of American Religious Bodies. Jones, Dale E., et al. 2002. Congregations and Membership in the United States 2000. Nashville, TN: Glenmary Research Center. Graphs represent county-level data
Food Environment Statistics: Number of grocery stores : 17This county :
1.44 / 10,000 pop.State :
1.47 / 10,000 pop.
Number of supercenters and club stores : 3Grayson County :
0.25 / 10,000 pop.Texas :
0.14 / 10,000 pop.
Number of convenience stores (no gas) : 14Grayson County :
1.19 / 10,000 pop.Texas :
1.11 / 10,000 pop.
Number of convenience stores (with gas) : 69Grayson County :
5.84 / 10,000 pop.Texas :
3.95 / 10,000 pop.
Number of full-service restaurants : 74Here :
6.27 / 10,000 pop.Texas :
6.13 / 10,000 pop.
Adult diabetes rate : Grayson County :
9.3%State :
8.9%
Low-income preschool obesity rate : This county :
15.1%Texas :
15.7%
Health and Nutrition: Healthy diet rate : This city:
48.0%State:
48.6%
Average overall health of teeth and gums : This city:
44.9%Texas:
47.4%
People feeling badly about themselves : This city:
20.8%Texas:
20.6%
People not drinking alcohol at all : This city:
11.8%State:
10.3%
Average hours sleeping at night : General health condition : Average condition of hearing : More about Health and Nutrition of Sherman, TX Residents
Local government employment and payroll (March 2022)
Function
Full-time employees
Monthly full-time payroll
Average yearly full-time wage
Part-time employees
Monthly part-time payroll
Firefighters
83 $616,416 $89,120 0 $0 Police Protection - Officers
65 $477,357 $88,127 0 $0 Other and Unallocable
62 $312,092 $60,405 4 $3,814 Parks and Recreation
40 $156,650 $46,995 7 $6,810 Sewerage
38 $195,340 $61,686 1 $2,407 Water Supply
29 $133,484 $55,235 0 $0 Streets and Highways
27 $90,955 $40,424 0 $0 Solid Waste Management
27 $101,526 $45,123 2 $1,278 Police - Other
25 $104,171 $50,002 0 $0 Health
18 $81,705 $54,470 0 $0 Financial Administration
17 $98,353 $69,426 2 $2,579 Local Libraries
10 $37,216 $44,659 0 $0 Other Government Administration
8 $75,155 $112,733 6 $650 Welfare
5 $19,346 $46,430 0 $0 Judicial and Legal
4 $14,246 $42,738 0 $0 Fire - Other
2 $7,206 $43,236 0 $0 Housing and Community Development (Local)
2 $8,667 $52,002 0 $0
Totals for Government
462 $2,529,885 $65,711 22 $17,537
Sherman government finances - Expenditure in 2017 (per resident):
Construction - Regular Highways: $1,886,000 ($41.67)
Water Utilities: $892,000 ($19.71)Parks and Recreation: $166,000 ($3.67)Police Protection: $124,000 ($2.74)Central Staff Services: $52,000 ($1.15)Sewerage: $33,000 ($0.73)Libraries: $27,000 ($0.60)Local Fire Protection: $7,000 ($0.15)Current Operations - Police Protection: $9,093,000 ($200.89)
Water Utilities: $8,729,000 ($192.85)Local Fire Protection: $8,642,000 ($190.92)General - Other: $8,331,000 ($184.05)Solid Waste Management: $4,442,000 ($98.14)Regular Highways: $3,327,000 ($73.50)Sewerage: $3,256,000 ($71.93)Central Staff Services: $3,228,000 ($71.31)Parks and Recreation: $2,902,000 ($64.11)Libraries: $885,000 ($19.55)Protective Inspection and Regulation - Other: $811,000 ($17.92)Health - Other: $704,000 ($15.55)Financial Administration: $668,000 ($14.76)General Public Buildings: $598,000 ($13.21)Miscellaneous Commercial Activities - Other: $538,000 ($11.89)Housing and Community Development: $367,000 ($8.11)Air Transportation: $321,000 ($7.09)Judicial and Legal Services: $236,000 ($5.21)Public Welfare, Vendor Payments for Medical Care: $37,000 ($0.82)Intergovernmental to Local - Other - Central Staff Services: $24,000 ($0.53)
Other - Correctional Institutions: $16,000 ($0.35)Other Capital Outlay - Water Utilities: $1,431,000 ($31.61)
Solid Waste Management: $795,000 ($17.56)Local Fire Protection: $790,000 ($17.45)Police Protection: $327,000 ($7.22)Regular Highways: $282,000 ($6.23)Miscellaneous Commercial Activities - Other: $101,000 ($2.23)Parks and Recreation: $68,000 ($1.50)Sewerage: $64,000 ($1.41)Libraries: $37,000 ($0.82)General - Other: $34,000 ($0.75)General Public Building: $20,000 ($0.44)Health - Other: $6,000 ($0.13)Central Staff Services: $2,000 ($0.04)Total Salaries and Wages: $31,682,000 ($699.94)
Water Utilities - Interest on Debt: $4,441,000 ($98.11)
Sherman government finances - Revenue in 2017 (per resident):
Charges - Sewerage: $7,097,000 ($156.79)
Solid Waste Management: $6,222,000 ($137.46)Other: $2,625,000 ($57.99)Parks and Recreation: $380,000 ($8.40)Air Transportation: $332,000 ($7.33)Miscellaneous Commercial Activities: $116,000 ($2.56)Regular Highways: $99,000 ($2.19)Parking Facilities: $11,000 ($0.24)Federal Intergovernmental - Other: $2,000 ($0.04)
Local Intergovernmental - Other: $228,000 ($5.04)
Water Utilities: $182,000 ($4.02)Sewerage: $108,000 ($2.39)Miscellaneous - Sale of Property: $568,000 ($12.55)
Fines and Forfeits: $507,000 ($11.20)General Revenue - Other: $371,000 ($8.20)Interest Earnings: $164,000 ($3.62)Donations From Private Sources: $68,000 ($1.50)Rents: $63,000 ($1.39)Royalties: $28,000 ($0.62)Revenue - Water Utilities: $13,577,000 ($299.95)
State Intergovernmental - Other: $390,000 ($8.62)
Housing and Community Development: $312,000 ($6.89)General Local Government Support: $118,000 ($2.61)Tax - General Sales and Gross Receipts: $15,487,000 ($342.15)
Property: $9,315,000 ($205.79)Public Utilities Sales: $3,069,000 ($67.80)Other Selective Sales: $523,000 ($11.55)Other License: $418,000 ($9.23)Occupation and Business License - Other: $24,000 ($0.53)Amusements Sales: $17,000 ($0.38)Alcoholic Beverage License: $7,000 ($0.15)
Sherman government finances - Debt in 2017 (per resident):
Long Term Debt - Outstanding Unspecified Public Purpose: $175,005,000 ($3866.32)
Beginning Outstanding - Unspecified Public Purpose: $111,039,000 ($2453.14)Issue, Unspecified Public Purpose: $75,301,000 ($1663.60)Retired Unspecified Public Purpose: $11,336,000 ($250.44)
Sherman government finances - Cash and Securities in 2017 (per resident):
Bond Funds - Cash and Securities: $56,821,000 ($1255.32)
Other Funds - Cash and Securities: $20,450,000 ($451.79)
Businesses in Sherman, TX
Name Count Name Count
AT&T 2 Journeys 1 Academy Sports + Outdoors 1 KFC 1 Albertsons 1 Kohl's 1 American Eagle Outfitters 1 Kroger 1 Applebee's 1 La Quinta 1 Arby's 1 La-Z-Boy 1 AutoZone 1 Lane Bryant 1 Bath & Body Works 1 Little Caesars Pizza 1 Bed Bath & Beyond 1 Lowe's 1 Blockbuster 1 MasterBrand Cabinets 1 Burger King 1 McDonald's 2 Burlington Coat Factory 1 Motherhood Maternity 1 CVS 1 Nike 3 Catherines 1 Office Depot 1 Chevrolet 1 Old Navy 1 Chick-Fil-A 1 Olive Garden 1 Chipotle 1 Panda Express 1 Chuck E. Cheese's 1 Panera Bread 1 Church's Chicken 2 Payless 2 Circle K 3 PetSmart 1 Cold Stone Creamery 1 Pizza Hut 1 Comfort Suites 1 Popeyes 1 Cracker Barrel 1 RadioShack 1 Curves 1 Red Lobster 1 Days Inn 1 Rue21 1 Discount Tire 1 SONIC Drive-In 2 Domino's Pizza 1 Sam's Club 1 DressBarn 1 Sears 3 Dressbarn 1 Spencer Gifts 1 Famous Footwear 1 Sprint Nextel 1 FedEx 9 Starbucks 2 Finish Line 1 Super 8 1 GNC 1 T-Mobile 3 GameStop 1 T.J.Maxx 1 Goodwill 1 Taco Bell 2 H&R Block 2 Target 1 Havertys Furniture 1 The Room Place 1 Hilton 1 U-Haul 6 Hobby Lobby 1 UPS 12 Holiday Inn 1 Vans 1 Home Depot 1 Verizon Wireless 1 IHOP 1 Victoria's Secret 1 JCPenney 1 Walgreens 1 Jack In The Box 2 Walmart 1 Jones New York 2 Wendy's 1
Strongest AM radio stations in Sherman:
KYNG (950 AM; 10 kW; DENISON-SHERMAN, TX; Owner: KRBE LICO, INC.)
KTBK (1700 AM; 10 kW; SHERMAN, TX; Owner: KRBE LICO, INC.)
KJIM (1500 AM; daytime; 1 kW; SHERMAN, TX)
KRLD (1080 AM; 50 kW; DALLAS, TX; Owner: TEXAS INFINITY BROADCASTING L.P.)
KFXR (1190 AM; 50 kW; DALLAS, TX; Owner: CLEAR CHANNEL BROADCASTING LICENSES, INC.)
KMKI (620 AM; 5 kW; PLANO, TX; Owner: ABC, INC)
WBAP (820 AM; 50 kW; FORT WORTH, TX; Owner: WBAP-KSCS OPERATING, LTD.)
KZMP (1540 AM; 50 kW; UNIVERSITY PARK, TX; Owner: ENTRAVISION HOLDINGS, LLC)
KESS (1270 AM; 50 kW; FORT WORTH, TX; Owner: KESS-AM LICENSE CORP.)
KSKY (660 AM; 20 kW; BALCH SPRINGS, TX; Owner: BISON MEDIA, INC.)
KBIS (1150 AM; 25 kW; HIGHLAND PARK, TX; Owner: DALLAS AM RADIO PARTNERS, L.P.)
KAAM (770 AM; 10 kW; GARLAND, TX; Owner: DONTRON, INC.)
KAHZ (1360 AM; 50 kW; HURST, TX)
Strongest FM radio stations in Sherman:
KTDK (104.1 FM; SANGER, TX; Owner: KRBE LICO, INC.)
KESN (103.3 FM; ALLEN, TX; Owner: WBAP-KSCS OPERATING, LTD.)
KSOC (94.5 FM; GAINESVILLE, TX; Owner: RADIO ONE LICENSES, LLC)
KTCY (104.9 FM; PILOT POINT, TX; Owner: ENTRAVISION HOLDINGS, LLC)
KTPW (89.7 FM; SANGER, TX; Owner: RESEARCH EDUCATIONAL FOUNDATION, INC)
KMKT (93.1 FM; BELLS, TX; Owner: NM LICENSING, LLC)
KHYI (95.3 FM; HOWE, TX; Owner: METRO BROADCASTERS - TEXAS, INC.)
K214CK (90.7 FM; SHERMAN, TX; Owner: BIBLE B/CNG NETWORK, INC.)
KLAK (97.5 FM; DURANT, OK; Owner: NM LICENSING, LLC)
KESS-FM (107.9 FM; LEWISVILLE, TX; Owner: KECS-FM LICENSE CORPORATION)
KNOR (93.7 FM; HEALDTON, OK; Owner: AM & PM BROADCASTERS, LLC)
KFYZ-FM (98.3 FM; BONHAM, TX; Owner: NORTH TEXAS RADIO GROUP, L.P.)
KMEO (96.7 FM; FLOWER MOUND, TX; Owner: ABC, INC.)
KKDL (106.7 FM; MUENSTER, TX; Owner: ENTRAVISION HOLDINGS, LLC)
KZMP-FM (101.7 FM; AZLE, TX; Owner: ENTRAVISION HOLDINGS, LLC)
KPLX (99.5 FM; FORT WORTH, TX; Owner: KPLX LICO, INC.)
KRNB (105.7 FM; DECATUR, TX; Owner: SERVICE BROADCASTING I, LTD.)
KDKR (91.3 FM; DECATUR, TX; Owner: CSN INTERNATIONAL)
KHCK-FM (99.1 FM; DENTON, TX; Owner: KHCK-FM LICENSE CORP.)
KLBC (106.3 FM; DURANT, OK; Owner: TEXOMA BROADCASTING, INC.)
TV broadcast stations around Sherman:
KXII (Channel 12; SHERMAN, TX; Owner: KXII LICENSEE CORP.)
KTAQ (Channel 47; GREENVILLE, TX; Owner: MIKE SIMONS)
KTEN (Channel 10; ADA, OK; Owner: CHANNEL 49 ACQUISITION CORPORATION)
National Bridge Inventory (NBI) Statistics 174 Number of bridges1,969ft / 600m Total length $1,135,000 Total costs1,569,675 Total average daily traffic143,682 Total average daily truck traffic
New bridges - historical statistics
5 1930-1939 9 1940-1949 4 1950-1959 35 1960-1969 34 1970-1979 40 1980-1989 19 1990-1999 15 2000-2009 9 2010-2019 4 2020-2022
See full National Bridge Inventory statistics for Sherman, TX
Home Mortgage Disclosure Act Aggregated Statistics For Year 2009(Based on 5 full and 4 partial tracts) A) FHA, FSA/RHS & VA B) Conventional C) Refinancings D) Home Improvement Loans E) Loans on Dwellings For 5+ Families F) Non-occupant Loans on G) Loans On Manufactured Number Average Value Number Average Value Number Average Value Number Average Value Number Average Value Number Average Value Number Average Value
LOANS ORIGINATED 101 $100,881 109 $86,020 181 $113,887 18 $44,308 1 $1,843,100 70 $63,750 2 $39,780 APPLICATIONS APPROVED, NOT ACCEPTED 5 $114,824 11 $73,888 16 $102,592 3 $60,927 0 $0 10 $57,207 3 $66,877 APPLICATIONS DENIED 6 $105,813 13 $86,072 83 $99,279 27 $27,785 1 $840,000 6 $57,273 1 $25,560 APPLICATIONS WITHDRAWN 16 $87,561 8 $111,145 45 $127,838 3 $25,953 0 $0 2 $88,520 0 $0 FILES CLOSED FOR INCOMPLETENESS 3 $86,130 1 $128,380 10 $98,682 1 $60,900 0 $0 1 $69,000 0 $0
Aggregated Statistics For Year 2008(Based on 5 full and 4 partial tracts) A) FHA, FSA/RHS & VA B) Conventional C) Refinancings D) Home Improvement Loans E) Loans on Dwellings For 5+ Families F) Non-occupant Loans on G) Loans On Manufactured Number Average Value Number Average Value Number Average Value Number Average Value Number Average Value Number Average Value Number Average Value
LOANS ORIGINATED 141 $97,026 173 $91,025 135 $125,764 37 $32,813 3 $764,333 113 $95,993 4 $41,182 APPLICATIONS APPROVED, NOT ACCEPTED 7 $92,913 19 $83,473 16 $94,619 10 $31,157 0 $0 11 $55,859 1 $46,000 APPLICATIONS DENIED 14 $94,448 44 $85,689 121 $87,120 37 $44,106 2 $1,387,095 18 $83,862 5 $42,156 APPLICATIONS WITHDRAWN 16 $84,509 18 $105,733 49 $102,343 3 $35,227 0 $0 8 $63,326 0 $0 FILES CLOSED FOR INCOMPLETENESS 6 $73,802 4 $80,082 8 $120,425 2 $24,320 0 $0 1 $34,050 0 $0
Aggregated Statistics For Year 2007(Based on 5 full and 4 partial tracts) A) FHA, FSA/RHS & VA B) Conventional C) Refinancings D) Home Improvement Loans E) Loans on Dwellings For 5+ Families F) Non-occupant Loans on G) Loans On Manufactured Number Average Value Number Average Value Number Average Value Number Average Value Number Average Value Number Average Value Number Average Value
LOANS ORIGINATED 96 $90,889 280 $85,005 142 $91,961 50 $39,702 8 $1,099,898 116 $67,849 5 $63,206 APPLICATIONS APPROVED, NOT ACCEPTED 6 $81,980 27 $90,700 37 $99,045 10 $56,065 0 $0 9 $74,012 1 $72,560 APPLICATIONS DENIED 10 $88,449 54 $72,499 145 $92,776 60 $45,634 3 $545,670 28 $78,194 8 $86,524 APPLICATIONS WITHDRAWN 14 $81,576 25 $92,485 64 $89,466 10 $74,928 1 $770,000 13 $43,165 1 $77,450 FILES CLOSED FOR INCOMPLETENESS 1 $86,000 4 $83,188 16 $134,179 1 $8,060 0 $0 1 $152,000 0 $0
Aggregated Statistics For Year 2006(Based on 5 full and 4 partial tracts) A) FHA, FSA/RHS & VA B) Conventional C) Refinancings D) Home Improvement Loans E) Loans on Dwellings For 5+ Families F) Non-occupant Loans on G) Loans On Manufactured Number Average Value Number Average Value Number Average Value Number Average Value Number Average Value Number Average Value Number Average Value
LOANS ORIGINATED 109 $86,377 408 $76,486 172 $93,577 51 $35,574 2 $988,965 174 $66,770 9 $53,487 APPLICATIONS APPROVED, NOT ACCEPTED 3 $100,347 44 $74,359 38 $70,744 7 $35,103 0 $0 16 $60,122 7 $44,573 APPLICATIONS DENIED 3 $99,163 81 $69,629 193 $85,446 83 $39,445 0 $0 33 $66,257 19 $53,167 APPLICATIONS WITHDRAWN 11 $87,110 80 $86,592 112 $87,304 10 $60,165 0 $0 28 $61,816 0 $0 FILES CLOSED FOR INCOMPLETENESS 1 $112,000 11 $83,515 45 $110,354 0 $0 0 $0 3 $55,017 0 $0
Aggregated Statistics For Year 2005(Based on 5 full and 4 partial tracts) A) FHA, FSA/RHS & VA B) Conventional C) Refinancings D) Home Improvement Loans E) Loans on Dwellings For 5+ Families F) Non-occupant Loans on G) Loans On Manufactured Number Average Value Number Average Value Number Average Value Number Average Value Number Average Value Number Average Value Number Average Value
LOANS ORIGINATED 78 $91,509 407 $78,502 220 $95,291 42 $42,562 3 $825,133 165 $65,412 4 $40,332 APPLICATIONS APPROVED, NOT ACCEPTED 3 $55,890 39 $69,175 48 $94,863 11 $33,929 0 $0 11 $47,505 8 $41,410 APPLICATIONS DENIED 8 $80,311 86 $66,931 269 $81,005 84 $30,483 1 $2,120,000 36 $63,233 24 $58,738 APPLICATIONS WITHDRAWN 10 $97,283 49 $82,622 111 $106,614 28 $156,507 1 $1,112,000 17 $96,716 2 $48,735 FILES CLOSED FOR INCOMPLETENESS 3 $98,000 14 $108,579 65 $99,587 0 $0 0 $0 6 $74,787 1 $95,000
Aggregated Statistics For Year 2004(Based on 5 full and 4 partial tracts) A) FHA, FSA/RHS & VA B) Conventional C) Refinancings D) Home Improvement Loans E) Loans on Dwellings For 5+ Families F) Non-occupant Loans on G) Loans On Manufactured Number Average Value Number Average Value Number Average Value Number Average Value Number Average Value Number Average Value Number Average Value
LOANS ORIGINATED 95 $93,708 329 $75,907 310 $81,424 49 $42,585 4 $907,368 103 $58,182 7 $44,127 APPLICATIONS APPROVED, NOT ACCEPTED 8 $84,049 58 $83,547 46 $88,294 14 $18,937 0 $0 19 $74,580 15 $39,875 APPLICATIONS DENIED 15 $88,272 83 $65,420 291 $69,839 90 $30,860 0 $0 36 $68,426 23 $48,483 APPLICATIONS WITHDRAWN 13 $87,762 32 $80,605 154 $82,227 6 $39,017 0 $0 17 $67,933 1 $41,920 FILES CLOSED FOR INCOMPLETENESS 1 $71,000 13 $60,709 94 $101,039 4 $49,465 0 $0 5 $127,372 0 $0
Aggregated Statistics For Year 2003(Based on 5 full and 4 partial tracts) A) FHA, FSA/RHS & VA B) Conventional C) Refinancings D) Home Improvement Loans E) Loans on Dwellings For 5+ Families F) Non-occupant Loans on Number Average Value Number Average Value Number Average Value Number Average Value Number Average Value Number Average Value
LOANS ORIGINATED 102 $92,617 275 $83,331 587 $84,977 40 $41,527 1 $2,520,560 104 $64,438 APPLICATIONS APPROVED, NOT ACCEPTED 7 $91,516 26 $72,590 68 $77,143 11 $28,753 0 $0 7 $45,701 APPLICATIONS DENIED 11 $76,316 59 $61,939 298 $71,678 44 $23,275 0 $0 25 $60,677 APPLICATIONS WITHDRAWN 16 $93,979 35 $80,794 150 $81,105 2 $33,155 0 $0 12 $55,876 FILES CLOSED FOR INCOMPLETENESS 1 $54,910 12 $52,534 23 $105,974 2 $17,645 0 $0 3 $21,970
Aggregated Statistics For Year 2002(Based on 5 full and 3 partial tracts) A) FHA, FSA/RHS & VA B) Conventional C) Refinancings D) Home Improvement Loans E) Loans on Dwellings For 5+ Families F) Non-occupant Loans on Number Average Value Number Average Value Number Average Value Number Average Value Number Average Value Number Average Value
LOANS ORIGINATED 117 $94,950 236 $76,843 252 $76,092 32 $29,318 2 $1,024,670 78 $54,793 APPLICATIONS APPROVED, NOT ACCEPTED 7 $66,226 30 $79,281 47 $71,837 12 $34,458 0 $0 8 $31,090 APPLICATIONS DENIED 12 $75,316 77 $66,942 126 $52,742 43 $18,759 1 $139,000 21 $38,124 APPLICATIONS WITHDRAWN 19 $77,235 55 $75,094 105 $75,364 6 $22,757 0 $0 13 $70,375 FILES CLOSED FOR INCOMPLETENESS 0 $0 11 $75,173 26 $83,176 0 $0 0 $0 2 $31,905
Aggregated Statistics For Year 2001(Based on 5 full and 3 partial tracts) A) FHA, FSA/RHS & VA B) Conventional C) Refinancings D) Home Improvement Loans E) Loans on Dwellings For 5+ Families F) Non-occupant Loans on Number Average Value Number Average Value Number Average Value Number Average Value Number Average Value Number Average Value
LOANS ORIGINATED 93 $80,726 225 $72,039 220 $71,920 51 $23,965 4 $147,508 54 $45,052 APPLICATIONS APPROVED, NOT ACCEPTED 2 $56,365 56 $52,811 30 $39,345 9 $31,793 0 $0 10 $55,766 APPLICATIONS DENIED 6 $51,942 94 $48,994 101 $49,885 51 $17,155 0 $0 10 $18,873 APPLICATIONS WITHDRAWN 23 $74,067 43 $71,289 103 $62,758 8 $25,922 0 $0 4 $58,698 FILES CLOSED FOR INCOMPLETENESS 0 $0 9 $67,194 13 $93,750 0 $0 0 $0 0 $0
Aggregated Statistics For Year 2000(Based on 5 full and 3 partial tracts) A) FHA, FSA/RHS & VA B) Conventional C) Refinancings D) Home Improvement Loans F) Non-occupant Loans on Number Average Value Number Average Value Number Average Value Number Average Value Number Average Value
LOANS ORIGINATED 108 $67,037 244 $78,232 94 $60,925 39 $26,977 44 $57,282 APPLICATIONS APPROVED, NOT ACCEPTED 19 $51,869 71 $47,164 23 $41,642 27 $17,146 7 $34,413 APPLICATIONS DENIED 29 $56,128 201 $48,343 72 $58,208 31 $17,171 17 $37,965 APPLICATIONS WITHDRAWN 12 $72,465 38 $70,069 51 $61,315 5 $14,406 8 $46,732 FILES CLOSED FOR INCOMPLETENESS 3 $64,000 11 $63,752 14 $77,212 0 $0 1 $63,470
Aggregated Statistics For Year 1999(Based on 5 full and 3 partial tracts) A) FHA, FSA/RHS & VA B) Conventional C) Refinancings D) Home Improvement Loans E) Loans on Dwellings For 5+ Families F) Non-occupant Loans on Number Average Value Number Average Value Number Average Value Number Average Value Number Average Value Number Average Value
LOANS ORIGINATED 107 $68,847 231 $73,390 154 $60,599 54 $18,809 3 $2,095,333 58 $51,070 APPLICATIONS APPROVED, NOT ACCEPTED 1 $33,880 75 $55,551 32 $51,630 18 $13,058 0 $0 12 $38,374 APPLICATIONS DENIED 7 $54,281 260 $52,216 64 $50,431 42 $11,901 1 $213,390 25 $45,368 APPLICATIONS WITHDRAWN 6 $69,152 31 $66,363 63 $46,783 5 $18,090 0 $0 3 $27,740 FILES CLOSED FOR INCOMPLETENESS 0 $0 4 $77,438 20 $62,910 2 $40,000 0 $0 1 $108,000
Detailed mortgage data for all 9 tracts in Sherman, TX
Private Mortgage Insurance Companies Aggregated Statistics For Year 2009(Based on 5 full and 4 partial tracts) A) Conventional B) Refinancings C) Non-occupant Loans on Number Average Value Number Average Value Number Average Value
LOANS ORIGINATED 11 $100,695 8 $140,935 1 $36,520 APPLICATIONS APPROVED, NOT ACCEPTED 1 $80,000 4 $184,295 0 $0 APPLICATIONS DENIED 0 $0 2 $161,385 0 $0 APPLICATIONS WITHDRAWN 1 $42,460 1 $141,730 0 $0 FILES CLOSED FOR INCOMPLETENESS 1 $66,700 0 $0 1 $66,700
Aggregated Statistics For Year 2008(Based on 5 full and 4 partial tracts) A) Conventional B) Refinancings C) Non-occupant Loans on Number Average Value Number Average Value Number Average Value
LOANS ORIGINATED 39 $92,400 10 $126,146 11 $68,803 APPLICATIONS APPROVED, NOT ACCEPTED 18 $113,077 5 $104,752 5 $93,970 APPLICATIONS DENIED 6 $64,297 2 $83,250 4 $81,345 APPLICATIONS WITHDRAWN 0 $0 1 $116,000 0 $0 FILES CLOSED FOR INCOMPLETENESS 1 $107,510 0 $0 0 $0
Aggregated Statistics For Year 2007(Based on 4 full and 4 partial tracts) A) Conventional B) Refinancings C) Non-occupant Loans on Number Average Value Number Average Value Number Average Value
LOANS ORIGINATED 104 $99,802 7 $119,333 12 $70,839 APPLICATIONS APPROVED, NOT ACCEPTED 10 $102,019 1 $144,350 2 $51,450 APPLICATIONS DENIED 1 $132,000 0 $0 0 $0 APPLICATIONS WITHDRAWN 3 $85,110 0 $0 0 $0 FILES CLOSED FOR INCOMPLETENESS 0 $0 0 $0 0 $0
Aggregated Statistics For Year 2006(Based on 4 full and 4 partial tracts) A) Conventional B) Refinancings C) Non-occupant Loans on Number Average Value Number Average Value Number Average Value
LOANS ORIGINATED 65 $90,345 5 $112,378 7 $75,280 APPLICATIONS APPROVED, NOT ACCEPTED 7 $62,103 0 $0 3 $60,333 APPLICATIONS DENIED 1 $139,960 0 $0 0 $0 APPLICATIONS WITHDRAWN 3 $141,350 0 $0 0 $0 FILES CLOSED FOR INCOMPLETENESS 0 $0 0 $0 0 $0
Aggregated Statistics For Year 2005(Based on 5 full and 4 partial tracts) A) Conventional B) Refinancings C) Non-occupant Loans on Number Average Value Number Average Value Number Average Value
LOANS ORIGINATED 69 $92,196 9 $131,577 8 $54,536 APPLICATIONS APPROVED, NOT ACCEPTED 7 $58,943 3 $89,280 1 $65,000 APPLICATIONS DENIED 1 $42,000 1 $55,040 1 $42,000 APPLICATIONS WITHDRAWN 5 $59,620 0 $0 1 $56,370 FILES CLOSED FOR INCOMPLETENESS 1 $75,390 0 $0 0 $0
Aggregated Statistics For Year 2004(Based on 5 full and 4 partial tracts) A) Conventional B) Refinancings C) Non-occupant Loans on Number Average Value Number Average Value Number Average Value
LOANS ORIGINATED 77 $85,935 12 $99,781 17 $71,079 APPLICATIONS APPROVED, NOT ACCEPTED 12 $78,760 4 $147,715 1 $52,160 APPLICATIONS DENIED 3 $51,390 0 $0 1 $36,000 APPLICATIONS WITHDRAWN 10 $94,823 2 $241,125 3 $63,497 FILES CLOSED FOR INCOMPLETENESS 1 $70,950 0 $0 0 $0
Aggregated Statistics For Year 2003(Based on 5 full and 4 partial tracts) A) Conventional B) Refinancings C) Non-occupant Loans on Number Average Value Number Average Value Number Average Value
LOANS ORIGINATED 79 $93,115 63 $110,207 18 $62,804 APPLICATIONS APPROVED, NOT ACCEPTED 6 $92,683 10 $102,657 1 $77,000 APPLICATIONS DENIED 1 $116,000 0 $0 1 $116,000 APPLICATIONS WITHDRAWN 6 $121,788 3 $52,590 2 $28,565 FILES CLOSED FOR INCOMPLETENESS 0 $0 1 $99,000 0 $0
Aggregated Statistics For Year 2002(Based on 5 full and 3 partial tracts) A) Conventional B) Refinancings C) Non-occupant Loans on Number Average Value Number Average Value Number Average Value
LOANS ORIGINATED 90 $93,224 28 $99,574 10 $73,877 APPLICATIONS APPROVED, NOT ACCEPTED 11 $128,798 4 $94,750 1 $80,000 APPLICATIONS DENIED 3 $83,310 1 $65,220 1 $21,500 APPLICATIONS WITHDRAWN 1 $90,400 0 $0 0 $0 FILES CLOSED FOR INCOMPLETENESS 0 $0 0 $0 0 $0
Aggregated Statistics For Year 2001(Based on 5 full and 3 partial tracts) A) Conventional B) Refinancings C) Non-occupant Loans on Number Average Value Number Average Value Number Average Value
LOANS ORIGINATED 82 $90,815 19 $129,868 7 $56,490 APPLICATIONS APPROVED, NOT ACCEPTED 10 $94,000 1 $175,100 0 $0 APPLICATIONS DENIED 1 $120,140 0 $0 0 $0 APPLICATIONS WITHDRAWN 1 $71,000 0 $0 0 $0 FILES CLOSED FOR INCOMPLETENESS 0 $0 0 $0 0 $0
Aggregated Statistics For Year 2000(Based on 4 full and 3 partial tracts) A) Conventional B) Refinancings C) Non-occupant Loans on Number Average Value Number Average Value Number Average Value
LOANS ORIGINATED 71 $78,067 5 $72,930 9 $53,459 APPLICATIONS APPROVED, NOT ACCEPTED 8 $111,076 0 $0 1 $53,420 APPLICATIONS DENIED 2 $55,735 1 $183,780 1 $129,000 APPLICATIONS WITHDRAWN 1 $55,560 1 $30,100 0 $0 FILES CLOSED FOR INCOMPLETENESS 1 $49,990 0 $0 1 $21,500
Aggregated Statistics For Year 1999(Based on 4 full and 3 partial tracts) A) Conventional B) Refinancings C) Non-occupant Loans on Number Average Value Number Average Value Number Average Value
LOANS ORIGINATED 67 $81,041 21 $95,453 5 $41,052 APPLICATIONS APPROVED, NOT ACCEPTED 4 $83,868 2 $70,505 1 $106,000 APPLICATIONS DENIED 4 $31,488 0 $0 0 $0 APPLICATIONS WITHDRAWN 2 $67,770 0 $0 0 $0 FILES CLOSED FOR INCOMPLETENESS 1 $37,000 0 $0 1 $37,000
Fire-safe hotels and motels in Sherman, Texas:
Quality Inn Sherman, 3605 Hwy 75 S, Sherman, Texas 75090 Phone: (903) 868-0555, Fax: (903) 892-9396
Comfort Suites, 2900 Hwy 75 N, Sherman, Texas 75090 Phone: (903) 893-0499, Fax: (903) 891-3685
Hampton Inn, 2904 Michelle Dr, Sherman, Texas 75092 Phone: (903) 893-9333, Fax: (903) 891-8812
Super 8 Sherman, 111 E Hwy 1417, Sherman, Texas 75090 Phone: (903) 868-9325, Fax: (903) 870-0114
Holiday Inn Express Hotel & Suites, 2909 Michelle Dr, Sherman, Texas 75092 Phone: (903) 892-3300, Fax: (903) 868-4105
All 5 fire-safe hotels and motels in Sherman, Texas
Most common first names in Sherman, TX among deceased individuals Name Count Lived (average)
Mary 319 80.0 years James 310 73.0 years William 306 76.6 years John 266 75.9 years Robert 192 72.3 years George 133 76.5 years Charles 124 74.5 years Dorothy 103 77.4 years Margaret 92 76.8 years Ruby 86 80.8 years
Most common last names in Sherman, TX among deceased individuals Last name Count Lived (average)
Smith 168 77.4 years Brown 124 76.8 years Williams 95 75.4 years Johnson 86 77.3 years Taylor 80 74.4 years Wilson 80 76.4 years Miller 79 78.5 years Davis 70 74.7 years Thompson 67 76.6 years Jones 63 73.9 years
Sherman compared to Texas state average:
Unemployed percentage below state average. Length of stay since moving in significantly above state average.
Top Patent Applicants
Roy Ronald Pelfrey (14)
Stuart A. Connell (9)
Fernando Gonzalez (3)
Sean M. Malolepszy (3)
Jerry Dean Wright (3)
Christopher Michael Graves (3)
Susan A. Curtis (3)
David Sanders (3)
Mike Patterson (3)
Sean Michael Malolepszy (3)
Total of 105 patent applications in 2008-2024.


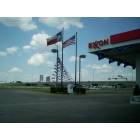


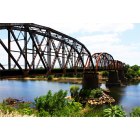
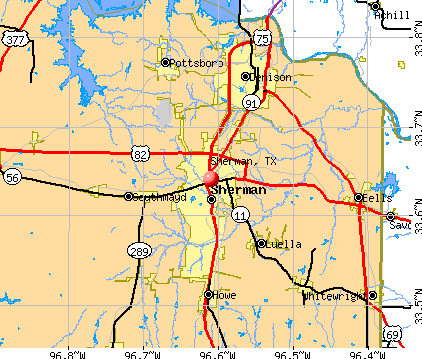


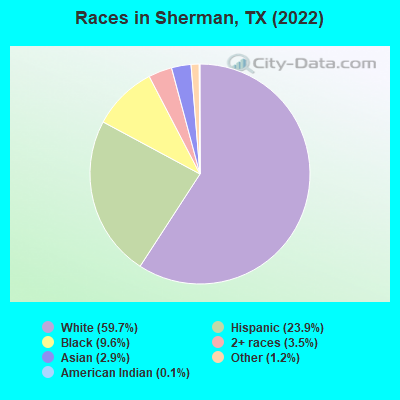
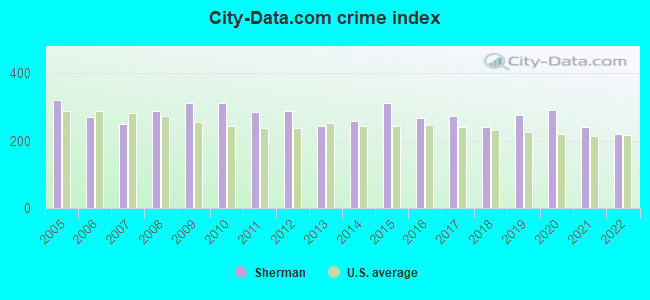
 Recent articles from our blog. Our writers, many of them Ph.D. graduates or candidates, create easy-to-read articles on a wide variety of topics.

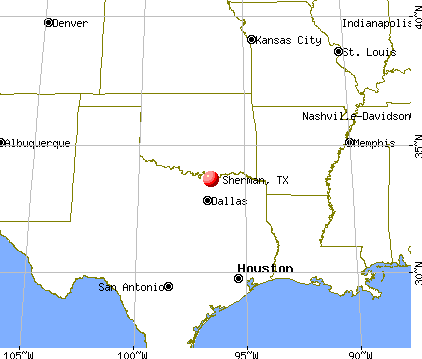
 , pop. 81,381).
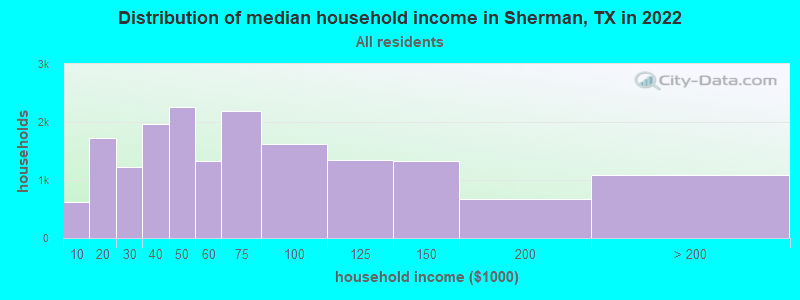
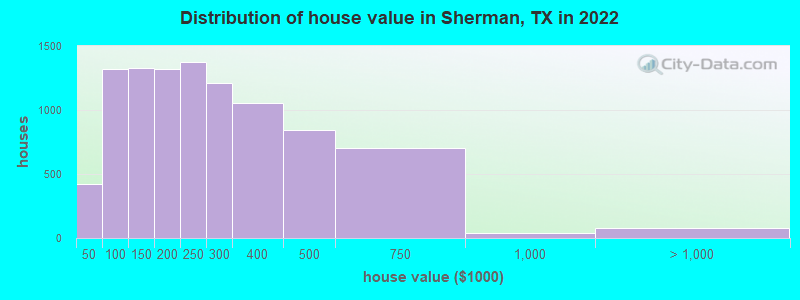
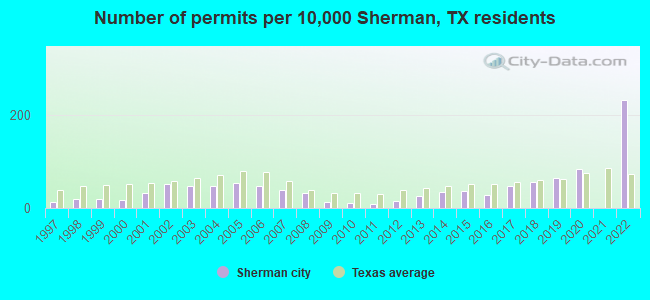
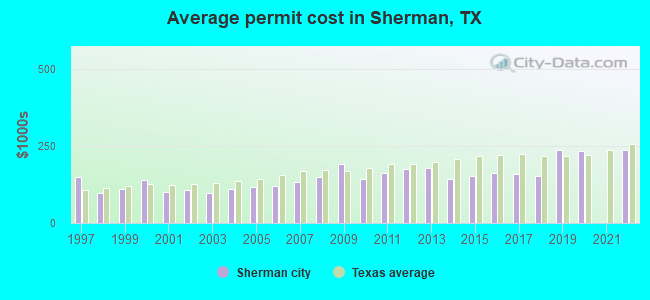
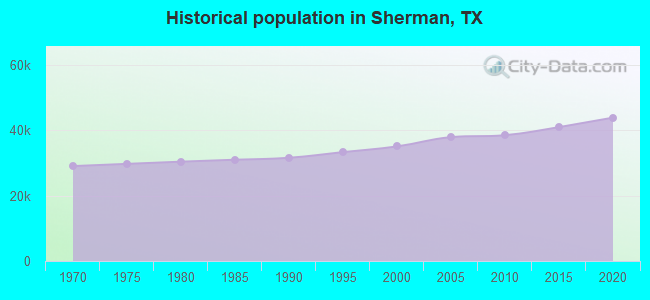
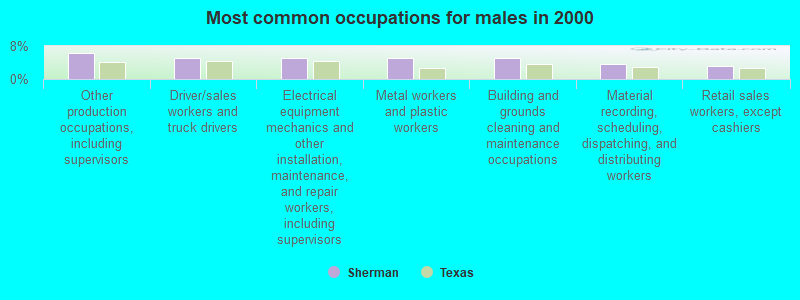
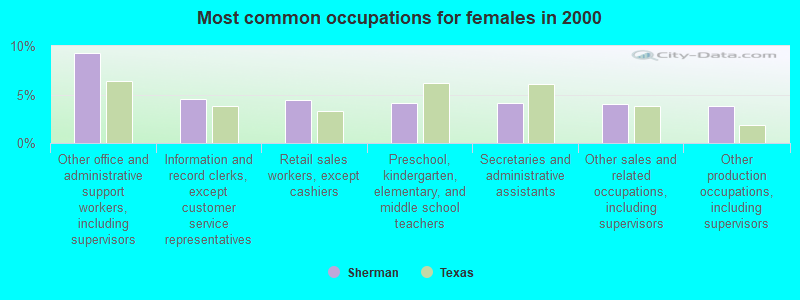
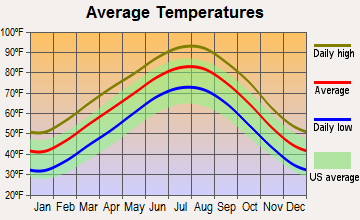
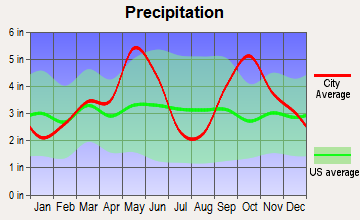
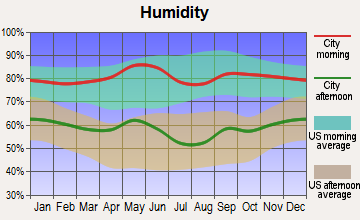
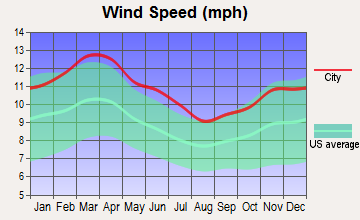
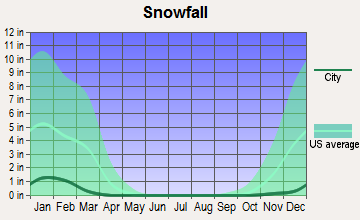
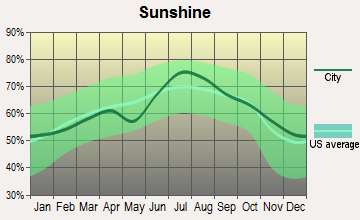
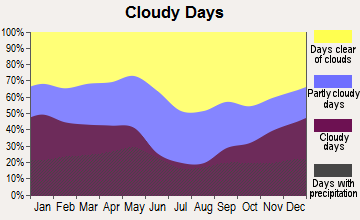


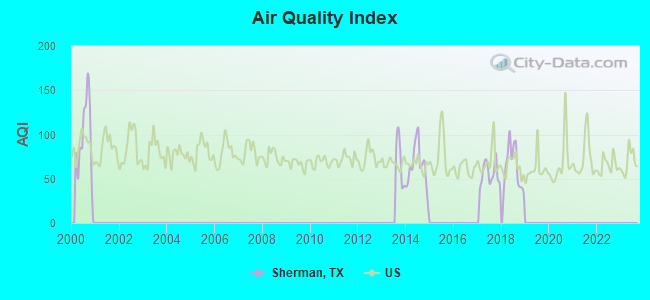
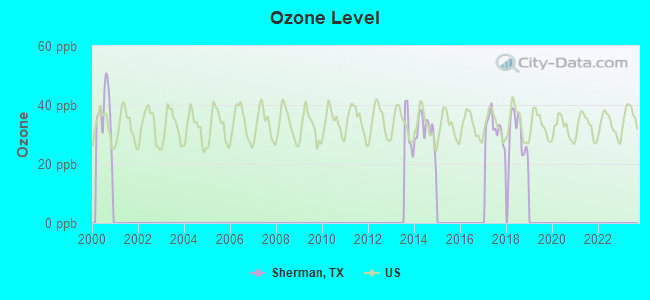

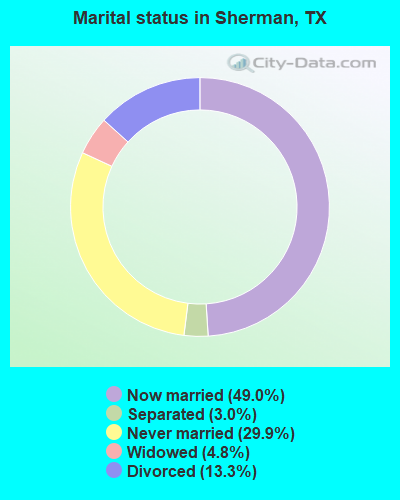
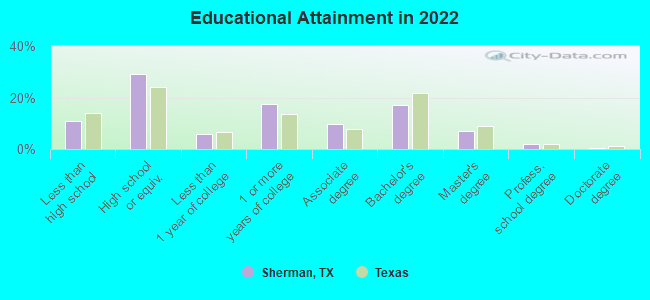
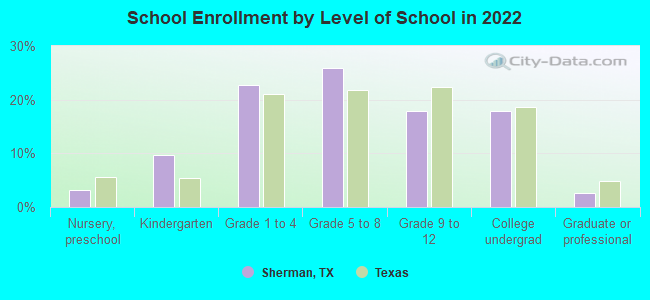
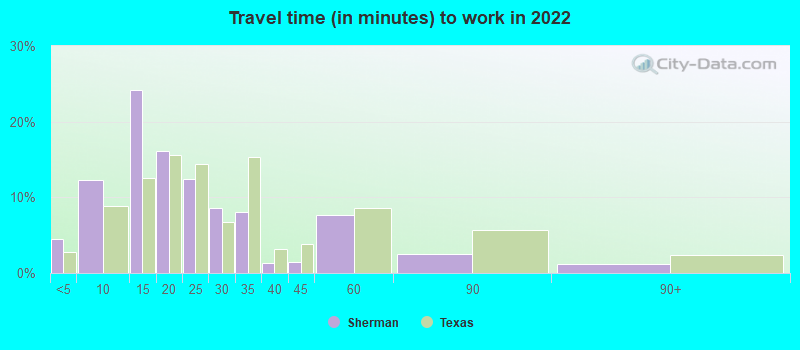
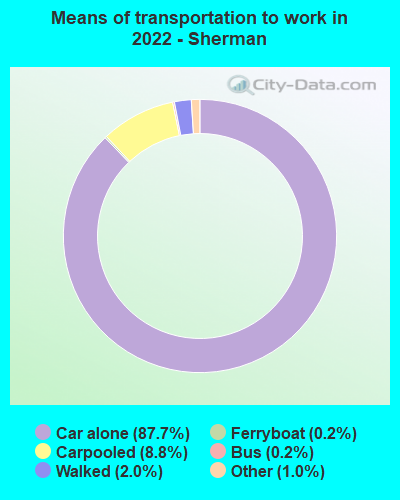
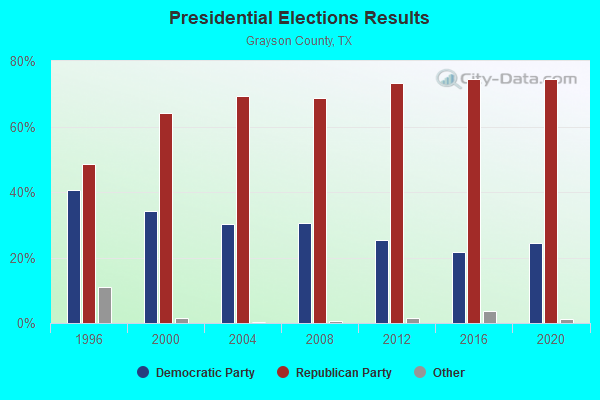
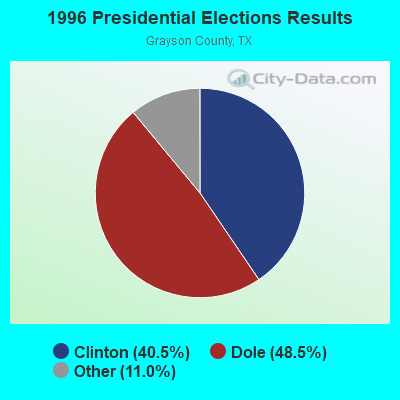
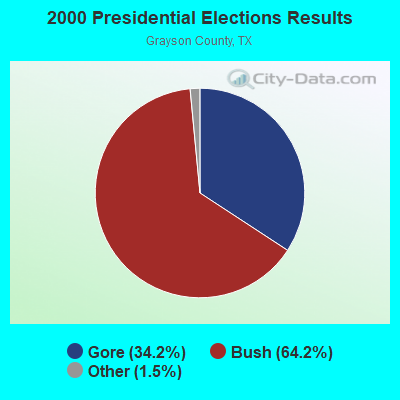
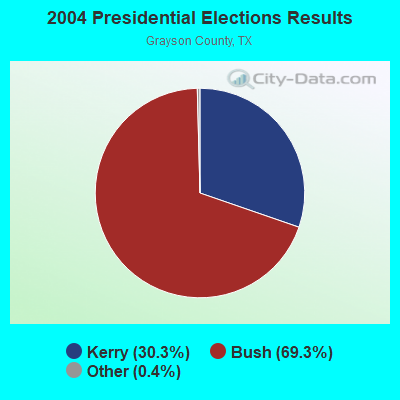
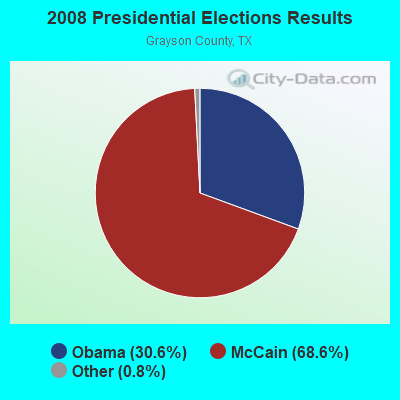
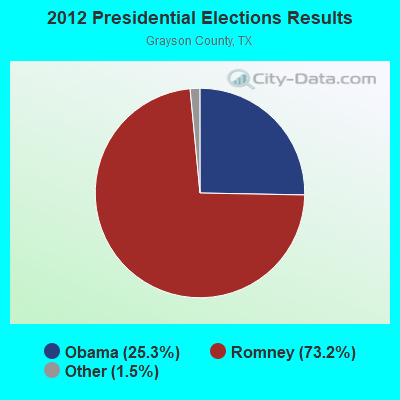
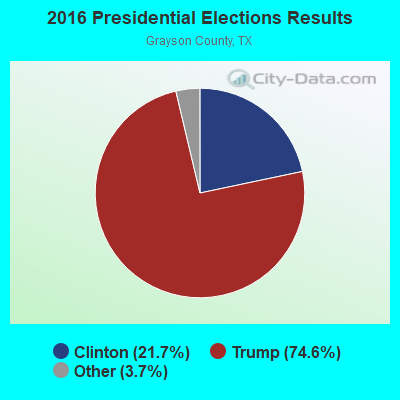
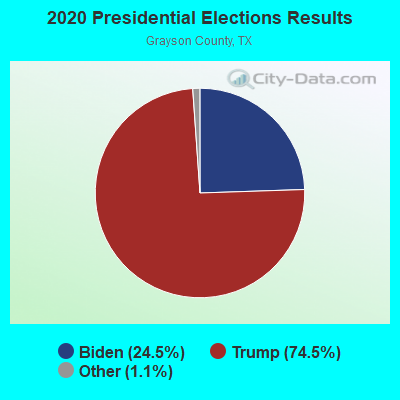
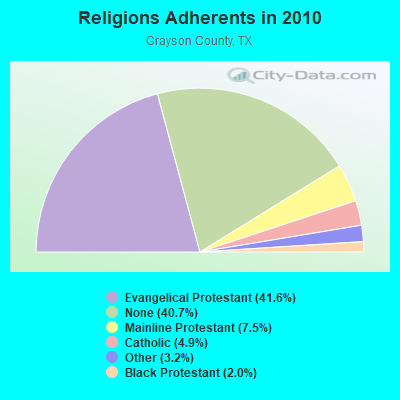
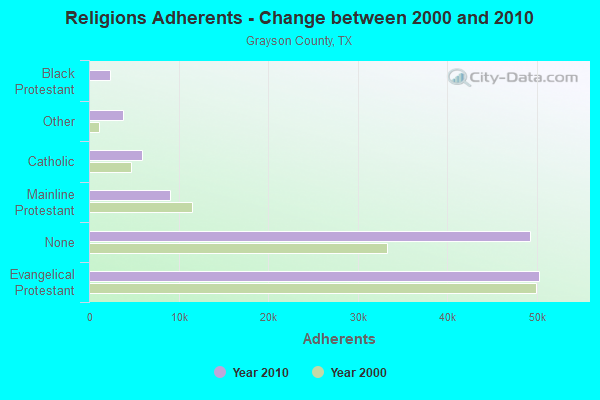
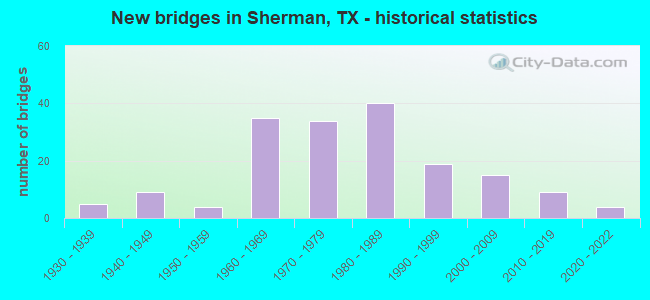
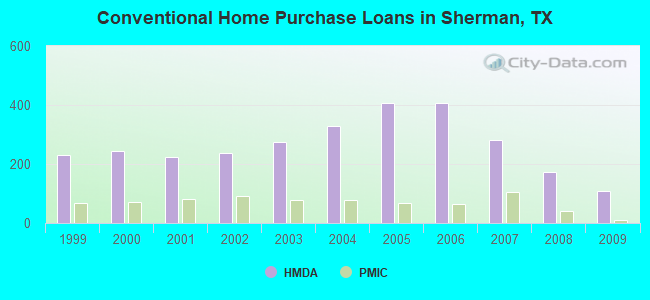
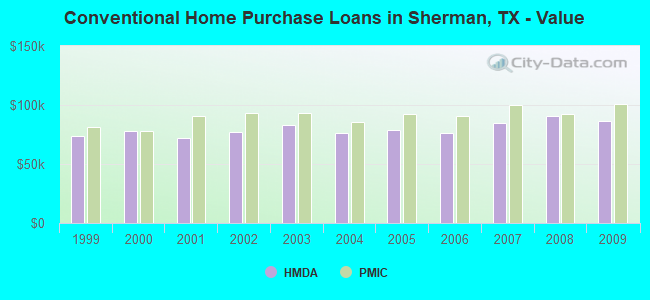
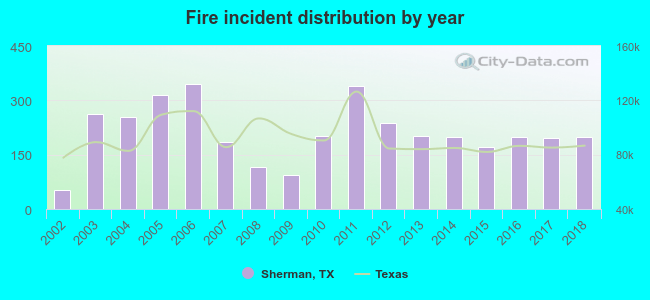 Based on the data from the years 2002 - 2018 the average number of fire incidents per year is 210. The highest number of reported fire incidents - 345 took place in 2006, and the least - 53 in 2002. The data has a rising trend.
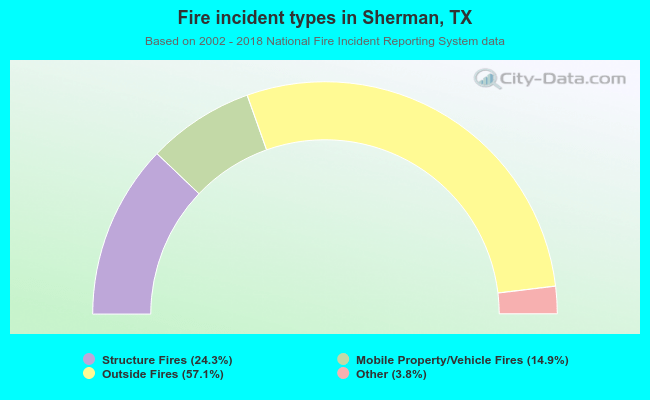 When looking into fire subcategories, the most reports belonged to: Outside Fires (57.1%), and Structure Fires (24.3%).