Spring Valley, IL (Illinois) Houses and Residents
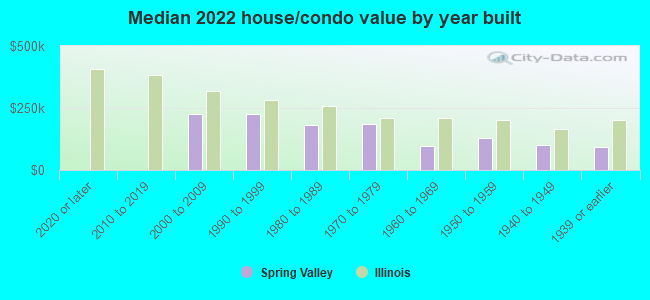
| Spring Valley: | $124,695 |
| Illinois: | $251,600 |
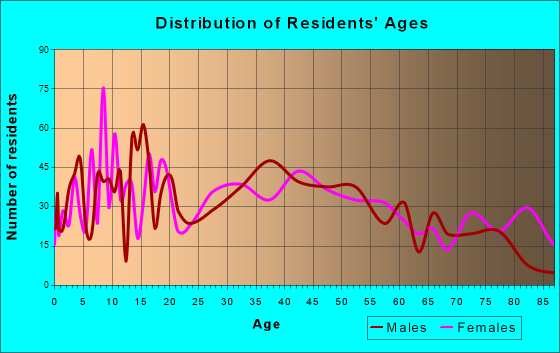
Total population: 5,359 (Urban population: 5,264 (all inside urban clusters), Rural population: 160 (all nonfarm))
Houses: 2,515 (2,314 occupied: 1,510 owner occupied, 834 renter occupied)
| % of renters here: | 36% |
| State: | 33% |
Housing density: 647 houses/condos per square mile
Median price asked for vacant for-sale houses and condos in 2022 in this county: $675,471.
Median contract rent in 2022: $602 (lower quartile is $432, upper quartile is $940)
Median rent asked for vacant for-rent units in 2022: $614
Median gross rent in Spring Valley, IL in 2022: $902
Housing units in Spring Valley with a mortgage: 741 (51 second mortgage, 0 home equity loan, 46 both second mortgage and home equity loan)
Houses without a mortgage: 19
Median household income for houses/condos with a mortgage: $78,445
Median household income for apartments without a mortgage: $63,477
Median monthly housing costs: $861
Compare current foreclosures near Spring Valley, IL:
| Photo | Address | Area | Beds / Baths | Price | Details |
|---|---|---|---|---|---|

|
#1
E 1st St
Spring Valley, IL 61362
|
- sq. feet
|
- baths - beds |
show details | |

|
#2
E Erie St
Spring Valley, IL 61362
|
- sq. feet
|
- baths - beds |
show details | |

|
#3
E 6th St
Spring Valley, IL 61362
|
- sq. feet
|
- baths - beds |
show details | |

|
#4
E Locust St
La Moille, IL 61330
|
924 sq. feet
|
1 baths 3 beds |
$129,900
|
show details |

|
#5
W Iowa St
Spring Valley, IL 61362
|
- sq. feet
|
- baths - beds |
show details | |

|
#6
Rock Island St
Spring Valley, IL 61362
|
- sq. feet
|
- baths - beds |
show details | |

|
#7
Dalzell St
Spring Valley, IL 61362
|
- sq. feet
|
- baths - beds |
show details | |

|
#8
W Minnesota St
Spring Valley, IL 61362
|
- sq. feet
|
- baths - beds |
show details | |

|
#9
Lincoln St
Seatonville, IL 61359
|
2,308 sq. feet
|
3 baths 4 beds |
show details | |

|
#10
Robert St
Henry, IL 61537
|
- sq. feet
|
- baths - beds |
$29,900
|
show details |
| Photo | Address | Area | Beds / Baths | Price | Details |
|---|---|---|---|---|---|

|
#11
2150 East St
Tiskilwa, IL 61368
|
1,630 sq. feet
|
2 baths 3 beds |
show details | |

|
#12
E Marion St
Princeton, IL 61356
|
1,268 sq. feet
|
1 baths 2 beds |
show details | |

|
#13
Oak St
Oglesby, IL 61348
|
2,074 sq. feet
|
1 baths 3 beds |
show details | |

|
#14
Main St
Henry, IL 61537
|
1,074 sq. feet
|
2 baths 3 beds |
show details | |

|
#15
Campbell Ave
La Salle, IL 61301
|
- sq. feet
|
1 baths 3 beds |
show details | |

|
#16
2400 North Ave # -
La Moille, IL 61330
|
1,700 sq. feet
|
1 baths 4 beds |
show details | |

|
#17
Pike St
Peru, IL 61354
|
672 sq. feet
|
- baths - beds |
show details | |

|
#18
9th St
La Salle, IL 61301
|
2,771 sq. feet
|
- baths - beds |
show details | |

|
#19
N Columbia Ave
Oglesby, IL 61348
|
1,144 sq. feet
|
- baths - beds |
show details | |

|
#20
4th Ave
Mendota, IL 61342
|
- sq. feet
|
- baths - beds |
show details |
| Photo | Address | Area | Beds / Baths | Price | Details |
|---|---|---|---|---|---|

|
#21
6th Ave
Mendota, IL 61342
|
- sq. feet
|
- baths - beds |
show details | |

|
#22
Grant Ave Apt 114
La Salle, IL 61301
|
- sq. feet
|
- baths - beds |
show details | |

|
#23
W 2nd St
Oglesby, IL 61348
|
- sq. feet
|
- baths - beds |
show details | |

|
#24
E 1st St
Oglesby, IL 61348
|
- sq. feet
|
- baths - beds |
show details | |

|
#25
Field Ave
Oglesby, IL 61348
|
- sq. feet
|
- baths - beds |
show details | |

|
#26
3rd St Apt 4
La Salle, IL 61301
|
- sq. feet
|
- baths - beds |
show details | |

|
#27
Oak Ridge Dr
La Salle, IL 61301
|
- sq. feet
|
- baths - beds |
show details | |

|
#28
E High St
Hennepin, IL 61327
|
- sq. feet
|
- baths - beds |
show details | |

|
#29
Claire Ln
Utica, IL 61373
|
- sq. feet
|
- baths - beds |
show details | |

|
#30
Pontiac St
Tonica, IL 61370
|
- sq. feet
|
- baths - beds |
show details |
| Photo | Address | Area | Beds / Baths | Price | Details |
|---|---|---|---|---|---|

|
#31
N 2199th Rd
Tonica, IL 61370
|
- sq. feet
|
- baths - beds |
show details | |

|
#32
School St
Henry, IL 61537
|
1,540 sq. feet
|
- baths - beds |
show details | |

|
#33
Marcia St
Henry, IL 61537
|
1,092 sq. feet
|
- baths - beds |
show details | |

|
#34
N Park Ave
Dover, IL 61323
|
- sq. feet
|
- baths - beds |
show details | |

|
#35
N Chestnut St
Princeton, IL 61356
|
- sq. feet
|
- baths - beds |
show details | |

|
#36
4th Ave
Mendota, IL 61342
|
- sq. feet
|
- baths - beds |
show details | |

|
#37
N Mercer St
Princeton, IL 61356
|
- sq. feet
|
- baths - beds |
show details | |

|
#38
Sunset Blvd
Oglesby, IL 61348
|
- sq. feet
|
- baths - beds |
show details | |

|
#39
1/2 W Marquette St
Princeton, IL 61356
|
- sq. feet
|
- baths - beds |
show details | |

|
#40
W Clark St
Princeton, IL 61356
|
- sq. feet
|
- baths - beds |
show details |
| Photo | Address | Area | Beds / Baths | Price | Details |
|---|---|---|---|---|---|

|
#41
Calhoun St
Peru, IL 61354
|
- sq. feet
|
- baths - beds |
show details | |

|
#42
Gary St
Leonore, IL 61332
|
- sq. feet
|
- baths - beds |
show details | |

|
#43
S 9th Ave Apt 135
Mendota, IL 61342
|
- sq. feet
|
- baths - beds |
show details | |

|
#44
N 17th Rd
Tonica, IL 61370
|
- sq. feet
|
- baths - beds |
show details | |

|
#45
2nd St
Mendota, IL 61342
|
- sq. feet
|
- baths - beds |
show details | |

|
#46
8th Ave
Mendota, IL 61342
|
- sq. feet
|
- baths - beds |
show details | |

|
#47
8th Ave
Mendota, IL 61342
|
- sq. feet
|
- baths - beds |
show details | |

|
#48
2nd Ave
Mendota, IL 61342
|
- sq. feet
|
- baths - beds |
show details | |

|
#49
Monroe St Apt B
Mendota, IL 61342
|
- sq. feet
|
- baths - beds |
show details | |

|
Check over 1 million property listings on Foreclosure.com!
|
browse all offers | |||


 | La Salle or Peru (23 replies) |
| Are there any IT opportunities in LaSalle County? (6 replies) |
| Towns in LaSalle county for busy family (9 replies) |
| thinking of leaving Chicago and moving to Dallas... (12 replies) |
| Thinking of moving to Lasalle Peru area (3 replies) |
| Military family moving to Schaumburg soon.... (8 replies) |
Median year apartment built: 1975
Household type by relationship:
Households: 5,442- Male householders: 1,095 (289 living alone), Female householders: 1,176 (400 living alone)
1,002 spouses (994 opposite-sex spouses), 157 unmarried partners, (145 opposite-sex unmarried partners), 1,380 children (1,297 natural, 13 adopted, 69 stepchildren), 78 grandchildren, 42 brothers or sisters, 52 parents, 0 foster children, 125 other relatives, 184 non-relatives
- In group quarters: 145
Size of family households: 835 2-persons, 214 3-persons, 235 4-persons, 92 5-persons, 43 6-persons, 49 7-or-more-persons.
Size of nonfamily households: 727 1-person, 142 2-persons, 10 3-persons.
590 married couples with children.
409 single-parent households (182 men, 227 women).
86.5% of residents of Spring Valley speak English at home.
13.1% of residents speak Spanish at home (53% speak English very well, 30% speak English well, 7% speak English not well, 10% don't speak English at all).
0.6% of residents speak other Indo-European language at home (100% speak English very well).
0.1% of residents speak Asian or Pacific Island language at home (100% speak English very well).
Foreign born population: 272 (5.0%)
(53.3% of them are naturalized citizens)
| Here: | 6.1 |
| State: | 6.4 |
| Here: | 3.8 |
| State: | 4.1 |
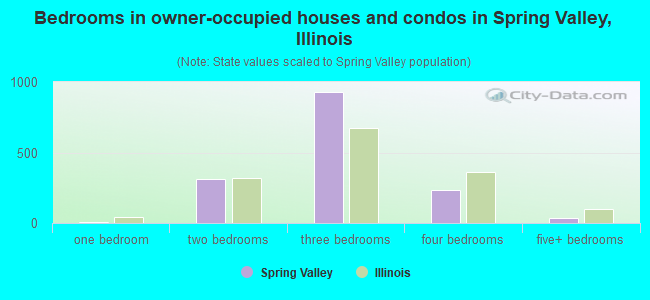
- Bedrooms in owner-occupied houses and condos in Spring Valley, Illinois
- 0no bedroom
- 71 bedroom
- 3092 bedrooms
- 9283 bedrooms
- 2344 bedrooms
- 325+ bedrooms
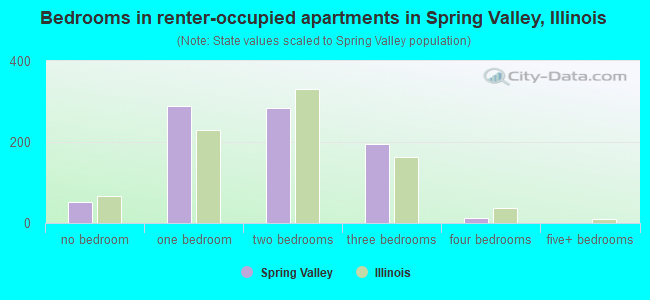
- Bedrooms in renter-occupied apartments in Spring Valley, Illinois
- 52no bedroom
- 2891 bedroom
- 2852 bedrooms
- 1953 bedrooms
- 134 bedrooms
- 05+ bedrooms
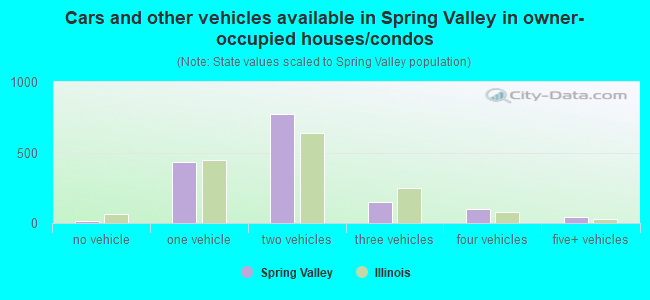
- Cars and other vehicles available in Spring Valley in owner-occupied houses/condos
- 17no vehicle
- 4341 vehicle
- 7702 vehicles
- 1503 vehicles
- 1004 vehicles
- 405+ vehicles
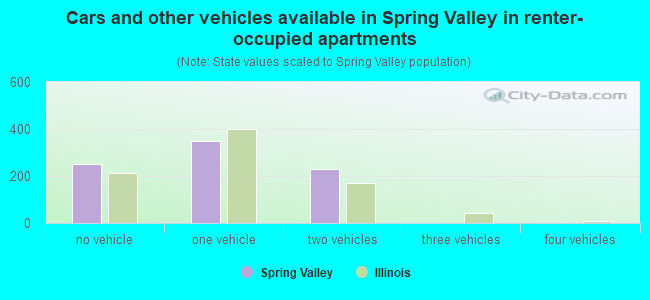
- Cars and other vehicles available in Spring Valley in renter-occupied apartments
- 252no vehicle
- 3511 vehicle
- 2312 vehicles
- 03 vehicles
- 04 vehicles
- 05+ vehicles
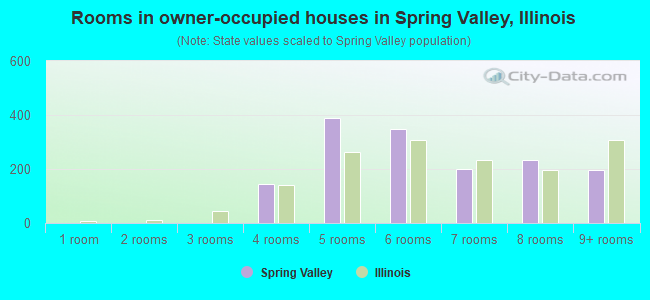
- Rooms in owner-occupied houses in Spring Valley, Illinois
- 01 room
- 02 rooms
- 03 rooms
- 1434 rooms
- 3905 rooms
- 3486 rooms
- 2007 rooms
- 2328 rooms
- 1969+ rooms
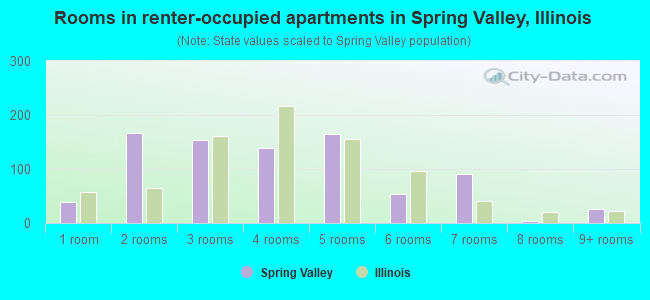
- Rooms in renter-occupied apartments in Spring Valley, Illinois
- 381 room
- 1672 rooms
- 1543 rooms
- 1384 rooms
- 1655 rooms
- 536 rooms
- 907 rooms
- 48 rooms
- 269+ rooms
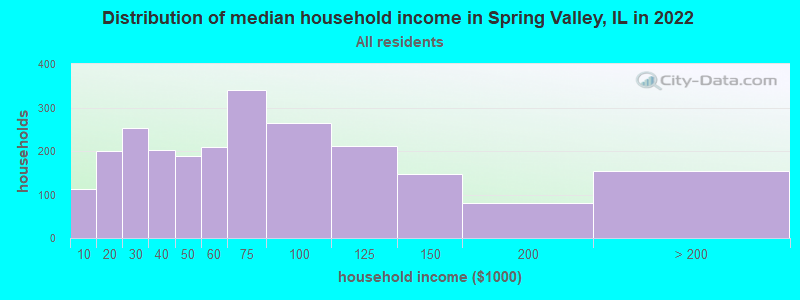
Spring Valley, IL household income distribution

- 112Less than $10,000
- 201$10,000 to $19,999
- 254$20,000 to $29,999
- 202$30,000 to $39,999
- 189$40,000 to $49,999
- 209$50,000 to $59,999
- 341$60,000 to $74,999
- 265$75,000 to $99,999
- 212$100,000 to $124,999
- 146$125,000 to $149,999
- 81$150,000 to $199,999
- 153$200,000 or more
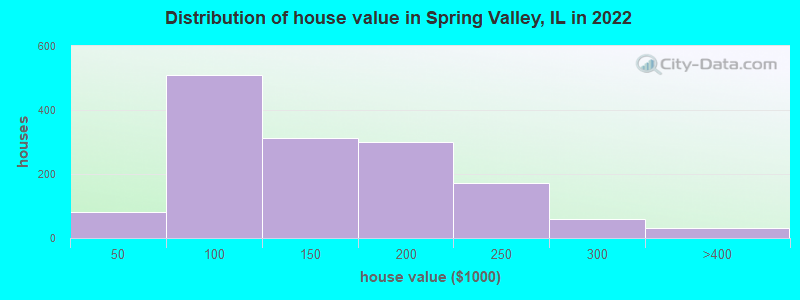
Home value of owner - occupied houses in 2022 in Spring Valley, IL
-
- 23$15,000 to $19,999
- 13$35,000 to $39,999
- 44$40,000 to $49,999
- 72$50,000 to $59,999
- 62$60,000 to $69,999
- 90$70,000 to $79,999
- 104$80,000 to $89,999
- 133$90,000 to $99,999
- 203$100,000 to $124,999
- 107$125,000 to $149,999
- 186$150,000 to $174,999
- 112$175,000 to $199,999
- 173$200,000 to $249,999
- 57$250,000 to $299,999
- 30$300,000 to $399,999
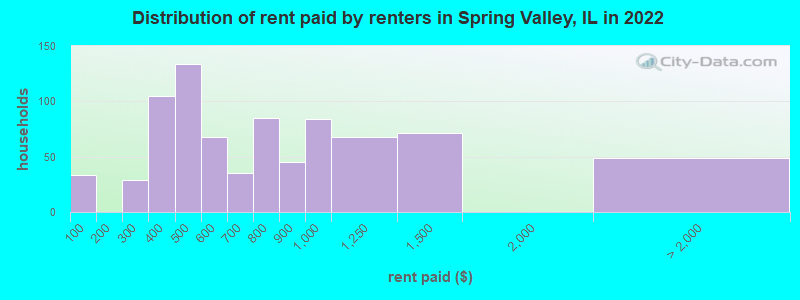
Rent paid by renters in 2022 in Spring Valley, IL
-
- 32Less than $100
- 11$200 to $249
- 18$250 to $299
- 23$300 to $349
- 81$350 to $399
- 33$400 to $449
- 100$450 to $499
- 52$500 to $549
- 15$550 to $599
- 11$600 to $649
- 22$650 to $699
- 48$700 to $749
- 37$750 to $799
- 45$800 to $899
- 83$900 to $999
- 68$1,000 to $1,249
- 70$1,250 to $1,499
- 48No cash rent
Percentage of workers working in this county: 34.8%
Number of people working at home: 69 (2.8% of all workers)
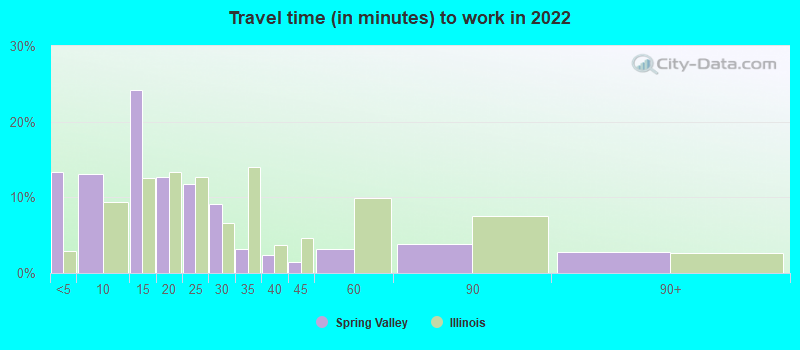
Travel time to work (commute)
- Less than 5 minutes: 248
- 5 to 9 minutes: 309
- 10 to 14 minutes: 328
- 15 to 19 minutes: 731
- 20 to 24 minutes: 259
- 25 to 29 minutes: 29
- 30 to 34 minutes: 136
- 35 to 39 minutes: 14
- 40 to 44 minutes: 30
- 45 to 59 minutes: 39
- 60 to 89 minutes: 146
- 90 or more minutes: 46
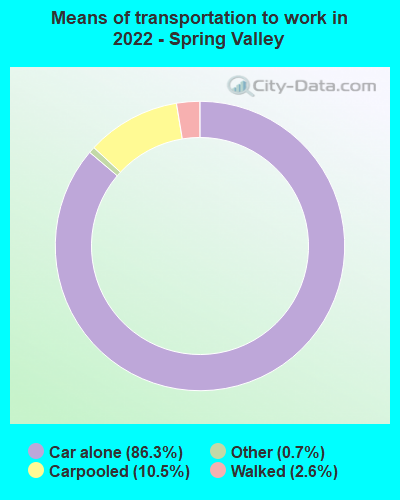
Means of transportation to work:
- Drove a car alone: 2,041 (81.3%)
- Carpooled: 264 (10.5%)
- Taxi: 17 (0.7%)
- Walked: 63 (2.5%)
- Worked at home: 69 (2.8%)
- Unemployment by race in 2022
- Unemployment rate for White non-Hispanic residents
- 2.5%Males
- 1.6%Females
- Unemployment rate for Black residents
- 43.6%Males
- Unemployment rate for two or more race residents
- 27.0%Females
- Unemployment rate for Hispanic or Latino residents
- 29.1%Females
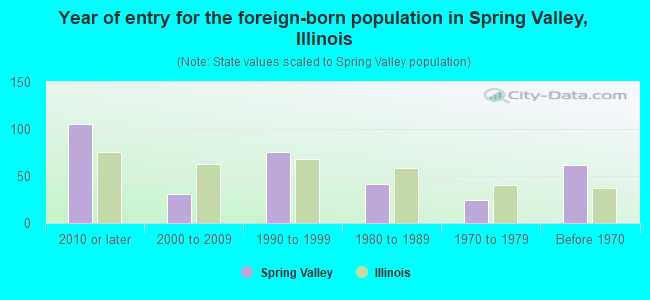
- Year of entry for the foreign-born population in Spring Valley, Illinois
- 1052010 or later
- 312000 to 2009
- 761990 to 1999
- 421980 to 1989
- 251970 to 1979
- 62Before 1970
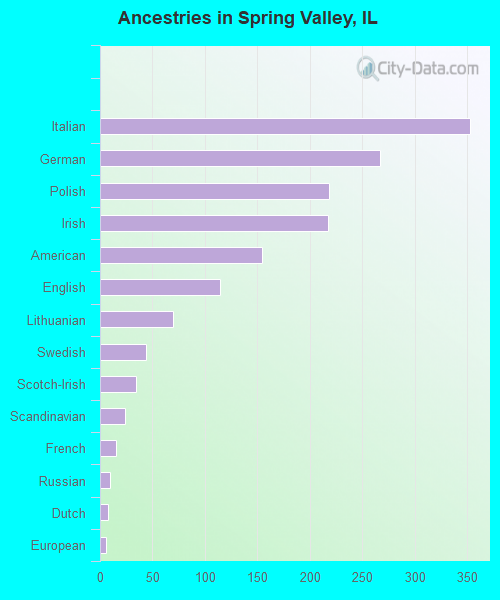
First ancestries reported:
- Italian: 353 (13.7%)
- German: 267 (10.4%)
- Polish: 218 (8.5%)
- Irish: 217 (8.4%)
- American: 154 (6.0%)
- English: 114 (4.4%)
- Lithuanian: 70 (2.7%)
- Swedish: 44 (1.7%)
- Scotch-Irish: 34 (1.3%)
- Scandinavian: 24 (0.9%)
- French: 15 (0.6%)
- Russian: 10 (0.4%)
- Dutch: 8 (0.3%)
- European: 6 (0.2%)
Most common places of birth for foreign-born residents (%):
| Spring Valley: | 82.7% (225) |
| Illinois: | 34.7% (626,958) |
| Spring Valley: | 9.9% (27) |
| Illinois: | 1.3% (22,793) |
| Spring Valley: | 4.0% (11) |
| Illinois: | 0.9% (16,308) |
| Spring Valley: | 1.8% (5) |
| Illinois: | 9.2% (166,409) |
Place of birth for U.S.-born residents:
- This state: 4,523
- Other state: 626
- Northeast: 86
- Midwest: 328
- South: 169
- West: 40
90.2% of Spring Valley residents lived in the same house 1 years ago.
Out of people who lived in different houses, 31.9% lived in this county.
Out of people who lived in different counties, 54.9% lived in Illinois.
| Spring Valley: | 90.2% |
| State average: | 88.3% |
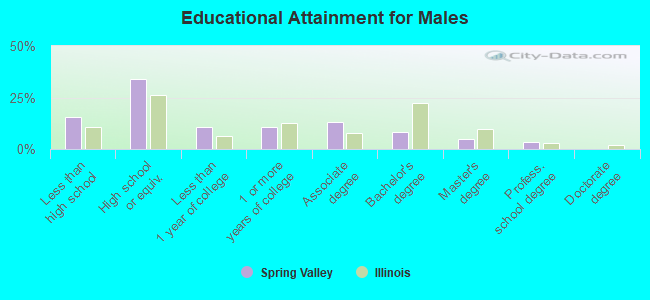
Education attainment for males 25 years and older:
- No schooling: 50
- Nursery to 4th grade: 0
- 5th and 6th grade: 0
- 7th and 8th grade: 31
- 9th grade: 51
- 10th grade: 14
- 11th grade: 33
- 12th grade, no diploma: 98
- High school graduate (or equivalency): 610
- Less than 1 year of college: 193
- Some college more than 1 year, no degree: 193
- Associate degree: 235
- Bachelor's degree: 153
- Master's degree: 88
- Professional school degree: 57
- Doctorate degree: 0
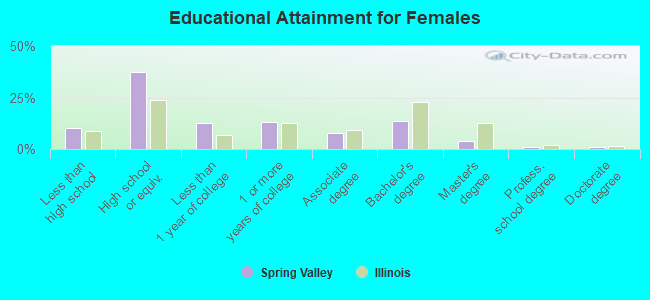
Education attainment for females 25 years and older:
- No schooling: 54
- Nursery to 4th grade: 5
- 5th and 6th grade: 0
- 7th and 8th grade: 40
- 9th grade: 19
- 10th grade: 10
- 11th grade: 56
- 12th grade, no diploma: 14
- High school graduate (or equivalency): 727
- Less than 1 year of college: 244
- Some college more than 1 year, no degree: 254
- Associate degree: 148
- Bachelor's degree: 270
- Master's degree: 72
- Professional school degree: 16
- Doctorate degree: 23
Housing units in structures:
- One, detached: 1,988
- One, attached: 41
- Two: 70
- 3 or 4: 104
- 5 to 9: 38
- 10 to 19: 40
- 20 to 49: 56
- 50 or more: 176
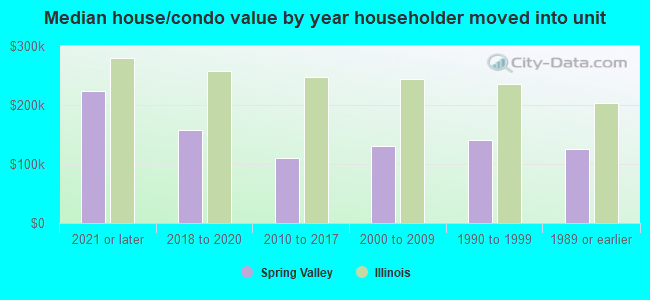
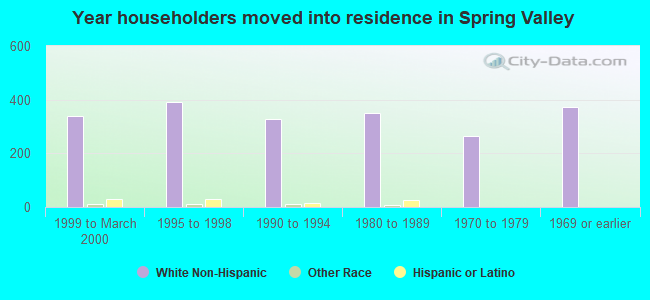
House/condo owner moved in on average 18 years ago
Renter moved in on average 8 years ago
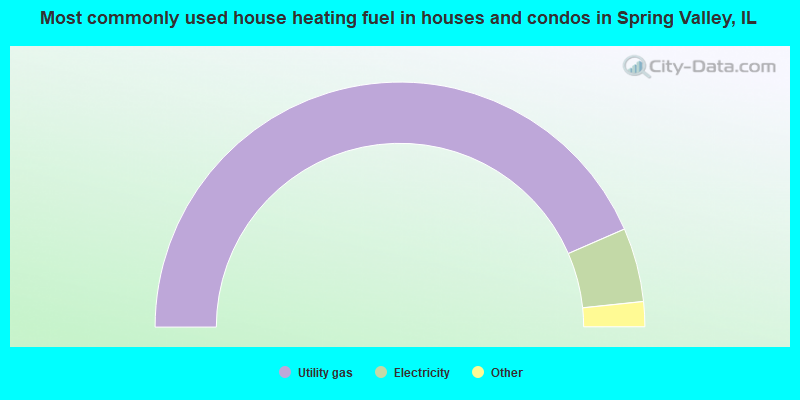
- 87.0%Utility gas
- 9.8%Electricity
- 2.3%Bottled, tank, or LP gas
- 0.9%Wood
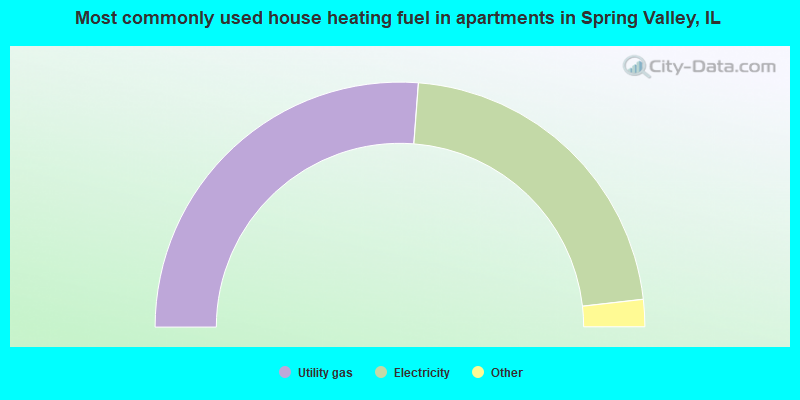
- 52.4%Utility gas
- 44.0%Electricity
- 2.3%No fuel used
- 1.2%Other fuel
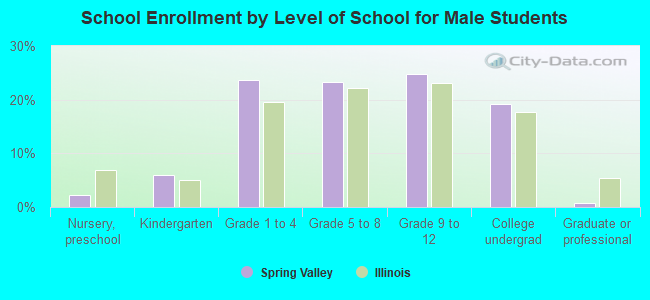
Private vs. public school enrollment:
| Here: | 24.7% |
| Illinois: | 13.3% |
| Here: | 5.1% |
| Illinois: | 9.9% |
| Here: | 18.6% |
| Illinois: | 27.4% |