Stockton, CA (California) Houses and Residents
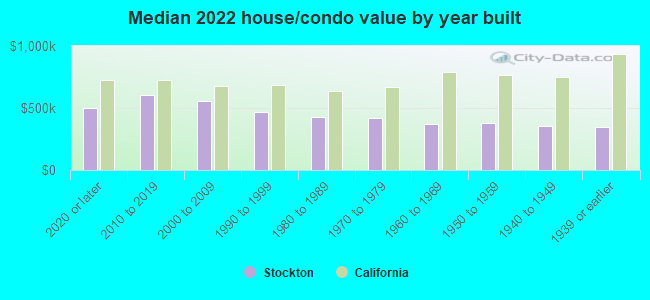
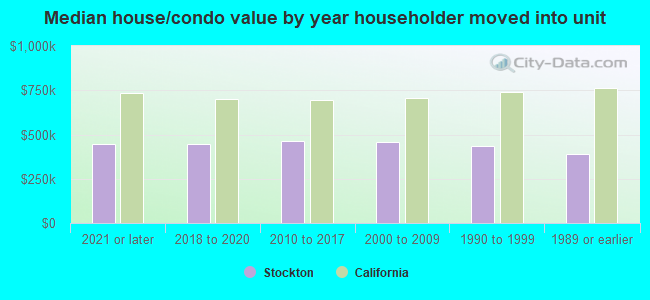
| Stockton: | $441,900 |
| California: | $715,900 |
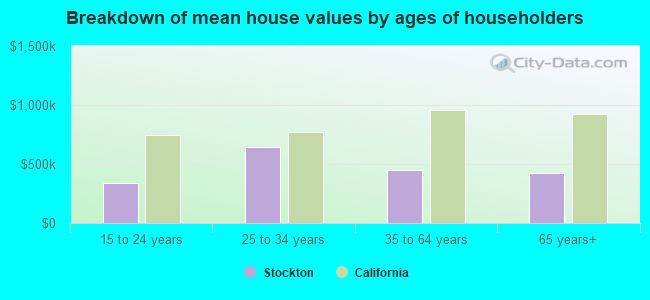
Mean price in 2022:
Detached houses: $464,547
Here: $464,547 State: $988,808 Townhouses or other attached units: $383,456
Here: $383,456 State: $838,546 In 2-unit structures: $369,567
Here: $369,567 State: $1,138,100 In 3-to-4-unit structures: $325,134
Here: $325,134 State: $824,253 In 5-or-more-unit structures: $288,776
Here: $288,776 State: $730,996 Mobile homes: $125,724
Here: $125,724 State: $184,506
Total population: 302,389 (Urban population: 242,590, Rural population: 124 (all nonfarm))
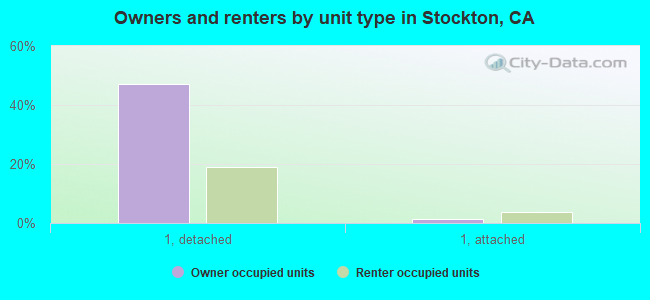
Houses: 106,904 (99,937 occupied: 56,064 owner occupied, 43,873 renter occupied)
| % of renters here: | 44% |
| State: | 44% |
Housing density: 1,954 houses/condos per square mile
Median price asked for vacant for-sale houses and condos in 2022: $656,807.
Median contract rent in 2022: $1,215 (lower quartile is $936, upper quartile is $1,596)
Median rent asked for vacant for-rent units in 2022: $1,075
Median gross rent in Stockton, CA in 2022: $1,452
Housing units in Stockton with a mortgage: 39,502 (2,797 second mortgage, 48 home equity loan, 2,212 both second mortgage and home equity loan)
Houses without a mortgage: 435
Median household income for houses/condos with a mortgage: $102,853
Median household income for apartments without a mortgage: $69,882
Median monthly housing costs: $1,524
Compare current foreclosures in Stockton, CA:
| Photo | Address | Area | Beds / Baths | Price | Details |
|---|---|---|---|---|---|

|
#1
E Bianchi Rd Apt 2
Stockton, CA 95207
|
840 sq. feet
|
1 baths 2 beds |
$189,000
|
show details |

|
#2
Quail Lakes Dr Apt 126
Stockton, CA 95207
|
612 sq. feet
|
1 baths 1 beds |
$185,000
|
show details |

|
#3
W Benjamin Holt Dr
Stockton, CA 95219
|
926 sq. feet
|
1 baths 2 beds |
show details | |

|
#4
E Washington St
Stockton, CA 95215
|
1,064 sq. feet
|
2 baths 3 beds |
show details | |

|
#5
Shorelake Ct
Stockton, CA 95219
|
2,668 sq. feet
|
3 baths 4 beds |
show details | |

|
#6
Creek Trail Cir
Stockton, CA 95209
|
2,135 sq. feet
|
3 baths 5 beds |
show details | |

|
#7
Betty Mae Ct
Stockton, CA 95212
|
2,468 sq. feet
|
2 baths 4 beds |
show details | |

|
#8
Atlanta Cir
Stockton, CA 95219
|
- sq. feet
|
2 baths 3 beds |
show details | |

|
#9
Herndon Pl
Stockton, CA 95219
|
- sq. feet
|
1 baths 3 beds |
show details | |

|
#10
Oakfield Dr
Stockton, CA 95210
|
- sq. feet
|
3 baths 4 beds |
show details |
| Photo | Address | Area | Beds / Baths | Price | Details |
|---|---|---|---|---|---|

|
#11
W Poplar St
Stockton, CA 95203
|
1,335 sq. feet
|
1 baths 2 beds |
show details | |

|
#12
Christina Ave
Stockton, CA 95204
|
- sq. feet
|
2 baths 3 beds |
show details | |

|
#13
S Hunter St
Stockton, CA 95206
|
1,149 sq. feet
|
2 baths 4 beds |
show details | |

|
#14
Shirleen Dr
Stockton, CA 95209
|
2,837 sq. feet
|
3 baths 4 beds |
show details | |

|
#15
Date St
Stockton, CA 95215
|
1,050 sq. feet
|
1 baths 3 beds |
show details | |

|
#16
De Ovan Ave
Stockton, CA 95204
|
1,059 sq. feet
|
1 baths 3 beds |
show details | |

|
#17
Boston Ave
Stockton, CA 95206
|
1,294 sq. feet
|
2 baths 4 beds |
show details | |

|
#18
Clipper Ln
Stockton, CA 95204
|
1,402 sq. feet
|
2 baths 3 beds |
show details | |

|
#19
Finland Ave
Stockton, CA 95205
|
1,199 sq. feet
|
1 baths 3 beds |
show details | |

|
#20
Ashburn Dr
Stockton, CA 95209
|
1,835 sq. feet
|
2 baths 4 beds |
show details |
| Photo | Address | Area | Beds / Baths | Price | Details |
|---|---|---|---|---|---|

|
#21
Clinton Dr
Stockton, CA 95210
|
1,503 sq. feet
|
2 baths 3 beds |
show details | |

|
#22
James Ct
Stockton, CA 95204
|
875 sq. feet
|
1 baths 3 beds |
show details | |

|
#23
Sacchetti Cir
Stockton, CA 95206
|
1,269 sq. feet
|
2 baths 3 beds |
show details | |

|
#24
Bristol Ave
Stockton, CA 95204
|
1,742 sq. feet
|
1 baths 3 beds |
show details | |

|
#25
Section Ave
Stockton, CA 95215
|
1,038 sq. feet
|
1 baths 3 beds |
show details | |

|
#26
Cambria Dr
Stockton, CA 95205
|
1,019 sq. feet
|
1 baths 3 beds |
show details | |

|
#27
N Country Club Blvd
Stockton, CA 95204
|
1,615 sq. feet
|
2 baths 3 beds |
show details | |

|
#28
Hayden Brook Dr
Stockton, CA 95212
|
2,209 sq. feet
|
3 baths 5 beds |
show details | |

|
#29
W Harding Way
Stockton, CA 95204
|
2,029 sq. feet
|
2 baths 4 beds |
show details | |

|
#30
Myran Ave
Stockton, CA 95205
|
1,025 sq. feet
|
1 baths 2 beds |
show details |
| Photo | Address | Area | Beds / Baths | Price | Details |
|---|---|---|---|---|---|

|
#31
E Taylor St
Stockton, CA 95205
|
960 sq. feet
|
2 baths 3 beds |
show details | |

|
#32
Shippee Ln
Stockton, CA 95212
|
1,528 sq. feet
|
2 baths 3 beds |
show details | |

|
#33
Ogden Ln
Stockton, CA 95206
|
1,660 sq. feet
|
2 baths 3 beds |
show details | |

|
#34
Woodhollow Ave
Stockton, CA 95206
|
2,555 sq. feet
|
3 baths 4 beds |
show details | |

|
#35
River Bluff Ln
Stockton, CA 95209
|
1,971 sq. feet
|
2 baths 4 beds |
show details | |

|
#36
S Drake Ave
Stockton, CA 95215
|
1,697 sq. feet
|
2 baths 3 beds |
show details | |

|
#37
Mission Rd
Stockton, CA 95204
|
1,007 sq. feet
|
1 baths 3 beds |
show details | |

|
#38
N Harrison St
Stockton, CA 95203
|
750 sq. feet
|
1 baths 1 beds |
show details | |

|
#39
Sepulveda Dr
Stockton, CA 95210
|
1,708 sq. feet
|
2 baths 4 beds |
show details | |

|
#40
Niobrara Ave
Stockton, CA 95206
|
1,669 sq. feet
|
2 baths 3 beds |
show details |
| Photo | Address | Area | Beds / Baths | Price | Details |
|---|---|---|---|---|---|

|
#41
W Park St
Stockton, CA 95203
|
725 sq. feet
|
1 baths 2 beds |
show details | |

|
#42
Bernal Dr
Stockton, CA 95206
|
1,905 sq. feet
|
3 baths 3 beds |
show details | |

|
#43
Del Rio Dr
Stockton, CA 95204
|
1,582 sq. feet
|
2 baths 3 beds |
show details | |

|
#44
Teton Ct
Stockton, CA 95209
|
2,707 sq. feet
|
3 baths 4 beds |
show details | |

|
#45
E 7th St
Stockton, CA 95206
|
1,344 sq. feet
|
2 baths 3 beds |
show details | |

|
#46
Shiloh Pl
Stockton, CA 95219
|
1,062 sq. feet
|
1 baths 2 beds |
show details | |

|
#47
Finland Ave
Stockton, CA 95205
|
775 sq. feet
|
1 baths 2 beds |
show details | |

|
#48
S California St
Stockton, CA 95206
|
1,965 sq. feet
|
2 baths 4 beds |
show details | |

|
#49
Geddings Way
Stockton, CA 95209
|
2,577 sq. feet
|
2 baths 4 beds |
show details | |

|
Check over 1 million property listings on Foreclosure.com!
|
browse all offers | |||

Latest news about housing in Stockton, CA collected exclusively by city-data.com from local newspapers, TV, and radio stations


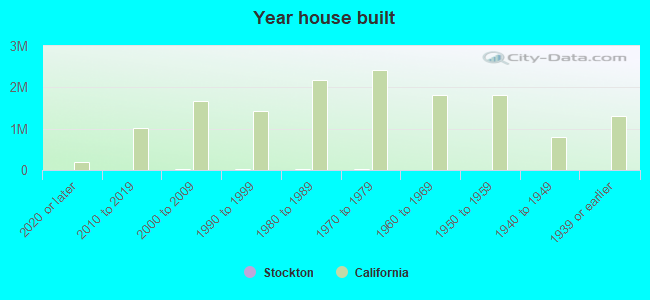
Median year apartment built: 1977
Household type by relationship:
Households: 321,796- Male householders: 44,568 (10,402 living alone), Female householders: 55,369 (13,176 living alone)
41,663 spouses (41,138 opposite-sex spouses), 7,637 unmarried partners, (7,442 opposite-sex unmarried partners), 117,613 children (109,004 natural, 3,481 adopted, 5,128 stepchildren), 9,172 grandchildren, 7,456 brothers or sisters, 11,876 parents, 345 foster children, 12,585 other relatives, 8,449 non-relatives
- In group quarters: 5,063
Size of family households: 19,756 2-persons, 16,198 3-persons, 14,791 4-persons, 10,121 5-persons, 5,542 6-persons, 4,074 7-or-more-persons.
Size of nonfamily households: 23,578 1-person, 5,361 2-persons, 175 3-persons, 204 4-persons, 137 6-persons.
45,425 married couples with children.
27,909 single-parent households (6,348 men, 21,561 women).
54.8% of residents of Stockton speak English at home.
29.7% of residents speak Spanish at home (60% speak English very well, 12% speak English well, 15% speak English not well, 13% don't speak English at all).
2.5% of residents speak other Indo-European language at home (67% speak English very well, 18% speak English well, 14% speak English not well, 1% don't speak English at all).
12.1% of residents speak Asian or Pacific Island language at home (50% speak English very well, 23% speak English well, 21% speak English not well, 6% don't speak English at all).
1.0% of residents speak other language at home (47% speak English very well, 43% speak English well, 5% speak English not well, 5% don't speak English at all).
Foreign born population: 81,073 (25.2%)
(50.7% of them are naturalized citizens)
| Here: | 6.0 |
| State: | 6.0 |
| Here: | 4.3 |
| State: | 3.9 |
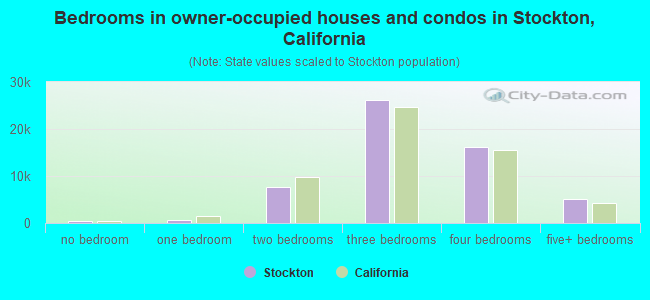
- Bedrooms in owner-occupied houses and condos in Stockton, California
- 468no bedroom
- 5801 bedroom
- 7,5712 bedrooms
- 26,2023 bedrooms
- 16,1864 bedrooms
- 5,0575+ bedrooms
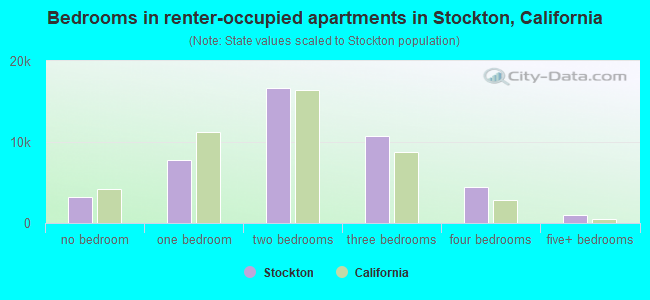
- Bedrooms in renter-occupied apartments in Stockton, California
- 3,241no bedroom
- 7,8161 bedroom
- 16,6052 bedrooms
- 10,7893 bedrooms
- 4,4204 bedrooms
- 1,0025+ bedrooms
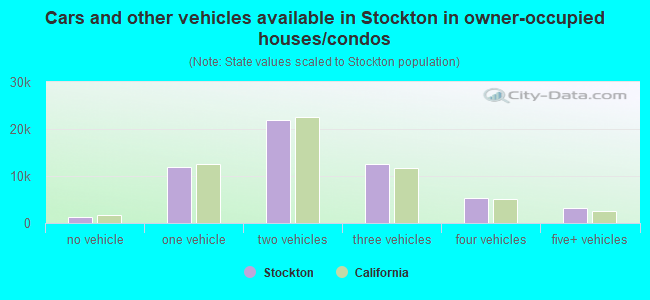
- Cars and other vehicles available in Stockton in owner-occupied houses/condos
- 1,353no vehicle
- 12,0021 vehicle
- 21,8212 vehicles
- 12,4853 vehicles
- 5,2234 vehicles
- 3,1805+ vehicles
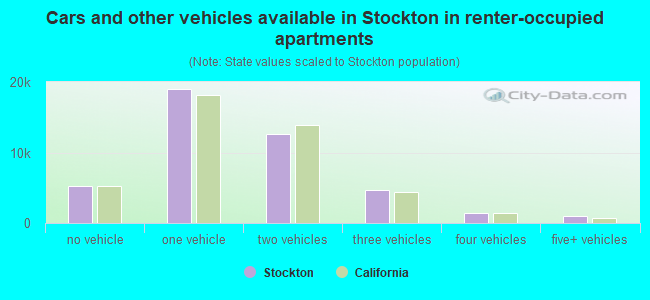
- Cars and other vehicles available in Stockton in renter-occupied apartments
- 5,251no vehicle
- 18,9821 vehicle
- 12,5602 vehicles
- 4,6663 vehicles
- 1,4634 vehicles
- 9515+ vehicles
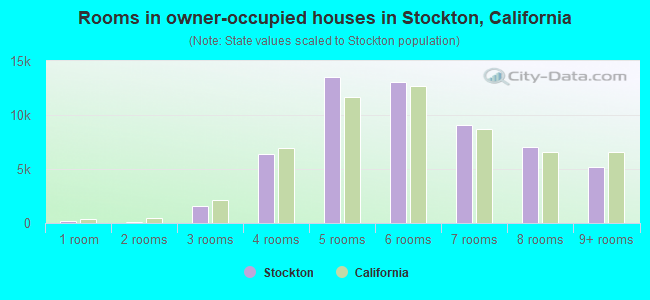
- Rooms in owner-occupied houses in Stockton, California
- 1861 room
- 1112 rooms
- 1,5473 rooms
- 6,4164 rooms
- 13,4885 rooms
- 13,0226 rooms
- 9,1087 rooms
- 6,9948 rooms
- 5,1929+ rooms
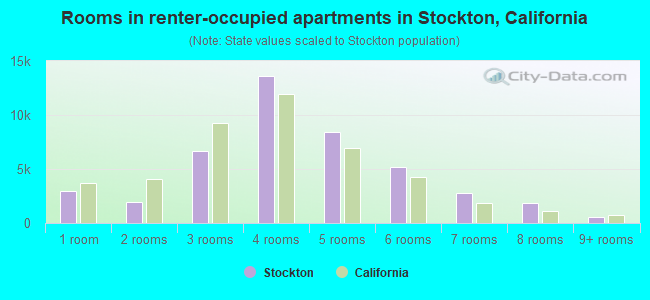
- Rooms in renter-occupied apartments in Stockton, California
- 2,9351 room
- 1,9872 rooms
- 6,6523 rooms
- 13,5894 rooms
- 8,3805 rooms
- 5,2096 rooms
- 2,7367 rooms
- 1,8078 rooms
- 5789+ rooms
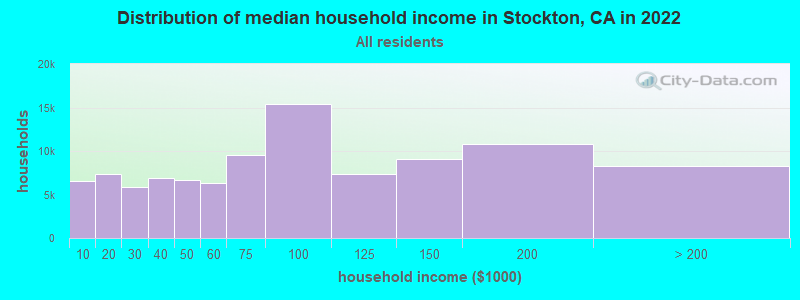
Stockton, CA household income distribution

- 6,512Less than $10,000
- 7,364$10,000 to $19,999
- 5,819$20,000 to $29,999
- 6,840$30,000 to $39,999
- 6,672$40,000 to $49,999
- 6,315$50,000 to $59,999
- 9,528$60,000 to $74,999
- 15,398$75,000 to $99,999
- 7,383$100,000 to $124,999
- 9,113$125,000 to $149,999
- 10,761$150,000 to $199,999
- 8,232$200,000 or more
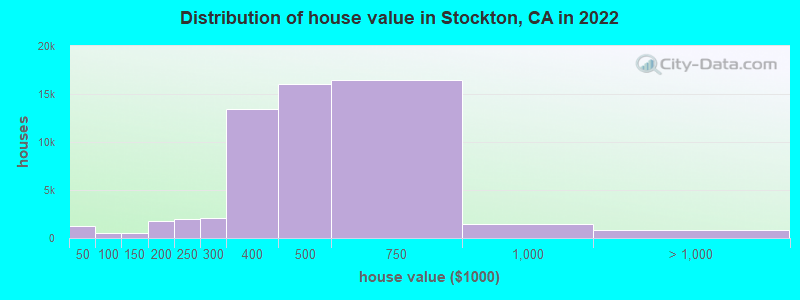
Home value of owner - occupied houses in 2022 in Stockton, CA
-
- 422Less than $10,000
- 134$10,000 to $14,999
- 48$15,000 to $19,999
- 44$20,000 to $24,999
- 128$25,000 to $29,999
- 259$30,000 to $34,999
- 157$35,000 to $39,999
- 105$40,000 to $49,999
- 111$50,000 to $59,999
- 93$60,000 to $69,999
- 245$70,000 to $79,999
- 348$100,000 to $124,999
- 130$125,000 to $149,999
- 856$150,000 to $174,999
- 869$175,000 to $199,999
- 1,943$200,000 to $249,999
- 2,040$250,000 to $299,999
- 13,393$300,000 to $399,999
- 16,005$400,000 to $499,999
- 16,435$500,000 to $749,999
- 1,510$750,000 to $999,999
- 438$1,000,000 to $1,499,999
- 351$2,000,000 or more
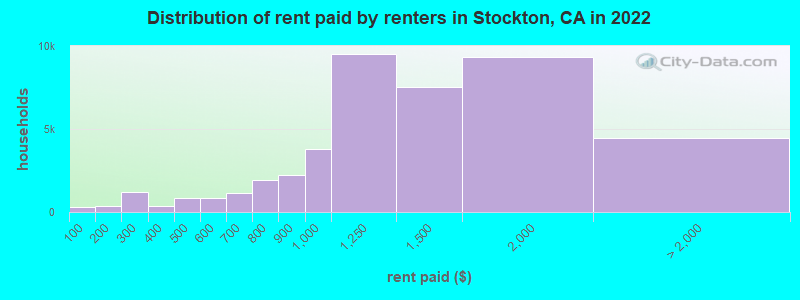
Rent paid by renters in 2022 in Stockton, CA
-
- 323Less than $100
- 322$100 to $149
- 49$150 to $199
- 781$200 to $249
- 423$250 to $299
- 331$300 to $349
- 26$350 to $399
- 172$400 to $449
- 663$450 to $499
- 637$500 to $549
- 210$550 to $599
- 336$600 to $649
- 835$650 to $699
- 862$700 to $749
- 1,052$750 to $799
- 2,246$800 to $899
- 3,772$900 to $999
- 9,510$1,000 to $1,249
- 7,519$1,250 to $1,499
- 9,322$1,500 to $1,999
- 2,297$2,000 to $2,499
- 244$2,500 to $2,999
- 542$3,000 to $3,499
- 1,399No cash rent
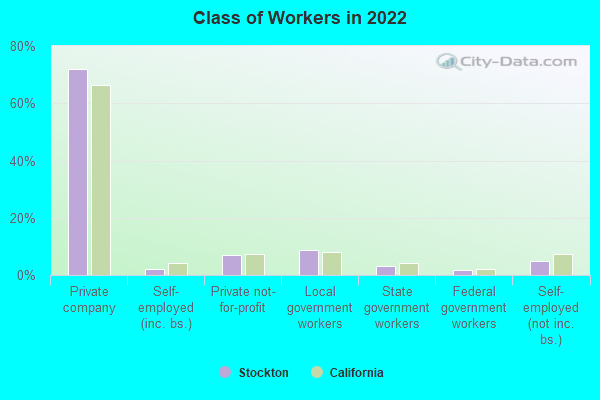
Percentage of workers working in this county: 83.7%
Number of people working at home: 11,369 (8.2% of all workers)
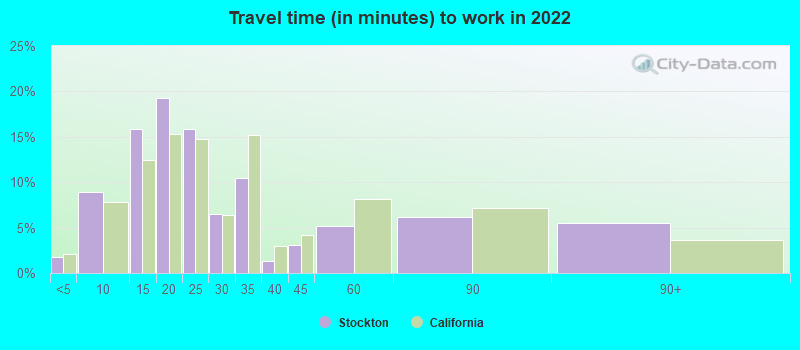
Travel time to work (commute)
- Less than 5 minutes: 1,252
- 5 to 9 minutes: 9,873
- 10 to 14 minutes: 18,045
- 15 to 19 minutes: 24,802
- 20 to 24 minutes: 21,753
- 25 to 29 minutes: 6,050
- 30 to 34 minutes: 14,195
- 35 to 39 minutes: 2,115
- 40 to 44 minutes: 2,982
- 45 to 59 minutes: 5,979
- 60 to 89 minutes: 7,650
- 90 or more minutes: 13,313
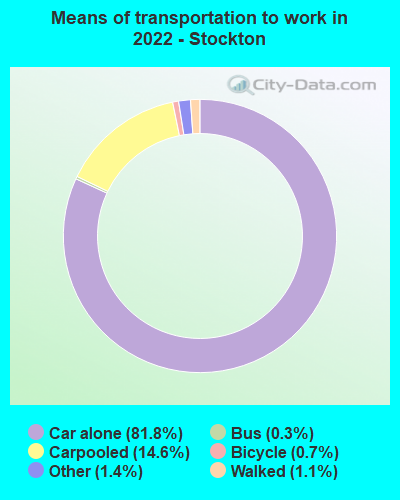
Means of transportation to work:
- Drove a car alone: 94,812 (74.5%)
- Carpooled: 16,967 (13.3%)
- Bus: 337 (0.3%)
- Subway or elevated rail: 33 (0.0%)
- Taxi: 1,623 (1.3%)
- Bicycle: 822 (0.6%)
- Walked: 1,260 (1.0%)
- Worked at home: 11,369 (8.9%)
- Unemployment by race in 2022
- Unemployment rate for White non-Hispanic residents
- 8.4%Males
- 5.4%Females
- Unemployment rate for Black residents
- 16.1%Males
- 7.2%Females
- Unemployment rate for American Indian and Alaska Native residents
- 7.5%Males
- 7.3%Females
- Unemployment rate for Asian residents
- 4.3%Males
- 2.7%Females
- Unemployment rate for other race residents
- 2.5%Males
- 9.3%Females
- Unemployment rate for two or more race residents
- 6.2%Males
- 8.1%Females
- Unemployment rate for Hispanic or Latino residents
- 4.5%Males
- 10.3%Females
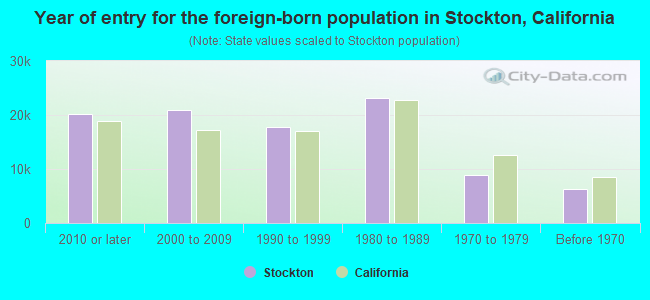
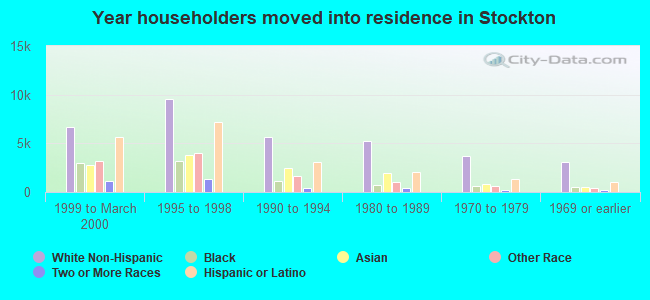
- Year of entry for the foreign-born population in Stockton, California
- 20,2412010 or later
- 20,9452000 to 2009
- 17,7161990 to 1999
- 23,0761980 to 1989
- 8,9691970 to 1979
- 6,301Before 1970
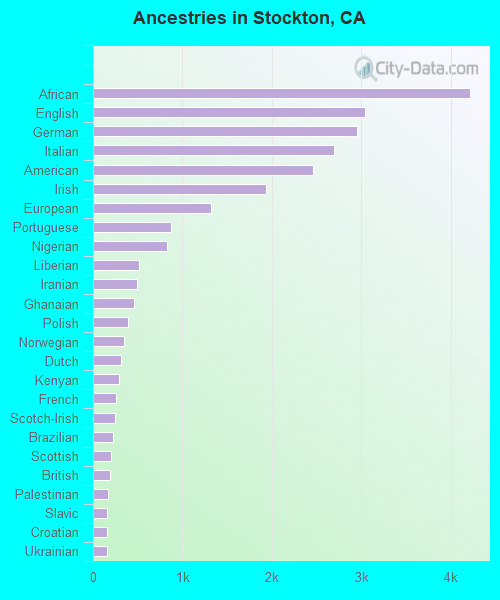
First ancestries reported:
- African: 4,214 (2.1%)
- English: 3,038 (1.5%)
- German: 2,948 (1.4%)
- Italian: 2,688 (1.3%)
- American: 2,455 (1.2%)
- Irish: 1,936 (0.9%)
- European: 1,324 (0.6%)
- Portuguese: 877 (0.4%)
- Nigerian: 832 (0.4%)
- Liberian: 518 (0.3%)
- Iranian: 497 (0.2%)
- Ghanaian: 455 (0.2%)
- Polish: 392 (0.2%)
- Norwegian: 346 (0.2%)
- Dutch: 318 (0.2%)
- Kenyan: 290 (0.1%)
- French: 259 (0.1%)
- Scotch-Irish: 241 (0.1%)
- Brazilian: 224 (0.1%)
- Scottish: 197 (0.10%)
- British: 185 (0.09%)
- Palestinian: 169 (0.08%)
- Slavic: 160 (0.08%)
- Croatian: 156 (0.08%)
- Ukrainian: 155 (0.08%)
- Syrian: 155 (0.08%)
- Greek: 147 (0.07%)
- Swedish: 135 (0.07%)
- Scandinavian: 113 (0.06%)
- Albanian: 107 (0.05%)
- Afghan: 104 (0.05%)
- West Indian: 101 (0.05%)
- Lebanese: 95 (0.05%)
- Arab: 92 (0.04%)
- Danish: 92 (0.04%)
- Russian: 91 (0.04%)
- Welsh: 83 (0.04%)
- Hungarian: 77 (0.04%)
- Egyptian: 75 (0.04%)
- Romanian: 73 (0.04%)
- Canadian: 71 (0.03%)
- Jamaican: 61 (0.03%)
- Swiss: 57 (0.03%)
- Jordanian: 56 (0.03%)
- Armenian: 47 (0.02%)
- Austrian: 44 (0.02%)
- Czech: 42 (0.02%)
- Northern European: 36 (0.02%)
- British West Indian: 33 (0.02%)
- Eastern European: 32 (0.02%)
- French Canadian: 30 (0.01%)
- Finnish: 30 (0.01%)
- Lithuanian: 28 (0.01%)
- Czechoslovakian: 25 (0.01%)
- Israeli: 24 (0.01%)
- Cape Verdean: 20 (0.01%)
- Latvian: 17 (0.01%)
- German Russian: 16 (0.01%)
- Belgian: 15 (0.01%)
- Ethiopian: 14 (0.01%)
Most common places of birth for foreign-born residents (%):
| Stockton: | 44.0% (35,330) |
| California: | 37.2% (3,881,193) |
| Stockton: | 15.2% (12,179) |
| California: | 7.8% (818,297) |
| Stockton: | 5.3% (4,239) |
| California: | 0.5% (51,974) |
| Stockton: | 4.8% (3,832) |
| California: | 4.9% (512,335) |
| Stockton: | 4.4% (3,525) |
| California: | 5.2% (539,184) |
| Stockton: | 3.6% (2,896) |
| California: | 0.5% (49,399) |
| Stockton: | 2.6% (2,120) |
| California: | 6.6% (684,672) |
| Stockton: | 2.3% (1,829) |
| California: | 0.5% (48,911) |
| Stockton: | 2.2% (1,784) |
| California: | 4.2% (440,287) |
| Stockton: | 2.0% (1,619) |
| California: | 0.6% (65,335) |
| Stockton: | 1.7% (1,385) |
| California: | 2.8% (290,436) |
Place of birth for U.S.-born residents:
- This state: 212,691
- Other state: 23,093
- Northeast: 4,134
- Midwest: 5,955
- South: 7,911
- West: 5,093
90.3% of Stockton residents lived in the same house 1 years ago.
Out of people who lived in different houses, 40.9% lived in this county.
Out of people who lived in different counties, 88.0% lived in California.
| Stockton: | 90.3% |
| State average: | 88.9% |
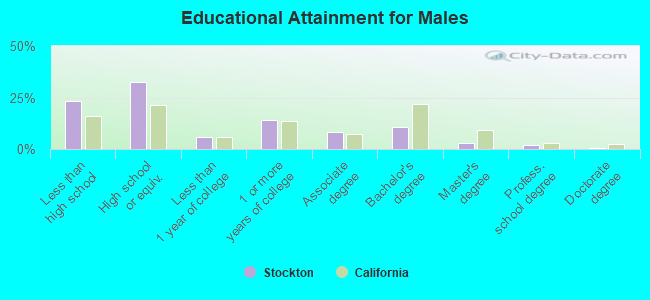
Education attainment for males 25 years and older:
- No schooling: 7,242
- Nursery to 4th grade: 1,450
- 5th and 6th grade: 4,765
- 7th and 8th grade: 1,392
- 9th grade: 1,933
- 10th grade: 2,155
- 11th grade: 2,092
- 12th grade, no diploma: 2,122
- High school graduate (or equivalency): 31,933
- Less than 1 year of college: 5,799
- Some college more than 1 year, no degree: 13,888
- Associate degree: 8,254
- Bachelor's degree: 10,506
- Master's degree: 2,648
- Professional school degree: 1,964
- Doctorate degree: 563
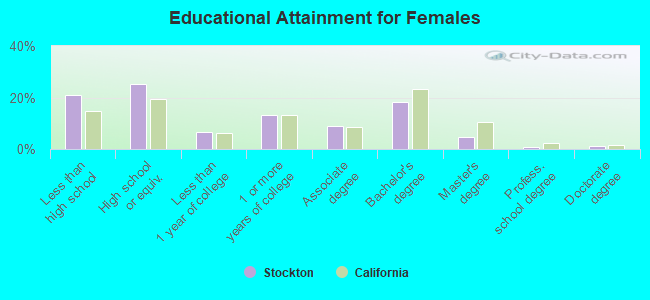
Education attainment for females 25 years and older:
- No schooling: 6,916
- Nursery to 4th grade: 1,770
- 5th and 6th grade: 2,745
- 7th and 8th grade: 2,817
- 9th grade: 1,306
- 10th grade: 1,749
- 11th grade: 1,305
- 12th grade, no diploma: 3,871
- High school graduate (or equivalency): 26,841
- Less than 1 year of college: 7,235
- Some college more than 1 year, no degree: 14,220
- Associate degree: 9,721
- Bachelor's degree: 19,326
- Master's degree: 4,998
- Professional school degree: 938
- Doctorate degree: 1,232
Housing units in structures:
- One, detached: 73,922
- One, attached: 7,687
- Two: 2,347
- 3 or 4: 4,619
- 5 to 9: 3,893
- 10 to 19: 3,161
- 20 to 49: 3,516
- 50 or more: 6,473
- Mobile homes: 1,222
- Boats, RVs, vans, etc.: 64
Median worth of mobile homes: $102,400
Housing units lacking complete kitchen facilities in 2022: 2.1%
House/condo owner moved in on average 11 years ago
Renter moved in on average 4 years ago
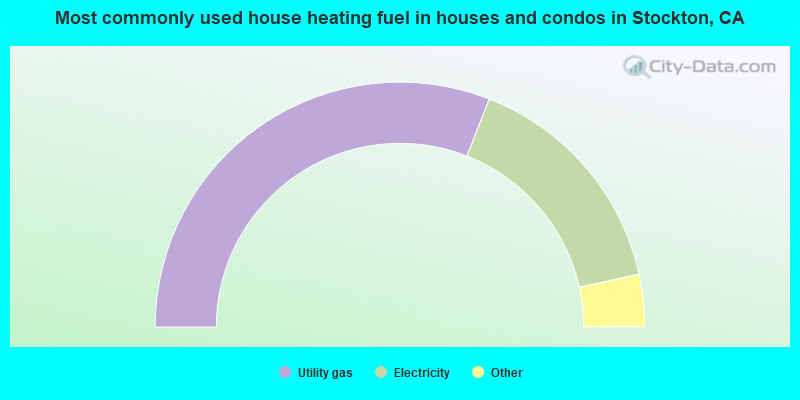
- 61.9%Utility gas
- 31.2%Electricity
- 3.5%Solar energy
- 1.8%Bottled, tank, or LP gas
- 1.2%No fuel used
- 0.3%Wood
- 0.1%Other fuel
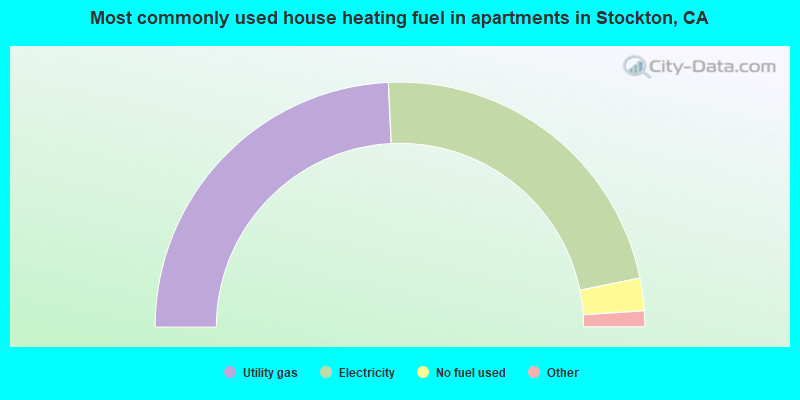
- 48.5%Utility gas
- 45.1%Electricity
- 4.3%No fuel used
- 1.1%Bottled, tank, or LP gas
- 0.4%Wood
- 0.3%Other fuel
- 0.2%Solar energy
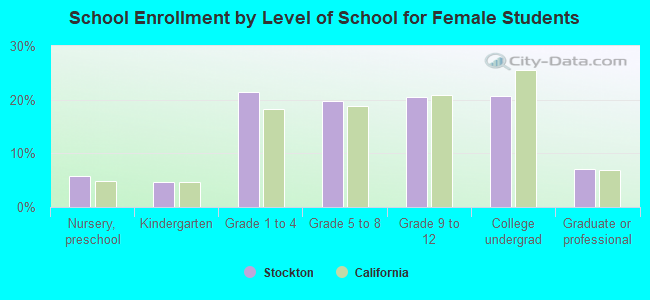
Private vs. public school enrollment:
| Here: | 5.2% |
| California: | 10.5% |
| Here: | 2.3% |
| California: | 8.5% |
| Here: | 15.8% |
| California: | 15.9% |