Sunset Valley, TX (Texas) Houses and Residents
| Sunset Valley: | $992,370 |
| Texas: | $275,400 |
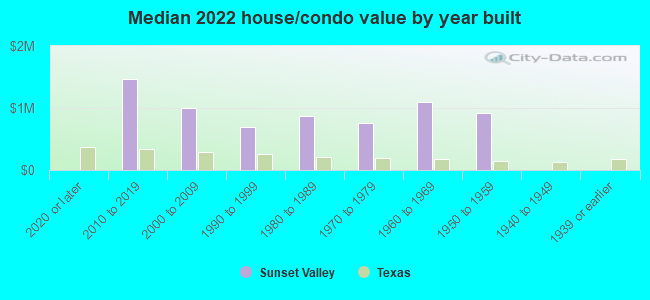
Mean price in 2022:
Detached houses: $919,229
Here: $919,229 State: $369,058
Total population: 697 (Urban population: 369, Rural population: 0)
Houses: 307 (269 occupied: 248 owner occupied, 21 renter occupied)
| % of renters here: | 8% |
| State: | 38% |
Housing density: 223 houses/condos per square mile
Median price asked for vacant for-sale houses and condos in 2022 in this county: $941,819.
Median contract rent in 2022: over $2,000
Median gross rent in Sunset Valley, TX in 2022: over $2,000
Housing units in Sunset Valley with a mortgage: 107 (8 second mortgage, 0 home equity loan, 4 both second mortgage and home equity loan)
Houses without a mortgage: 1
Median household income for houses/condos with a mortgage: $227,591
Median household income for apartments without a mortgage: $88,375
Median monthly housing costs: $1,759
Compare current foreclosures near Sunset Valley, TX:
| Photo | Address | Area | Beds / Baths | Price | Details |
|---|---|---|---|---|---|

|
#1
Hycreek Dr
Austin, TX 78723
|
2,040 sq. feet
|
3 baths 4 beds |
$449,900
|
show details |

|
#2
N Redondo Dr
Austin, TX 78721
|
972 sq. feet
|
1 baths 3 beds |
$339,900
|
show details |

|
#3
E Croslin St Apt 113
Austin, TX 78752
|
919 sq. feet
|
2 baths 2 beds |
show details | |

|
#4
Sigman Ln
Austin, TX 78723
|
1,864 sq. feet
|
2 baths 3 beds |
show details | |

|
#5
Bonita Vista Dr
Buda, TX 78610
|
1,351 sq. feet
|
2 baths 3 beds |
show details | |

|
#6
Bridgestone Way
Buda, TX 78610
|
- sq. feet
|
2 baths 3 beds |
show details | |

|
#7
Copperstone Ave
Austin, TX 78748
|
1,749 sq. feet
|
2 baths 4 beds |
show details | |

|
#8
Geneva Dr
Austin, TX 78723
|
1,756 sq. feet
|
1 baths 4 beds |
show details | |

|
#9
Ronee Leah Dr
Austin, TX 78724
|
2,047 sq. feet
|
2 baths 4 beds |
show details | |

|
#10
Knockfin Dr
Austin, TX 78744
|
- sq. feet
|
4 baths 5 beds |
show details |
| Photo | Address | Area | Beds / Baths | Price | Details |
|---|---|---|---|---|---|

|
#11
Summer Alcove Way
Austin, TX 78732
|
4,148 sq. feet
|
3 baths 4 beds |
show details | |

|
#12
Conejo Dr
Austin, TX 78734
|
2,554 sq. feet
|
2 baths 3 beds |
show details | |

|
#13
Mcintyre Cir
Austin, TX 78734
|
4,729 sq. feet
|
4 baths 4 beds |
show details | |

|
#14
Maybach Dr
Del Valle, TX 78617
|
1,325 sq. feet
|
2 baths 3 beds |
show details | |

|
#15
Bubbling Springs Trl
Austin, TX 78729
|
1,792 sq. feet
|
2 baths 4 beds |
show details | |

|
#16
Manchaca Rd Apt 43
Austin, TX 78704
|
1,586 sq. feet
|
3 baths 2 beds |
show details | |

|
#17
Southwick Dr
Austin, TX 78724
|
1,429 sq. feet
|
2 baths 3 beds |
show details | |

|
#18
Goldfinch Dr
Cedar Park, TX 78613
|
2,074 sq. feet
|
2 baths 4 beds |
show details | |

|
#19
Marquitos Dr
Kyle, TX 78640
|
- sq. feet
|
2 baths 3 beds |
show details | |

|
#20
Howerington Cir
Austin, TX 78724
|
870 sq. feet
|
1 baths - beds |
show details |
| Photo | Address | Area | Beds / Baths | Price | Details |
|---|---|---|---|---|---|

|
#21
Minerva St
Austin, TX 78753
|
3,302 sq. feet
|
2 baths - beds |
show details | |

|
#22
Scales St
Austin, TX 78723
|
1,422 sq. feet
|
2 baths - beds |
show details | |

|
#23
Clearock Dr
Austin, TX 78750
|
2,965 sq. feet
|
2 baths - beds |
show details | |

|
#24
Spicewood Pkwy
Austin, TX 78750
|
3,145 sq. feet
|
2 baths - beds |
show details | |

|
#25
Lipton Loop
Del Valle, TX 78617
|
1,688 sq. feet
|
2 baths 3 beds |
show details | |

|
#26
Paloma Blanca Way
Del Valle, TX 78617
|
- sq. feet
|
2 baths - beds |
show details | |

|
#27
Rolling Green Dr
Austin, TX 78734
|
2,289 sq. feet
|
3 baths 4 beds |
show details | |

|
#28
Church Canyon Dr
Austin, TX 78754
|
1,378 sq. feet
|
2 baths - beds |
show details | |

|
#29
Mansfield Dr
Austin, TX 78732
|
1,931 sq. feet
|
2 baths - beds |
show details | |

|
#30
Brooks Hollow R 4
Austin, TX 78734
|
744 sq. feet
|
1 baths - beds |
show details |
| Photo | Address | Area | Beds / Baths | Price | Details |
|---|---|---|---|---|---|

|
#31
Young Ln
Austin, TX 78737
|
2,693 sq. feet
|
3 baths - beds |
show details | |

|
#32
Parrish Ln
Austin, TX 78725
|
1,902 sq. feet
|
2 baths - beds |
show details | |

|
#33
Tuffit Ln
Austin, TX 78753
|
884 sq. feet
|
1 baths - beds |
show details | |

|
#34
Colfax Dr
Austin, TX 78724
|
1,024 sq. feet
|
1 baths - beds |
show details | |

|
#35
English Ave
Austin, TX 78724
|
1,593 sq. feet
|
2 baths - beds |
show details | |

|
#36
Dunbury Dr
Austin, TX 78723
|
1,116 sq. feet
|
2 baths - beds |
show details | |

|
#37
Cameron Rd
Manor, TX 78653
|
1,800 sq. feet
|
2 baths - beds |
show details | |

|
#38
Rotherham Dr
Austin, TX 78753
|
1,117 sq. feet
|
2 baths - beds |
show details | |

|
#39
Deer Run
Leander, TX 78641
|
850 sq. feet
|
1 baths - beds |
show details | |

|
#40
Spicewood Pkwy
Austin, TX 78750
|
3,092 sq. feet
|
2 baths - beds |
show details |
| Photo | Address | Area | Beds / Baths | Price | Details |
|---|---|---|---|---|---|

|
#41
Kenwood Ave
Austin, TX 78704
|
1,423 sq. feet
|
2 baths - beds |
show details | |

|
#42
Spring Valley Dr
Austin, TX 78736
|
1,400 sq. feet
|
2 baths - beds |
show details | |

|
#43
Melissa Oaks Ln
Austin, TX 78744
|
2,281 sq. feet
|
2 baths - beds |
show details | |

|
#44
Nesting Way
Austin, TX 78744
|
1,084 sq. feet
|
2 baths - beds |
show details | |

|
#45
Cherrylawn Cir
Austin, TX 78723
|
2,092 sq. feet
|
2 baths - beds |
show details | |

|
#46
Shropshire Blvd
Austin, TX 78753
|
1,990 sq. feet
|
2 baths - beds |
show details | |

|
#47
Wideleaf Dr
Austin, TX 78724
|
1,326 sq. feet
|
2 baths - beds |
show details | |

|
#48
La Paz
Del Valle, TX 78617
|
2,573 sq. feet
|
2 baths - beds |
show details | |

|
#49
Clark Cv
Buda, TX 78610
|
2,486 sq. feet
|
- baths - beds |
show details | |

|
Check over 1 million property listings on Foreclosure.com!
|
browse all offers | |||


Median year apartment built: 2009
Household type by relationship:
Households: 578- Male householders: 130 (11 living alone), Female householders: 124 (47 living alone)
154 spouses (154 opposite-sex spouses), 9 unmarried partners, (9 opposite-sex unmarried partners), 116 children (100 natural, 6 adopted, 9 stepchildren), 3 grandchildren, 0 brothers or sisters, 13 parents, 0 foster children, 2 other relatives, 22 non-relatives
- In group quarters: 2
Size of family households: 112 2-persons, 32 3-persons, 20 4-persons, 7 5-persons, 1 7-or-more-persons.
Size of nonfamily households: 66 1-person, 20 2-persons, 4 4-persons.
75 married couples with children.
15 single-parent households (9 men, 6 women).
86.8% of residents of Sunset Valley speak English at home.
9.5% of residents speak Spanish at home (75% speak English very well, 11% speak English well, 9% speak English not well, 4% don't speak English at all).
3.8% of residents speak other Indo-European language at home (100% speak English very well).
0.5% of residents speak Asian or Pacific Island language at home (100% speak English very well).
0.9% of residents speak other language at home (100% speak English very well).
Foreign born population: 47 (8.1%)
(100.0% of them are naturalized citizens)
| Here: | 7.2 |
| State: | 6.3 |
| Here: | 5.9 |
| State: | 4.0 |
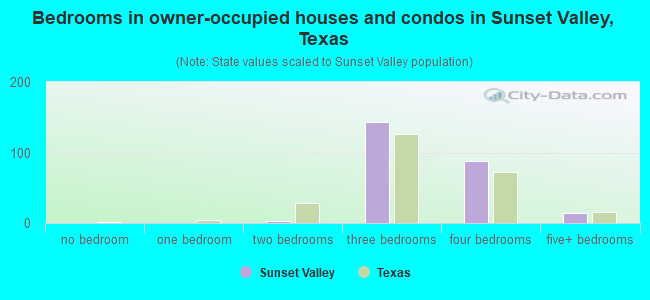
- Bedrooms in owner-occupied houses and condos in Sunset Valley, Texas
- 0no bedroom
- 01 bedroom
- 32 bedrooms
- 1433 bedrooms
- 884 bedrooms
- 145+ bedrooms
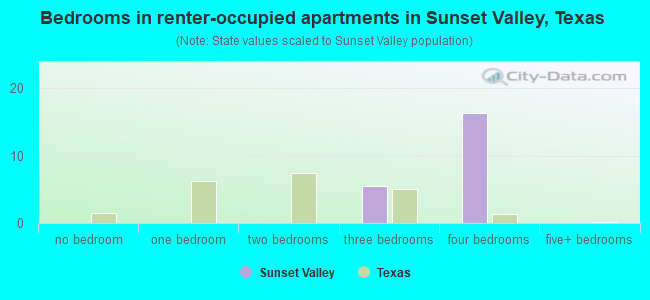
- Bedrooms in renter-occupied apartments in Sunset Valley, Texas
- 0no bedroom
- 01 bedroom
- 02 bedrooms
- 53 bedrooms
- 164 bedrooms
- 05+ bedrooms
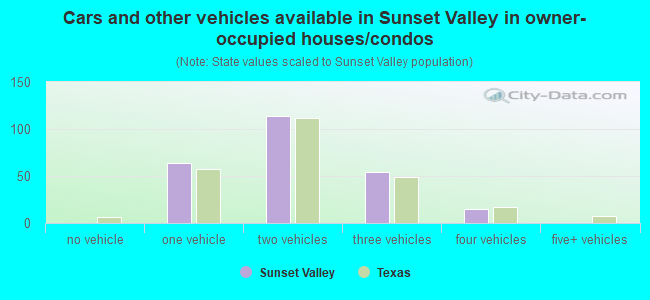
- Cars and other vehicles available in Sunset Valley in owner-occupied houses/condos
- 0no vehicle
- 641 vehicle
- 1142 vehicles
- 543 vehicles
- 154 vehicles
- 05+ vehicles
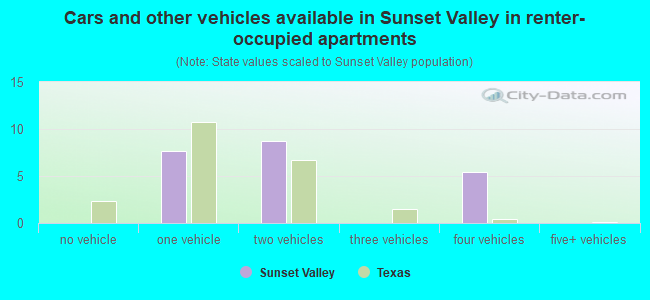
- Cars and other vehicles available in Sunset Valley in renter-occupied apartments
- 0no vehicle
- 81 vehicle
- 92 vehicles
- 03 vehicles
- 54 vehicles
- 05+ vehicles
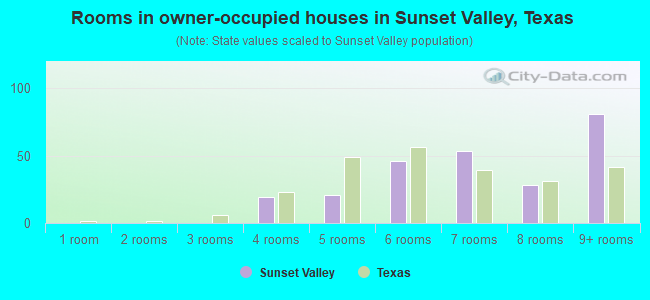
- Rooms in owner-occupied houses in Sunset Valley, Texas
- 01 room
- 02 rooms
- 03 rooms
- 204 rooms
- 215 rooms
- 466 rooms
- 537 rooms
- 288 rooms
- 819+ rooms
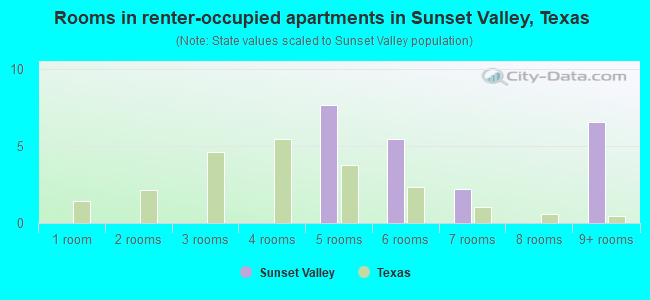
- Rooms in renter-occupied apartments in Sunset Valley, Texas
- 01 room
- 02 rooms
- 03 rooms
- 04 rooms
- 85 rooms
- 56 rooms
- 27 rooms
- 08 rooms
- 79+ rooms
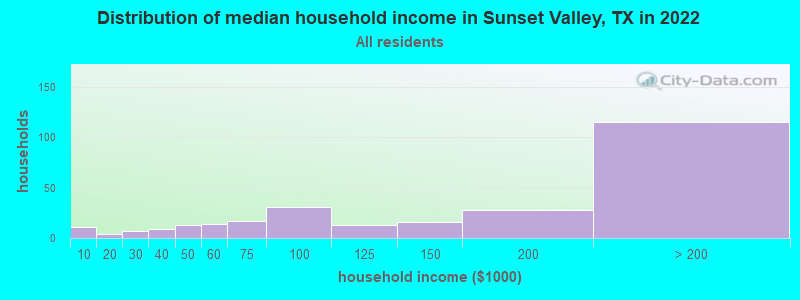
Sunset Valley, TX household income distribution

- 11Less than $10,000
- 4$10,000 to $19,999
- 7$20,000 to $29,999
- 9$30,000 to $39,999
- 13$40,000 to $49,999
- 14$50,000 to $59,999
- 17$60,000 to $74,999
- 31$75,000 to $99,999
- 13$100,000 to $124,999
- 16$125,000 to $149,999
- 28$150,000 to $199,999
- 115$200,000 or more
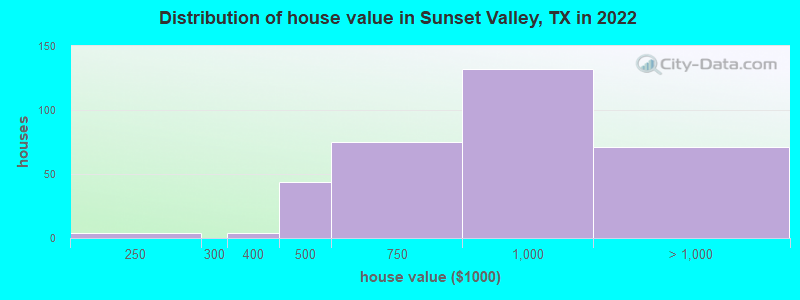
Home value of owner - occupied houses in 2022 in Sunset Valley, TX
-
- 4$200,000 to $249,999
- 3$300,000 to $399,999
- 44$400,000 to $499,999
- 75$500,000 to $749,999
- 132$750,000 to $999,999
- 35$1,000,000 to $1,499,999
- 7$1,500,000 to $1,999,999
- 27$2,000,000 or more
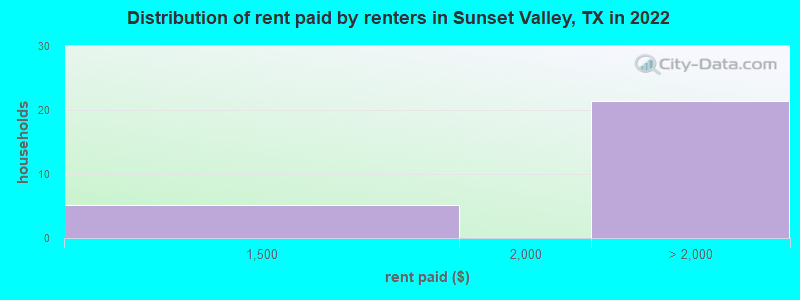
Rent paid by renters in 2022 in Sunset Valley, TX
-
- 5$1,250 to $1,499
- 2$3,000 to $3,499
- 19$3,500 or more
Percentage of workers working in this county: 97.0%
Number of people working at home: 134 (50.8% of all workers)
Travel time to work (commute)
- Less than 5 minutes: 2
- 5 to 9 minutes: 19
- 10 to 14 minutes: 18
- 15 to 19 minutes: 23
- 20 to 24 minutes: 20
- 25 to 29 minutes: 2
- 30 to 34 minutes: 12
- 35 to 39 minutes: 5
- 40 to 44 minutes: 3
- 45 to 59 minutes: 27
- 60 to 89 minutes: 4
- 90 or more minutes: 1
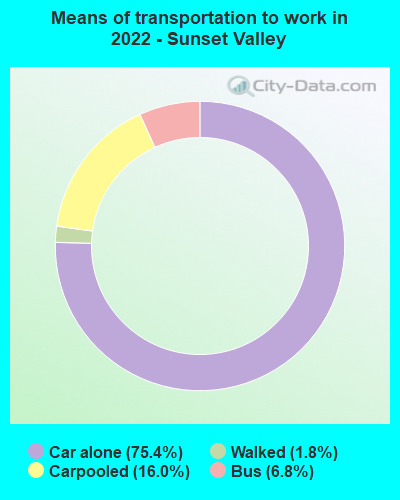
Means of transportation to work:
- Drove a car alone: 1,064 (64.6%)
- Carpooled: 228 (13.8%)
- Bus: 94 (5.7%)
- Walked: 27 (1.6%)
- Worked at home: 134 (8.1%)
- Unemployment by race in 2022
- Unemployment rate for White non-Hispanic residents
- 3.4%Males
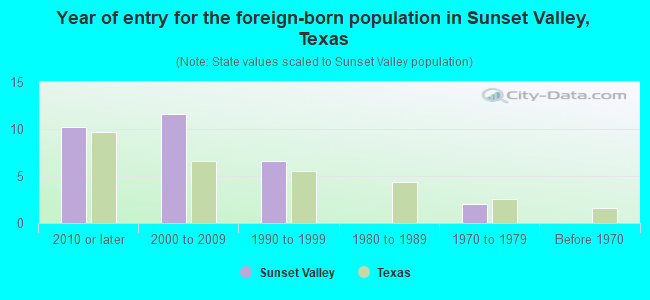
- Year of entry for the foreign-born population in Sunset Valley, Texas
- 102010 or later
- 122000 to 2009
- 71990 to 1999
- 01980 to 1989
- 21970 to 1979
- 0Before 1970
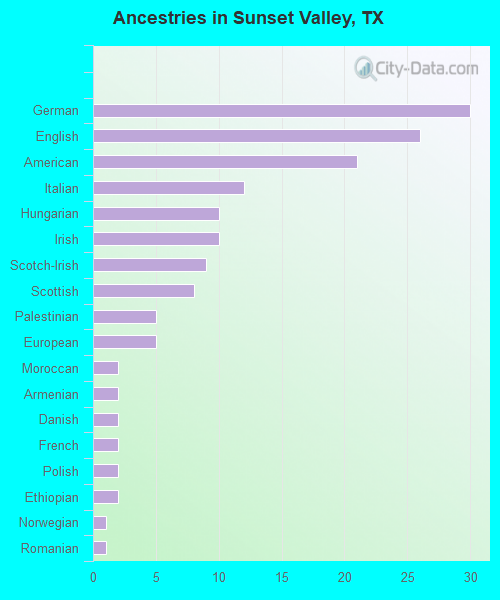
First ancestries reported:
- German: 30 (13.7%)
- English: 26 (11.9%)
- American: 21 (9.6%)
- Italian: 12 (5.5%)
- Hungarian: 10 (4.6%)
- Irish: 10 (4.6%)
- Scotch-Irish: 9 (4.1%)
- Scottish: 8 (3.7%)
- Palestinian: 5 (2.3%)
- European: 5 (2.3%)
- Moroccan: 2 (0.9%)
- Armenian: 2 (0.9%)
- Danish: 2 (0.9%)
- French: 2 (0.9%)
- Polish: 2 (0.9%)
- Ethiopian: 2 (0.9%)
- Norwegian: 1 (0.5%)
- Romanian: 1 (0.5%)
Most common places of birth for foreign-born residents (%):
| Sunset Valley: | 21.3% (10) |
| Texas: | 6.1% (306,347) |
| Sunset Valley: | 19.1% (9) |
| Texas: | 1.5% (72,413) |
| Sunset Valley: | 17.0% (8) |
| Texas: | 48.4% (2,411,723) |
| Sunset Valley: | 10.6% (5) |
| Texas: | 0.1% (4,638) |
| Sunset Valley: | 6.4% (3) |
| Texas: | 0.6% (27,844) |
| Sunset Valley: | 4.3% (2) |
| Texas: | 0.4% (20,885) |
| Sunset Valley: | 4.3% (2) |
| Texas: | 1.2% (62,159) |
| Sunset Valley: | 4.3% (2) |
| Texas: | 0.5% (24,705) |
| Sunset Valley: | 4.3% (2) |
| Texas: | 0.1% (4,509) |
| Sunset Valley: | 4.3% (2) |
| Texas: | 1.1% (55,371) |
| Sunset Valley: | 2.1% (1) |
| Texas: | 0.1% (6,849) |
Place of birth for U.S.-born residents:
- This state: 273
- Other state: 250
- Northeast: 58
- Midwest: 66
- South: 42
- West: 84
93.4% of Sunset Valley residents lived in the same house 1 years ago.
Out of people who lived in different houses, 36.1% lived in this county.
Out of people who lived in different counties, 92.3% lived in Texas.
| Sunset Valley: | 93.4% |
| State average: | 85.7% |
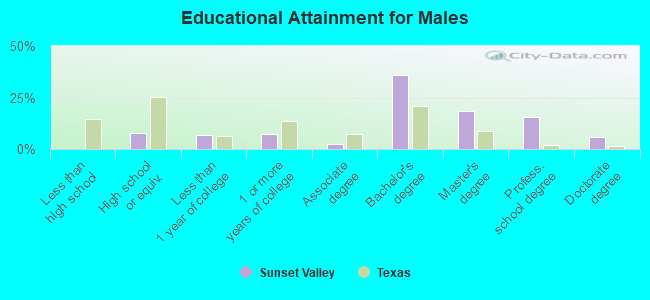
Education attainment for males 25 years and older:
- No schooling: 0
- Nursery to 4th grade: 0
- 5th and 6th grade: 0
- 7th and 8th grade: 0
- 9th grade: 0
- 10th grade: 0
- 11th grade: 0
- 12th grade, no diploma: 0
- High school graduate (or equivalency): 17
- Less than 1 year of college: 15
- Some college more than 1 year, no degree: 16
- Associate degree: 5
- Bachelor's degree: 77
- Master's degree: 39
- Professional school degree: 33
- Doctorate degree: 12
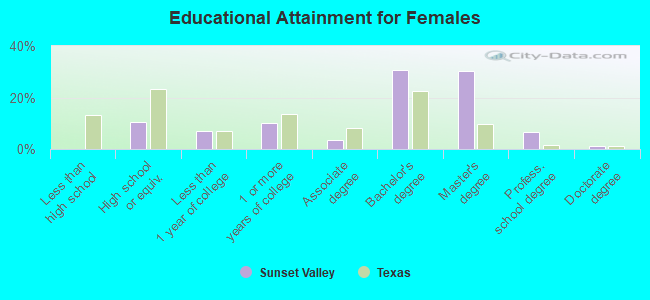
Education attainment for females 25 years and older:
- No schooling: 0
- Nursery to 4th grade: 0
- 5th and 6th grade: 0
- 7th and 8th grade: 0
- 9th grade: 0
- 10th grade: 0
- 11th grade: 0
- 12th grade, no diploma: 0
- High school graduate (or equivalency): 26
- Less than 1 year of college: 17
- Some college more than 1 year, no degree: 25
- Associate degree: 9
- Bachelor's degree: 75
- Master's degree: 74
- Professional school degree: 16
- Doctorate degree: 3
Housing units in structures:
- One, detached: 307
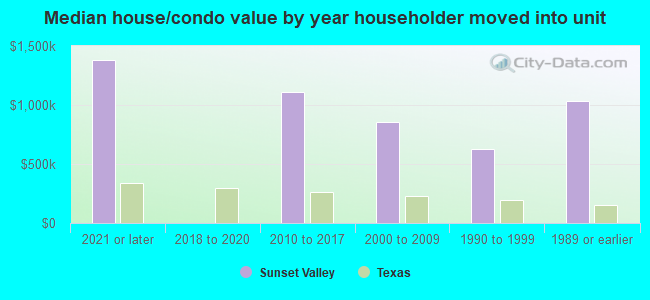
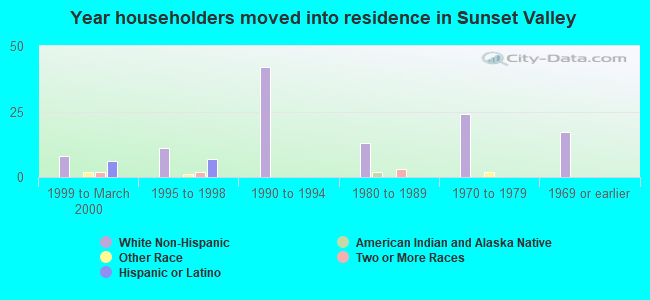
House/condo owner moved in on average 15 years ago
Renter moved in on average 6 years ago
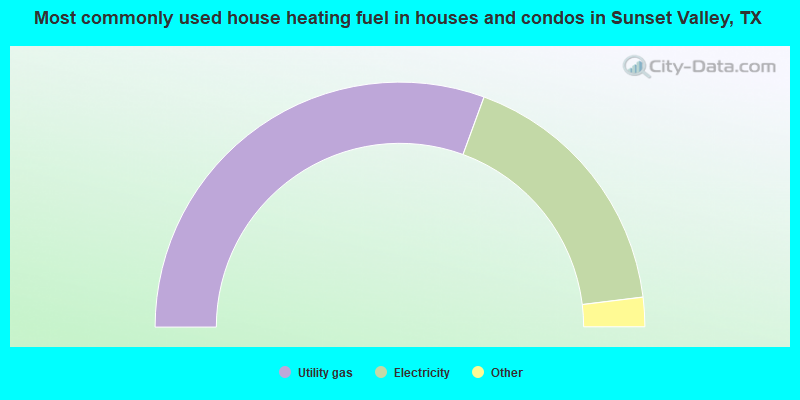
- 61.4%Utility gas
- 35.1%Electricity
- 2.2%Solar energy
- 1.3%Bottled, tank, or LP gas
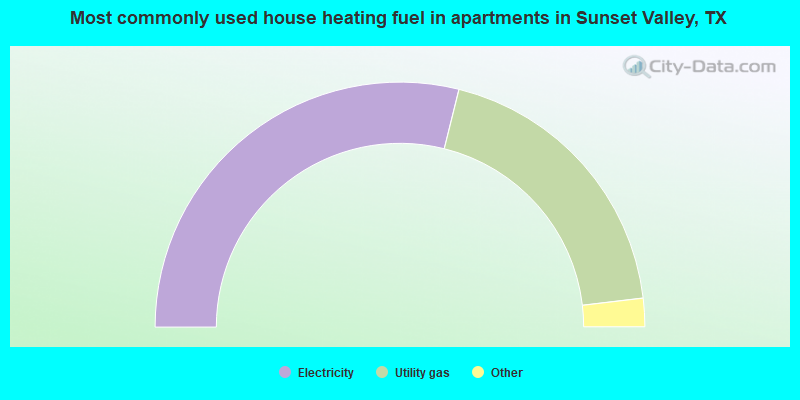
- 60.0%Electricity
- 40.0%Utility gas
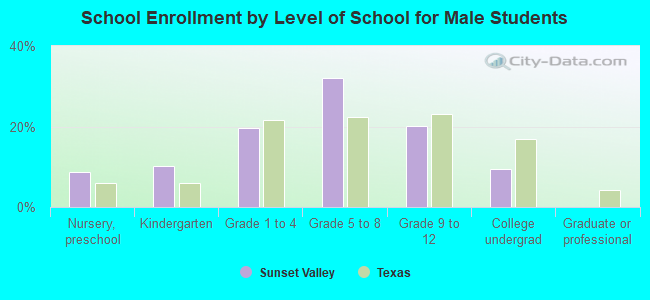
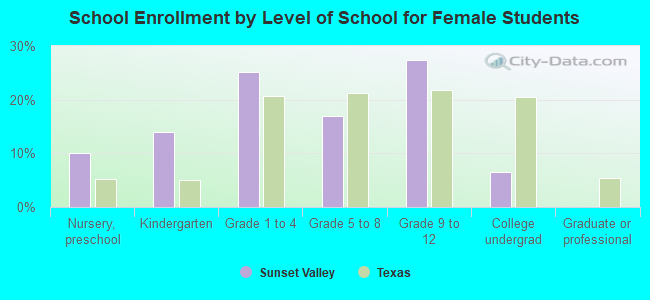
Private vs. public school enrollment:
| Here: | 58.7% |
| Texas: | 8.8% |
| Here: | 36.4% |
| Texas: | 8.0% |
| Here: | 0.0% |
| Texas: | 16.2% |