Superior, CO (Colorado) Houses and Residents
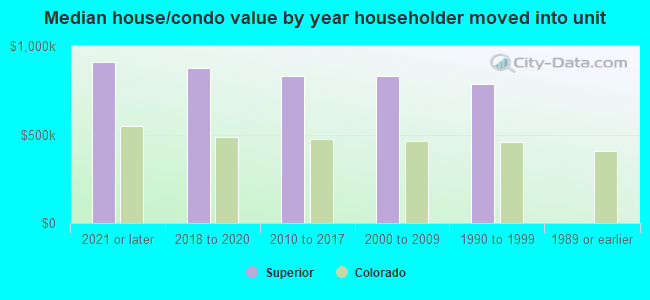
| Superior: | $819,167 |
| Colorado: | $531,100 |
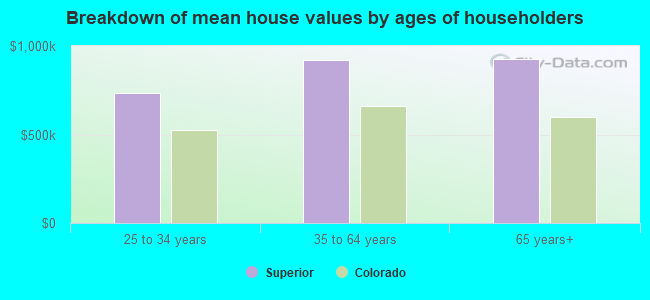
Mean price in 2022:
Detached houses: $929,167
Here: $929,167 State: $676,667 Townhouses or other attached units: $673,971
Here: $673,971 State: $526,340 In 5-or-more-unit structures: $487,062
Here: $487,062 State: $417,586
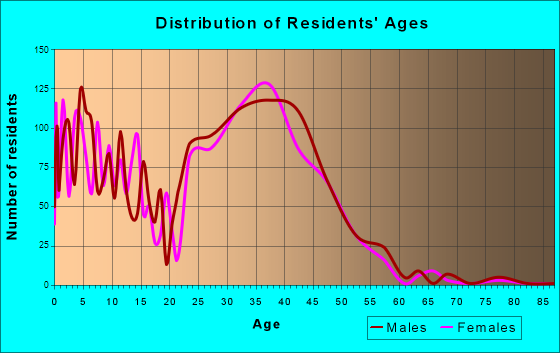
Total population: 12,855 (Urban population: 8,975, Rural population: 6 (all nonfarm))
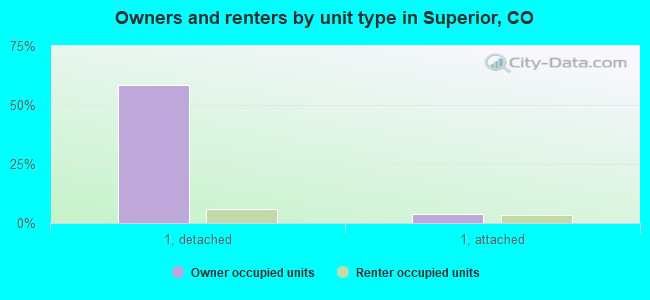
Houses: 4,758 (4,612 occupied: 2,780 owner occupied, 1,871 renter occupied)
| % of renters here: | 40% |
| State: | 34% |
Housing density: 1,203 houses/condos per square mile
Median price asked for vacant for-sale houses and condos in 2022 in this county: $1,069,117.
Median contract rent in 2022: over $2,000 (lower quartile is $1,891, upper quartile is over $2,000)
Median rent asked for vacant for-rent units in 2022: $2,056
Median gross rent in Superior, CO in 2022: over $2,000
Housing units in Superior with a mortgage: 2,106 (261 second mortgage, 3 home equity loan, 252 both second mortgage and home equity loan)
Houses without a mortgage: 0
Median household income for houses/condos with a mortgage: $170,103
Median household income for apartments without a mortgage: $191,806
Median monthly housing costs: $2,389
Compare current foreclosures near Superior, CO:
| Photo | Address | Area | Beds / Baths | Price | Details |
|---|---|---|---|---|---|

|
#1
County Road 4
Brighton, CO 80603
|
5,516 sq. feet
|
5 baths 5 beds |
$806,000
|
show details |

|
#2
Pawnee Dr
Boulder, CO 80303
|
1,416 sq. feet
|
2 baths 3 beds |
$910,000
|
show details |

|
#3
Grace Pl
Denver, CO 80221
|
1,800 sq. feet
|
2 baths 4 beds |
$535,000
|
show details |

|
#4
Tennyson St
Westminster, CO 80031
|
1,045 sq. feet
|
2 baths 3 beds |
show details | |

|
#5
Tipple Pkwy
Frederick, CO 80530
|
1,100 sq. feet
|
1 baths 2 beds |
show details | |

|
#6
Xavier St
Broomfield, CO 80020
|
1,499 sq. feet
|
3 baths 3 beds |
show details | |

|
#7
W 92nd Ave Unit 14a
Westminster, CO 80031
|
1,428 sq. feet
|
1 baths 2 beds |
show details | |

|
#8
Jackson Ct
Denver, CO 80233
|
1,424 sq. feet
|
2 baths 3 beds |
show details | |

|
#9
Lewis St
Arvada, CO 80004
|
1,402 sq. feet
|
1 baths 3 beds |
show details | |

|
#10
Steele St
Denver, CO 80233
|
850 sq. feet
|
1 baths 2 beds |
show details |
| Photo | Address | Area | Beds / Baths | Price | Details |
|---|---|---|---|---|---|

|
#11
16th St Apt 504
Denver, CO 80202
|
708 sq. feet
|
1 baths 1 beds |
show details | |

|
#12
Upham St
Arvada, CO 80003
|
1,107 sq. feet
|
1 baths 3 beds |
show details | |

|
#13
W 75th Way
Arvada, CO 80005
|
1,452 sq. feet
|
1 baths 3 beds |
show details | |

|
#14
E 115th Pl
Denver, CO 80233
|
2,032 sq. feet
|
2 baths 4 beds |
show details | |

|
#15
S Valentine Way
Denver, CO 80228
|
1,169 sq. feet
|
2 baths 4 beds |
show details | |

|
#16
E 115th Pl
Denver, CO 80233
|
2,032 sq. feet
|
2 baths 4 beds |
show details | |

|
#17
Everett St
Arvada, CO 80005
|
1,484 sq. feet
|
2 baths 3 beds |
show details | |

|
#18
E 75th Pl
Commerce City, CO 80022
|
1,624 sq. feet
|
1 baths 3 beds |
show details | |

|
#19
Leyden Ln
Commerce City, CO 80022
|
720 sq. feet
|
1 baths 2 beds |
show details | |

|
#20
Olive St
Commerce City, CO 80022
|
1,158 sq. feet
|
2 baths 4 beds |
show details |
| Photo | Address | Area | Beds / Baths | Price | Details |
|---|---|---|---|---|---|

|
#21
E 118th Ave
Denver, CO 80233
|
1,784 sq. feet
|
1 baths 3 beds |
show details | |

|
#22
Ivy Way
Erie, CO 80516
|
2,219 sq. feet
|
3 baths 4 beds |
show details | |

|
#23
W 61st Ave
Arvada, CO 80004
|
1,183 sq. feet
|
1 baths 5 beds |
show details | |

|
#24
Hobbit Ln
Westminster, CO 80031
|
2,017 sq. feet
|
3 baths 4 beds |
show details | |

|
#25
Brentwood Way Unit 203
Broomfield, CO 80021
|
553 sq. feet
|
1 baths 1 beds |
show details | |

|
#26
W Alaska Pl
Denver, CO 80219
|
1,646 sq. feet
|
2 baths 2 beds |
show details | |

|
#27
Sunflower Grn
Frederick, CO 80530
|
1,200 sq. feet
|
2 baths 3 beds |
show details | |

|
#28
E 107th Ave
Denver, CO 80233
|
1,452 sq. feet
|
2 baths 3 beds |
show details | |

|
#29
S 45th St
Boulder, CO 80305
|
2,438 sq. feet
|
3 baths 5 beds |
show details | |

|
#30
Newton St
Arvada, CO 80003
|
2,392 sq. feet
|
4 baths 4 beds |
show details |
| Photo | Address | Area | Beds / Baths | Price | Details |
|---|---|---|---|---|---|

|
#31
Clermont Dr
Denver, CO 80229
|
1,602 sq. feet
|
2 baths 5 beds |
show details | |

|
#32
Jay St
Arvada, CO 80003
|
3,273 sq. feet
|
3 baths 3 beds |
show details | |

|
#33
Hudson Ct
Denver, CO 80241
|
- sq. feet
|
2 baths 4 beds |
show details | |

|
#34
Mulberry Cir
Broomfield, CO 80020
|
1,216 sq. feet
|
1 baths 3 beds |
show details | |

|
#35
E 98th Pl
Denver, CO 80229
|
1,662 sq. feet
|
2 baths 3 beds |
show details | |

|
#36
W 78th Pl
Denver, CO 80221
|
1,887 sq. feet
|
2 baths 4 beds |
show details | |

|
#37
King Ct
Westminster, CO 80031
|
1,542 sq. feet
|
4 baths 3 beds |
show details | |

|
#38
E 125th Ave
Denver, CO 80241
|
990 sq. feet
|
2 baths 2 beds |
show details | |

|
#39
Magnolia St
Commerce City, CO 80022
|
1,032 sq. feet
|
1 baths 3 beds |
show details | |

|
#40
Stone Cir Unit 101
Broomfield, CO 80023
|
1,627 sq. feet
|
2 baths 2 beds |
show details |
| Photo | Address | Area | Beds / Baths | Price | Details |
|---|---|---|---|---|---|

|
#41
S Chase Dr
Denver, CO 80226
|
1,581 sq. feet
|
2 baths 6 beds |
show details | |

|
#42
Jamaica St
Henderson, CO 80640
|
1,533 sq. feet
|
3 baths 3 beds |
show details | |

|
#43
Gaylord St
Denver, CO 80229
|
1,104 sq. feet
|
2 baths 2 beds |
show details | |

|
#44
Niagara St
Commerce City, CO 80022
|
1,092 sq. feet
|
1 baths 3 beds |
show details | |

|
#45
Adams St
Denver, CO 80229
|
2,048 sq. feet
|
2 baths 4 beds |
show details | |

|
#46
W 74th Ave
Arvada, CO 80007
|
1,926 sq. feet
|
2 baths 4 beds |
show details | |

|
#47
S Miller Way
Denver, CO 80226
|
1,269 sq. feet
|
2 baths 4 beds |
show details | |

|
#48
W 112th Ave Apt B
Denver, CO 80234
|
- sq. feet
|
1 baths 2 beds |
show details | |

|
#49
28th St
Boulder, CO 80301
|
- sq. feet
|
1 baths 1 beds |
show details | |

|
Check over 1 million property listings on Foreclosure.com!
|
browse all offers | |||

Latest news about housing in Superior, CO collected exclusively by city-data.com from local newspapers, TV, and radio stations

 | Apartments Without Carpet (Boulder/Broomfield/Surrounding) (6 replies) |
| Tell me about Superior, Colorado (17 replies) |
| Moving to Boulder Area Issues Finding Apartments (7 replies) |
| Nice apartments in the Boulder area? (13 replies) |
| Apartments with attached garage? (7 replies) |
| Is there a housing bubble in CO / Boulder? (39 replies) |
Median year apartment built: 2001
Household type by relationship:
Households: 13,098- Male householders: 2,515 (383 living alone), Female householders: 1,971 (316 living alone)
3,147 spouses (3,029 opposite-sex spouses), 201 unmarried partners, (179 opposite-sex unmarried partners), 4,224 children (4,021 natural, 63 adopted, 139 stepchildren), 63 grandchildren, 83 brothers or sisters, 225 parents, 27 foster children, 245 other relatives, 391 non-relatives
Size of family households: 1,143 2-persons, 1,003 3-persons, 930 4-persons, 230 5-persons, 138 6-persons, 29 7-or-more-persons.
Size of nonfamily households: 726 1-person, 271 2-persons, 37 3-persons, 11 4-persons.
2,870 married couples with children.
465 single-parent households (235 men, 230 women).
78.6% of residents of Superior speak English at home.
3.4% of residents speak Spanish at home (92% speak English very well, 5% speak English well, 3% speak English not well).
7.3% of residents speak other Indo-European language at home (91% speak English very well, 3% speak English well, 6% speak English not well).
9.3% of residents speak Asian or Pacific Island language at home (62% speak English very well, 23% speak English well, 12% speak English not well, 3% don't speak English at all).
0.6% of residents speak other language at home (82% speak English very well, 18% speak English well).
Foreign born population: 2,487 (19.0%)
(44.6% of them are naturalized citizens)
| Here: | 8.2 |
| State: | 6.8 |
| Here: | 4.4 |
| State: | 4.0 |
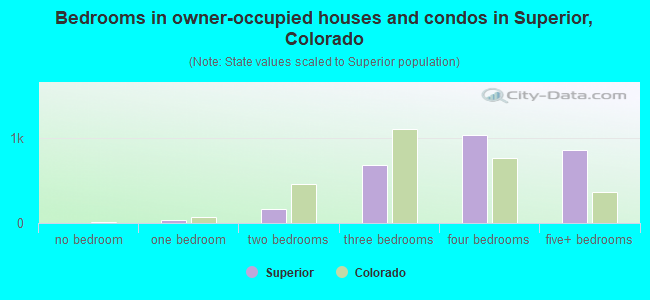
- Bedrooms in owner-occupied houses and condos in Superior, Colorado
- 0no bedroom
- 331 bedroom
- 1652 bedrooms
- 6823 bedrooms
- 1,0424 bedrooms
- 8585+ bedrooms
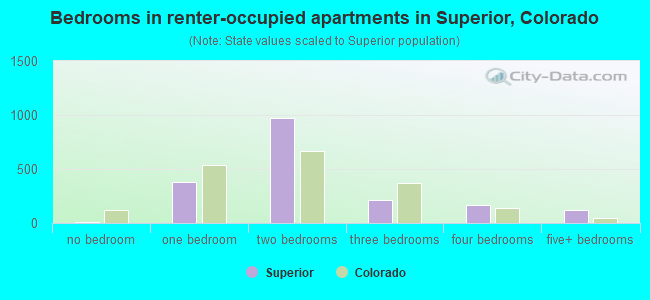
- Bedrooms in renter-occupied apartments in Superior, Colorado
- 13no bedroom
- 3821 bedroom
- 9712 bedrooms
- 2173 bedrooms
- 1714 bedrooms
- 1175+ bedrooms
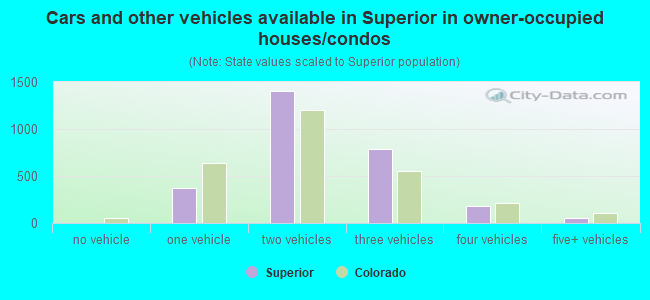
- Cars and other vehicles available in Superior in owner-occupied houses/condos
- 0no vehicle
- 3681 vehicle
- 1,4052 vehicles
- 7833 vehicles
- 1774 vehicles
- 495+ vehicles
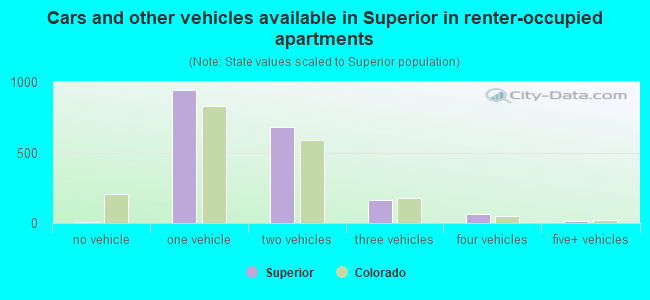
- Cars and other vehicles available in Superior in renter-occupied apartments
- 9no vehicle
- 9401 vehicle
- 6822 vehicles
- 1633 vehicles
- 644 vehicles
- 135+ vehicles
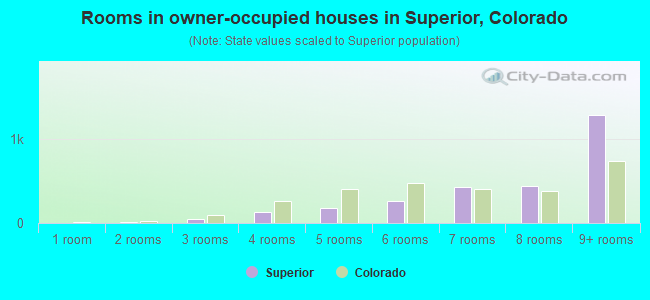
- Rooms in owner-occupied houses in Superior, Colorado
- 01 room
- 82 rooms
- 453 rooms
- 1294 rooms
- 1835 rooms
- 2636 rooms
- 4307 rooms
- 4378 rooms
- 1,2859+ rooms
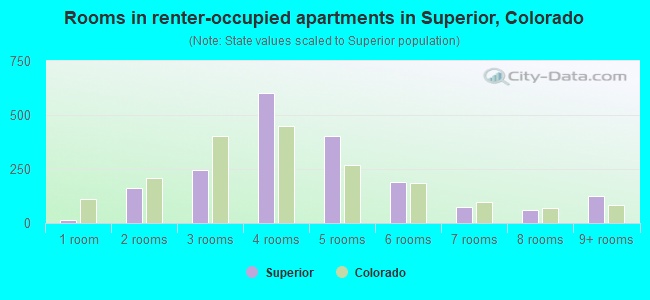
- Rooms in renter-occupied apartments in Superior, Colorado
- 131 room
- 1642 rooms
- 2453 rooms
- 6004 rooms
- 4055 rooms
- 1886 rooms
- 727 rooms
- 588 rooms
- 1269+ rooms

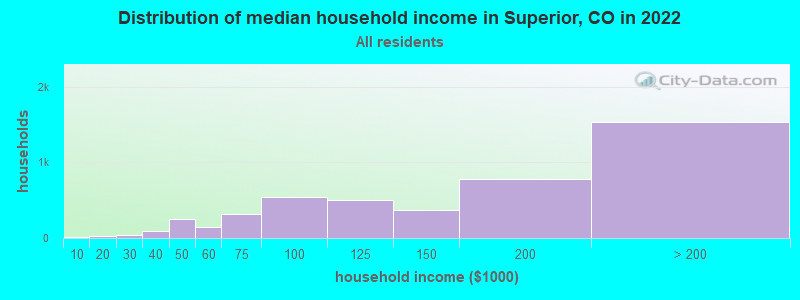
Superior, CO household income distribution

- 18Less than $10,000
- 29$10,000 to $19,999
- 46$20,000 to $29,999
- 96$30,000 to $39,999
- 258$40,000 to $49,999
- 146$50,000 to $59,999
- 313$60,000 to $74,999
- 540$75,000 to $99,999
- 498$100,000 to $124,999
- 371$125,000 to $149,999
- 779$150,000 to $199,999
- 1,536$200,000 or more
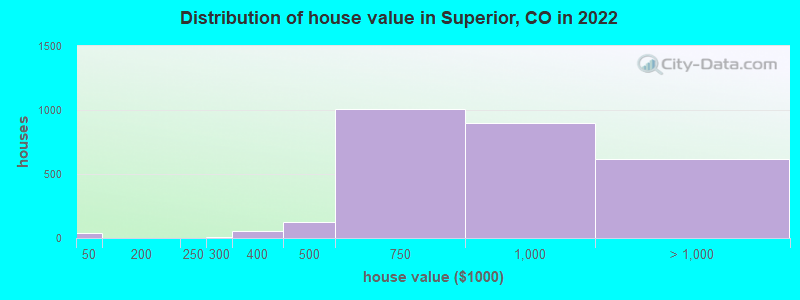
Home value of owner - occupied houses in 2022 in Superior, CO
-
- 41Less than $10,000
- 3$200,000 to $249,999
- 8$250,000 to $299,999
- 56$300,000 to $399,999
- 124$400,000 to $499,999
- 1,010$500,000 to $749,999
- 900$750,000 to $999,999
- 542$1,000,000 to $1,499,999
- 61$1,500,000 to $1,999,999
- 10$2,000,000 or more
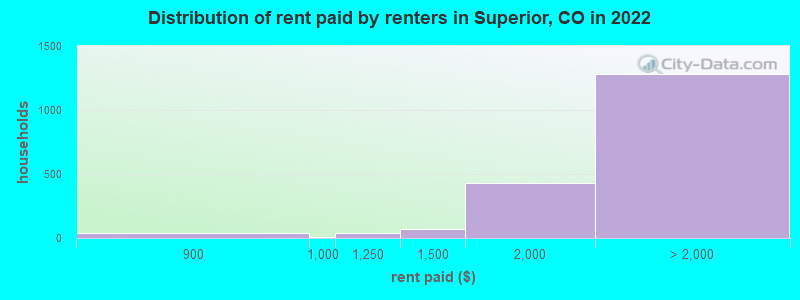
Rent paid by renters in 2022 in Superior, CO
-
- 39$800 to $899
- 8$900 to $999
- 36$1,000 to $1,249
- 74$1,250 to $1,499
- 431$1,500 to $1,999
- 632$2,000 to $2,499
- 442$2,500 to $2,999
- 78$3,000 to $3,499
- 52$3,500 or more
- 76No cash rent
Percentage of workers working in this county: 72.4%
Number of people working at home: 2,514 (34.6% of all workers)
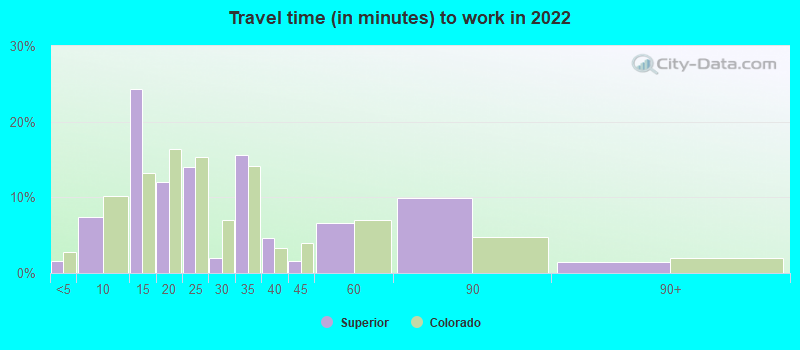
Travel time to work (commute)
- Less than 5 minutes: 6
- 5 to 9 minutes: 412
- 10 to 14 minutes: 974
- 15 to 19 minutes: 859
- 20 to 24 minutes: 877
- 25 to 29 minutes: 344
- 30 to 34 minutes: 603
- 35 to 39 minutes: 115
- 40 to 44 minutes: 168
- 45 to 59 minutes: 263
- 60 to 89 minutes: 103
- 90 or more minutes: 82
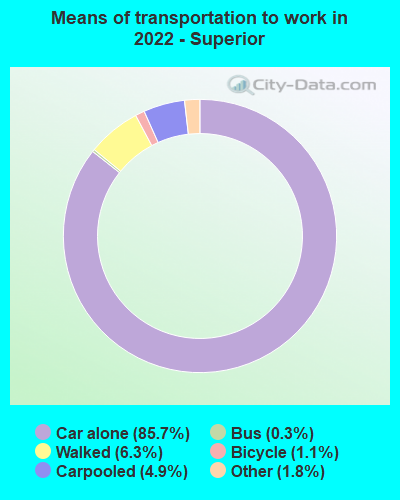
Means of transportation to work:
- Drove a car alone: 1,644 (40.1%)
- Carpooled: 105 (2.6%)
- Bus: 5 (0.1%)
- Taxi: 53 (1.3%)
- Bicycle: 23 (0.6%)
- Walked: 134 (3.3%)
- Worked at home: 2,514 (61.3%)
- Unemployment by race in 2022
- Unemployment rate for White non-Hispanic residents
- 1.4%Males
- 1.8%Females
- Unemployment rate for Asian residents
- 5.7%Males
- 2.7%Females
- Unemployment rate for two or more race residents
- 31.1%Males
- Unemployment rate for Hispanic or Latino residents
- 6.5%Males
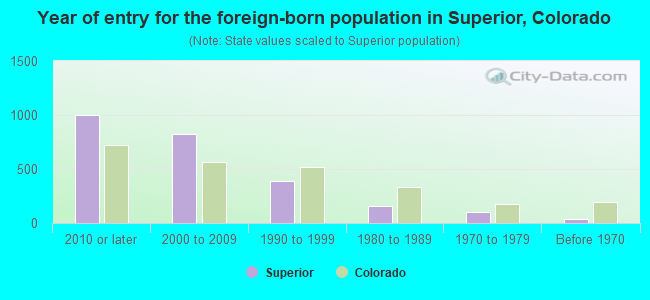
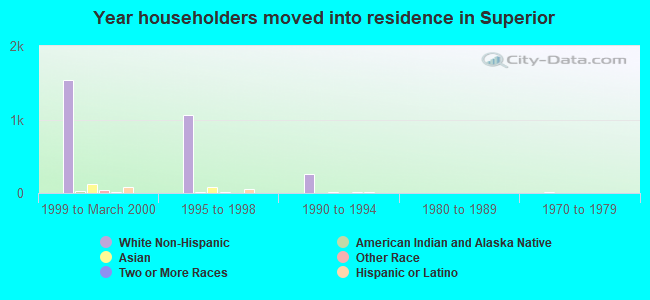
- Year of entry for the foreign-born population in Superior, Colorado
- 9972010 or later
- 8222000 to 2009
- 3851990 to 1999
- 1611980 to 1989
- 1031970 to 1979
- 39Before 1970
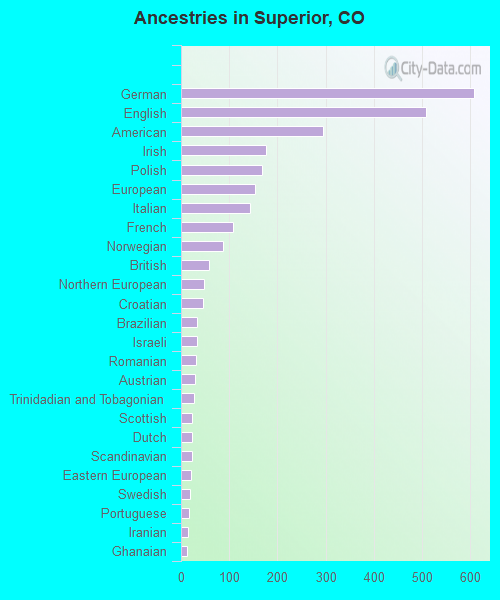
First ancestries reported:
- German: 608 (11.1%)
- English: 507 (9.3%)
- American: 294 (5.4%)
- Irish: 176 (3.2%)
- Polish: 167 (3.0%)
- European: 153 (2.8%)
- Italian: 143 (2.6%)
- French: 107 (2.0%)
- Norwegian: 88 (1.6%)
- British: 59 (1.1%)
- Northern European: 47 (0.9%)
- Croatian: 45 (0.8%)
- Brazilian: 34 (0.6%)
- Israeli: 34 (0.6%)
- Romanian: 31 (0.6%)
- Austrian: 30 (0.5%)
- Trinidadian and Tobagonian: 26 (0.5%)
- Scottish: 23 (0.4%)
- Dutch: 22 (0.4%)
- Scandinavian: 22 (0.4%)
- Eastern European: 21 (0.4%)
- Swedish: 19 (0.3%)
- Portuguese: 17 (0.3%)
- Iranian: 14 (0.3%)
- Ghanaian: 13 (0.2%)
- Ukrainian: 13 (0.2%)
- French Canadian: 12 (0.2%)
- Bulgarian: 10 (0.2%)
- Turkish: 9 (0.2%)
- Lithuanian: 5 (0.09%)
- Welsh: 5 (0.09%)
- Lebanese: 4 (0.07%)
- Russian: 4 (0.07%)
- Greek: 3 (0.05%)
- Scotch-Irish: 3 (0.05%)
Most common places of birth for foreign-born residents (%):
| Superior: | 16.7% (430) |
| Colorado: | 4.0% (21,689) |
| Superior: | 12.5% (322) |
| Colorado: | 3.3% (17,998) |
| Superior: | 10.0% (258) |
| Colorado: | 1.0% (5,214) |
| Superior: | 6.0% (154) |
| Colorado: | 2.7% (15,026) |
| Superior: | 5.2% (134) |
| Colorado: | 2.9% (15,981) |
| Superior: | 4.8% (125) |
| Colorado: | 38.3% (209,491) |
| Superior: | 4.6% (118) |
| Colorado: | 0.7% (4,075) |
| Superior: | 3.5% (90) |
| Colorado: | 1.1% (5,799) |
| Superior: | 2.9% (76) |
| Colorado: | 0.6% (3,016) |
| Superior: | 2.4% (62) |
| Colorado: | 0.2% (1,074) |
| Superior: | 2.3% (60) |
| Colorado: | 2.5% (13,706) |
| Superior: | 2.2% (58) |
| Colorado: | 0.3% (1,615) |
| Superior: | 2.2% (56) |
| Colorado: | 3.0% (16,616) |
| Superior: | 2.1% (55) |
| Colorado: | 1.0% (5,365) |
| Superior: | 2.1% (54) |
| Colorado: | 0.5% (2,620) |
| Superior: | 1.9% (48) |
| Colorado: | 1.4% (7,898) |
| Superior: | 1.8% (46) |
| Colorado: | 0.4% (2,063) |
| Superior: | 1.7% (43) |
| Colorado: | 0.6% (3,144) |
| Superior: | 1.6% (42) |
| Colorado: | 2.3% (12,342) |
Place of birth for U.S.-born residents:
- This state: 3,632
- Other state: 6,624
- Northeast: 1,101
- Midwest: 1,978
- South: 1,475
- West: 2,047
80.1% of Superior residents lived in the same house 1 years ago.
Out of people who lived in different houses, 24.2% lived in this county.
Out of people who lived in different counties, 41.5% lived in Colorado.
| Superior: | 80.1% |
| State average: | 83.6% |
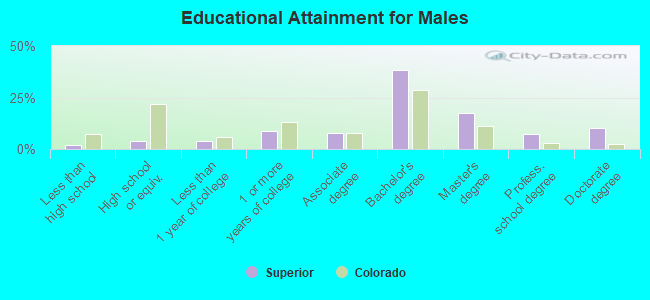
Education attainment for males 25 years and older:
- No schooling: 21
- Nursery to 4th grade: 13
- 5th and 6th grade: 24
- 7th and 8th grade: 0
- 9th grade: 0
- 10th grade: 18
- 11th grade: 4
- 12th grade, no diploma: 12
- High school graduate (or equivalency): 175
- Less than 1 year of college: 186
- Some college more than 1 year, no degree: 411
- Associate degree: 357
- Bachelor's degree: 1,770
- Master's degree: 807
- Professional school degree: 344
- Doctorate degree: 469
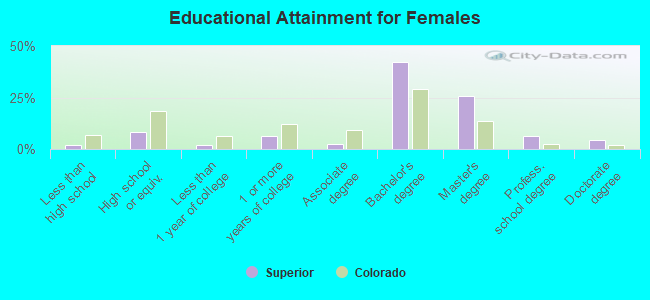
Education attainment for females 25 years and older:
- No schooling: 43
- Nursery to 4th grade: 0
- 5th and 6th grade: 13
- 7th and 8th grade: 0
- 9th grade: 0
- 10th grade: 0
- 11th grade: 15
- 12th grade, no diploma: 0
- High school graduate (or equivalency): 345
- Less than 1 year of college: 83
- Some college more than 1 year, no degree: 271
- Associate degree: 109
- Bachelor's degree: 1,774
- Master's degree: 1,086
- Professional school degree: 259
- Doctorate degree: 184
Housing units in structures:
- One, detached: 2,837
- One, attached: 464
- 3 or 4: 233
- 5 to 9: 822
- 10 to 19: 200
- 20 to 49: 13
- 50 or more: 177
- Mobile homes: 9
House/condo owner moved in on average 9 years ago
Renter moved in on average 1 years ago
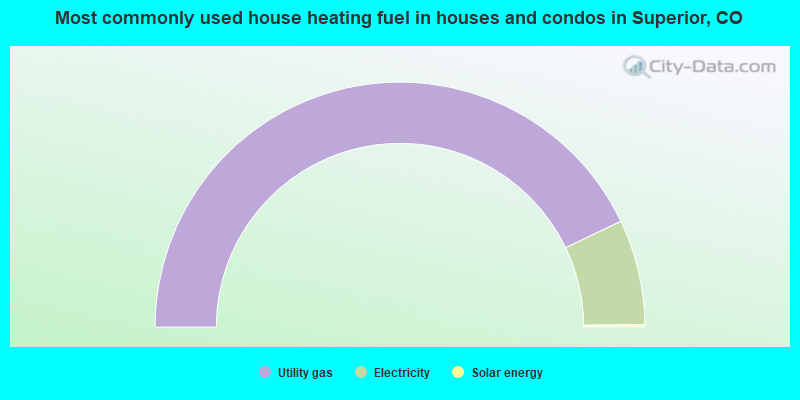
- 85.8%Utility gas
- 13.9%Electricity
- 0.3%Solar energy
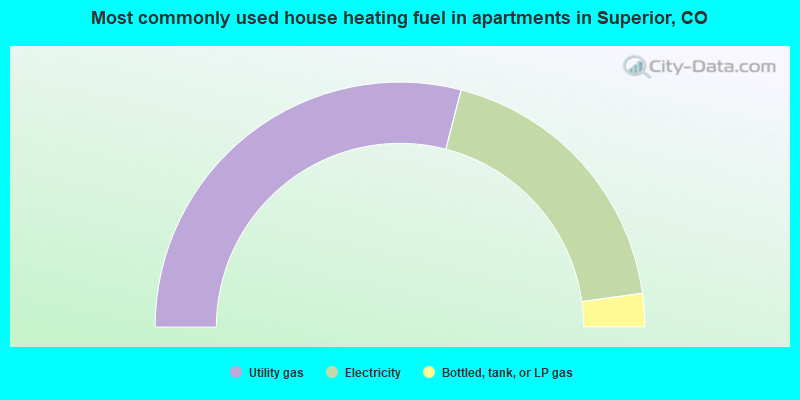
- 58.1%Utility gas
- 37.6%Electricity
- 4.4%Bottled, tank, or LP gas
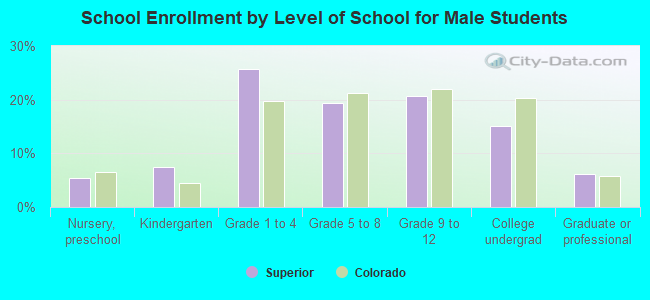
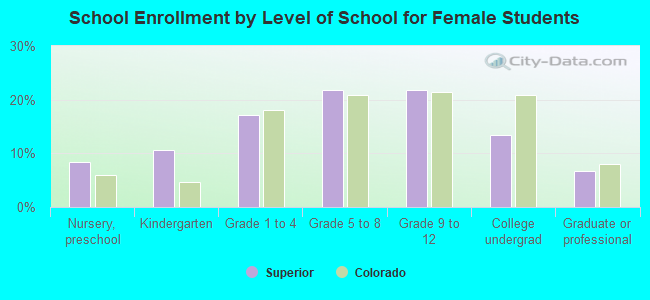
Private vs. public school enrollment:
| Here: | 6.4% |
| Colorado: | 11.4% |
| Here: | 4.1% |
| Colorado: | 8.5% |
| Here: | 10.5% |
| Colorado: | 14.0% |