Valdosta, GA (Georgia) Houses and Residents
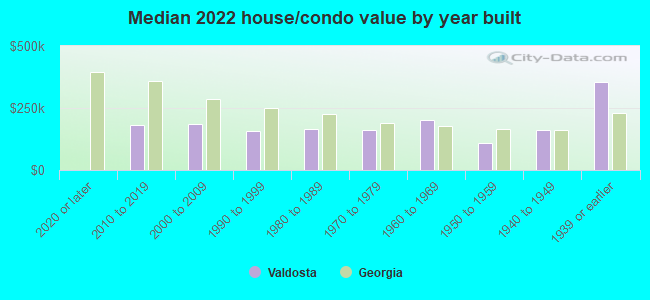
| Valdosta: | $176,309 |
| Georgia: | $297,400 |
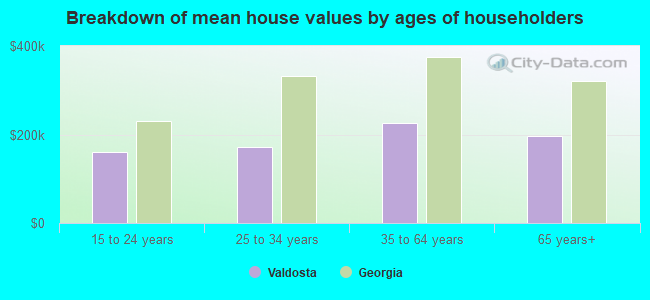
Mean price in 2022:
Detached houses: $213,757
Here: $213,757 State: $376,364 Townhouses or other attached units: $329,851
Here: $329,851 State: $341,709 In 2-unit structures: $328,653
Here: $328,653 State: $269,631 In 3-to-4-unit structures: $122,518
Here: $122,518 State: $250,092 In 5-or-more-unit structures: $295,303
Here: $295,303 State: $370,730 Mobile homes: $51,908
Here: $51,908 State: $102,413
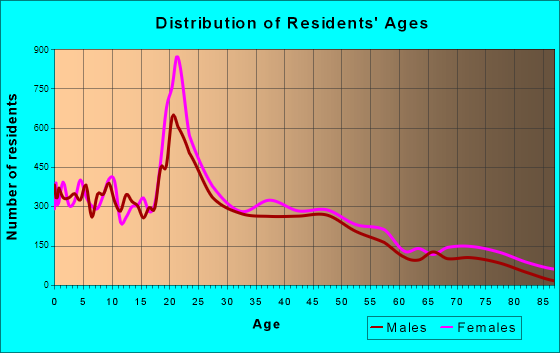
Total population: 56,595 (Urban population: 43,482, Rural population: 341 (all nonfarm))
Houses: 26,053 (22,724 occupied: 9,200 owner occupied, 13,654 renter occupied)
| % of renters here: | 60% |
| State: | 34% |
Housing density: 870 houses/condos per square mile
Median price asked for vacant for-sale houses and condos in 2022: $65,822.
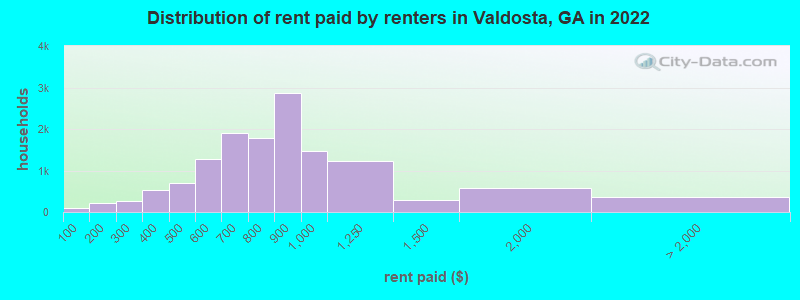
Median contract rent in 2022: $793 (lower quartile is $606, upper quartile is $927)
Median rent asked for vacant for-rent units in 2022: $824
Median gross rent in Valdosta, GA in 2022: $975
Housing units in Valdosta with a mortgage: 5,228 (157 second mortgage, 2 home equity loan, 136 both second mortgage and home equity loan)
Houses without a mortgage: 106
Median household income for houses/condos with a mortgage: $70,680
Median household income for apartments without a mortgage: $50,897
Median monthly housing costs: $915
Compare current foreclosures in Valdosta, GA:
| Photo | Address | Area | Beds / Baths | Price | Details |
|---|---|---|---|---|---|

|
#1
Lasalle Dr
Valdosta, GA 31602
|
1,396 sq. feet
|
2 baths 3 beds |
show details | |

|
#2
Bethune St
Valdosta, GA 31601
|
1,175 sq. feet
|
1 baths 2 beds |
show details | |

|
#3
Michelle St
Valdosta, GA 31605
|
2,248 sq. feet
|
2 baths 3 beds |
show details | |

|
#4
Chris Cir
Valdosta, GA 31605
|
2,062 sq. feet
|
2 baths 4 beds |
show details | |

|
#5
Sedgwyck Ln
Valdosta, GA 31605
|
1,231 sq. feet
|
2 baths 3 beds |
show details | |

|
#6
Mcallister St
Valdosta, GA 31605
|
2,060 sq. feet
|
2 baths 4 beds |
show details | |

|
#7
Druid Oaks Dr
Valdosta, GA 31605
|
1,130 sq. feet
|
2 baths 3 beds |
show details | |

|
#8
Conway Cir
Valdosta, GA 31605
|
2,232 sq. feet
|
2 baths 4 beds |
show details | |

|
#9
Julington Pl
Valdosta, GA 31605
|
2,068 sq. feet
|
2 baths 3 beds |
show details | |

|
#10
Edinburg Cir
Valdosta, GA 31605
|
1,873 sq. feet
|
2 baths 4 beds |
show details |
| Photo | Address | Area | Beds / Baths | Price | Details |
|---|---|---|---|---|---|

|
#11
Vanelle Dr
Valdosta, GA 31602
|
1,226 sq. feet
|
2 baths 3 beds |
show details | |

|
#12
Walden Rd
Valdosta, GA 31605
|
1,986 sq. feet
|
2 baths 4 beds |
show details | |

|
#13
Buckhead Dr
Valdosta, GA 31605
|
1,465 sq. feet
|
2 baths 3 beds |
show details | |

|
#14
Kensington Cir
Valdosta, GA 31602
|
1,150 sq. feet
|
2 baths 3 beds |
show details | |

|
#15
Beulah Cir
Valdosta, GA 31605
|
1,270 sq. feet
|
2 baths 3 beds |
show details | |

|
#16
Forrest Run Cir
Valdosta, GA 31605
|
1,308 sq. feet
|
2 baths 3 beds |
show details | |

|
#17
Shelby Ln
Valdosta, GA 31605
|
1,701 sq. feet
|
2 baths 3 beds |
show details | |

|
#18
Whithorn Way
Valdosta, GA 31605
|
2,093 sq. feet
|
2 baths 4 beds |
show details | |

|
#19
Jefferson Ct
Valdosta, GA 31601
|
1,185 sq. feet
|
2 baths 3 beds |
show details | |

|
#20
Vanelle Dr
Valdosta, GA 31602
|
1,215 sq. feet
|
2 baths 3 beds |
show details |
| Photo | Address | Area | Beds / Baths | Price | Details |
|---|---|---|---|---|---|

|
#21
Mcallister St
Valdosta, GA 31605
|
2,081 sq. feet
|
2 baths 3 beds |
show details | |

|
#22
Shasta Pines Way
Valdosta, GA 31601
|
1,457 sq. feet
|
2 baths 3 beds |
show details | |

|
#23
Cutter Pt
Valdosta, GA 31605
|
1,578 sq. feet
|
2 baths 3 beds |
show details | |

|
#24
Pecan Dr
Valdosta, GA 31605
|
1,626 sq. feet
|
2 baths 4 beds |
show details | |

|
#25
Carroll Ulmer Rd
Valdosta, GA 31601
|
1,748 sq. feet
|
2 baths 2 beds |
show details | |

|
#26
Conway Cir
Valdosta, GA 31605
|
1,948 sq. feet
|
2 baths 3 beds |
show details | |

|
#27
Kenilworth Cir
Valdosta, GA 31605
|
1,626 sq. feet
|
2 baths 4 beds |
show details | |

|
#28
Corey Dr
Valdosta, GA 31601
|
2,807 sq. feet
|
3 baths 4 beds |
show details | |

|
#29
Parkview Cir
Valdosta, GA 31602
|
2,360 sq. feet
|
2 baths - beds |
show details | |

|
#30
Oxbottom Dr
Valdosta, GA 31605
|
2,402 sq. feet
|
2 baths 3 beds |
show details |
| Photo | Address | Area | Beds / Baths | Price | Details |
|---|---|---|---|---|---|

|
#31
Bunche Dr
Valdosta, GA 31601
|
1,590 sq. feet
|
2 baths 3 beds |
show details | |

|
#32
Chandler Way
Valdosta, GA 31605
|
1,873 sq. feet
|
2 baths 4 beds |
show details | |

|
#33
Beulah Cir
Valdosta, GA 31605
|
1,470 sq. feet
|
2 baths 3 beds |
show details | |

|
#34
Sonoma Dr
Valdosta, GA 31602
|
1,670 sq. feet
|
2 baths 3 beds |
show details | |

|
#35
Pineview Dr
Valdosta, GA 31602
|
1,517 sq. feet
|
2 baths 3 beds |
show details | |

|
#36
Green Meadow Dr
Valdosta, GA 31602
|
4,541 sq. feet
|
5 baths 5 beds |
show details | |

|
#37
Seminole Dr
Valdosta, GA 31601
|
1,358 sq. feet
|
2 baths - beds |
show details | |

|
#38
Wooding Ln
Valdosta, GA 31601
|
1,210 sq. feet
|
2 baths 4 beds |
show details | |

|
#39
Cummings St
Valdosta, GA 31601
|
1,185 sq. feet
|
2 baths 3 beds |
show details | |

|
#40
Edgar Cir
Valdosta, GA 31601
|
2,082 sq. feet
|
2 baths 3 beds |
show details |
| Photo | Address | Area | Beds / Baths | Price | Details |
|---|---|---|---|---|---|

|
#41
Shelby Ln
Valdosta, GA 31605
|
1,838 sq. feet
|
2 baths 4 beds |
show details | |

|
#42
Hightower St
Valdosta, GA 31601
|
975 sq. feet
|
1 baths 3 beds |
show details | |

|
#43
Pinetree Cir
Valdosta, GA 31601
|
1,128 sq. feet
|
2 baths 3 beds |
show details | |

|
#44
Jimmy Carter Dr
Valdosta, GA 31602
|
1,215 sq. feet
|
2 baths 3 beds |
show details | |

|
#45
Concord Ln
Valdosta, GA 31605
|
2,097 sq. feet
|
2 baths 4 beds |
show details | |

|
#46
Cobblestone Way
Valdosta, GA 31605
|
1,408 sq. feet
|
2 baths 3 beds |
show details | |

|
#47
Fresno St
Valdosta, GA 31602
|
1,309 sq. feet
|
2 baths 3 beds |
show details | |

|
#48
Colson Rd
Valdosta, GA 31605
|
1,478 sq. feet
|
2 baths - beds |
show details | |

|
#49
Whippoorwill Cir
Valdosta, GA 31605
|
1,671 sq. feet
|
2 baths - beds |
show details | |

|
Check over 1 million property listings on Foreclosure.com!
|
browse all offers | |||

Latest news about housing in Valdosta, GA collected exclusively by city-data.com from local newspapers, TV, and radio stations

 | northerner looking for retirement home near Valdosta GA (25 replies) |
| Albany VS Valdosta (31 replies) |
| Talk to me about Valdosta... (2 replies) |
| Good, bad on SE area of Valdosta. (5 replies) |
| Tifton or Valdosta? (6 replies) |
| Atlanta MSA one of few top metros growing (296 replies) |
Median year apartment built: 1987
Household type by relationship:
Households: 55,958- Male householders: 9,985 (3,365 living alone), Female householders: 11,948 (4,633 living alone)
6,660 spouses (6,589 opposite-sex spouses), 1,783 unmarried partners, (1,757 opposite-sex unmarried partners), 15,673 children (14,347 natural, 480 adopted, 845 stepchildren), 1,747 grandchildren, 904 brothers or sisters, 838 parents, 58 foster children, 649 other relatives, 3,255 non-relatives
- In group quarters: 2,453
Size of family households: 5,158 2-persons, 3,061 3-persons, 2,667 4-persons, 1,473 5-persons, 188 6-persons, 115 7-or-more-persons.
Size of nonfamily households: 7,472 1-person, 1,673 2-persons, 405 3-persons, 381 4-persons.
5,754 married couples with children.
4,986 single-parent households (418 men, 4,568 women).
94.0% of residents of Valdosta speak English at home.
3.4% of residents speak Spanish at home (69% speak English very well, 17% speak English well, 12% speak English not well, 2% don't speak English at all).
1.4% of residents speak other Indo-European language at home (82% speak English very well, 18% speak English well).
0.6% of residents speak Asian or Pacific Island language at home (56% speak English very well, 30% speak English well, 14% speak English not well).
0.2% of residents speak other language at home (66% speak English very well, 34% speak English well).
Foreign born population: 1,828 (3.3%)
(49.0% of them are naturalized citizens)
| Here: | 6.2 |
| State: | 6.8 |
| Here: | 4.5 |
| State: | 4.6 |
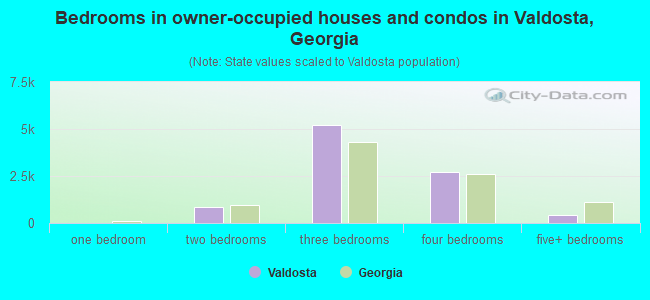
- Bedrooms in owner-occupied houses and condos in Valdosta, Georgia
- 14no bedroom
- 01 bedroom
- 8292 bedrooms
- 5,2343 bedrooms
- 2,6994 bedrooms
- 4255+ bedrooms
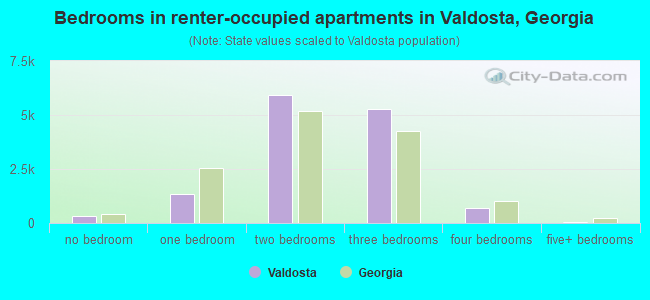
- Bedrooms in renter-occupied apartments in Valdosta, Georgia
- 338no bedroom
- 1,3501 bedroom
- 5,9362 bedrooms
- 5,2923 bedrooms
- 6754 bedrooms
- 635+ bedrooms
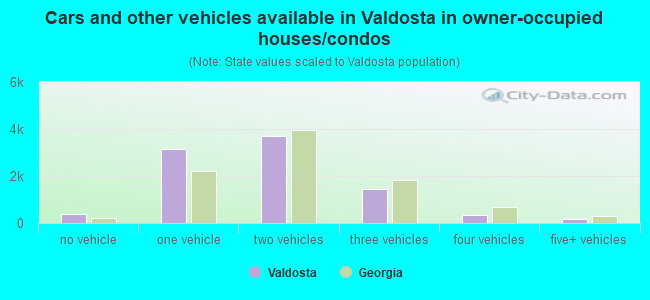
- Cars and other vehicles available in Valdosta in owner-occupied houses/condos
- 395no vehicle
- 3,1671 vehicle
- 3,7142 vehicles
- 1,4333 vehicles
- 3314 vehicles
- 1615+ vehicles
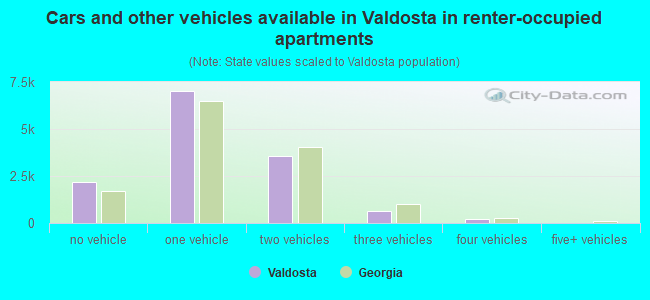
- Cars and other vehicles available in Valdosta in renter-occupied apartments
- 2,184no vehicle
- 7,0271 vehicle
- 3,5862 vehicles
- 6173 vehicles
- 2314 vehicles
- 95+ vehicles
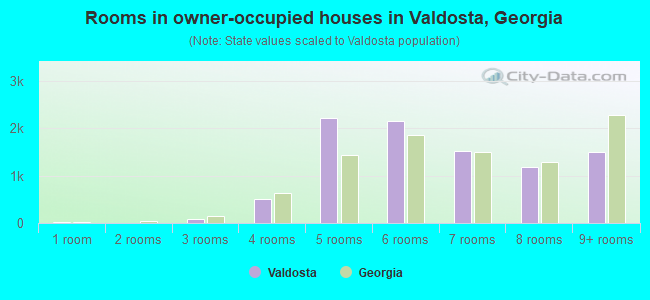
- Rooms in owner-occupied houses in Valdosta, Georgia
- 141 room
- 02 rooms
- 893 rooms
- 4984 rooms
- 2,2255 rooms
- 2,1656 rooms
- 1,5227 rooms
- 1,1918 rooms
- 1,4979+ rooms
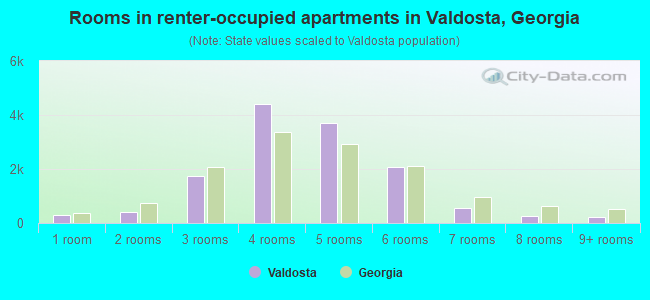
- Rooms in renter-occupied apartments in Valdosta, Georgia
- 3121 room
- 3972 rooms
- 1,7293 rooms
- 4,4064 rooms
- 3,6885 rooms
- 2,0876 rooms
- 5637 rooms
- 2548 rooms
- 2179+ rooms
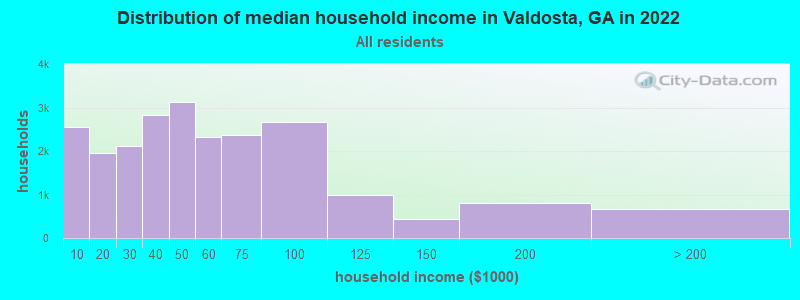
Valdosta, GA household income distribution

- 2,546Less than $10,000
- 1,952$10,000 to $19,999
- 2,108$20,000 to $29,999
- 2,834$30,000 to $39,999
- 3,115$40,000 to $49,999
- 2,313$50,000 to $59,999
- 2,357$60,000 to $74,999
- 2,659$75,000 to $99,999
- 980$100,000 to $124,999
- 428$125,000 to $149,999
- 814$150,000 to $199,999
- 671$200,000 or more
Home value of owner - occupied houses in 2022 in Valdosta, GA
-
- 48Less than $10,000
- 104$10,000 to $14,999
- 179$15,000 to $19,999
- 51$20,000 to $24,999
- 18$25,000 to $29,999
- 386$30,000 to $34,999
- 192$35,000 to $39,999
- 186$40,000 to $49,999
- 236$50,000 to $59,999
- 199$60,000 to $69,999
- 332$70,000 to $79,999
- 449$80,000 to $89,999
- 313$90,000 to $99,999
- 455$100,000 to $124,999
- 694$125,000 to $149,999
- 940$150,000 to $174,999
- 542$175,000 to $199,999
- 1,644$200,000 to $249,999
- 758$250,000 to $299,999
- 892$300,000 to $399,999
- 603$400,000 to $499,999
- 213$500,000 to $749,999
- 66$750,000 to $999,999
- 18$1,000,000 to $1,499,999
- 13$1,500,000 to $1,999,999

Rent paid by renters in 2022 in Valdosta, GA
-
- 97Less than $100
- 97$100 to $149
- 118$150 to $199
- 114$200 to $249
- 156$250 to $299
- 114$300 to $349
- 427$350 to $399
- 278$400 to $449
- 424$450 to $499
- 828$500 to $549
- 452$550 to $599
- 827$600 to $649
- 1,072$650 to $699
- 851$700 to $749
- 920$750 to $799
- 2,868$800 to $899
- 1,476$900 to $999
- 1,225$1,000 to $1,249
- 295$1,250 to $1,499
- 575$1,500 to $1,999
- 19$2,000 to $2,499
- 10$3,000 to $3,499
- 336No cash rent
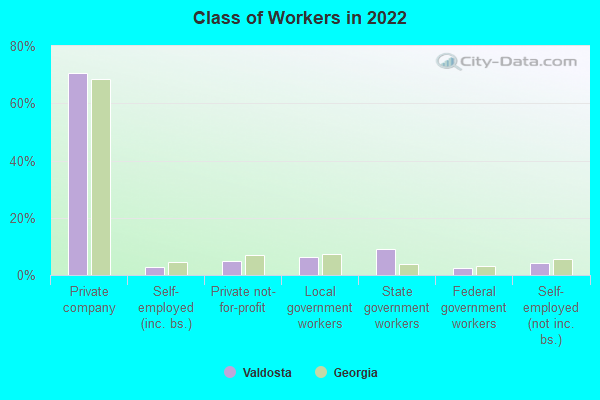
Percentage of workers working in this county: 91.6%
Number of people working at home: 1,461 (5.9% of all workers)
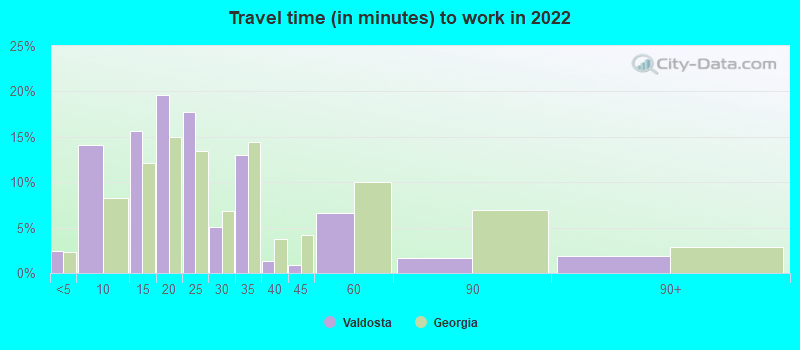
Travel time to work (commute)
- Less than 5 minutes: 855
- 5 to 9 minutes: 4,873
- 10 to 14 minutes: 5,232
- 15 to 19 minutes: 5,192
- 20 to 24 minutes: 3,477
- 25 to 29 minutes: 596
- 30 to 34 minutes: 1,720
- 35 to 39 minutes: 102
- 40 to 44 minutes: 154
- 45 to 59 minutes: 1,006
- 60 to 89 minutes: 436
- 90 or more minutes: 264
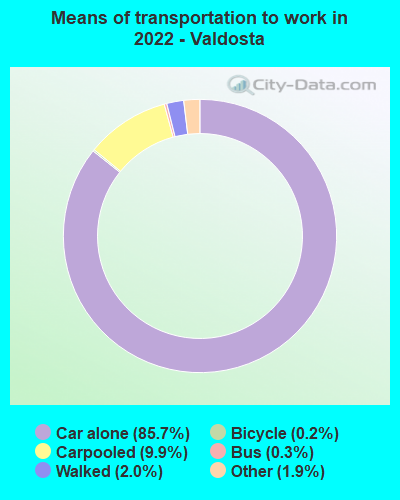
Means of transportation to work:
- Drove a car alone: 33,031 (79.4%)
- Carpooled: 3,973 (9.5%)
- Bus: 93 (0.2%)
- Long-distance train or commuter rail: 7 (0.0%)
- Taxi: 774 (1.9%)
- Bicycle: 77 (0.2%)
- Walked: 817 (2.0%)
- Worked at home: 1,461 (3.5%)
- Unemployment by race in 2022
- Unemployment rate for White non-Hispanic residents
- 3.7%Males
- 4.6%Females
- Unemployment rate for Black residents
- 3.7%Males
- 6.5%Females
- Unemployment rate for American Indian and Alaska Native residents
- 10.8%Males
- Unemployment rate for Asian residents
- 1.4%Males
- 1.6%Females
- Unemployment rate for two or more race residents
- 5.5%Males
- 4.8%Females
- Unemployment rate for Hispanic or Latino residents
- 8.3%Males
- 3.8%Females
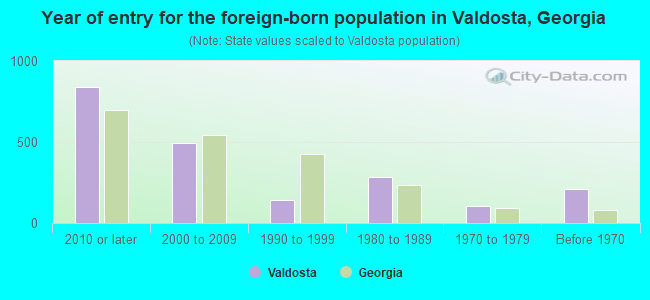
- Year of entry for the foreign-born population in Valdosta, Georgia
- 8372010 or later
- 4962000 to 2009
- 1391990 to 1999
- 2811980 to 1989
- 1081970 to 1979
- 212Before 1970
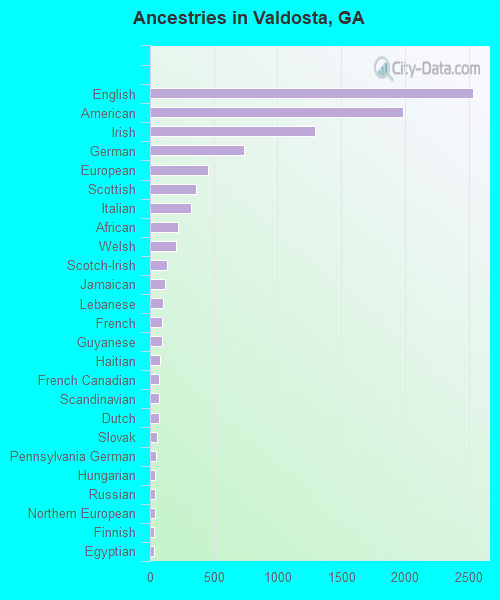
First ancestries reported:
- English: 2,533 (7.0%)
- American: 1,987 (5.5%)
- Irish: 1,297 (3.6%)
- German: 739 (2.0%)
- European: 456 (1.3%)
- Scottish: 359 (1.0%)
- Italian: 324 (0.9%)
- African: 222 (0.6%)
- Welsh: 201 (0.6%)
- Scotch-Irish: 134 (0.4%)
- Jamaican: 114 (0.3%)
- Lebanese: 99 (0.3%)
- French: 95 (0.3%)
- Guyanese: 91 (0.3%)
- Haitian: 80 (0.2%)
- French Canadian: 71 (0.2%)
- Scandinavian: 70 (0.2%)
- Dutch: 67 (0.2%)
- Slovak: 57 (0.2%)
- Pennsylvania German: 50 (0.1%)
- Hungarian: 42 (0.1%)
- Russian: 37 (0.1%)
- Northern European: 37 (0.1%)
- Finnish: 33 (0.09%)
- Egyptian: 30 (0.08%)
- Nigerian: 28 (0.08%)
- Greek: 27 (0.07%)
- Polish: 25 (0.07%)
- Eastern European: 21 (0.06%)
- Dutch West Indian: 19 (0.05%)
- Czech: 18 (0.05%)
- Austrian: 17 (0.05%)
- Portuguese: 16 (0.04%)
- Belizean: 16 (0.04%)
- Norwegian: 8 (0.02%)
- British: 2 (0.01%)
- Swiss: 2 (0.01%)
- Bahamian: 2 (0.01%)
Most common places of birth for foreign-born residents (%):
| Valdosta: | 13.9% (240) |
| Georgia: | 20.0% (223,400) |
| Valdosta: | 8.4% (145) |
| Georgia: | 1.7% (19,012) |
| Valdosta: | 7.5% (130) |
| Georgia: | 3.9% (43,756) |
| Valdosta: | 6.2% (108) |
| Georgia: | 9.2% (103,325) |
| Valdosta: | 5.7% (99) |
| Georgia: | 0.9% (10,397) |
| Valdosta: | 5.1% (89) |
| Georgia: | 0.2% (2,325) |
| Valdosta: | 4.7% (81) |
| Georgia: | 4.6% (51,270) |
| Valdosta: | 4.4% (77) |
| Georgia: | 0.5% (6,116) |
| Valdosta: | 3.7% (64) |
| Georgia: | 1.8% (20,700) |
| Valdosta: | 2.8% (49) |
| Georgia: | 1.6% (17,851) |
| Valdosta: | 2.8% (49) |
| Georgia: | 1.2% (12,946) |
| Valdosta: | 2.8% (48) |
| Georgia: | 0.7% (7,969) |
| Valdosta: | 2.7% (47) |
| Georgia: | 0.8% (9,101) |
| Valdosta: | 2.3% (40) |
| Georgia: | 0.2% (2,141) |
| Valdosta: | 2.0% (35) |
| Georgia: | 0.3% (3,559) |
| Valdosta: | 1.9% (33) |
| Georgia: | 0.0% (429) |
| Valdosta: | 1.8% (32) |
| Georgia: | 1.7% (18,651) |
| Valdosta: | 1.7% (30) |
| Georgia: | 0.3% (2,940) |
| Valdosta: | 1.7% (29) |
| Georgia: | 0.1% (718) |
Place of birth for U.S.-born residents:
- This state: 33,706
- Other state: 19,899
- Northeast: 3,799
- Midwest: 2,839
- South: 11,144
- West: 2,038
80.5% of Valdosta residents lived in the same house 1 years ago.
Out of people who lived in different houses, 31.0% lived in this county.
Out of people who lived in different counties, 78.4% lived in Georgia.
| Valdosta: | 80.5% |
| State average: | 86.6% |
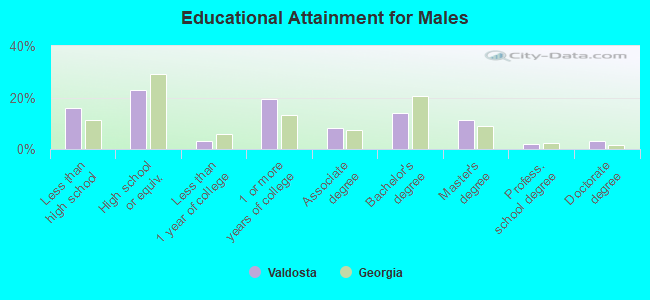
Education attainment for males 25 years and older:
- No schooling: 537
- Nursery to 4th grade: 12
- 5th and 6th grade: 51
- 7th and 8th grade: 362
- 9th grade: 218
- 10th grade: 353
- 11th grade: 291
- 12th grade, no diploma: 519
- High school graduate (or equivalency): 3,415
- Less than 1 year of college: 448
- Some college more than 1 year, no degree: 2,913
- Associate degree: 1,220
- Bachelor's degree: 2,079
- Master's degree: 1,671
- Professional school degree: 314
- Doctorate degree: 490
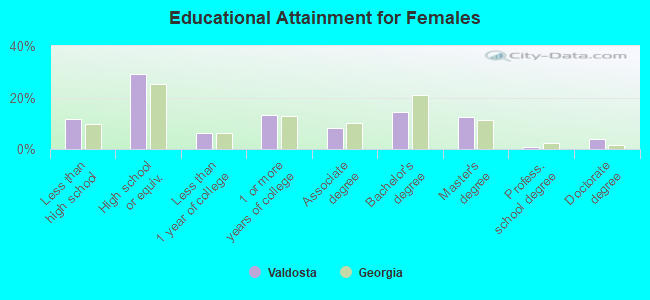
Education attainment for females 25 years and older:
- No schooling: 613
- Nursery to 4th grade: 44
- 5th and 6th grade: 26
- 7th and 8th grade: 223
- 9th grade: 273
- 10th grade: 257
- 11th grade: 645
- 12th grade, no diploma: 71
- High school graduate (or equivalency): 5,354
- Less than 1 year of college: 1,115
- Some college more than 1 year, no degree: 2,452
- Associate degree: 1,507
- Bachelor's degree: 2,614
- Master's degree: 2,268
- Professional school degree: 156
- Doctorate degree: 689
Housing units in structures:
- One, detached: 16,964
- One, attached: 520
- Two: 905
- 3 or 4: 1,790
- 5 to 9: 2,621
- 10 to 19: 1,824
- 20 to 49: 389
- 50 or more: 643
- Mobile homes: 395
Median worth of mobile homes: $29,782
Housing units lacking complete kitchen facilities in 2022: 2.5%
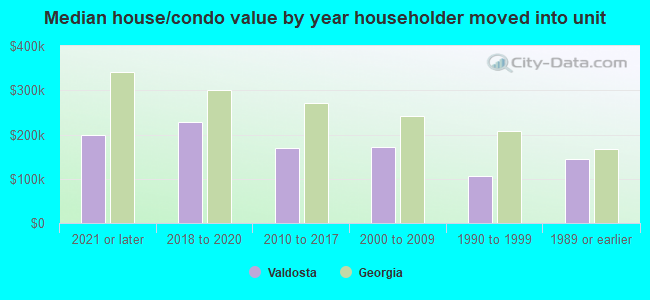
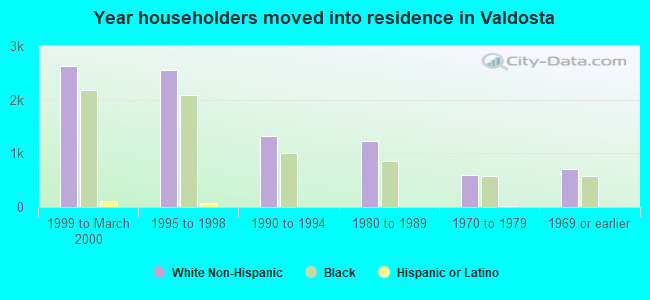
House/condo owner moved in on average 12 years ago
Renter moved in on average 3 years ago
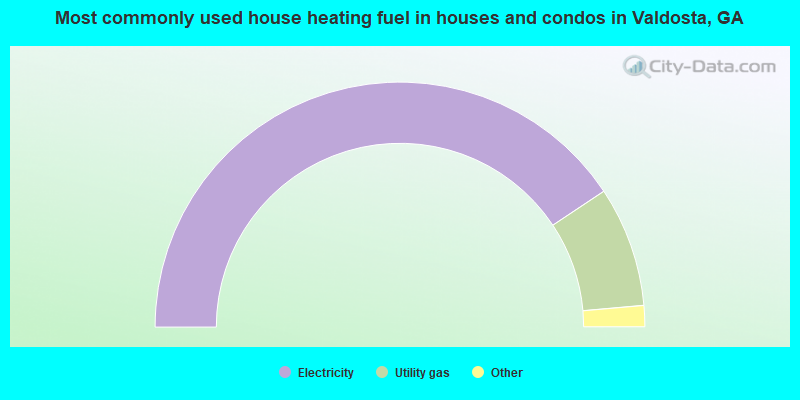
- 81.3%Electricity
- 15.9%Utility gas
- 2.4%Bottled, tank, or LP gas
- 0.2%No fuel used
- 0.2%Fuel oil, kerosene, etc.
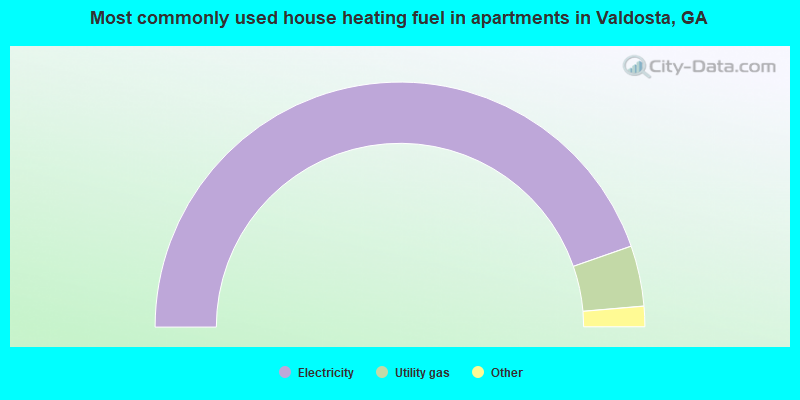
- 89.3%Electricity
- 8.0%Utility gas
- 1.3%Bottled, tank, or LP gas
- 1.1%No fuel used
- 0.3%Fuel oil, kerosene, etc.
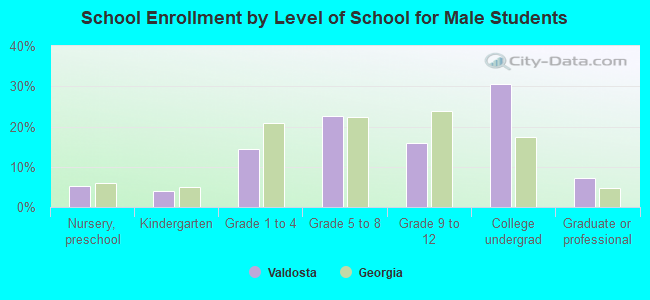
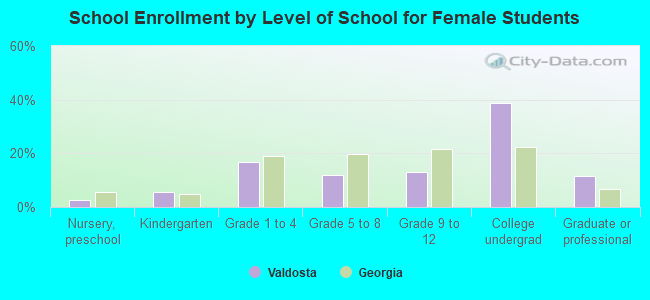
Private vs. public school enrollment:
| Here: | 12.8% |
| Georgia: | 12.1% |
| Here: | 5.4% |
| Georgia: | 10.8% |
| Here: | 6.5% |
| Georgia: | 17.1% |