Warren, MI (Michigan) Houses and Residents
| Warren: | $191,400 |
| Michigan: | $224,400 |
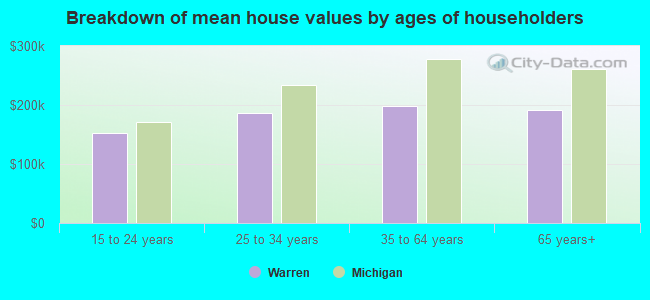
Mean price in 2022:
Detached houses: $190,726
Here: $190,726 State: $280,038 Townhouses or other attached units: $239,873
Here: $239,873 State: $239,520 In 2-unit structures: $217,249
Here: $217,249 State: $219,481 In 3-to-4-unit structures: $85,283
Here: $85,283 State: $207,067 In 5-or-more-unit structures: $94,019
Here: $94,019 State: $192,733 Mobile homes: $105,493
Here: $105,493 State: $72,868
Total population: 135,099 (All urban)
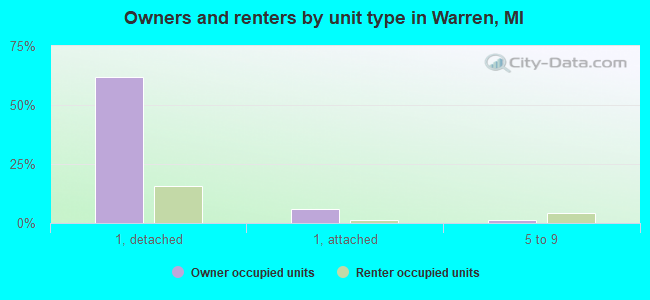
Houses: 60,419 (57,522 occupied: 38,689 owner occupied, 18,833 renter occupied)
| % of renters here: | 33% |
| State: | 27% |
Housing density: 1,762 houses/condos per square mile
Median price asked for vacant for-sale houses and condos in 2022: $127,593.
Median contract rent in 2022: $924 (lower quartile is $786, upper quartile is $1,085)
Median rent asked for vacant for-rent units in 2022: $885
Median gross rent in Warren, MI in 2022: $1,133
Housing units in Warren with a mortgage: 23,131 (2,157 second mortgage, 0 home equity loan, 1,663 both second mortgage and home equity loan)
Houses without a mortgage: 806
Median household income for houses/condos with a mortgage: $84,130
Median household income for apartments without a mortgage: $48,740
Median monthly housing costs: $1,054
Compare current foreclosures in Warren, MI:
| Photo | Address | Area | Beds / Baths | Price | Details |
|---|---|---|---|---|---|

|
#1
Toepfer Rd
Warren, MI 48091
|
1,092 sq. feet
|
1 baths 3 beds |
$159,000
|
show details |

|
#2
Georgiana Ave
Warren, MI 48089
|
1,233 sq. feet
|
1 baths - beds |
$4,500
|
show details |

|
#3
Palomino Dr
Warren, MI 48093
|
1,401 sq. feet
|
1 baths 3 beds |
show details | |

|
#4
Eastwood Blvd
Warren, MI 48089
|
1,002 sq. feet
|
1 baths 3 beds |
show details | |

|
#5
Hupp Ave
Warren, MI 48091
|
896 sq. feet
|
1 baths 3 beds |
show details | |

|
#6
Waltz Ave
Warren, MI 48091
|
700 sq. feet
|
1 baths 3 beds |
show details | |

|
#7
Lawson Ave
Warren, MI 48089
|
955 sq. feet
|
1 baths 3 beds |
show details | |

|
#8
Curie Ct
Warren, MI 48091
|
1,130 sq. feet
|
1 baths 3 beds |
show details | |

|
#9
Masonic Blvd
Warren, MI 48088
|
956 sq. feet
|
1 baths 3 beds |
show details | |

|
#10
Sutherland Dr
Warren, MI 48088
|
- sq. feet
|
1 baths 3 beds |
show details |
| Photo | Address | Area | Beds / Baths | Price | Details |
|---|---|---|---|---|---|

|
#11
Stewart Ave
Warren, MI 48089
|
789 sq. feet
|
1 baths 3 beds |
show details | |

|
#12
Rosenbusch Blvd
Warren, MI 48089
|
903 sq. feet
|
1 baths 3 beds |
show details | |

|
#13
Scrivo Dr
Warren, MI 48092
|
1,561 sq. feet
|
1 baths 3 beds |
show details | |

|
#14
Crystal Ave
Warren, MI 48091
|
1,013 sq. feet
|
1 baths 3 beds |
show details | |

|
#15
Dale Ave
Warren, MI 48089
|
1,007 sq. feet
|
1 baths 3 beds |
show details | |

|
#16
Orvylle Dr
Warren, MI 48092
|
1,712 sq. feet
|
1 baths 3 beds |
show details | |

|
#17
Bradmore Rd
Warren, MI 48092
|
2,220 sq. feet
|
2 baths 4 beds |
show details | |

|
#18
Common Rd
Warren, MI 48088
|
953 sq. feet
|
1 baths 3 beds |
show details | |

|
#19
Sunset Ave
Warren, MI 48091
|
1,126 sq. feet
|
1 baths 3 beds |
show details | |

|
#20
Lauren Ave
Warren, MI 48089
|
945 sq. feet
|
1 baths 3 beds |
show details |
| Photo | Address | Area | Beds / Baths | Price | Details |
|---|---|---|---|---|---|

|
#21
Palomino Dr
Warren, MI 48093
|
1,371 sq. feet
|
1 baths 3 beds |
show details | |

|
#22
Dale Ave
Warren, MI 48089
|
1,210 sq. feet
|
1 baths 3 beds |
show details | |

|
#23
Garbor Dr
Warren, MI 48092
|
962 sq. feet
|
1 baths 3 beds |
show details | |

|
#24
Gloede Dr
Warren, MI 48088
|
1,132 sq. feet
|
1 baths 3 beds |
show details | |

|
#25
Thomas Dr
Warren, MI 48091
|
1,126 sq. feet
|
1 baths 3 beds |
show details | |

|
#26
Community Blvd
Warren, MI 48093
|
1,572 sq. feet
|
1 baths 3 beds |
show details | |

|
#27
Ray Dr
Warren, MI 48088
|
1,118 sq. feet
|
1 baths - beds |
show details | |

|
#28
Lorraine Ave
Warren, MI 48089
|
694 sq. feet
|
1 baths - beds |
show details | |

|
#29
Malvina Dr
Warren, MI 48088
|
1,053 sq. feet
|
1 baths - beds |
show details | |

|
#30
Wagner Dr
Warren, MI 48093
|
1,794 sq. feet
|
1 baths - beds |
show details |
| Photo | Address | Area | Beds / Baths | Price | Details |
|---|---|---|---|---|---|

|
#31
Pembroke Dr
Warren, MI 48092
|
1,455 sq. feet
|
1 baths - beds |
show details | |

|
#32
Haverhill Dr
Warren, MI 48091
|
1,402 sq. feet
|
1 baths - beds |
show details | |

|
#33
Stricker Dr
Warren, MI 48088
|
1,132 sq. feet
|
1 baths - beds |
show details | |

|
#34
Bart Ave
Warren, MI 48091
|
876 sq. feet
|
1 baths - beds |
show details | |

|
#35
Chippewa Dr
Warren, MI 48088
|
1,312 sq. feet
|
1 baths - beds |
show details | |

|
#36
Stricker Dr
Warren, MI 48088
|
1,078 sq. feet
|
1 baths - beds |
show details | |

|
#37
Maxwell Ave
Warren, MI 48089
|
1,335 sq. feet
|
1 baths - beds |
show details | |

|
#38
Sherman Ave
Warren, MI 48089
|
870 sq. feet
|
1 baths - beds |
show details | |

|
#39
Frazho Rd
Warren, MI 48089
|
1,769 sq. feet
|
1 baths - beds |
show details | |

|
#40
Ready Ave
Warren, MI 48091
|
696 sq. feet
|
1 baths - beds |
show details |
| Photo | Address | Area | Beds / Baths | Price | Details |
|---|---|---|---|---|---|

|
#41
Beierman Ave
Warren, MI 48091
|
1,211 sq. feet
|
1 baths - beds |
show details | |

|
#42
Sherman Ave
Warren, MI 48089
|
896 sq. feet
|
1 baths - beds |
show details | |

|
#43
Audrey Ave
Warren, MI 48091
|
1,194 sq. feet
|
1 baths - beds |
show details | |

|
#44
Martin Rd
Warren, MI 48092
|
904 sq. feet
|
1 baths - beds |
show details | |

|
#45
Glenwood Cir
Warren, MI 48088
|
1,357 sq. feet
|
1 baths - beds |
show details | |

|
#46
Dodge Ave
Warren, MI 48089
|
691 sq. feet
|
1 baths - beds |
show details | |

|
#47
Bolam Ave
Warren, MI 48089
|
1,040 sq. feet
|
1 baths - beds |
show details | |

|
#48
Thomas St
Warren, MI 48091
|
904 sq. feet
|
1 baths - beds |
show details | |

|
#49
Newport Dr
Warren, MI 48088
|
1,204 sq. feet
|
1 baths - beds |
show details | |

|
Check over 1 million property listings on Foreclosure.com!
|
browse all offers | |||

Latest news about housing in Warren, MI collected exclusively by city-data.com from local newspapers, TV, and radio stations

 | looking for houses to rent near Warren (4 replies) |
| Moving to Warren, please comment on nearby apartments (1 reply) |
| Renting a trailer for a one-way move (0 replies) |
| 10 Mile in Warren (4 replies) |
| Transfering to Warren where is a safe place to find a house? (5 replies) |
| Buying a home in a few months (14 replies) |

Median year apartment built: 1967
Household type by relationship:
Households: 137,111- Male householders: 28,485 (9,312 living alone), Female householders: 29,037 (9,059 living alone)
20,378 spouses (19,732 opposite-sex spouses), 4,634 unmarried partners, (4,327 opposite-sex unmarried partners), 41,874 children (40,489 natural, 221 adopted, 1,164 stepchildren), 2,879 grandchildren, 2,029 brothers or sisters, 2,091 parents, 0 foster children, 1,553 other relatives, 3,309 non-relatives
- In group quarters: 842
Size of family households: 14,068 2-persons, 8,820 3-persons, 6,096 4-persons, 2,635 5-persons, 1,579 6-persons, 933 7-or-more-persons.
Size of nonfamily households: 18,371 1-person, 4,540 2-persons, 335 3-persons, 118 4-persons, 27 5-persons.
16,724 married couples with children.
8,549 single-parent households (2,592 men, 5,957 women).
81.8% of residents of Warren speak English at home.
0.9% of residents speak Spanish at home (75% speak English very well, 17% speak English well, 7% speak English not well, 1% don't speak English at all).
9.0% of residents speak other Indo-European language at home (50% speak English very well, 27% speak English well, 21% speak English not well, 1% don't speak English at all).
4.2% of residents speak Asian or Pacific Island language at home (56% speak English very well, 27% speak English well, 11% speak English not well, 6% don't speak English at all).
4.6% of residents speak other language at home (50% speak English very well, 28% speak English well, 14% speak English not well, 8% don't speak English at all).
Foreign born population: 19,347 (14.1%)
(71.2% of them are naturalized citizens)
| Here: | 5.9 |
| State: | 6.5 |
| Here: | 4.4 |
| State: | 4.3 |
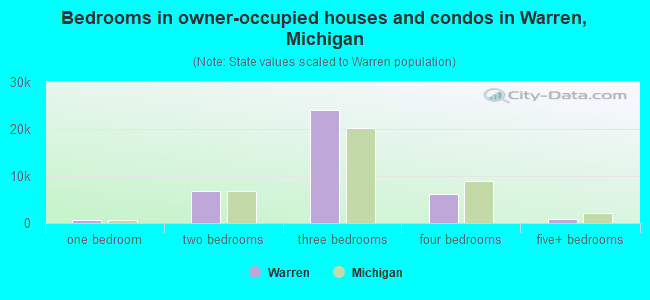
- Bedrooms in owner-occupied houses and condos in Warren, Michigan
- 67no bedroom
- 7401 bedroom
- 6,8062 bedrooms
- 24,0553 bedrooms
- 6,1924 bedrooms
- 8295+ bedrooms
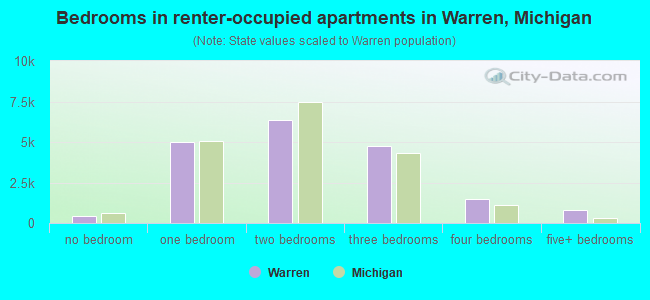
- Bedrooms in renter-occupied apartments in Warren, Michigan
- 416no bedroom
- 5,0221 bedroom
- 6,3572 bedrooms
- 4,7483 bedrooms
- 1,4734 bedrooms
- 8175+ bedrooms
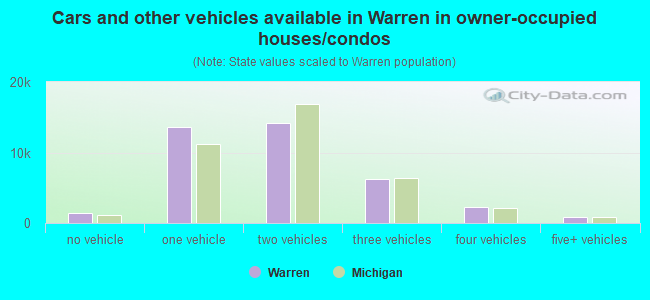
- Cars and other vehicles available in Warren in owner-occupied houses/condos
- 1,391no vehicle
- 13,6731 vehicle
- 14,2382 vehicles
- 6,2763 vehicles
- 2,3214 vehicles
- 7905+ vehicles
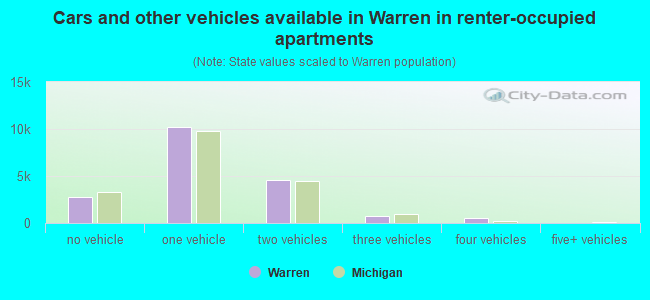
- Cars and other vehicles available in Warren in renter-occupied apartments
- 2,779no vehicle
- 10,1851 vehicle
- 4,6232 vehicles
- 7103 vehicles
- 5364 vehicles
- 05+ vehicles
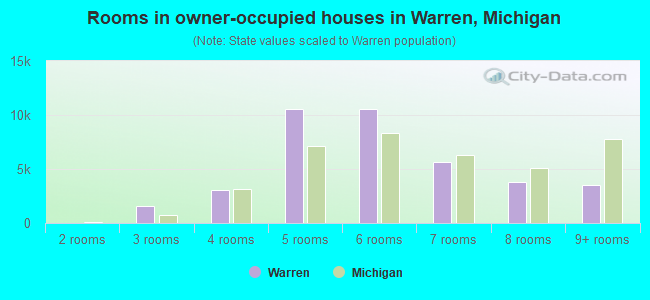
- Rooms in owner-occupied houses in Warren, Michigan
- 01 room
- 02 rooms
- 1,5403 rooms
- 3,0474 rooms
- 10,5185 rooms
- 10,5766 rooms
- 5,6447 rooms
- 3,8058 rooms
- 3,5599+ rooms
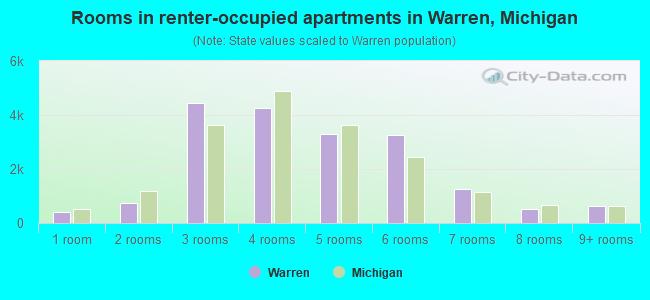
- Rooms in renter-occupied apartments in Warren, Michigan
- 4161 room
- 7402 rooms
- 4,4353 rooms
- 4,2564 rooms
- 3,3025 rooms
- 3,2506 rooms
- 1,2717 rooms
- 5268 rooms
- 6379+ rooms
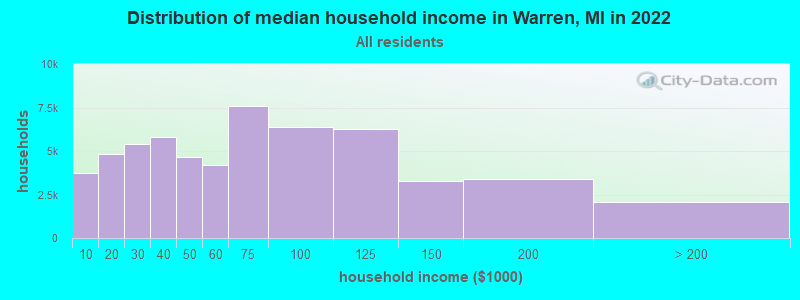
Warren, MI household income distribution

- 3,721Less than $10,000
- 4,819$10,000 to $19,999
- 5,391$20,000 to $29,999
- 5,797$30,000 to $39,999
- 4,639$40,000 to $49,999
- 4,176$50,000 to $59,999
- 7,561$60,000 to $74,999
- 6,400$75,000 to $99,999
- 6,274$100,000 to $124,999
- 3,290$125,000 to $149,999
- 3,395$150,000 to $199,999
- 2,059$200,000 or more
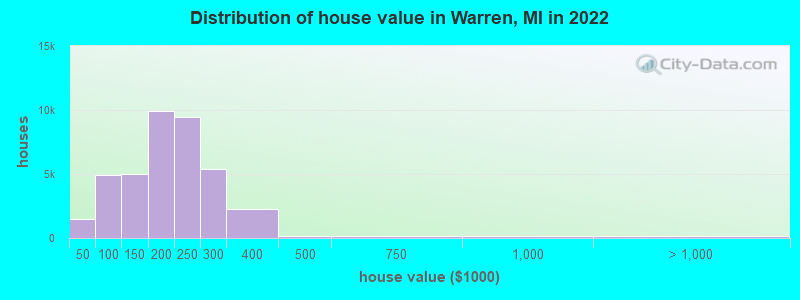
Home value of owner - occupied houses in 2022 in Warren, MI
-
- 478Less than $10,000
- 52$10,000 to $14,999
- 235$15,000 to $19,999
- 52$20,000 to $24,999
- 82$25,000 to $29,999
- 143$30,000 to $34,999
- 466$40,000 to $49,999
- 384$50,000 to $59,999
- 1,036$60,000 to $69,999
- 541$70,000 to $79,999
- 1,846$80,000 to $89,999
- 643$90,000 to $99,999
- 2,857$100,000 to $124,999
- 2,177$125,000 to $149,999
- 5,326$150,000 to $174,999
- 4,618$175,000 to $199,999
- 9,438$200,000 to $249,999
- 5,370$250,000 to $299,999
- 2,292$300,000 to $399,999
- 165$400,000 to $499,999
- 176$500,000 to $749,999
- 131$750,000 to $999,999
- 97$1,000,000 to $1,499,999
- 84$2,000,000 or more
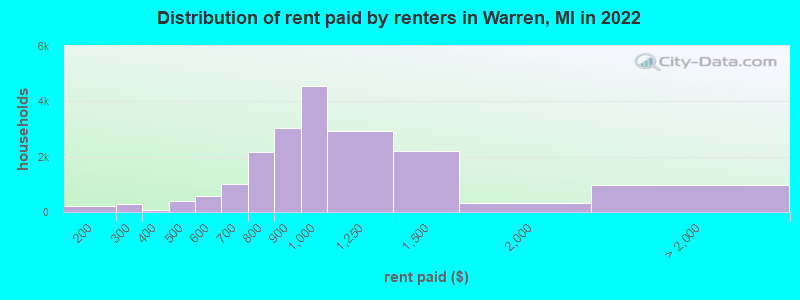
Rent paid by renters in 2022 in Warren, MI
-
- 34Less than $100
- 108$100 to $149
- 115$150 to $199
- 250$200 to $249
- 43$250 to $299
- 74$300 to $349
- 243$400 to $449
- 141$450 to $499
- 155$500 to $549
- 420$550 to $599
- 178$600 to $649
- 852$650 to $699
- 1,027$700 to $749
- 1,153$750 to $799
- 3,027$800 to $899
- 4,567$900 to $999
- 2,936$1,000 to $1,249
- 2,220$1,250 to $1,499
- 309$1,500 to $1,999
- 981No cash rent
Percentage of workers working in this county: 56.5%
Number of people working at home: 8,305 (12.6% of all workers)
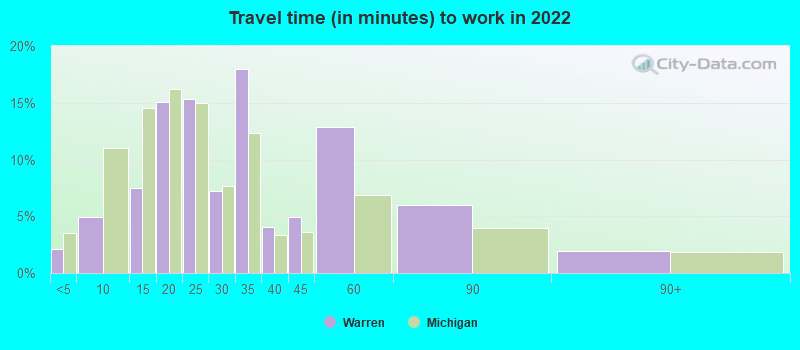
Travel time to work (commute)
- Less than 5 minutes: 1,271
- 5 to 9 minutes: 3,587
- 10 to 14 minutes: 4,990
- 15 to 19 minutes: 10,630
- 20 to 24 minutes: 10,137
- 25 to 29 minutes: 6,765
- 30 to 34 minutes: 8,534
- 35 to 39 minutes: 2,269
- 40 to 44 minutes: 2,744
- 45 to 59 minutes: 2,629
- 60 to 89 minutes: 1,501
- 90 or more minutes: 1,566
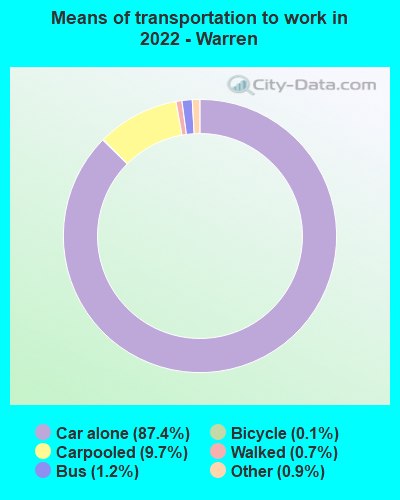
Means of transportation to work:
- Drove a car alone: 67,734 (76.7%)
- Carpooled: 7,889 (8.9%)
- Bus: 716 (0.8%)
- Taxi: 787 (0.9%)
- Bicycle: 172 (0.2%)
- Walked: 605 (0.7%)
- Worked at home: 8,305 (9.4%)
- Unemployment by race in 2022
- Unemployment rate for White non-Hispanic residents
- 4.8%Males
- 2.8%Females
- Unemployment rate for Black residents
- 5.9%Males
- 15.2%Females
- Unemployment rate for American Indian and Alaska Native residents
- 2.3%Males
- 4.1%Females
- Unemployment rate for Asian residents
- 4.1%Males
- 7.9%Females
- Unemployment rate for other race residents
- 4.0%Males
- Unemployment rate for two or more race residents
- 2.9%Males
- 19.3%Females
- Unemployment rate for Hispanic or Latino residents
- 11.1%Males
- 12.8%Females
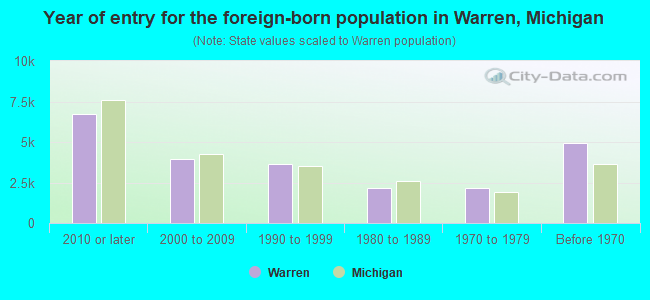
- Year of entry for the foreign-born population in Warren, Michigan
- 6,7212010 or later
- 3,9612000 to 2009
- 3,6221990 to 1999
- 2,1501980 to 1989
- 2,1371970 to 1979
- 4,916Before 1970
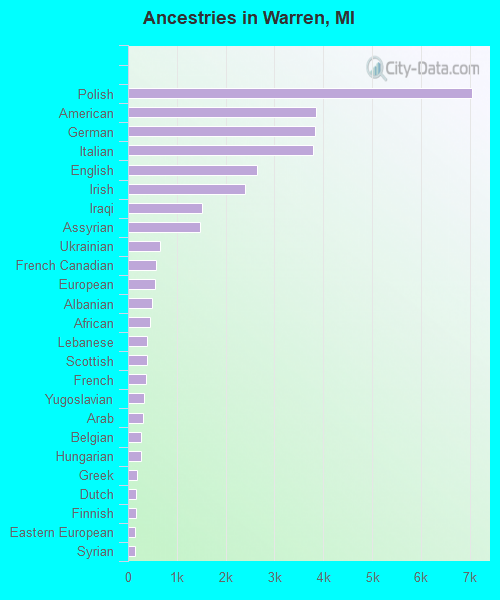
First ancestries reported:
- Polish: 7,044 (10.3%)
- American: 3,844 (5.6%)
- German: 3,839 (5.6%)
- Italian: 3,800 (5.5%)
- English: 2,634 (3.8%)
- Irish: 2,406 (3.5%)
- Iraqi: 1,522 (2.2%)
- Assyrian: 1,478 (2.2%)
- Ukrainian: 657 (1.0%)
- French Canadian: 577 (0.8%)
- European: 549 (0.8%)
- Albanian: 485 (0.7%)
- African: 454 (0.7%)
- Lebanese: 396 (0.6%)
- Scottish: 396 (0.6%)
- French: 360 (0.5%)
- Yugoslavian: 333 (0.5%)
- Arab: 310 (0.5%)
- Belgian: 271 (0.4%)
- Hungarian: 260 (0.4%)
- Greek: 188 (0.3%)
- Dutch: 158 (0.2%)
- Finnish: 155 (0.2%)
- Eastern European: 153 (0.2%)
- Syrian: 151 (0.2%)
- Armenian: 144 (0.2%)
- Romanian: 140 (0.2%)
- Scotch-Irish: 126 (0.2%)
- Croatian: 126 (0.2%)
- Nigerian: 109 (0.2%)
- Iranian: 104 (0.2%)
- British: 100 (0.1%)
- Canadian: 100 (0.1%)
- Kenyan: 95 (0.1%)
- Norwegian: 79 (0.1%)
- Macedonian: 72 (0.1%)
- Czech: 71 (0.1%)
- Danish: 64 (0.09%)
- Scandinavian: 62 (0.09%)
- Slovak: 61 (0.09%)
- Serbian: 57 (0.08%)
- Lithuanian: 49 (0.07%)
- Jordanian: 48 (0.07%)
- Maltese: 48 (0.07%)
- Slovene: 47 (0.07%)
- Swedish: 47 (0.07%)
- Jamaican: 47 (0.07%)
- Russian: 41 (0.06%)
- Welsh: 41 (0.06%)
- Northern European: 37 (0.05%)
- Pennsylvania German: 37 (0.05%)
- Moroccan: 27 (0.04%)
- Austrian: 23 (0.03%)
- Palestinian: 22 (0.03%)
- Portuguese: 21 (0.03%)
- Turkish: 17 (0.02%)
- Czechoslovakian: 15 (0.02%)
- Guyanese: 10 (0.01%)
- Egyptian: 6 (0.01%)
Most common places of birth for foreign-born residents (%):
| Warren: | 32.2% (5,713) |
| Michigan: | 2.6% (18,065) |
| Warren: | 22.3% (3,965) |
| Michigan: | 8.1% (55,954) |
| Warren: | 5.7% (1,012) |
| Michigan: | 2.8% (19,112) |
| Warren: | 4.5% (794) |
| Michigan: | 11.1% (77,240) |
| Warren: | 4.0% (709) |
| Michigan: | 1.6% (10,857) |
| Warren: | 3.3% (587) |
| Michigan: | 1.0% (6,829) |
| Warren: | 3.3% (580) |
| Michigan: | 0.4% (3,027) |
| Warren: | 3.2% (562) |
| Michigan: | 1.8% (12,679) |
| Warren: | 2.6% (463) |
| Michigan: | 5.0% (35,052) |
| Warren: | 1.9% (340) |
| Michigan: | 10.9% (75,965) |
| Warren: | 1.6% (277) |
| Michigan: | 3.7% (25,634) |
| Warren: | 1.5% (267) |
| Michigan: | 0.9% (6,009) |
Place of birth for U.S.-born residents:
- This state: 99,110
- Other state: 16,713
- Northeast: 2,711
- Midwest: 4,464
- South: 7,368
- West: 2,170
90.6% of Warren residents lived in the same house 1 years ago.
Out of people who lived in different houses, 31.2% lived in this county.
Out of people who lived in different counties, 75.3% lived in Michigan.
| Warren: | 90.6% |
| State average: | 88.4% |
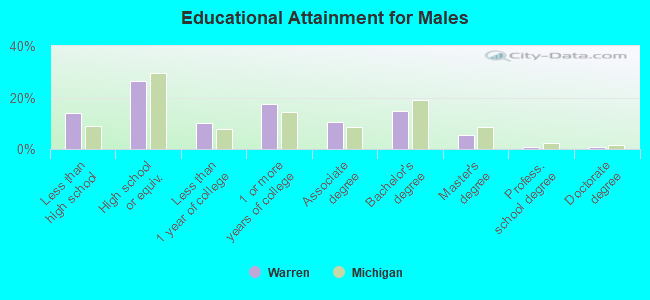
Education attainment for males 25 years and older:
- No schooling: 1,777
- Nursery to 4th grade: 0
- 5th and 6th grade: 440
- 7th and 8th grade: 57
- 9th grade: 410
- 10th grade: 1,628
- 11th grade: 1,143
- 12th grade, no diploma: 911
- High school graduate (or equivalency): 12,082
- Less than 1 year of college: 4,629
- Some college more than 1 year, no degree: 8,069
- Associate degree: 4,816
- Bachelor's degree: 6,812
- Master's degree: 2,418
- Professional school degree: 433
- Doctorate degree: 285
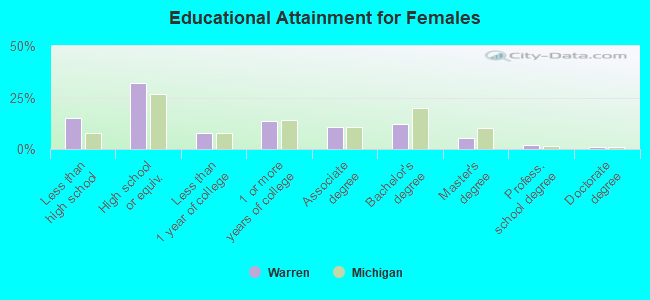
Education attainment for females 25 years and older:
- No schooling: 2,239
- Nursery to 4th grade: 85
- 5th and 6th grade: 335
- 7th and 8th grade: 288
- 9th grade: 326
- 10th grade: 1,182
- 11th grade: 1,765
- 12th grade, no diploma: 1,652
- High school graduate (or equivalency): 16,584
- Less than 1 year of college: 4,079
- Some college more than 1 year, no degree: 7,003
- Associate degree: 5,560
- Bachelor's degree: 6,400
- Master's degree: 2,780
- Professional school degree: 998
- Doctorate degree: 578


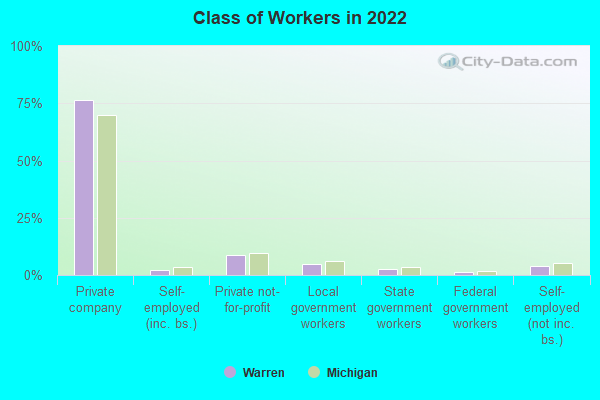
Housing units in structures:
- One, detached: 44,412
- One, attached: 5,082
- Two: 949
- 3 or 4: 1,608
- 5 to 9: 3,271
- 10 to 19: 1,276
- 20 to 49: 482
- 50 or more: 1,969
- Mobile homes: 1,370
Housing units lacking complete kitchen facilities in 2022: 2.4%
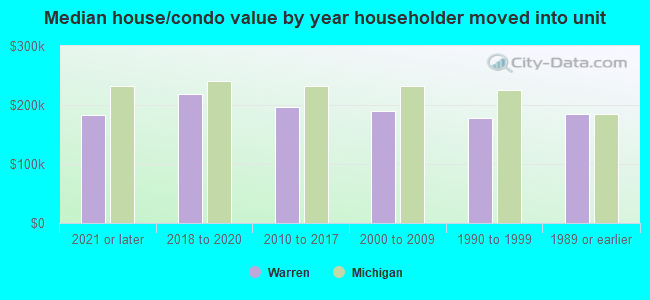
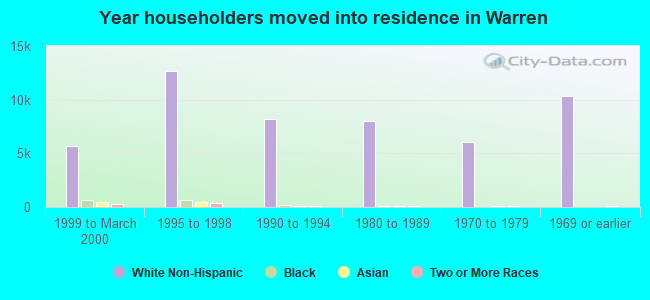
House/condo owner moved in on average 14 years ago
Renter moved in on average 4 years ago
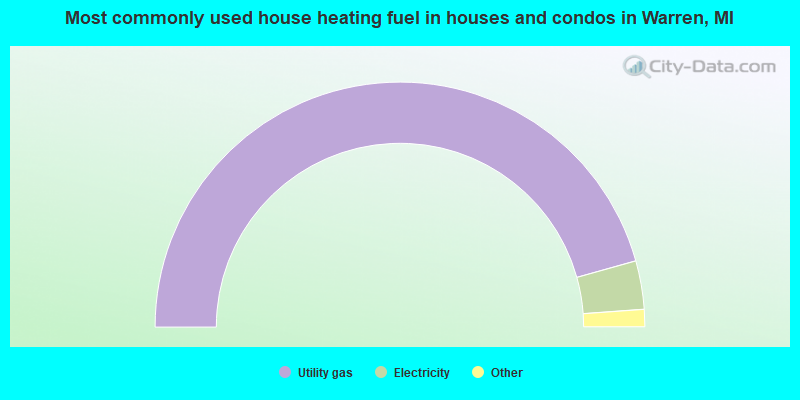
- 91.3%Utility gas
- 6.4%Electricity
- 1.7%Bottled, tank, or LP gas
- 0.2%Wood
- 0.1%Fuel oil, kerosene, etc.
- 0.1%Other fuel
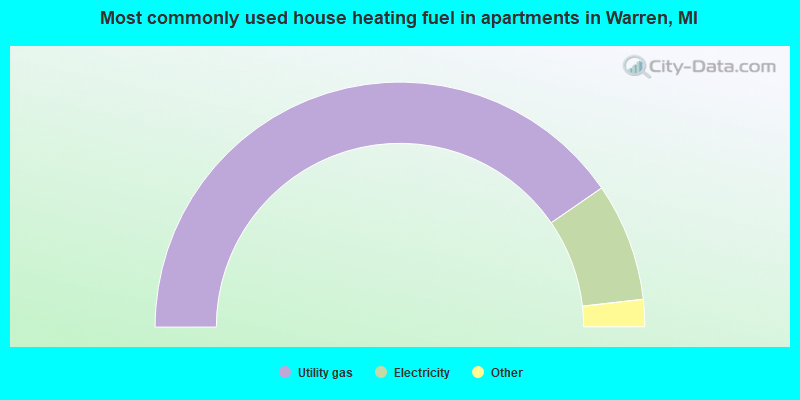
- 80.8%Utility gas
- 15.6%Electricity
- 1.7%Bottled, tank, or LP gas
- 1.1%No fuel used
- 0.8%Other fuel
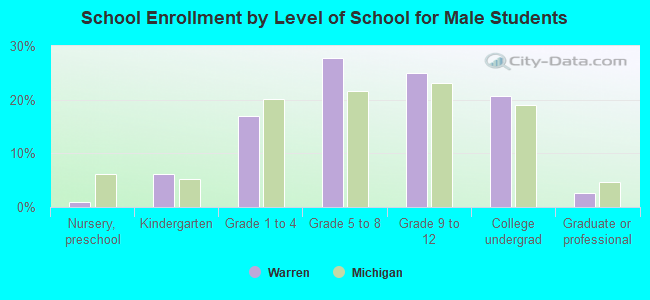
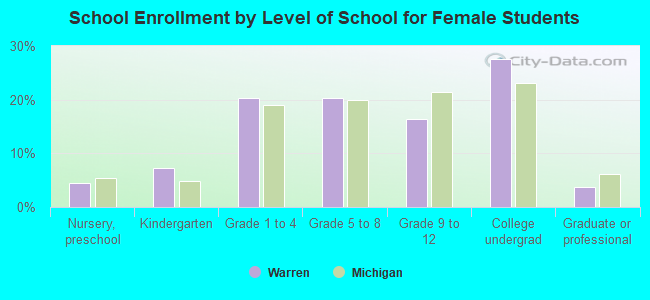
Private vs. public school enrollment:
| Here: | 4.8% |
| Michigan: | 12.4% |
| Here: | 3.7% |
| Michigan: | 9.8% |
| Here: | 14.6% |
| Michigan: | 14.9% |