Races in Warren, Michigan (MI) Detailed Stats
Data:
Races - White alone (%)
Races - White alone (% change since 2000)
Races - Black alone (%)
Races - Black alone (% change since 2000)
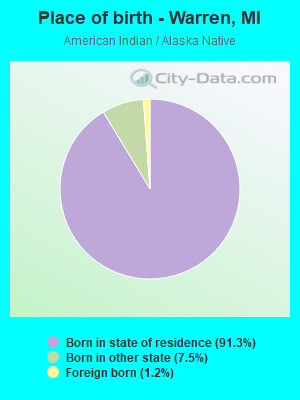
Races - American Indian alone (%)
Races - American Indian alone (% change since 2000)
Races - Asian alone (%)
Races - Asian alone (% change since 2000)
Races - Hispanic (%)
Races - Hispanic (% change since 2000)
Races - Native Hawaiian and Other Pacific Islander alone (%)
Races - Native Hawaiian and Other Pacific Islander alone (% change since 2000)
Races - Two or more races(%)
Races - Two or more races(% change since 2000)
Races - Other race alone (%)
Races - Other race alone (% change since 2000)
Racial diversity
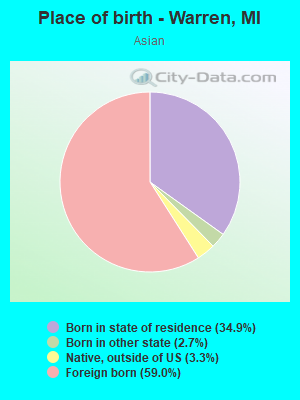
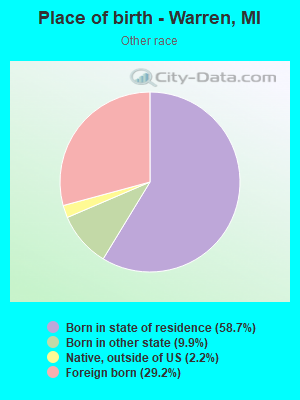
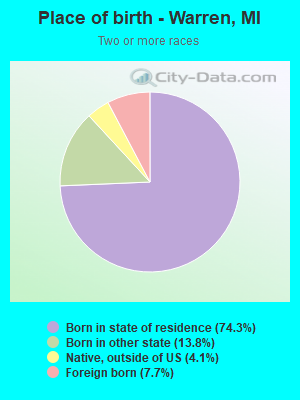
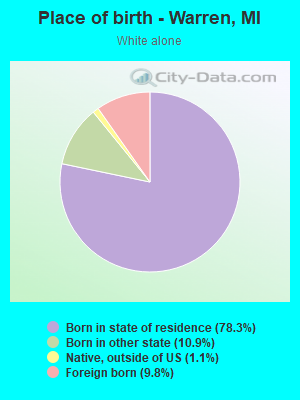
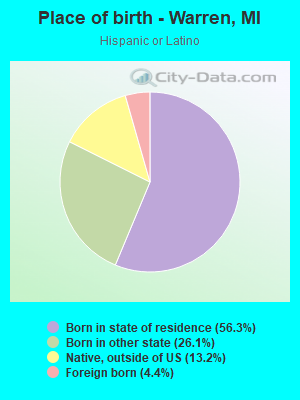
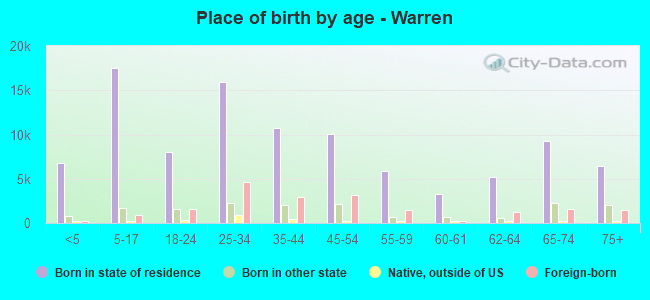
Place of birth - Born in state of residence (%)
Place of birth - Born in state of residence (%) - White
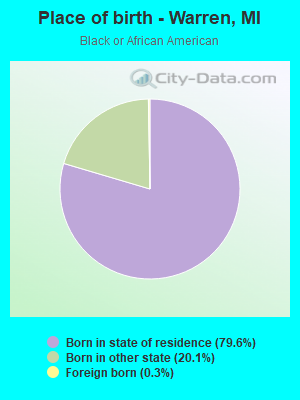
Place of birth - Born in state of residence (%) - Black or African American
Place of birth - Born in state of residence (%) - Asian
Place of birth - Born in state of residence (%) - Hispanic or Latino
Place of birth - Born in state of residence (%) - American Indian and Alaska Native
Place of birth - Born in state of residence (%) - Multirace
Place of birth - Born in state of residence (%) - Other Race
Place of birth - Born in other state (%)
Place of birth - Born in other state (%) - White
Place of birth - Born in other state (%) - Black or African American
Place of birth - Born in other state (%) - Asian
Place of birth - Born in other state (%) - Hispanic or Latino
Place of birth - Born in other state (%) - American Indian and Alaska Native
Place of birth - Born in other state (%) - Multirace
Place of birth - Born in other state (%) - Other Race
Place of birth - Native, outside of US (%)
Place of birth - Native, outside of US (%) - White
Place of birth - Native, outside of US (%) - Black or African American
Place of birth - Native, outside of US (%) - Asian
Place of birth - Native, outside of US (%) - Hispanic or Latino
Place of birth - Native, outside of US (%) - American Indian and Alaska Native
Place of birth - Native, outside of US (%) - Multirace
Place of birth - Native, outside of US (%) - Other Race
Place of birth - Foreign born (%)
Place of birth - Foreign born (%) - White
Place of birth - Foreign born (%) - Black or African American
Place of birth - Foreign born (%) - Asian
Place of birth - Foreign born (%) - Hispanic or Latino
Place of birth - Foreign born (%) - American Indian and Alaska Native
Place of birth - Foreign born (%) - Multirace
Place of birth - Foreign born (%) - Other Race
Residents speaking English at home (%)
Residents speaking English at home - Born in the United States (%)
Residents speaking English at home - Native, born elsewhere (%)
Residents speaking English at home - Foreign born (%)
Residents speaking Spanish at home (%)
Residents speaking Spanish at home - Born in the United States (%)
Residents speaking Spanish at home - Native, born elsewhere (%)
Residents speaking Spanish at home - Foreign born (%)
Residents speaking other language at home (%)
Residents speaking other language at home - Born in the United States (%)
Residents speaking other language at home - Native, born elsewhere (%)
Residents speaking other language at home - Foreign born (%)
Marital status - Never married (%)
Marital status - Now married (%)
Marital status - Separated (%)
Marital status - Widowed (%)
Marital status - Divorced (%)
Ancestries Reported - Arab (%)
Ancestries Reported - Czech (%)
Ancestries Reported - Danish (%)
Ancestries Reported - Dutch (%)
Ancestries Reported - English (%)
Ancestries Reported - French (%)
Ancestries Reported - French Canadian (%)
Ancestries Reported - German (%)
Ancestries Reported - Greek (%)
Ancestries Reported - Hungarian (%)
Ancestries Reported - Irish (%)
Ancestries Reported - Italian (%)
Ancestries Reported - Lithuanian (%)
Ancestries Reported - Norwegian (%)
Ancestries Reported - Polish (%)
Ancestries Reported - Portuguese (%)
Ancestries Reported - Russian (%)
Ancestries Reported - Scotch-Irish (%)
Ancestries Reported - Scottish (%)
Ancestries Reported - Slovak (%)
Ancestries Reported - Subsaharan African (%)
Ancestries Reported - Swedish (%)
Ancestries Reported - Swiss (%)
Ancestries Reported - Ukrainian (%)
Ancestries Reported - United States (%)
Ancestries Reported - Welsh (%)
Ancestries Reported - West Indian (%)
Ancestries Reported - Other (%)
Geographical mobility - Same house 1 year ago (%)
Geographical mobility - Same house 1 year ago (%) - White
Geographical mobility - Same house 1 year ago (%) - Black or African American
Geographical mobility - Same house 1 year ago (%) - Asian
Geographical mobility - Same house 1 year ago (%) - Hispanic or Latino
Geographical mobility - Same house 1 year ago (%) - American Indian and Alaska Native
Geographical mobility - Same house 1 year ago (%) - Multirace
Geographical mobility - Same house 1 year ago (%) - Other Race
Geographical mobility - Moved within same county (%)
Geographical mobility - Moved within same county (%) - White
Geographical mobility - Moved within same county (%) - Black or African American
Geographical mobility - Moved within same county (%) - Asian
Geographical mobility - Moved within same county (%) - Hispanic or Latino
Geographical mobility - Moved within same county (%) - American Indian and Alaska Native
Geographical mobility - Moved within same county (%) - Multirace
Geographical mobility - Moved within same county (%) - Other Race
Geographical mobility - Moved from different county within same state (%)
Geographical mobility - Moved from different county within same state (%) - White
Geographical mobility - Moved from different county within same state (%) - Black or African American
Geographical mobility - Moved from different county within same state (%) - Asian
Geographical mobility - Moved from different county within same state (%) - Hispanic or Latino
Geographical mobility - Moved from different county within same state (%) - American Indian and Alaska Native
Geographical mobility - Moved from different county within same state (%) - Multirace
Geographical mobility - Moved from different county within same state (%) - Other Race
Geographical mobility - Moved from different state (%)
Geographical mobility - Moved from different state (%) - White
Geographical mobility - Moved from different state (%) - Black or African American
Geographical mobility - Moved from different state (%) - Asian
Geographical mobility - Moved from different state (%) - Hispanic or Latino
Geographical mobility - Moved from different state (%) - American Indian and Alaska Native
Geographical mobility - Moved from different state (%) - Multirace
Geographical mobility - Moved from different state (%) - Other Race
Geographical mobility - Moved from abroad (%)
Geographical mobility - Moved from abroad (%) - White
Geographical mobility - Moved from abroad (%) - Black or African American
Geographical mobility - Moved from abroad (%) - Asian
Geographical mobility - Moved from abroad (%) - Hispanic or Latino
Geographical mobility - Moved from abroad (%) - American Indian and Alaska Native
Geographical mobility - Moved from abroad (%) - Multirace
Geographical mobility - Moved from abroad (%) - Other Race
Place of birth for the foreign-born population - Ireland (%)
Place of birth for the foreign-born population - Denmark (%)
Place of birth for the foreign-born population - Norway (%)
Place of birth for the foreign-born population - Sweden (%)
Place of birth for the foreign-born population - United Kingdom (%)
Place of birth for the foreign-born population - England (%)
Place of birth for the foreign-born population - Scotland (%)
Place of birth for the foreign-born population - Other Northern Europe (%)
Place of birth for the foreign-born population - Austria (%)
Place of birth for the foreign-born population - Belgium (%)
Place of birth for the foreign-born population - France (%)
Place of birth for the foreign-born population - Germany (%)
Place of birth for the foreign-born population - Netherlands (%)
Place of birth for the foreign-born population - Switzerland (%)
Place of birth for the foreign-born population - Other Western Europe (%)
Place of birth for the foreign-born population - Greece (%)
Place of birth for the foreign-born population - Italy (%)
Place of birth for the foreign-born population - Portugal (%)
Place of birth for the foreign-born population - Spain (%)
Place of birth for the foreign-born population - Other Southern Europe (%)
Place of birth for the foreign-born population - Albania (%)
Place of birth for the foreign-born population - Belarus (%)
Place of birth for the foreign-born population - Bosnia and Herzegovina (%)
Place of birth for the foreign-born population - Bulgaria (%)
Place of birth for the foreign-born population - Croatia (%)
Place of birth for the foreign-born population - Czechoslovakia (%)
Place of birth for the foreign-born population - Hungary (%)
Place of birth for the foreign-born population - Latvia (%)
Place of birth for the foreign-born population - Lithuania (%)
Place of birth for the foreign-born population - North Macedonia (Macedonia) (%)
Place of birth for the foreign-born population - Moldova (%)
Place of birth for the foreign-born population - Poland (%)
Place of birth for the foreign-born population - Romania (%)
Place of birth for the foreign-born population - Russia (%)
Place of birth for the foreign-born population - Serbia (%)
Place of birth for the foreign-born population - Ukraine (%)
Place of birth for the foreign-born population - Other Eastern Europe (%)
Place of birth for the foreign-born population - China (%)
Place of birth for the foreign-born population - Hong Kong (%)
Place of birth for the foreign-born population - Taiwan (%)
Place of birth for the foreign-born population - Japan (%)
Place of birth for the foreign-born population - Korea (%)
Place of birth for the foreign-born population - Other Eastern Asia (%)
Place of birth for the foreign-born population - Afghanistan (%)
Place of birth for the foreign-born population - Bangladesh (%)
Place of birth for the foreign-born population - India (%)
Place of birth for the foreign-born population - Iran (%)
Place of birth for the foreign-born population - Kazakhstan (%)
Place of birth for the foreign-born population - Nepal (%)
Place of birth for the foreign-born population - Pakistan (%)
Place of birth for the foreign-born population - Sri Lanka (%)
Place of birth for the foreign-born population - Uzbekistan (%)
Place of birth for the foreign-born population - Other South Central Asia (%)
Place of birth for the foreign-born population - Burma (%)
Place of birth for the foreign-born population - Cambodia (%)
Place of birth for the foreign-born population - Indonesia (%)
Place of birth for the foreign-born population - Laos (%)
Place of birth for the foreign-born population - Malaysia (%)
Place of birth for the foreign-born population - Philippines (%)
Place of birth for the foreign-born population - Singapore (%)
Place of birth for the foreign-born population - Thailand (%)
Place of birth for the foreign-born population - Vietnam (%)
Place of birth for the foreign-born population - Other South Eastern Asia (%)
Place of birth for the foreign-born population - Armenia (%)
Place of birth for the foreign-born population - Iraq (%)
Place of birth for the foreign-born population - Israel (%)
Place of birth for the foreign-born population - Jordan (%)
Place of birth for the foreign-born population - Kuwait (%)
Place of birth for the foreign-born population - Lebanon (%)
Place of birth for the foreign-born population - Saudi Arabia (%)
Place of birth for the foreign-born population - Syria (%)
Place of birth for the foreign-born population - Turkey (%)
Place of birth for the foreign-born population - Yemen (%)
Place of birth for the foreign-born population - Other Western Asia (%)
Place of birth for the foreign-born population - Eritrea (%)
Place of birth for the foreign-born population - Ethiopia (%)
Place of birth for the foreign-born population - Kenya (%)
Place of birth for the foreign-born population - Somalia (%)
Place of birth for the foreign-born population - Uganda (%)
Place of birth for the foreign-born population - Zimbabwe (%)
Place of birth for the foreign-born population - Other Eastern Africa (%)
Place of birth for the foreign-born population - Cameroon (%)
Place of birth for the foreign-born population - Congo (%)
Place of birth for the foreign-born population - Democratic Republic of Congo (Zaire) (%)
Place of birth for the foreign-born population - Other Middle Africa (%)
Place of birth for the foreign-born population - Egypt (%)
Place of birth for the foreign-born population - Morocco (%)
Place of birth for the foreign-born population - Sudan (%)
Place of birth for the foreign-born population - Other Northern Africa (%)
Place of birth for the foreign-born population - South Africa (%)
Place of birth for the foreign-born population - Other Southern Africa (%)
Place of birth for the foreign-born population - Cabo Verde (%)
Place of birth for the foreign-born population - Ghana (%)
Place of birth for the foreign-born population - Liberia (%)
Place of birth for the foreign-born population - Nigeria (%)
Place of birth for the foreign-born population - Senegal (%)
Place of birth for the foreign-born population - Sierra Leone (%)
Place of birth for the foreign-born population - Other Western Africa (%)
Place of birth for the foreign-born population - Australia (%)
Place of birth for the foreign-born population - New Zealand (%)
Place of birth for the foreign-born population - Fiji (%)
Place of birth for the foreign-born population - Micronesia (%)
Place of birth for the foreign-born population - Bahamas (%)
Place of birth for the foreign-born population - Barbados (%)
Place of birth for the foreign-born population - Cuba (%)
Place of birth for the foreign-born population - Dominica (%)
Place of birth for the foreign-born population - Dominican Republic (%)
Place of birth for the foreign-born population - Grenada (%)
Place of birth for the foreign-born population - Haiti (%)
Place of birth for the foreign-born population - Jamaica (%)
Place of birth for the foreign-born population - St. Vincent and the Grenadines (%)
Place of birth for the foreign-born population - Trinidad and Tobago (%)
Place of birth for the foreign-born population - West Indies (%)
Place of birth for the foreign-born population - Other Caribbean (%)
Place of birth for the foreign-born population - Belize (%)
Place of birth for the foreign-born population - Costa Rica (%)
Place of birth for the foreign-born population - El Salvador (%)
Place of birth for the foreign-born population - Guatemala (%)
Place of birth for the foreign-born population - Honduras (%)
Place of birth for the foreign-born population - Mexico (%)
Place of birth for the foreign-born population - Nicaragua (%)
Place of birth for the foreign-born population - Panama (%)
Place of birth for the foreign-born population - Other Central America (%)
Place of birth for the foreign-born population - Argentina (%)
Place of birth for the foreign-born population - Bolivia (%)
Place of birth for the foreign-born population - Brazil (%)
Place of birth for the foreign-born population - Chile (%)
Place of birth for the foreign-born population - Colombia (%)
Place of birth for the foreign-born population - Ecuador (%)
Place of birth for the foreign-born population - Guyana (%)
Place of birth for the foreign-born population - Peru (%)
Place of birth for the foreign-born population - Uruguay (%)
Place of birth for the foreign-born population - Venezuela (%)
Place of birth for the foreign-born population - Other South America (%)
Place of birth for the foreign-born population - Canada (%)
Place of birth for the foreign-born population - Other Northern America (%)
Place of birth for the foreign-born population - Other (%)
Latest news about races in Warren, MI collected exclusively by city-data.com from local newspapers, TV, and radio stations
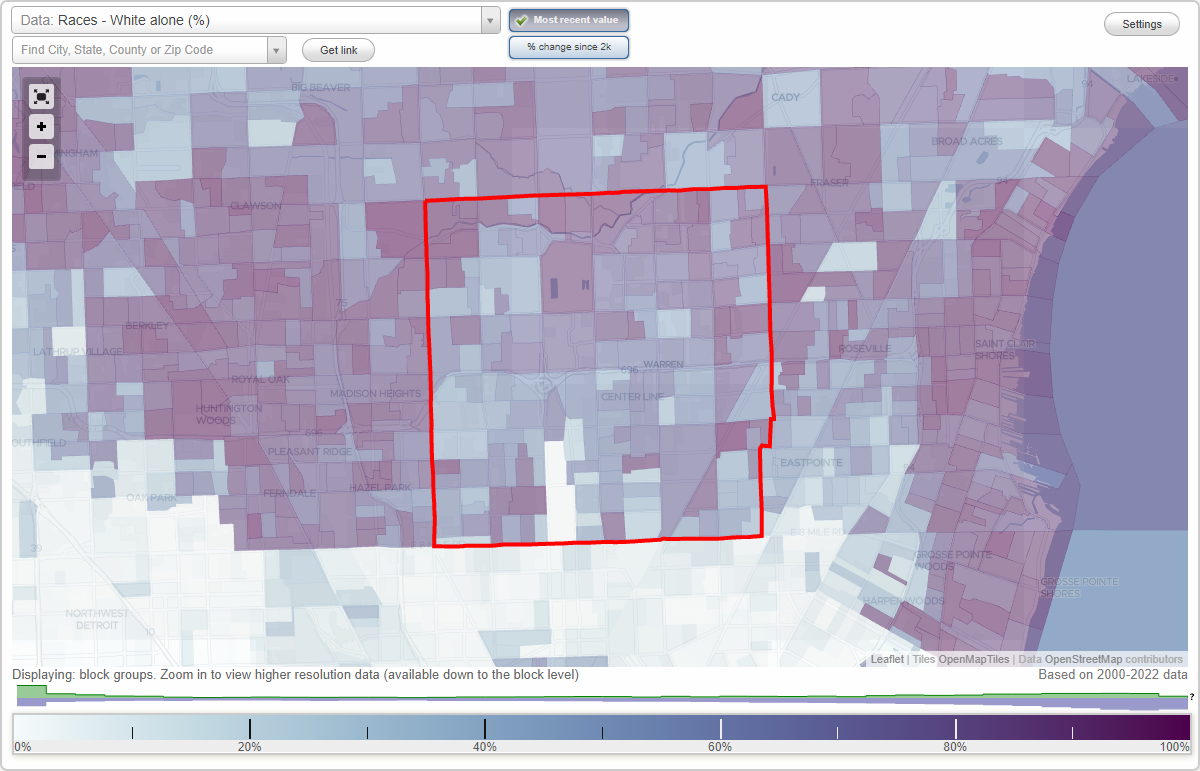
According to 2022 data, the most numerous races in Warren, MI are White alone (84,466 residents), Black alone (26,393 residents), and Hispanic (3,657 residents). 81.7% of Warren residents speak English at home. 12.9% of Warren, MI residents are foreign-born (9.6% born in Asia, 2.3% born in Europe), which is 53.4% greater than the foreign-born rate of 6.0% across the entire state of Michigan.
Race distribution in Warren
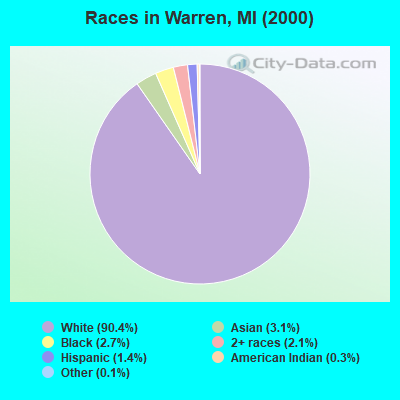
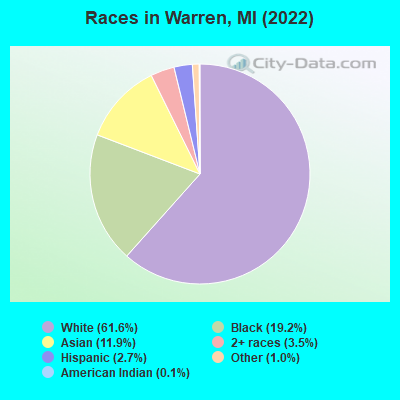
2000 2022
124,936 90.4% White alone 4,240 3.1% Asian alone 3,676 2.7% Black alone 2,865 2.1% Two or more races 1,868 1.4% Hispanic 466 0.3% American Indian alone 168 0.1% Other race alone 28 0.02% Native Hawaiian and Other
84,466 61.6% White alone 26,393 19.2% Black alone 16,267 11.9% Asian alone 4,823 3.5% Two or more races 3,657 2.7% Hispanic 1,367 1.0% Other race alone 138 0.1% American Indian alone
2000 2022
7,806,691 78.6% White alone 1,402,047 14.1% Black alone 323,877 3.3% Hispanic 175,311 1.8% Asian alone 163,487 1.6% Two or more races 53,421 0.5% American Indian alone 11,465 0.1% Other race alone 2,145 0.02% Native Hawaiian and Other
7,289,051 72.6% White alone 1,310,464 13.1% Black alone 572,405 5.7% Hispanic 450,031 4.5% Two or more races 335,732 3.3% Asian alone 45,217 0.5% Other race alone 29,011 0.3% American Indian alone 2,207 0.02% Native Hawaiian and Other
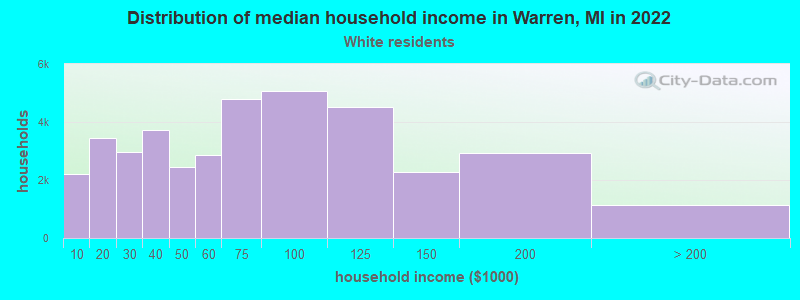
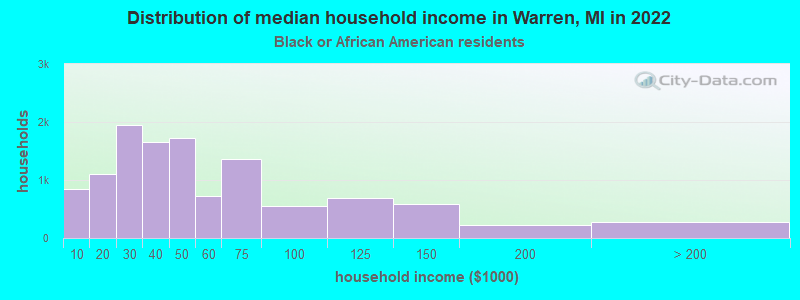
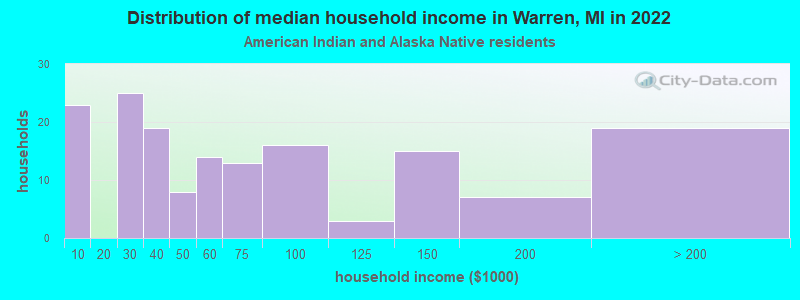
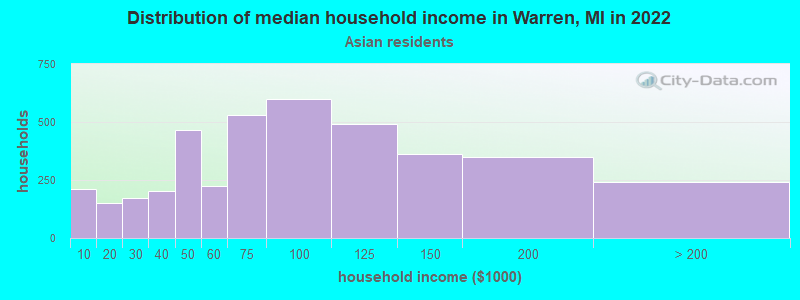
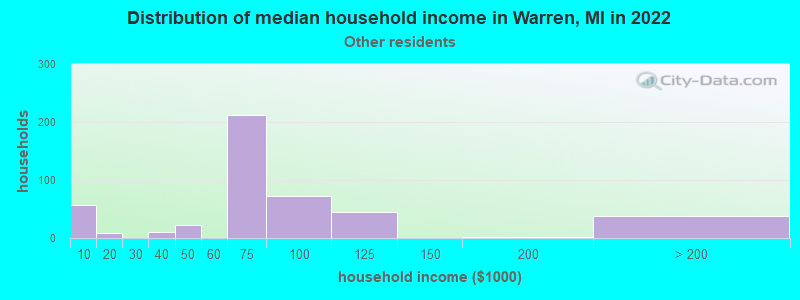
Income and house value in Warren Median household income in 2022 $63,725 White non-Hispanic householders$40,789 Black householders$53,675 American Indian and Alaska Native householders$76,736 Asian householders$68,682 Some other race householders$61,260 Two or more races householders$95,689 Hispanic or Latino race householdersMedian 2022 house value $194,883 White Non-Hispanic householders$189,243 Black or African American householders$140,979 American Indian or Alaska Native householders $223,742 Asian householders$186,590 Native Hawaiian and other Pacific Islander householders$253,264 Some other race householders$209,810 Two or more races householders$211,634 Hispanic or Latino householders
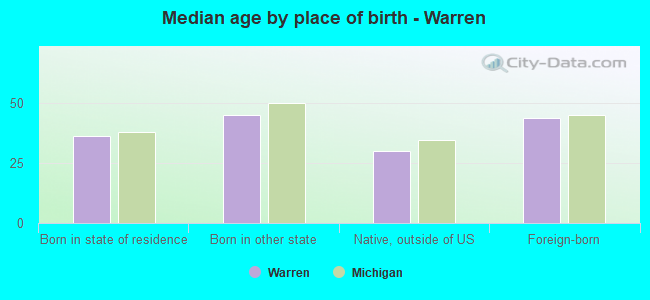
Median age by race in Warren
44.9 Median age for White residents41.6 48.2 30.8 Median age for Black or African American residents28.1 34.9 28.0 Median age for American Indian / Alaska Native residents-666,666,666.0 45.5 29.2 Median age for Asian residents28.0 29.7 -666,666,666.0 Median age for Native Hawaiian / Pacific Islander residents-666,666,666.0 -666,666,666.0 32.4 Median age for Other race residents11.7 32.8 30.8 Median age for Two or more races residents31.7 21.6 46.0 Median age for White alone residents41.8 48.9 28.5 Median age for Hispanic or Latino residents37.6 22.4
Owner/renter occupied households by race in Warren
House owners and renters - White residents 29,431 76.7% Owner occupied8,949 23.3% Renter occupiedHouse owners and renters - Black or African American residents 3,339 28.6% Owner occupied8,331 71.4% Renter occupiedHouse owners and renters - American Indian / Alaska Native residents 125 72.7% Owner occupied47 27.3% Renter occupiedHouse owners and renters - Asian residents 3,822 84.5% Owner occupied701 15.5% Renter occupiedHouse owners and renters - Native Hawaiian / Pacific Islander residents 7 100.0% Owner occupiedHouse owners and renters - Other race residents 471 95.9% Owner occupied20 4.1% Renter occupiedHouse owners and renters - Two or more races residents 1,420 62.5% Owner occupied852 37.5% Renter occupiedHouse owners and renters - White alone residents 29,179 76.8% Owner occupied8,794 23.2% Renter occupiedHouse owners and renters - Hispanic or Latino residents 530 63.3% Owner occupied307 36.7% Renter occupied
Language usage in Warren
English speakers - Total 81.7% of residents of Warren speak English at home.
0.3% of residents speak Spanish at home 299 79.7% Speak English very well76 20.3% Speak English less than very well18.0% of residents speak other language at home 12,431 53.3% Speak English very well10,900 46.7% Speak English less than very well
English speakers - Born in the United States 94.9% of residents of Warren speak English at home.
0.6% of residents speak Spanish at home 97 100.0% Speak English very well4.5% of residents speak other language at home 715 100.0% Speak English very well
English speakers - Native, born elsewhere 73.4% of residents of Warren speak English at home.
26.6% of residents speak other language at home 360 69.8% Speak English very well156 30.2% Speak English less than very well
English speakers - Foreign-born 9.0% of residents of Warren speak English at home.
0.8% of residents speak Spanish at home 79 51.0% Speak English very well76 49.0% Speak English less than very well90.2% of residents speak other language at home 7,380 42.4% Speak English very well10,006 57.6% Speak English less than very well
White (Caucasian) - Speak only English Native:
97.1% (71,668)Foreign-born:
15.5% (1,277)
White (Caucasian) - Speak another language Native:
2.9% (2,162)Foreign-born:
84.5% (6,974)
Black or African American - Speak only English Native:
98.8% (24,827)Foreign-born:
40.7% (152)
Black or African American - Speak another language Native:
1.1% (286)Foreign-born:
59.5% (221)
American Indian / Alaska Native - Speak another language Native:
17.9% (71)Foreign-born:
100.0% (5)
Asian - Speak only English Native:
38.6% (2,301)Foreign-born:
4.8% (460)
Asian - Speak another language Native:
61.4% (3,662)Foreign-born:
95.2% (9,078)
Other race - Speak only English Native:
86.7% (943)Foreign-born:
16.3% (87)
Other race - Speak another language Native:
15.9% (173)Foreign-born:
84.3% (452)
Two or more races - Speak only English Native:
90.1% (6,194)Foreign-born:
10.3% (24)
Two or more races - Speak another language Native:
10.2% (701)Foreign-born:
90.1% (208)
White alone - Speak only English Native:
97.0% (70,471)Foreign-born:
15.5% (1,277)
White alone - Speak another language Native:
3.0% (2,162)Foreign-born:
84.5% (6,974)
Hispanic or Latino - Speak only English Native:
94.5% (2,779)Foreign-born:
4.3% (7)
Hispanic or Latino - Speak another language Native:
5.5% (161)Foreign-born:
95.7% (155)
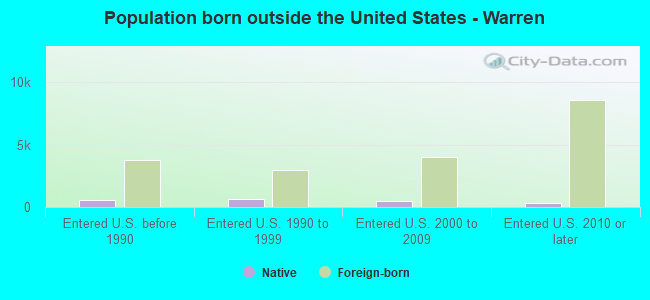
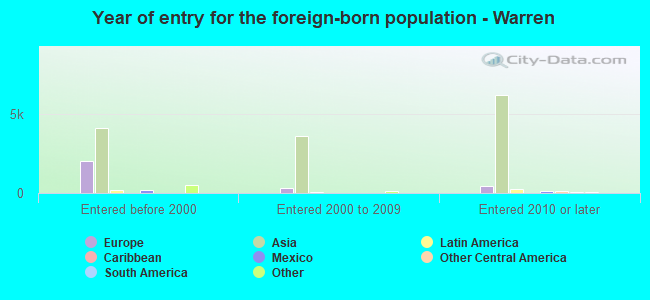
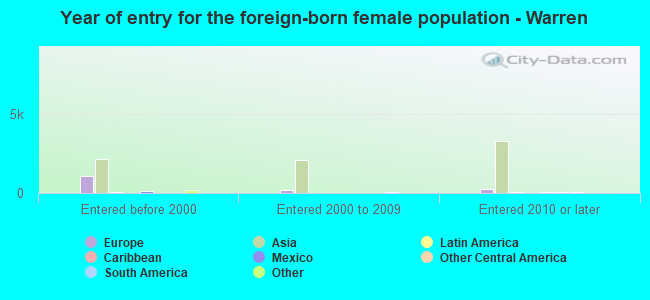
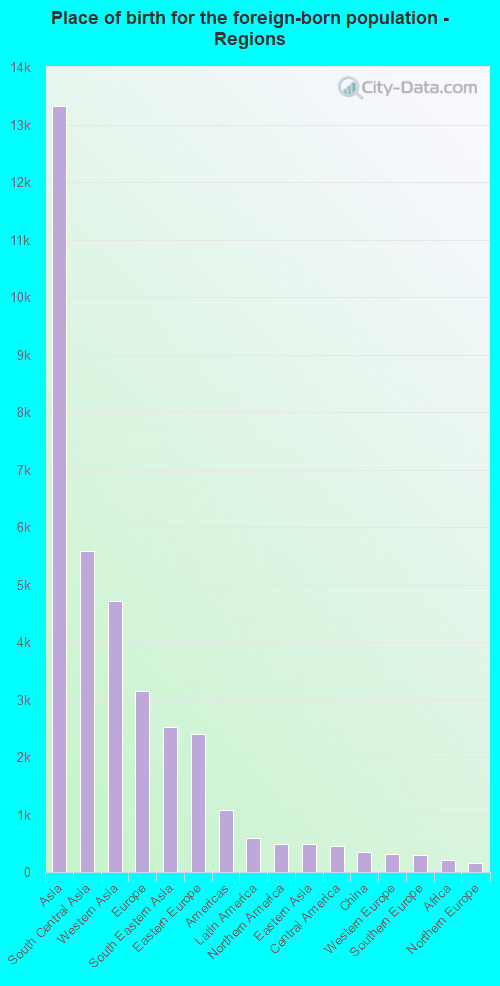
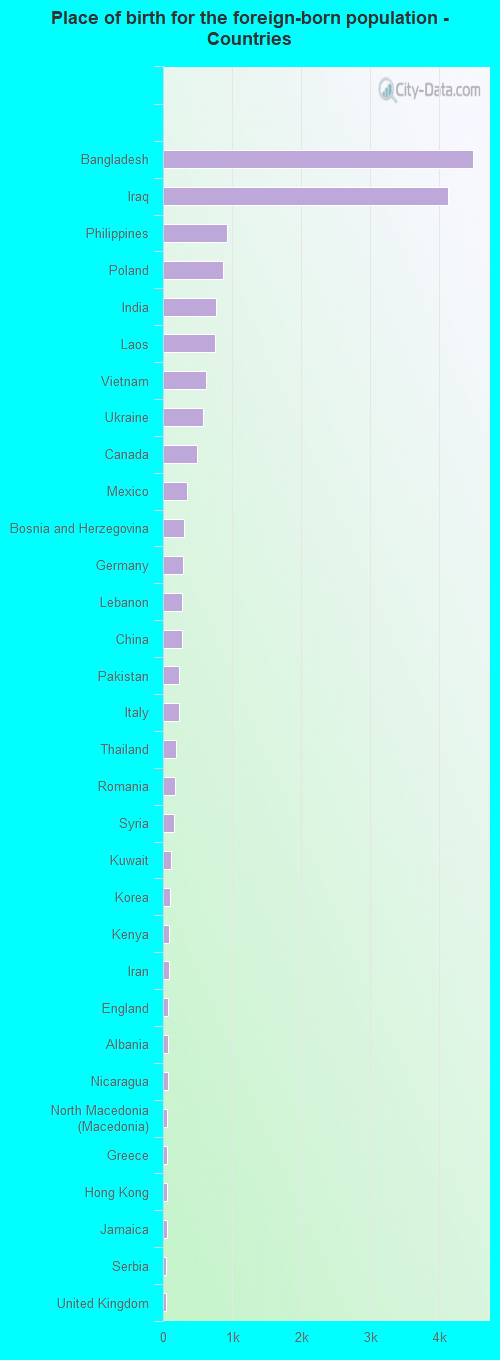
Foreign-born residents in Warren 17,749 residents are foreign born (9.6% Asia , 2.3% Europe ).
This city:
12.9%Michigan:
6.9%
Marital status for residents in Warren Marital status - White (Caucasian) population 15 years and over
Males 40.8% Never married39.9% Now married1.7% Separated5.6% Widowed11.9% DivorcedFemales 30.7% Never married40.7% Now married0.8% Separated13.7% Widowed14.1% DivorcedWomen who gave birth in the past 12 months Now married:
79.9% (758)Unmarried:
20.1% (191)
Women who did not give birth in the past 12 months Now married:
35.8% (5,956)Unmarried:
64.2% (10,679)
Marital status - Black or African American population 15 years and over
Males 47.2% Never married32.7% Now married7.6% Separated0.7% Widowed11.7% DivorcedFemales 57.1% Never married15.2% Now married9.2% Separated5.0% Widowed13.6% DivorcedWomen who gave birth in the past 12 months Now married:
67.7% (247)Unmarried:
32.3% (118)
Women who did not give birth in the past 12 months Now married:
27.1% (1,840)Unmarried:
72.9% (4,956)
Marital status - American Indian / Alaska Native population 15 years and over
Males 43.0% Never married37.1% Now married0.0% Separated7.0% Widowed12.9% DivorcedFemales 13.1% Never married84.7% Now married0.0% Separated2.2% Widowed0.0% DivorcedWomen who gave birth in the past 12 months Now married:
70.7% (30)Unmarried:
29.3% (12)
Women who did not give birth in the past 12 months Now married:
92.0% (71)Unmarried:
8.0% (6)
Marital status - Asian population 15 years and over
Males 40.8% Never married55.8% Now married0.0% Separated2.5% Widowed0.9% DivorcedFemales 25.1% Never married62.5% Now married0.9% Separated4.1% Widowed7.4% DivorcedWomen who gave birth in the past 12 months Now married:
100.0% (372)Unmarried:
0.0% (0)
Women who did not give birth in the past 12 months Now married:
64.9% (2,859)Unmarried:
35.1% (1,546)
Marital status - Other race population 15 years and over
Males 48.4% Never married33.7% Now married0.0% Separated0.0% Widowed17.9% DivorcedFemales 32.4% Never married52.1% Now married0.0% Separated2.7% Widowed12.8% DivorcedWomen who did not give birth in the past 12 months Now married:
54.9% (263)Unmarried:
45.1% (216)
Marital status - Two or more races population 15 years and over
Males 44.6% Never married46.8% Now married4.4% Separated2.3% Widowed1.9% DivorcedFemales 34.9% Never married32.2% Now married1.8% Separated7.0% Widowed24.0% DivorcedWomen who gave birth in the past 12 months Now married:
39.3% (70)Unmarried:
60.7% (108)
Women who did not give birth in the past 12 months Now married:
36.5% (609)Unmarried:
63.5% (1,060)
Marital status - White alone, not Hispanic / Latino population 15 years and over
Males 40.9% Never married39.6% Now married1.7% Separated5.7% Widowed12.0% DivorcedFemales 30.3% Never married40.7% Now married0.6% Separated14.0% Widowed14.3% DivorcedWomen who gave birth in the past 12 months Now married:
75.6% (593)Unmarried:
24.4% (191)
Women who did not give birth in the past 12 months Now married:
36.0% (5,801)Unmarried:
64.0% (10,303)
Marital status - Hispanic or Latino population 15 years and over
Males 47.7% Never married42.5% Now married0.0% Separated0.1% Widowed9.7% DivorcedFemales 32.1% Never married48.0% Now married3.4% Separated5.1% Widowed11.4% DivorcedWomen who gave birth in the past 12 months Now married:
100.0% (42)Unmarried:
0.0% (0)
Women who did not give birth in the past 12 months Now married:
53.8% (425)Unmarried:
46.2% (364)
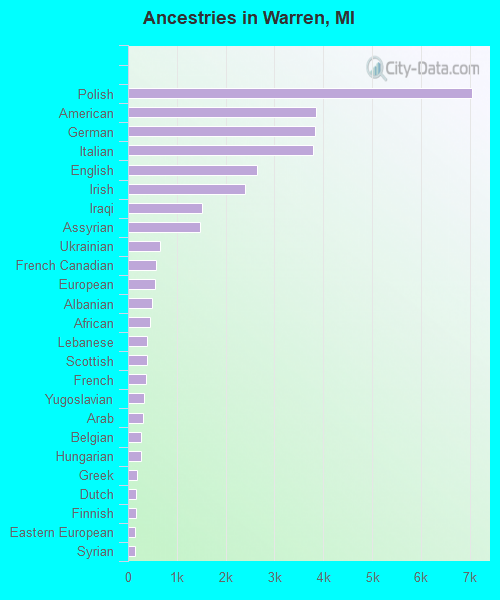
Ancestries in Warren
7,044 10.3% Polish3,844 5.6% American3,839 5.6% German3,800 5.5% Italian2,634 3.8% English2,406 3.5% Irish1,522 2.2% Iraqi1,478 2.2% Assyrian657 1.0% Ukrainian577 0.8% French Canadian549 0.8% European485 0.7% Albanian454 0.7% African396 0.6% Lebanese396 0.6% Scottish360 0.5% French333 0.5% Yugoslavian310 0.5% Arab271 0.4% Belgian260 0.4% Hungarian188 0.3% Greek158 0.2% Dutch155 0.2% Finnish153 0.2% Eastern European151 0.2% Syrian144 0.2% Armenian140 0.2% Romanian126 0.2% Scotch-Irish126 0.2% Croatian109 0.2% Nigerian104 0.2% Iranian100 0.1% British100 0.1% Canadian95 0.1% Kenyan79 0.1% Norwegian72 0.1% Macedonian71 0.1% Czech64 0.09% Danish62 0.09% Scandinavian61 0.09% Slovak57 0.08% Serbian49 0.07% Lithuanian48 0.07% Jordanian48 0.07% Maltese47 0.07% Slovene47 0.07% Swedish47 0.07% Jamaican41 0.06% Russian41 0.06% Welsh37 0.05% Northern European37 0.05% Pennsylvania German27 0.04% Moroccan23 0.03% Austrian22 0.03% Palestinian21 0.03% Portuguese17 0.02% Turkish15 0.02% Czechoslovakian10 0.01% Guyanese6 0.01% Egyptian
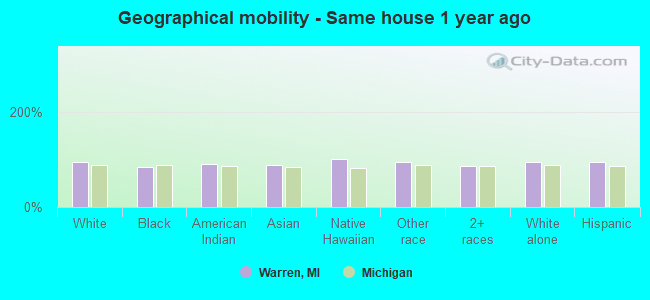
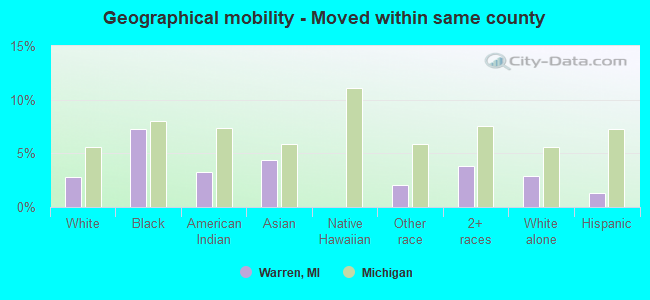
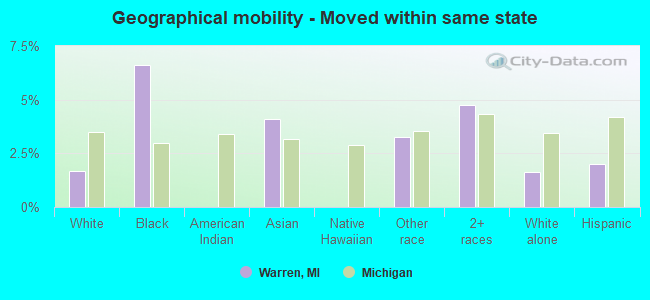
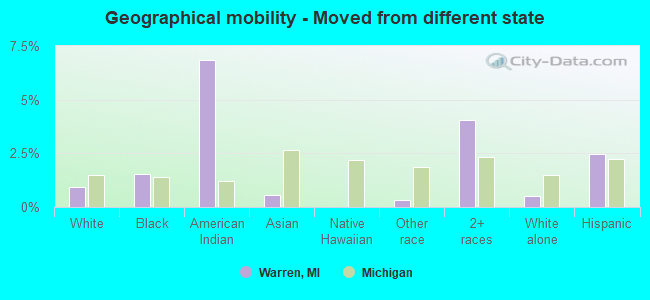
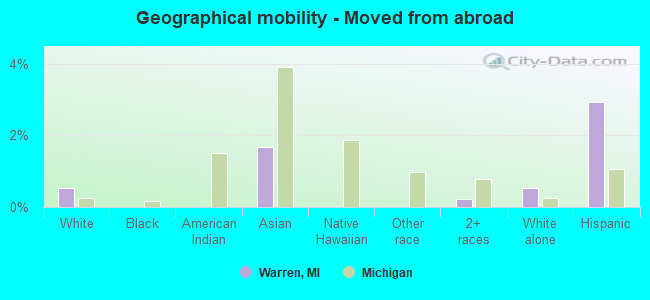
Geographical mobility in Warren Same house 1 year ago 79,928 94.1% White (Caucasian)23,143 84.5% Black or African American398 90.7% American Indian / Alaska Native13,803 87.6% Asian13 100.0% Native Hawaiian / Pacific Islander1,249 94.6% Other race6,713 85.0% Two or more races79,127 94.5% White alone, not Hispanic / Latino3,308 95.1% Hispanic or LatinoMoved within same county 2,381 2.8% White / Caucasian1,979 7.2% Black or African American14 3.3% American Indian / Alaska Native694 4.4% Asian28 2.1% Other race299 3.8% Two or more races2,381 2.8% White alone, not Hispanic / Latino44 1.3% Hispanic or LatinoMoved within same state 1,421 1.7% White / Caucasian1,807 6.6% Black or African American646 4.1% Asian43 3.3% Other race375 4.7% Two or more races1,378 1.6% White alone, not Hispanic / Latino69 2.0% Hispanic or LatinoMoved from different state 773 0.9% White / Caucasian416 1.5% Black or African American30 6.9% American Indian / Alaska Native85 0.5% Asian4 0.3% Other race320 4.1% Two or more races420 0.5% White alone, not Hispanic / Latino86 2.5% Hispanic or LatinoMoved from abroad 442 0.5% White1 0.0% Black or African American266 1.7% Asian18 0.2% Two or more races442 0.5% White alone, not Hispanic / Latino102 2.9% Hispanic or Latino
Children Nativity (place of birth) in Warren
Children under 6 years - Living with two parents Both parents native 3,455 100.0% NativeBoth parents foreign-born 1,362 100.0% NativeOne native, one foreign-born parent 583 100.0% NativeChildren under 6 years - Living with one parent Native parent 3,849 100.0% NativeForeign-born parent 62 100.0% Foreign-bornChildren 6 to 17 years - Living with two parents Both parents native 7,069 100.0% NativeBoth parents foreign-born 2,495 73.6% Native893 26.4% Foreign-bornOne native, one foreign-born parent 1,028 100.0% NativeChildren 6 to 17 years - Living with one parent Native parent 5,713 100.0% NativeForeign-born parent 558 50.0% Native558 50.0% Foreign-born
Grandparents responsible for own grandchildren in Warren
Grandparents (30 to 59 years) White / Caucasian 313 60.5% Responsible for grandchildren204 39.5% Not responsible for grandchildrenBlack or African American 32 11.6% Responsible for grandchildren246 88.4% Not responsible for grandchildrenAsian 6 2.3% Responsible for grandchildren257 97.7% Not responsible for grandchildrenTwo or more races 7 100.0% Responsible for grandchildrenWhite alone, not Hispanic / Latino 313 60.2% Responsible for grandchildren207 39.8% Not responsible for grandchildrenHispanic or Latino 15 100.0% Not responsible for grandchildrenGrandparents (60 years and over) White / Caucasian 311 26.3% Responsible for grandchildren871 73.7% Not responsible for grandchildrenBlack or African American 132 32.3% Responsible for grandchildren276 67.7% Not responsible for grandchildrenAsian 36 11.9% Responsible for grandchildren270 88.1% Not responsible for grandchildrenTwo or more races 8 100.0% Not responsible for grandchildrenWhite alone, not Hispanic / Latino 311 26.1% Responsible for grandchildren882 73.9% Not responsible for grandchildrenHispanic or Latino 7 100.0% Not responsible for grandchildren