Estimated zip code population in 2022: 27,782 Zip code population in 2010: 25,680 Zip code population in 2000: 25,345
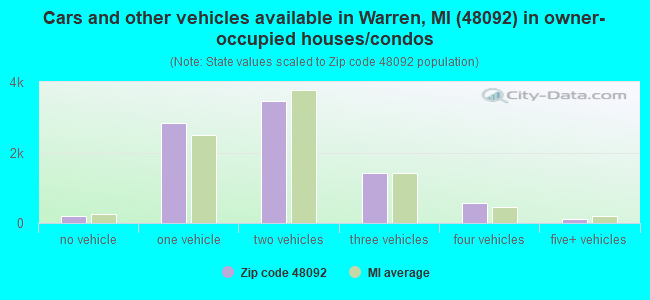
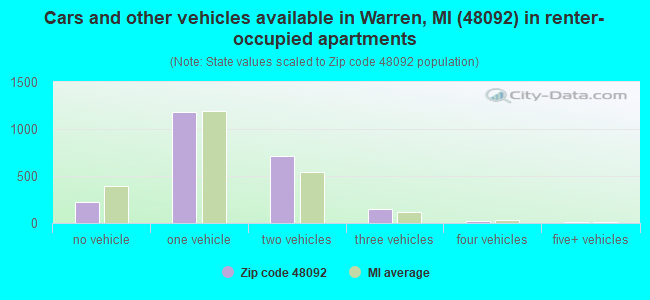
Houses and condos: 11,106 Renter-occupied apartments: 2,300
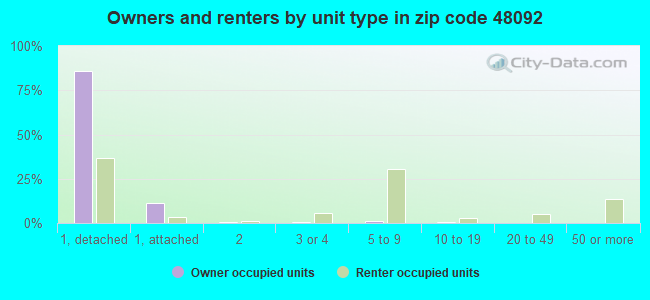
% of renters here:
21%
State:
27%
March 2022 cost of living index in zip code 48092: 96.3 (near average, U.S. average is 100)
Land area: 8.2 sq. mi. Water area: 0.0 sq. mi.
Population density: 3,392 people per square mile
(average).
OSM Map
General Map
Google Map
MSN Map
OSM Map
General Map
Google Map
MSN Map
OSM Map
General Map
Google Map
MSN Map
OSM Map
General Map
Google Map
MSN Map
Please wait while loading the map...
Real estate property taxes paid for housing units in 2022:
This zip code:
1.6% ($3,359)
Michigan:
1.2% ($2,746)
Median real estate property taxes paid for housing units with mortgages in 2022: $3,509 (1.7%) Median real estate property taxes paid for housing units with no mortgage in 2022: $3,163 (1.4%)
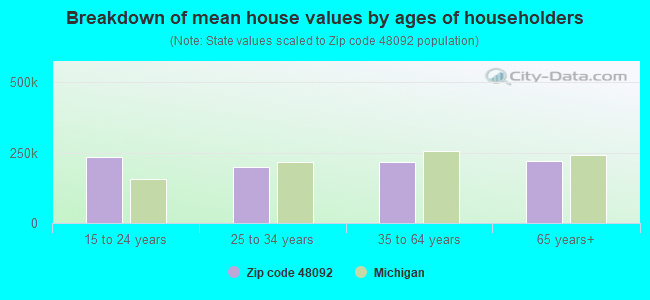
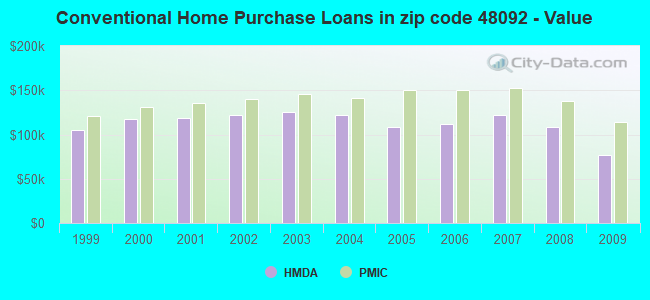
Estimated median house/condo value in 2022: $215,250
48092:
$215,250
Michigan:
$224,400
According to our research of Michigan and other state lists, there were 47 registered sex offenders living in 48092 zip code as of May 07, 2024. The ratio of all residents to sex offenders in zip code 48092 is 582 to 1. The ratio of registered sex offenders to all residents in this zip code is lower than the state average.
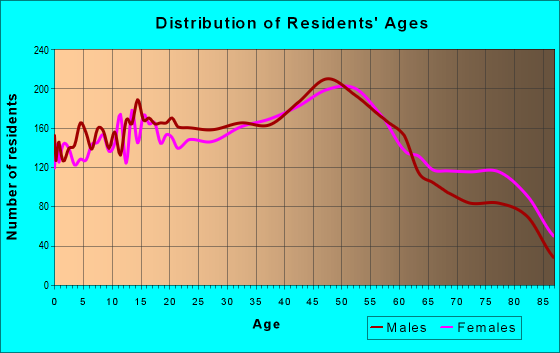
Median resident age:
This zip code:
41.5 years
Michigan median age:
40.3 years
Average household size:
This zip code:
2.5 people
Michigan:
2.4 people
Averages for the 2020 tax year for zip code 48092, filed in 2021:
Average Adjusted Gross Income (AGI) in 2020: $49,745 (Individual Income Tax Returns)
Here:
$49,745
State:
$68,945
Salary/wage: $46,483 (reported on 75.2% of returns)
Here:
$46,483
State:
$57,142
(% of AGI for various income ranges: 1004.9% for AGIs below $25k, 3279.1% for AGIs $25k-50k, 6304.5% for AGIs $50k-75k, 9124.9% for AGIs $75k-100k, 16543.5% for AGIs $100k-200k, 58070.0% for AGIs over 200k)
Taxable interest for individuals: $1,083 (reported on 26.2% of returns)
This zip code:
$1,083
Michigan:
$1,630
(% of AGI for various income ranges: 19.2% for AGIs below $25k, 22.9% for AGIs $25k-50k, 42.4% for AGIs $50k-75k, 64.0% for AGIs $75k-100k, 139.6% for AGIs $100k-200k, 343.3% for AGIs over 200k)
Ordinary dividends: $3,201 (reported on 15.5% of returns)
Here:
$3,201
State:
$6,972
(% of AGI for various income ranges: 22.3% for AGIs below $25k, 29.8% for AGIs $25k-50k, 77.7% for AGIs $50k-75k, 104.9% for AGIs $75k-100k, 211.4% for AGIs $100k-200k, 2276.7% for AGIs over 200k)
Net capital gain/loss in AGI: +$4,836 (reported on 14.9% of returns)
Here:
+$4,836
State:
+$20,064
(% of AGI for various income ranges: 7.2% for AGIs below $25k, 33.8% for AGIs $25k-50k, 71.7% for AGIs $50k-75k, 150.4% for AGIs $75k-100k, 423.2% for AGIs $100k-200k, 4468.3% for AGIs over 200k)
Profit/loss from business: +$7,227 (reported on 17.9% of returns)
Here:
+$7,227
State:
+$11,172
(% of AGI for various income ranges: 156.9% for AGIs below $25k, 202.4% for AGIs $25k-50k, 158.5% for AGIs $50k-75k, 170.1% for AGIs $75k-100k, 244.1% for AGIs $100k-200k, 2111.7% for AGIs over 200k)
Taxable individual retirement arrangement distribution: $14,944 (reported on 8.6% of returns)
48092:
$14,944
Michigan:
$19,803
(% of AGI for various income ranges: 59.0% for AGIs below $25k, 96.0% for AGIs $25k-50k, 203.2% for AGIs $50k-75k, 322.5% for AGIs $75k-100k, 538.9% for AGIs $100k-200k, 4091.7% for AGIs over 200k)
Total itemized deductions: $25,216 (reported on 5.2% of returns)
Here:
$25,216
State:
$34,117
(% of AGI for various income ranges: 36.0% for AGIs below $25k, 88.6% for AGIs $25k-50k, 238.8% for AGIs $50k-75k, 352.0% for AGIs $75k-100k, 638.0% for AGIs $100k-200k, 3545.0% for AGIs over 200k)
Charity contributions: $7,642 (reported on 4.1% of returns)
Here:
$7,642
State:
$13,548
(% of AGI for various income ranges: 3.4% for AGIs below $25k, 16.1% for AGIs $25k-50k, 52.4% for AGIs $50k-75k, 77.2% for AGIs $75k-100k, 163.3% for AGIs $100k-200k, 1451.7% for AGIs over 200k)
Taxes paid: $7,220 (reported on 5.2% of returns)
48092:
$7,220
State:
$7,972
(% of AGI for various income ranges: 6.7% for AGIs below $25k, 21.2% for AGIs $25k-50k, 71.3% for AGIs $50k-75k, 126.2% for AGIs $75k-100k, 197.1% for AGIs $100k-200k, 688.3% for AGIs over 200k)
Earned income credit: $2,295 (reported on 16.0% of returns)
Here:
$2,295
State:
$2,251
(% of AGI for various income ranges: 86.6% for AGIs below $25k, 85.1% for AGIs $25k-50k, 1.8% for AGIs $50k-75k)
Percentage of individuals using paid preparers for their 2020 taxes: 91.7%
Here:
92%
State:
93%
(% for various income ranges: 91.4% for AGIs below $25k, 92.1% for AGIs $25k-50k, 92.4% for AGIs $50k-75k, 91.4% for AGIs $75k-100k, 91.6% for AGIs $100k-200k, 89.5% for AGIs over 200k)
Averages for the 2012 tax year for zip code 48092, filed in 2013:
Average Adjusted Gross Income (AGI) in 2012: $43,220 (Individual Income Tax Returns)
Here:
$43,220
State:
$55,609
Salary/wage: $40,771 (reported on 78.3% of returns)
Here:
$40,771
State:
$46,782
(% of AGI for various income ranges: 64.6% for AGIs below $25k, 73.5% for AGIs $25k-50k, 74.9% for AGIs $50k-75k, 78.0% for AGIs $75k-100k, 79.9% for AGIs $100k-200k, 49.1% for AGIs over 200k)
Taxable interest for individuals: $947 (reported on 33.4% of returns)
This zip code:
$947
Michigan:
$1,491
(% of AGI for various income ranges: 1.3% for AGIs below $25k, 0.8% for AGIs $25k-50k, 0.8% for AGIs $50k-75k, 0.6% for AGIs $75k-100k, 0.5% for AGIs $100k-200k, 0.4% for AGIs over 200k)
Ordinary dividends: $2,508 (reported on 18.8% of returns)
Here:
$2,508
State:
$6,225
(% of AGI for various income ranges: 1.5% for AGIs below $25k, 1.1% for AGIs $25k-50k, 1.2% for AGIs $50k-75k, 0.8% for AGIs $75k-100k, 1.0% for AGIs $100k-200k, 1.2% for AGIs over 200k)
Net capital gain/loss in AGI: +$1,283 (reported on 13.0% of returns)
Here:
+$1,283
State:
+$9,326
(% of AGI for various income ranges: 0.5% for AGIs $75k-100k, 0.4% for AGIs $100k-200k, 4.9% for AGIs over 200k)
Profit/loss from business: +$7,958 (reported on 13.2% of returns)
Here:
+$7,958
State:
+$11,523
(% of AGI for various income ranges: 10.1% for AGIs below $25k, 2.7% for AGIs $25k-50k, 1.5% for AGIs $50k-75k, 0.6% for AGIs $75k-100k, 1.1% for AGIs $100k-200k)
Taxable individual retirement arrangement distribution: $11,635 (reported on 12.2% of returns)
48092:
$11,635
Michigan:
$15,298
(% of AGI for various income ranges: 4.0% for AGIs below $25k, 3.1% for AGIs $25k-50k, 3.1% for AGIs $50k-75k, 2.8% for AGIs $75k-100k, 3.1% for AGIs $100k-200k, 5.8% for AGIs over 200k)
Total itemized deductions: $16,383 (21% of AGI, reported on 28.9% of returns)
Here:
$16,383
State:
$21,628
Here:
21.4% of AGI
State:
18.4% of AGI
(% of AGI for various income ranges: 7.6% for AGIs below $25k, 9.2% for AGIs $25k-50k, 11.8% for AGIs $50k-75k, 12.4% for AGIs $75k-100k, 12.2% for AGIs $100k-200k, 11.4% for AGIs over 200k)
Charity contributions: $2,724 (reported on 24.1% of returns)
Here:
$2,724
State:
$4,225
(% of AGI for various income ranges: 0.7% for AGIs below $25k, 1.2% for AGIs $25k-50k, 1.7% for AGIs $50k-75k, 1.9% for AGIs $75k-100k, 1.8% for AGIs $100k-200k, 1.5% for AGIs over 200k)
Taxes paid: $6,070 (reported on 28.8% of returns)
48092:
$6,070
State:
$8,327
(% of AGI for various income ranges: 1.9% for AGIs below $25k, 2.9% for AGIs $25k-50k, 4.1% for AGIs $50k-75k, 4.7% for AGIs $75k-100k, 5.4% for AGIs $100k-200k, 5.2% for AGIs over 200k)
Earned income credit: $2,276 (reported on 18.2% of returns)
Here:
$2,276
State:
$2,306
(% of AGI for various income ranges: 6.3% for AGIs below $25k, 1.1% for AGIs $25k-50k)
Percentage of individuals using paid preparers for their 2012 taxes: 60.6%
Here:
61%
State:
57%
(% for various income ranges: 62.1% for AGIs below $25k, 60.4% for AGIs $25k-50k, 60.3% for AGIs $50k-75k, 55.6% for AGIs $75k-100k, 58.3% for AGIs $100k-200k, 66.7% for AGIs over 200k)
Averages for the 2004 tax year for zip code 48092, filed in 2005:
Average Adjusted Gross Income (AGI) in 2004: $42,048 (Individual Income Tax Returns)
Here:
$42,048
State:
$48,204
Salary/wage: $39,974 (reported on 81.6% of returns)
Here:
$39,974
State:
$42,791
(% of AGI for various income ranges: 81.7% for AGIs below $10k, 59.4% for AGIs $10k-25k, 76.1% for AGIs $25k-50k, 80.4% for AGIs $50k-75k, 84.3% for AGIs $75k-100k, 77.6% for AGIs over 100k)
Taxable interest for individuals: $1,698 (reported on 54.9% of returns)
This zip code:
$1,698
Michigan:
$1,725
(% of AGI for various income ranges: 7.5% for AGIs below $10k, 4.1% for AGIs $10k-25k, 2.1% for AGIs $25k-50k, 1.6% for AGIs $50k-75k, 1.4% for AGIs $75k-100k, 2.4% for AGIs over 100k)
Taxable dividends: $1,852 (reported on 27.9% of returns)
Here:
$1,852
State:
$3,420
(% of AGI for various income ranges: 3.9% for AGIs below $10k, 2.3% for AGIs $10k-25k, 1.3% for AGIs $25k-50k, 1.2% for AGIs $50k-75k, 0.7% for AGIs $75k-100k, 0.9% for AGIs over 100k)
Net capital gain/loss: +$2,207 (reported on 19.4% of returns)
Here:
+$2,207
State:
+$8,532
(% of AGI for various income ranges: -2.0% for AGIs below $10k, -0.2% for AGIs $10k-25k, 0.2% for AGIs $25k-50k, 0.6% for AGIs $50k-75k, 0.6% for AGIs $75k-100k, 3.4% for AGIs over 100k)
Profit/loss from business: +$8,335 (reported on 11.0% of returns)
Here:
+$8,335
State:
+$9,547
(% of AGI for various income ranges: 8.0% for AGIs below $10k, 5.5% for AGIs $10k-25k, 1.9% for AGIs $25k-50k, 1.2% for AGIs $50k-75k, 1.3% for AGIs $75k-100k, 2.4% for AGIs over 100k)
IRA payment deduction: $2,844 (reported on 2.3% of returns)
48092:
$2,844
Michigan:
$2,875
(% of AGI for various income ranges: 0.3% for AGIs $10k-25k, 0.2% for AGIs $25k-50k, 0.2% for AGIs $50k-75k, 0.1% for AGIs $75k-100k, 0.1% for AGIs over 100k)
Self-employed pension: $14,222 (reported on 0.2% of returns)
Here:
$14,222
Michigan:
$13,826
Total itemized deductions: $15,652 (24% of AGI, reported on 39.6% of returns)
Here:
$15,652
State:
$18,509
Here:
23.6% of AGI
State:
20.7% of AGI
(% of AGI for various income ranges: 15.1% for AGIs below $10k, 12.4% for AGIs $10k-25k, 14.4% for AGIs $25k-50k, 15.4% for AGIs $50k-75k, 15.4% for AGIs $75k-100k, 14.7% for AGIs over 100k)
Charity contributions deductions: $2,228 (3% of AGI, reported on 35.4% of returns)
Here:
$2,228
State:
$3,365
Here:
3.2% of AGI
State:
3.6% of AGI
(% of AGI for various income ranges: 1.1% for AGIs below $10k, 1.2% for AGIs $10k-25k, 1.7% for AGIs $25k-50k, 1.9% for AGIs $50k-75k, 2.2% for AGIs $75k-100k, 2.1% for AGIs over 100k)
Total tax: $5,309 (reported on 77.9% of returns)
48092:
$5,309
State:
$7,691
(% of AGI for various income ranges: 2.7% for AGIs below $10k, 4.1% for AGIs $10k-25k, 7.0% for AGIs $25k-50k, 9.5% for AGIs $50k-75k, 10.6% for AGIs $75k-100k, 15.3% for AGIs over 100k)
Earned income credit: $1,646 (reported on 10.6% of returns)
Here:
$1,646
State:
$1,737
Percentage of individuals using paid preparers for their 2004 taxes: 58.8%
Here:
59%
State:
60%
(% for various income ranges: 55.3% for AGIs below $10k, 62.2% for AGIs $10k-25k, 59.8% for AGIs $25k-50k, 56.0% for AGIs $50k-75k, 57.0% for AGIs $75k-100k, 61.2% for AGIs over 100k)
Likely homosexual households (counted as self-reported same-sex unmarried-partner households)
Lesbian couples: 0.3% of all households
Gay men: 0.1% of all households
Household received Food Stamps/SNAP in the past 12 months: 1,619 Household did not receive Food Stamps/SNAP in the past 12 months: 9,265
Women who had a birth in the past 12 months: 396 (349 now married, 52 unmarried) Women who did not have a birth in the past 12 months: 5,667 (2,497 now married, 3,164 unmarried)
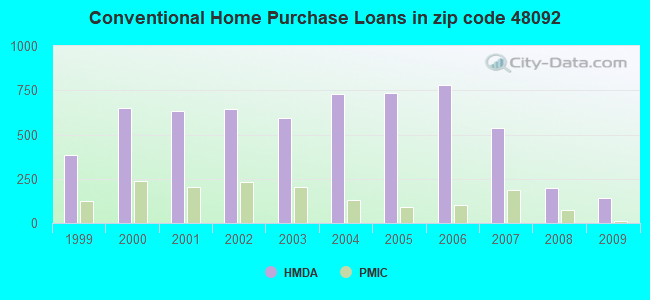
Housing units in zip code 48092 with a mortgage: 4,979 (414 second mortgage, 370 both second mortgage and home equity loan) Houses without a mortgage: 121
Median monthly owner costs for units with a mortgage: $1,397 Median monthly owner costs for units without a mortgage: $578
Residents with income below the poverty level in 2022:
This zip code:
11.1%
Whole state:
13.4%
Residents with income below 50% of the poverty level in 2022:
This zip code:
6.3%
Whole state:
6.9%
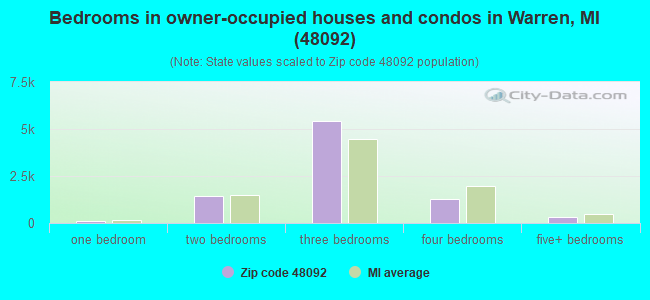
Median number of rooms in houses and condos:
Here:
6.0
State:
6.5
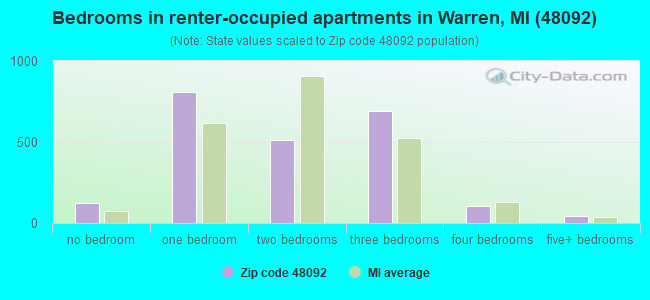
Median number of rooms in apartments:
Here:
4.1
State:
4.3
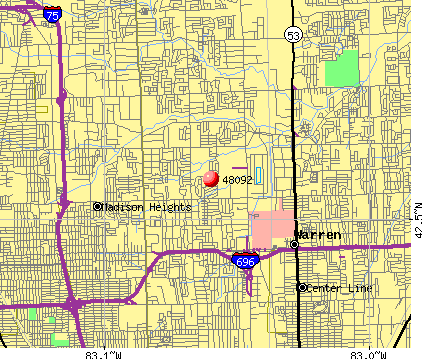
Notable locations in this zip code not listed on our city pages
Notable locations in zip code 48092: Arthur J Miller Public Library (A), Henry Ford Medical Center - Warren (B), Hutzel Warren Center (C), Detroit Arsenal Fire Department (D), City of Warren Fire Department Station 4 (E), City of Warren Fire Department Station 6 (F). Display/hide their locations on the map
Churches in zip code 48092 include: Church of Christ Parkview (A), Most Holy Trinity Seminary (B), Saint Louise Catholic Church (C), Warren Community Church (D), Grace Missionary Baptist Church (E), Saint Paul United Church of Christ (F), Saint Anne Catholic Church (G), First United Methodist Church (H), Saint Louise Catholic Church (I). Display/hide their locations on the map
Parks in zip code 48092 include: Detroit Memorial Park Cemetery Historical Marker (1), General Motor Technical Center Historical Marker (2), Governor Alex J Groesbeck Historical Marker (3), Village of Warren Historical Marker (4), Warren Union Cemetery Historical Marker (5), Butcher Park (6), Hartsig Park (7), Eckstein Park (8), Halmich Park (9). Display/hide their locations on the map
3,898 married couples with children.
848 single-parent households (295 men, 553 women).
70.1% of residents of 48092 zip code speak English at home.
0.9% of residents speak Spanish at home (57% very well, 37% well, 6% not well).
13.1% of residents speak other Indo-European language at home (58% very well, 19% well, 20% not well, 3% not at all).
6.3% of residents speak Asian or Pacific Island language at home (59% very well, 25% well, 13% not well, 3% not at all).
10.6% of residents speak other language at home (40% very well, 22% well, 20% not well, 18% not at all).
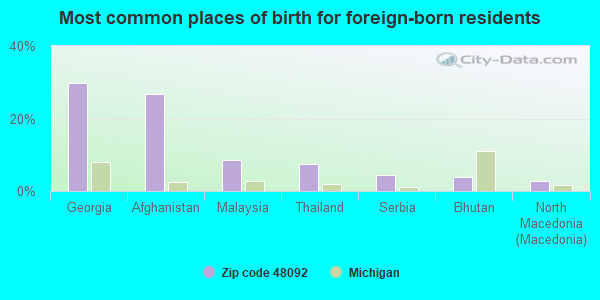
Foreign born population: 6,017 (21.7%) (79.8% of them are naturalized citizens)
Major facilities with environmental interests located in this zip code:
ENAMELCOTE INCORPORATED (7243 MILLER DR. in WARREN, MI)
AIR MINOR (AIRS/AFS) (Integrated Compliance Information System) - ICIS-05-1986-0342, FORMAL ENFORCEMENT ACTION CRITERIA AND HAZARDOUS AIR POLLUTANT INVENTORY (Inventory of air pollution sources) (Resource Conservation and Recovery Act (tracking hazardous waste)) TRI REPORTER (Tracking of toxic chemicals releasing facilities) Business SIC classification: COATING, ENGRAVING, AND ALLIED SERVICES Alternative names: EMMET COATING SERVICES
BEER MIDDLE SCHOOL (3200 MARTIN ROAD in WARREN, MI)
(National Center for Education Statistics) - STATE ID-05700 Organizations: WARREN CONSOLIDATED SCHOOLS (SCHOOL DISTRICT)
GREEN ACRES ELEMENTARY SCHOOL (4655 HOLMES DRIVE in WARREN, MI)
(National Center for Education Statistics) - STATE ID-01486 Organizations: WARREN CONSOLIDATED SCHOOLS (SCHOOL DISTRICT)
GENERAL MOTORS CORP FISHER GUIDE DIV (6600 E 12 MI RD in WARREN, MI)
(Integrated Compliance Information System) - ICIS-05-1990-0146, FORMAL ENFORCEMENT ACTION
EMMETECH POWDER COAT INCORPORATED (7214 MURTHUM AVENUE in WARREN, MI)
AIR MINOR (AIRS/AFS) (Resource Conservation and Recovery Act (tracking hazardous waste)) Business SIC classification: COATING, ENGRAVING, AND ALLIED SERVICES Alternative names: DYNAMIC POWDER COATINGS INCORPORATED
ACTEX INC (5501 ENTERPRISE DR in WARREN, MI)
(Resource Conservation and Recovery Act (tracking hazardous waste)) Organizations: COLMAN JAMES (CONTACT/OWNER)
AMOCO OIL CO 9749 (28934 RYAN RD in WARREN, MI)
(Resource Conservation and Recovery Act (tracking hazardous waste)) Organizations: AMOCO OIL COMPANY (CONTACT/OWNER)
BILCO TOOL CORP (30076 DEQUINDRE RD in WARREN, MI)
GREAT LAKES IMAGING INC (32466 DEQUINDRE RD in WARREN, MI)
(Resource Conservation and Recovery Act (tracking hazardous waste)) Organizations: KEN SULLIVAN & WILLIAM KAY (CONTACT/OPERATOR)
AMERICAN CUTTER & ENGINEERING CORP (31430 MOUND RD in WARREN, MI)
AIR MINOR (AIRS/AFS) Business SIC classification: SPECIAL DIES AND TOOLS, DIE SETS, JIGS AND FIXTURES, AND INDUSTRIAL MOLDS
AMERICAN INDUSTRIAL INC (14240 E 11 MILE RD in WARREN, MI)
Conditionally Exempt Small Quantity Generators, less than 100 kg/month of hazardous waste (Resource Conservation and Recovery Act (tracking hazardous waste)) Organizations: AMERICAN INDUSTRIES INC (CONTACT/OPERATOR)
, ROBERT GORDON (CONTACT/OWNER)
ASTRO CENTERLESS GRINDING (2242 14 MILE in WARREN, MI)
(Resource Conservation and Recovery Act (tracking hazardous waste))
Housing units lacking complete kitchen facilities: 0.2%
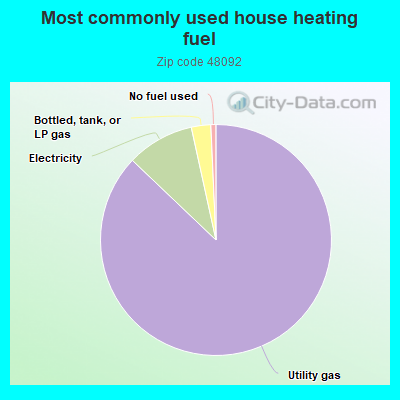
86.6%Utility gas
9.4%Electricity
2.7%Bottled, tank, or LP gas
0.7%No fuel used
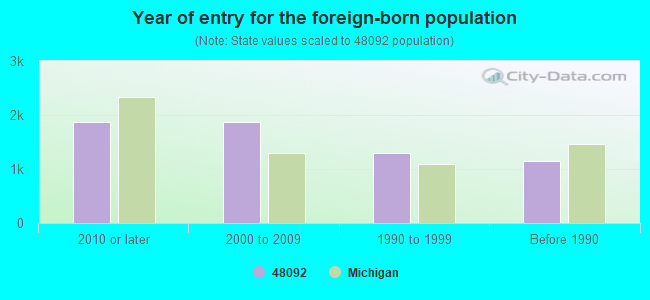
Population in 1990: 25,781.
Place of birth for U.S.-born residents:
This state: 18,960
Northeast: 411
Midwest: 778
South: 1,009
West: 312
66% of the 48092 zip code residents lived in the same house 5 years ago. Out of people who lived in different houses, 48% lived in this county. Out of people who lived in different counties, 50% lived in Michigan.
90% of the 48092 zip code residents lived in the same house 1 year ago. Out of people who lived in different houses, 47% moved from this county. Out of people who lived in different houses, 43% moved from different county within same state. Out of people who lived in different houses, 3% moved from different state. Out of people who lived in different houses, 5% moved from abroad.
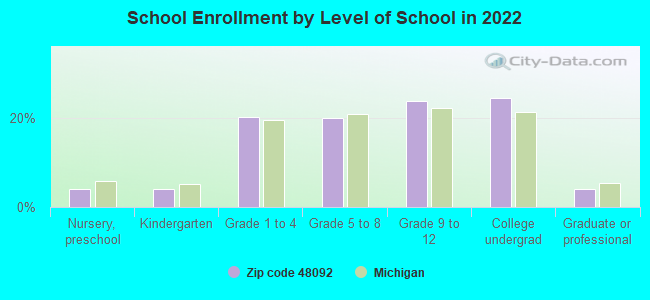
Private vs. public school enrollment:
Students in private schools in grades 1 to 8 (elementary and middle school): 200
Here:
8.5%
Michigan:
12.4%
Students in private schools in grades 9 to 12 (high school): 143
Here:
10.2%
Michigan:
9.8%
Students in private undergraduate colleges: 281
Here:
19.6%
Michigan:
14.9%
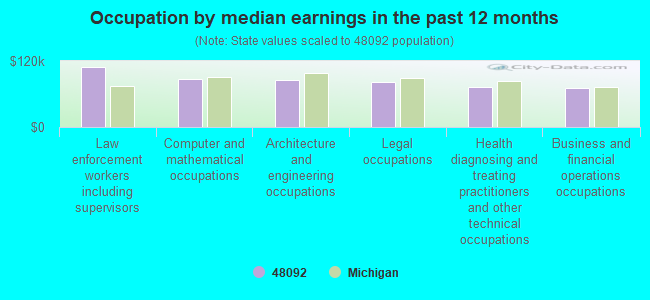
Occupation by median earnings in the past 12 months ($)
108,794Law enforcement workers including supervisors
87,331Computer and mathematical occupations
85,625Architecture and engineering occupations
82,372Legal occupations
72,512Health diagnosing and treating practitioners and other technical occupations
71,280Business and financial operations occupations
Companies with federal contracts located in this zip code:
XMCO INC (5501 ENTERPRISE CT STE 400 in WARREN, MI; small business) : $2,045,414 in 10 contractsfrom 2004 to 2006
Contracts for Other Research and Development -- Advanced Development (R&D), Logistics Support Services, Trucks and Truck Tractors, Wheeled, Miscellaneous Printed Matter, and moreby Army Signed by year:2000: $0; 2001: $0; 2002: $0; 2003: $0; 2004: $224,578; 2005: $486,084; 2006: $1,334,752.
Biggest contracts:
$502,034 with Army for Other Research and Development -- Advanced Development (R&D). Signed on 2006-05-03. Completion date: 2007-05-03.
$421,006 with Army for Logistics Support Services. Signed on 2006-03-31. Completion date: 2006-12-30.
$365,364 with Army for Trucks and Truck Tractors, Wheeled. Signed on 2006-03-30. Completion date: 2006-12-31.
$273,371 with Army for Miscellaneous Printed Matter. Signed on 2005-10-07. Completion date: 2006-02-27.
SPX CORPORATION (5775 ENTERPRISE DR in WARREN, MI) : $100,361 in 7 contractsfrom 2001 to 2005
Contracts for Motor Vehicle Maintenance and Repair Shop Specialized Equipment, Miscellaneous Maintenance and Repair Shop Specialized Equipment, Electrical and Electronic Properties Measuring and Testing Instruments, Measuring Tools, Craftsmen's by Army, Navy Signed by year:2000: $0; 2001: $47,526; 2002: $0; 2003: $18,947; 2004: $6,800; 2005: $27,088; 2006: $0.
Biggest contracts:
$47,526 with Army for Motor Vehicle Maintenance and Repair Shop Specialized Equipment. Taking place in IA. Signed on 2001-09-17. Completion date: 2001-10-31.
$20,400 with Navy for Miscellaneous Maintenance and Repair Shop Specialized Equipment. Signed on 2005-04-01. Completion date: 2004-05-26.
$7,868 with Navy for Electrical and Electronic Properties Measuring and Testing Instruments. Signed on 2003-07-23. Completion date: 2003-08-22.
$6,800 with Navy for Miscellaneous Maintenance and Repair Shop Specialized Equipment. Signed on 2004-05-13. Completion date: 2004-05-26.
DETROIT TESTING LABORATORY INC (7111 E 11 MILE RD in WARREN, MI; small business) : $96,860 in 3 contractsfrom 2000 to 2002
$42,000 with National Highway Traffic Safety Administration for Other Special Studies and Analyses. Signed on 2002-08-15. Completion date: 2003-09-15.
$39,000, same as above.Signed on 2000-09-15. Completion date: 2001-09-15.
$15,860 with Army for Laboratory Testing Services. Signed on 2002-11-05. Completion date: 2002-11-30.
DETROIT TESTING LABORATORY INC (7111 E 11 MILE RD in WARREN, MI; small business) : $84,780 in 8 contractsfrom 2003 to 2006
Contracts for Packing and Gasket Materials, Systems Engineering Services, Equipment and Materials Testing -- Electrical and Electronic Equipment Components, Equipment and Materials Testing -- Vehicular Equipment Components, and moreby Army, National Highway Traffic Safety Administration Signed by year:2000: $0; 2001: $0; 2002: $0; 2003: $14,000; 2004: $27,900; 2005: $22,605; 2006: $20,275.
Biggest contracts:
$27,900 with Army for Packing and Gasket Materials. Signed on 2004-12-17. Completion date: 2005-03-31.
$14,500 with National Highway Traffic Safety Administration for Systems Engineering Services. Signed on 2005-03-17. Completion date: 2005-11-27.
$14,175 with Army for Equipment and Materials Testing -- Electrical and Electronic Equipment Components. Signed on 2006-02-17. Completion date: 2006-04-30.
$14,000 with National Highway Traffic Safety Administration for Systems Engineering Services. Signed on 2003-11-28. Completion date: 2008-11-28.
J L GEISLER CORP (28750 LORNA AVE in WARREN, MI; small business) : $33,261 in 3 contractsfrom 2004 to 2005
$22,550 with Army for Nails, Machine Keys, and Pins. Signed on 2005-06-15. Completion date: 2005-07-06.
$6,972 with Army for Signs, Advertising Displays, and Identification Plates. Signed on 2004-12-13. Completion date: 2004-12-25.
$3,739 with Army for Specialized Shipping and Storage Containers. Signed on 2004-04-04. Completion date: 2004-04-30.
hemco machine co. (6785 chicago road in warren, mi; small business)
$21,475 with EPA for Manufacturing Technology -- Advanced Development (R&D). Signed on 2005-01-12. Completion date: 2005-03-31.
VAN ART FURNITURE INC (6500 E 14 MILE RD in WARREN, MI)
$12,057 with Army for Household Furniture. Signed on 2001-10-25. Completion date: 2001-10-29.
SPENCER, ROBERT (7519 STANLEY AVE in WARREN, MI; small business)
$11,832 with Army for Tool and Hardware Boxes. Signed on 2003-03-05. Completion date: 2003-03-31.
STUBBS, H B COMPANY (27027 MOUND RD in WARREN, MI; small business)
$6,629 with Army for Lease or Rental of Equipment -- Miscellaneous. Signed on 2004-02-20. Completion date: 2004-03-12.
PLUMBROOK HOME MEDICAL EQUIPME (2840 E 14 MILE RD in WARREN, MI; small business)
$5,970 with Army for Miscellaneous Prefabricated Structures. Signed on 2000-05-06. Completion date: 2000-05-23.
Top industries in this zip code by the number of employees in 2005:
Management of Companies and Enterprises: Corporate, Subsidiary, and Regional Managing Offices (over 1000 employees: 1 establishment, 100-249 employees: 1 establishment, 10-19 employees: 1 establishment, 5-9 employees: 1 establishment)
2002 - 2018 National Fire Incident Reporting System (NFIRS) incidents
According to the data from the years 2002 - 2018 the average number of fire incidents per year is 63. The highest number of reported fires - 93 took place in 2002, and the least - 32 in 2015. The data has a declining trend.
When looking into fire subcategories, the most incidents belonged to: Structure Fires (44.8%), and Mobile Property/Vehicle Fires (28.2%).
Fire incident types reported to NFIRS in Zip Code 48092
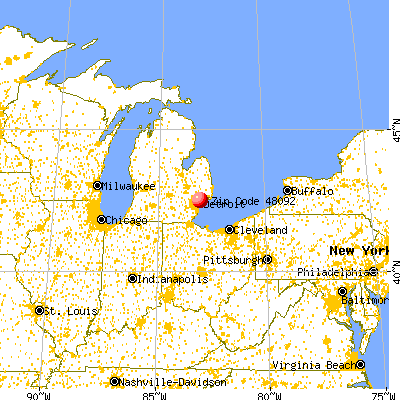


 Nearest zip codes: 48397, 48093, 48071, 48091, 48015, 48310.
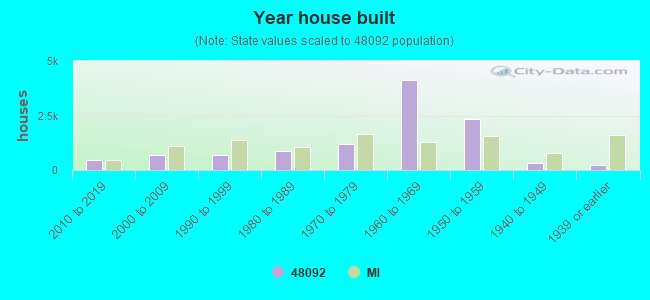


 According to the data from the years 2002 - 2018 the average number of fire incidents per year is 63. The highest number of reported fires - 93 took place in 2002, and the least - 32 in 2015. The data has a declining trend.
 When looking into fire subcategories, the most incidents belonged to: Structure Fires (44.8%), and Mobile Property/Vehicle Fires (28.2%).