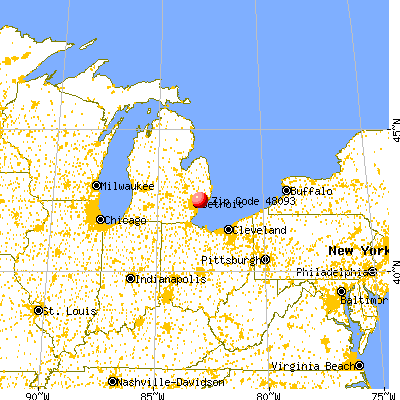
Estimated zip code population in 2022: 24,383 Zip code population in 2010: 23,037 Zip code population in 2000: 46,554
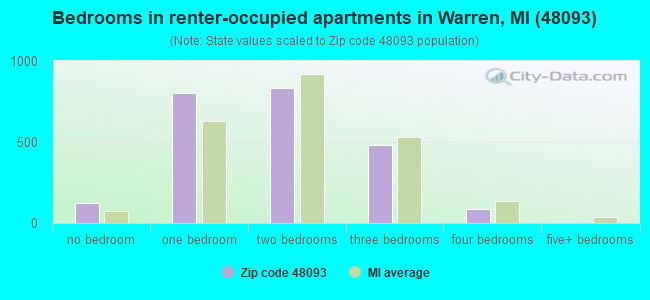
Houses and condos: 10,639 Renter-occupied apartments: 2,336
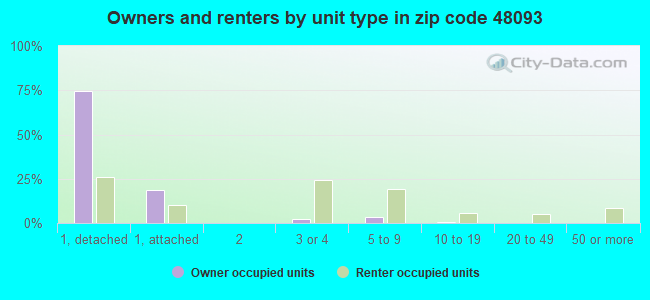
% of renters here:
22%
State:
27%
March 2022 cost of living index in zip code 48093: 95.6 (near average, U.S. average is 100)
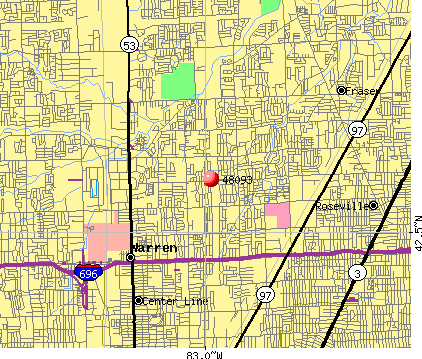
Land area: 5.7 sq. mi. Water area: 0.0 sq. mi.
Population density: 4,311 people per square mile
(average).
OSM Map
General Map
Google Map
MSN Map
OSM Map
General Map
Google Map
MSN Map
OSM Map
General Map
Google Map
MSN Map
OSM Map
General Map
Google Map
MSN Map
Please wait while loading the map...
Real estate property taxes paid for housing units in 2022:
This zip code:
1.7% ($3,290)
Michigan:
1.2% ($2,746)
Median real estate property taxes paid for housing units with mortgages in 2022: $3,574 (1.7%) Median real estate property taxes paid for housing units with no mortgage in 2022: $2,982 (1.6%)
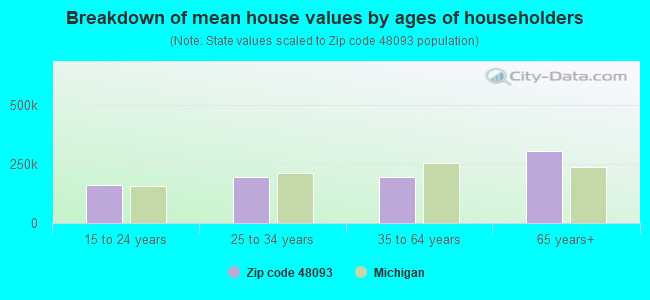
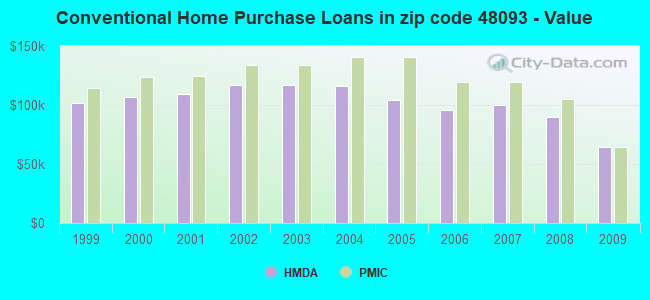
Estimated median house/condo value in 2022: $199,070
48093:
$199,070
Michigan:
$224,400
According to our research of Michigan and other state lists, there were 39 registered sex offenders living in 48093 zip code as of April 26, 2024. The ratio of all residents to sex offenders in zip code 48093 is 621 to 1. The ratio of registered sex offenders to all residents in this zip code is lower than the state average.
Median resident age:
This zip code:
43.0 years
Michigan median age:
40.3 years
Average household size:
This zip code:
2.3 people
Michigan:
2.4 people
Averages for the 2020 tax year for zip code 48093, filed in 2021:
Average Adjusted Gross Income (AGI) in 2020: $50,352 (Individual Income Tax Returns)
Here:
$50,352
State:
$68,945
Salary/wage: $47,154 (reported on 75.4% of returns)
Here:
$47,154
State:
$57,142
(% of AGI for various income ranges: 982.1% for AGIs below $25k, 3373.7% for AGIs $25k-50k, 6473.8% for AGIs $50k-75k, 9262.3% for AGIs $75k-100k, 16431.4% for AGIs $100k-200k, 61068.0% for AGIs over 200k)
Taxable interest for individuals: $1,087 (reported on 26.5% of returns)
This zip code:
$1,087
Michigan:
$1,630
(% of AGI for various income ranges: 15.6% for AGIs below $25k, 20.3% for AGIs $25k-50k, 49.6% for AGIs $50k-75k, 67.6% for AGIs $75k-100k, 120.4% for AGIs $100k-200k, 878.0% for AGIs over 200k)
Ordinary dividends: $3,480 (reported on 15.5% of returns)
Here:
$3,480
State:
$6,972
(% of AGI for various income ranges: 25.4% for AGIs below $25k, 38.2% for AGIs $25k-50k, 70.7% for AGIs $50k-75k, 103.8% for AGIs $75k-100k, 276.0% for AGIs $100k-200k, 2036.0% for AGIs over 200k)
Net capital gain/loss in AGI: +$6,295 (reported on 14.4% of returns)
Here:
+$6,295
State:
+$20,064
(% of AGI for various income ranges: 2.5% for AGIs below $25k, 31.9% for AGIs $25k-50k, 61.0% for AGIs $50k-75k, 131.0% for AGIs $75k-100k, 495.5% for AGIs $100k-200k, 9606.0% for AGIs over 200k)
Profit/loss from business: +$5,188 (reported on 15.9% of returns)
Here:
+$5,188
State:
+$11,172
(% of AGI for various income ranges: 79.7% for AGIs below $25k, 75.8% for AGIs $25k-50k, 114.1% for AGIs $50k-75k, 181.4% for AGIs $75k-100k, 200.4% for AGIs $100k-200k, 2886.0% for AGIs over 200k)
Taxable individual retirement arrangement distribution: $13,185 (reported on 9.7% of returns)
48093:
$13,185
Michigan:
$19,803
(% of AGI for various income ranges: 77.2% for AGIs below $25k, 86.5% for AGIs $25k-50k, 186.1% for AGIs $50k-75k, 333.2% for AGIs $75k-100k, 663.5% for AGIs $100k-200k, 1750.0% for AGIs over 200k)
Total itemized deductions: $22,500 (reported on 5.4% of returns)
Here:
$22,500
State:
$34,117
(% of AGI for various income ranges: 42.1% for AGIs below $25k, 84.5% for AGIs $25k-50k, 248.0% for AGIs $50k-75k, 372.8% for AGIs $75k-100k, 512.5% for AGIs $100k-200k, 2636.0% for AGIs over 200k)
Charity contributions: $7,027 (reported on 4.2% of returns)
Here:
$7,027
State:
$13,548
(% of AGI for various income ranges: 3.5% for AGIs below $25k, 12.6% for AGIs $25k-50k, 58.8% for AGIs $50k-75k, 85.2% for AGIs $75k-100k, 143.9% for AGIs $100k-200k, 1148.0% for AGIs over 200k)
Taxes paid: $7,076 (reported on 5.3% of returns)
48093:
$7,076
State:
$7,972
(% of AGI for various income ranges: 7.6% for AGIs below $25k, 21.5% for AGIs $25k-50k, 76.5% for AGIs $50k-75k, 127.8% for AGIs $75k-100k, 181.6% for AGIs $100k-200k, 676.0% for AGIs over 200k)
Earned income credit: $2,152 (reported on 14.6% of returns)
Here:
$2,152
State:
$2,251
(% of AGI for various income ranges: 79.7% for AGIs below $25k, 63.2% for AGIs $25k-50k, 1.7% for AGIs $50k-75k)
Percentage of individuals using paid preparers for their 2020 taxes: 92.4%
Here:
92%
State:
93%
(% for various income ranges: 92.4% for AGIs below $25k, 92.9% for AGIs $25k-50k, 92.4% for AGIs $50k-75k, 92.1% for AGIs $75k-100k, 90.8% for AGIs $100k-200k, 93.8% for AGIs over 200k)
Averages for the 2012 tax year for zip code 48093, filed in 2013:
Average Adjusted Gross Income (AGI) in 2012: $44,249 (Individual Income Tax Returns)
Here:
$44,249
State:
$55,609
Salary/wage: $41,223 (reported on 76.8% of returns)
Here:
$41,223
State:
$46,782
(% of AGI for various income ranges: 63.1% for AGIs below $25k, 72.5% for AGIs $25k-50k, 71.8% for AGIs $50k-75k, 72.7% for AGIs $75k-100k, 73.8% for AGIs $100k-200k, 70.9% for AGIs over 200k)
Taxable interest for individuals: $1,322 (reported on 35.9% of returns)
This zip code:
$1,322
Michigan:
$1,491
(% of AGI for various income ranges: 2.0% for AGIs below $25k, 0.9% for AGIs $25k-50k, 1.0% for AGIs $50k-75k, 0.9% for AGIs $75k-100k, 0.9% for AGIs $100k-200k, 1.1% for AGIs over 200k)
Ordinary dividends: $3,486 (reported on 21.8% of returns)
Here:
$3,486
State:
$6,225
(% of AGI for various income ranges: 2.1% for AGIs below $25k, 1.3% for AGIs $25k-50k, 1.5% for AGIs $50k-75k, 1.6% for AGIs $75k-100k, 2.0% for AGIs $100k-200k, 2.3% for AGIs over 200k)
Net capital gain/loss in AGI: +$772 (reported on 15.2% of returns)
Here:
+$772
State:
+$9,326
(% of AGI for various income ranges: 0.2% for AGIs $50k-75k, 0.4% for AGIs $75k-100k, 1.0% for AGIs $100k-200k, 0.7% for AGIs over 200k)
Profit/loss from business: +$7,653 (reported on 11.4% of returns)
Here:
+$7,653
State:
+$11,523
(% of AGI for various income ranges: 6.2% for AGIs below $25k, 2.0% for AGIs $25k-50k, 1.3% for AGIs $50k-75k, 1.3% for AGIs $75k-100k, 1.5% for AGIs $100k-200k)
Taxable individual retirement arrangement distribution: $10,759 (reported on 14.4% of returns)
48093:
$10,759
Michigan:
$15,298
(% of AGI for various income ranges: 4.3% for AGIs below $25k, 3.1% for AGIs $25k-50k, 3.4% for AGIs $50k-75k, 3.7% for AGIs $75k-100k, 4.3% for AGIs $100k-200k)
Total itemized deductions: $16,151 (21% of AGI, reported on 30.0% of returns)
Here:
$16,151
State:
$21,628
Here:
21.0% of AGI
State:
18.4% of AGI
(% of AGI for various income ranges: 9.2% for AGIs below $25k, 10.0% for AGIs $25k-50k, 11.3% for AGIs $50k-75k, 11.6% for AGIs $75k-100k, 12.3% for AGIs $100k-200k, 9.3% for AGIs over 200k)
Charity contributions: $2,697 (reported on 25.5% of returns)
Here:
$2,697
State:
$4,225
(% of AGI for various income ranges: 0.8% for AGIs below $25k, 1.2% for AGIs $25k-50k, 1.6% for AGIs $50k-75k, 1.6% for AGIs $75k-100k, 2.1% for AGIs $100k-200k, 1.4% for AGIs over 200k)
Taxes paid: $6,158 (reported on 29.9% of returns)
48093:
$6,158
State:
$8,327
(% of AGI for various income ranges: 2.3% for AGIs below $25k, 3.1% for AGIs $25k-50k, 4.1% for AGIs $50k-75k, 4.6% for AGIs $75k-100k, 5.3% for AGIs $100k-200k, 5.6% for AGIs over 200k)
Earned income credit: $2,155 (reported on 15.1% of returns)
Here:
$2,155
State:
$2,306
(% of AGI for various income ranges: 5.1% for AGIs below $25k, 0.8% for AGIs $25k-50k)
Percentage of individuals using paid preparers for their 2012 taxes: 58.9%
Here:
59%
State:
57%
(% for various income ranges: 57.5% for AGIs below $25k, 58.4% for AGIs $25k-50k, 62.1% for AGIs $50k-75k, 60.0% for AGIs $75k-100k, 59.8% for AGIs $100k-200k, 66.7% for AGIs over 200k)
Averages for the 2004 tax year for zip code 48093, filed in 2005:
Average Adjusted Gross Income (AGI) in 2004: $44,840 (Individual Income Tax Returns)
Here:
$44,840
State:
$48,204
Salary/wage: $41,067 (reported on 76.5% of returns)
Here:
$41,067
State:
$42,791
(% of AGI for various income ranges: 63.4% for AGIs below $10k, 53.2% for AGIs $10k-25k, 68.0% for AGIs $25k-50k, 75.8% for AGIs $50k-75k, 79.7% for AGIs $75k-100k, 65.8% for AGIs over 100k)
Taxable interest for individuals: $2,156 (reported on 62.3% of returns)
This zip code:
$2,156
Michigan:
$1,725
(% of AGI for various income ranges: 9.6% for AGIs below $10k, 6.3% for AGIs $10k-25k, 3.2% for AGIs $25k-50k, 2.4% for AGIs $50k-75k, 2.1% for AGIs $75k-100k, 2.5% for AGIs over 100k)
Taxable dividends: $2,475 (reported on 33.3% of returns)
Here:
$2,475
State:
$3,420
(% of AGI for various income ranges: 5.5% for AGIs below $10k, 3.3% for AGIs $10k-25k, 2.0% for AGIs $25k-50k, 1.5% for AGIs $50k-75k, 1.2% for AGIs $75k-100k, 1.7% for AGIs over 100k)
Net capital gain/loss: +$5,474 (reported on 23.4% of returns)
Here:
+$5,474
State:
+$8,532
(% of AGI for various income ranges: -2.8% for AGIs below $10k, 0.5% for AGIs $10k-25k, 0.3% for AGIs $25k-50k, 0.9% for AGIs $50k-75k, 0.9% for AGIs $75k-100k, 9.1% for AGIs over 100k)
Profit/loss from business: +$6,183 (reported on 10.0% of returns)
Here:
+$6,183
State:
+$9,547
(% of AGI for various income ranges: 3.5% for AGIs below $10k, 3.1% for AGIs $10k-25k, 1.7% for AGIs $25k-50k, 1.2% for AGIs $50k-75k, 0.8% for AGIs $75k-100k, 1.0% for AGIs over 100k)
IRA payment deduction: $2,851 (reported on 2.8% of returns)
48093:
$2,851
Michigan:
$2,875
(% of AGI for various income ranges: 0.4% for AGIs below $10k, 0.3% for AGIs $10k-25k, 0.3% for AGIs $25k-50k, 0.2% for AGIs $50k-75k, 0.1% for AGIs $75k-100k, 0.1% for AGIs over 100k)
Self-employed pension: $5,333 (reported on 0.2% of returns)
Here:
$5,333
Michigan:
$13,826
Total itemized deductions: $15,176 (21% of AGI, reported on 40.1% of returns)
Here:
$15,176
State:
$18,509
Here:
21.2% of AGI
State:
20.7% of AGI
(% of AGI for various income ranges: 15.5% for AGIs below $10k, 11.5% for AGIs $10k-25k, 13.8% for AGIs $25k-50k, 15.6% for AGIs $50k-75k, 14.7% for AGIs $75k-100k, 11.3% for AGIs over 100k)
Charity contributions deductions: $2,329 (3% of AGI, reported on 36.6% of returns)
Here:
$2,329
State:
$3,365
Here:
3.2% of AGI
State:
3.6% of AGI
(% of AGI for various income ranges: 0.9% for AGIs below $10k, 1.4% for AGIs $10k-25k, 1.8% for AGIs $25k-50k, 2.2% for AGIs $50k-75k, 2.2% for AGIs $75k-100k, 1.8% for AGIs over 100k)
Total tax: $6,072 (reported on 79.7% of returns)
48093:
$6,072
State:
$7,691
(% of AGI for various income ranges: 1.9% for AGIs below $10k, 4.0% for AGIs $10k-25k, 7.5% for AGIs $25k-50k, 9.5% for AGIs $50k-75k, 10.7% for AGIs $75k-100k, 17.3% for AGIs over 100k)
Earned income credit: $1,488 (reported on 7.8% of returns)
Here:
$1,488
State:
$1,737
Percentage of individuals using paid preparers for their 2004 taxes: 58.5%
Here:
59%
State:
60%
(% for various income ranges: 54.8% for AGIs below $10k, 60.5% for AGIs $10k-25k, 59.4% for AGIs $25k-50k, 58.4% for AGIs $50k-75k, 57.3% for AGIs $75k-100k, 60.2% for AGIs over 100k)
Likely homosexual households (counted as self-reported same-sex unmarried-partner households)
Lesbian couples: 0.0% of all households
Gay men: 0.0% of all households
Household received Food Stamps/SNAP in the past 12 months: 1,487 Household did not receive Food Stamps/SNAP in the past 12 months: 9,040
Women who had a birth in the past 12 months: 204 (156 now married, 49 unmarried) Women who did not have a birth in the past 12 months: 5,349 (2,262 now married, 3,083 unmarried)
Housing units in zip code 48093 with a mortgage: 4,607 (411 second mortgage, 14 home equity loan, 380 both second mortgage and home equity loan) Houses without a mortgage: 92
Median monthly owner costs for units with a mortgage: $1,421 Median monthly owner costs for units without a mortgage: $587
Residents with income below the poverty level in 2022:
This zip code:
8.8%
Whole state:
13.4%
Residents with income below 50% of the poverty level in 2022:
This zip code:
5.5%
Whole state:
6.9%
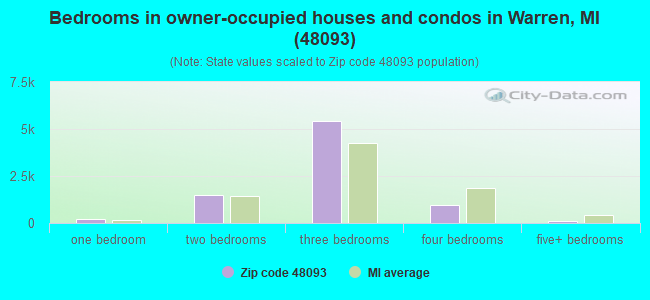
Median number of rooms in houses and condos:
Here:
5.9
State:
6.5
Median number of rooms in apartments:
Here:
3.9
State:
4.3
Notable locations in this zip code not listed on our city pages
Notable locations in zip code 48093: Civic Center Library (A), Warren Police Department (B), Saint John Macomb Obstetrics and Gynecology Select Health Center - Warren (C), Saint John Medical Center-Warren (D), Beaumont Medical Facility (E), Bon Secours Associated Family Care Physicians Building (F), City of Warren Fire Department Station 5 (G). Display/hide their locations on the map
Shopping Centers: Majestic Plaza Shopping Center (1), Hoover-12 Shopping Center (2), Tech Plaza Shopping Center (3). Display/hide their locations on the map
Churches in zip code 48093 include: Hope Church (A), Our Lady of Redemption Melkite Church (B), Saint Luke Church (C), Faith-Trinity United Church of Christ (D), Woodside Bible Church (E), Peace Lutheran Church (F), Saint Peters Lutheran Church (G), Saint Martin de Porres Parish (H), North Pointe Baptist Church (I). Display/hide their locations on the map
Parks in zip code 48093 include: Detroit Arsenal Tank Plant Historical Marker (1), Veterans Memorial Park (2), Burdi Park (3), Rinke Park (4), Licht Park (5), Bates Park (6). Display/hide their locations on the map
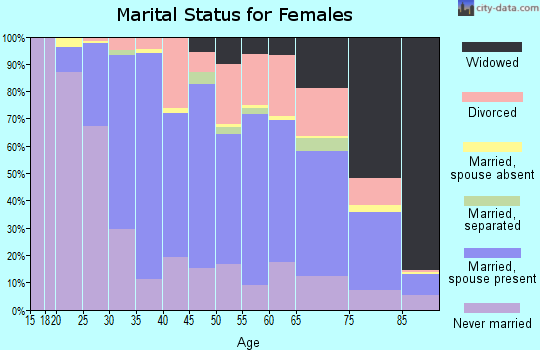
3,081 married couples with children.
664 single-parent households (190 men, 474 women).
81.9% of residents of 48093 zip code speak English at home.
0.4% of residents speak Spanish at home (92% very well, 6% not well, 2% not at all).
9.3% of residents speak other Indo-European language at home (39% very well, 38% well, 22% not well).
2.8% of residents speak Asian or Pacific Island language at home (69% very well, 16% well, 12% not well, 3% not at all).
6.0% of residents speak other language at home (36% very well, 44% well, 15% not well, 4% not at all).
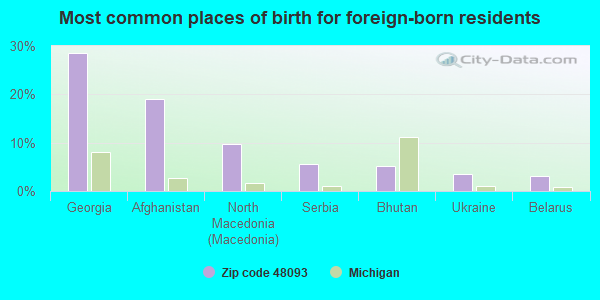
Foreign born population: 3,384 (13.9%) (71.6% of them are naturalized citizens)
Major facilities with environmental interests located in this zip code:
CHILDREN'S HOME OF DETROIT (6902 CHICAGO in WARREN, MI)
(National Center for Education Statistics) - STATE ID-08830 Organizations: WARREN CONSOLIDATED SCHOOLS (SCHOOL DISTRICT)
DETROIT ARSENAL TANK PLANT GENERAL DYNAMICS LAND SYSTEMS (28251 VAN DYKE AVE. in WARREN, MI) . Federal Facility. U.S. ARMY
COMPLIANCE ACTIVITY (Tracking inspections of insecticide, fungicide, and rodenticide, and toxic substances) (Resource Conservation and Recovery Act (tracking hazardous waste)) TRI REPORTER (Tracking of toxic chemicals releasing facilities) Business SIC classification: TANKS AND TANK COMPONENTS; NATIONAL SECURITY Alternative names: DCT, GENERAL DYNAMICS CORPORATION, GENERAL DYNAMICS DETROIT ARSENAL TANK PL, GENERAL DYNAMICS DETROIT ARSENAL TANK PT, GENERAL DYNAMICS LAND SYS. DETROIT ARSENAL TANK PLANT
12/ HOOVER CENTER (11549 12 MILE RD in WARREN, MI)
(Resource Conservation and Recovery Act (tracking hazardous waste)) Organizations: AMOCO OIL COMPANY (CONTACT/OWNER)
Alternative names: AMOCO OIL CO 5779 14 MILE
AMOCO OIL CO 5716 (37848 VAN DYKE AND MARTIN in WARREN, MI)
(Resource Conservation and Recovery Act (tracking hazardous waste))
AMOCO OIL CO 5782 (11610 13 MILE RD in WARREN, MI)
(Resource Conservation and Recovery Act (tracking hazardous waste)) Organizations: AMOCO OIL COMPANY (CONTACT/OWNER)
APPLIED GRAPHICS TECHNOLOGIES (5501 ENTERPRISES STE C in WARREN, MI)
(Resource Conservation and Recovery Act (tracking hazardous waste)) Organizations: MORRIS AND BERKE (CONTACT/OWNER)
ASTRO CENTERLESS GRINDING CO (27800 COLLEGE PARK DR in WARREN, MI)
(Resource Conservation and Recovery Act (tracking hazardous waste)) Business NAICS classification: METAL COATING, ENGRAVING (EXCEPT JEWELRY AND SILVERWARE), AND ALLIED SERVICES TO MANUFACTURERS. Organizations: WILLIAM IGO (CONTACT/OWNER)
BLONDES SVC CTR (30985 SCHOENHERR in WARREN, MI)
(Resource Conservation and Recovery Act (tracking hazardous waste)) Organizations: BLONDE DONALD (CONTACT/OWNER)
GREAT LAKES FREIGHTLINER INC (22349 GROESBECK in WARREN, MI)
(Resource Conservation and Recovery Act (tracking hazardous waste)) Organizations: KINNIE BILL (CONTACT/OWNER)
DUNNS INC (29096 VAN DYKE in WARREN, MI)
(Resource Conservation and Recovery Act (tracking hazardous waste)) Organizations: KALTER JOHN (CONTACT/OWNER)
DUROSS PAINTING CO (27270 GLOEDE in WARREN, MI)
(Resource Conservation and Recovery Act (tracking hazardous waste))
Housing units lacking complete plumbing facilities: 0.1% Housing units lacking complete kitchen facilities: 0.6%
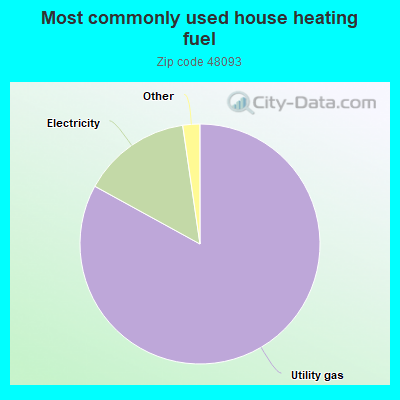
83.0%Utility gas
14.7%Electricity
1.0%Bottled, tank, or LP gas
0.9%Other fuel
Population in 1990: 50,327.
Place of birth for U.S.-born residents:
This state: 18,326
Northeast: 418
Midwest: 958
South: 854
West: 320
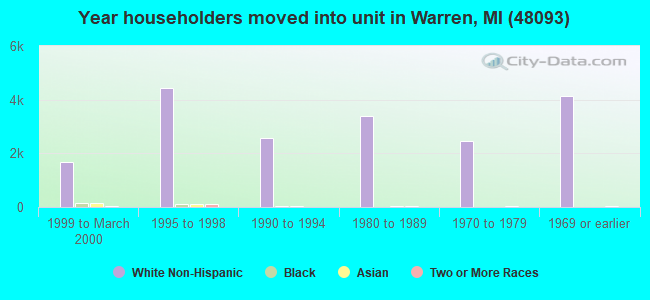
67% of the 48093 zip code residents lived in the same house 5 years ago. Out of people who lived in different houses, 60% lived in this county. Out of people who lived in different counties, 50% lived in Michigan.
92% of the 48093 zip code residents lived in the same house 1 year ago. Out of people who lived in different houses, 55% moved from this county. Out of people who lived in different houses, 32% moved from different county within same state. Out of people who lived in different houses, 12% moved from different state. Out of people who lived in different houses, 1% moved from abroad.
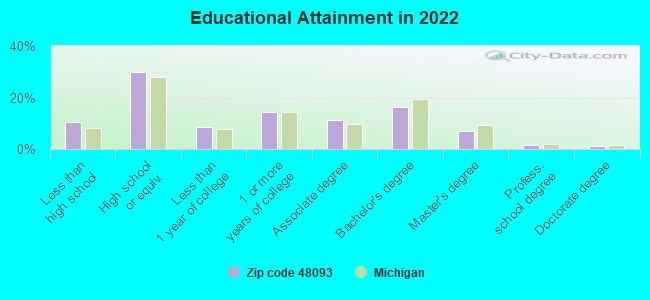
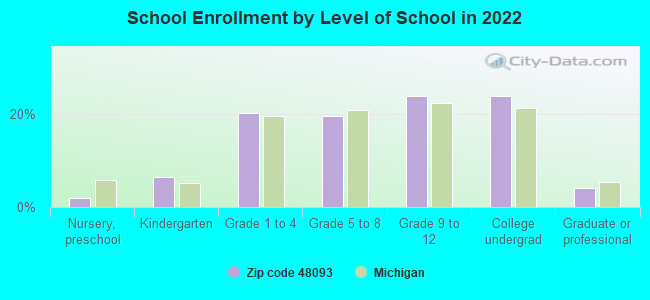
Private vs. public school enrollment:
Students in private schools in grades 1 to 8 (elementary and middle school): 283
Here:
16.6%
Michigan:
12.4%
Students in private schools in grades 9 to 12 (high school): 92
Here:
9.1%
Michigan:
9.8%
Students in private undergraduate colleges: 261
Here:
25.5%
Michigan:
14.9%
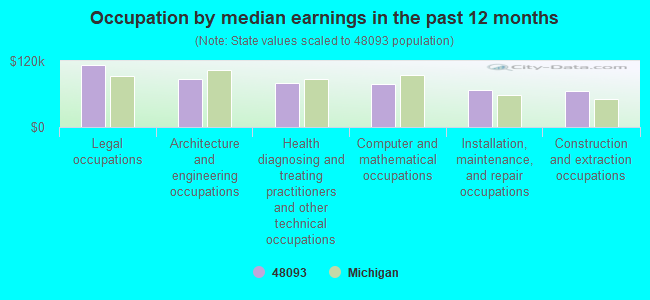
Occupation by median earnings in the past 12 months ($)
112,012Legal occupations
86,622Architecture and engineering occupations
79,675Health diagnosing and treating practitioners and other technical occupations
77,749Computer and mathematical occupations
67,954Installation, maintenance, and repair occupations
65,057Construction and extraction occupations
Companies with federal contracts located in this zip code (WARREN, MI):
CITY OF WARREN (29500 VAN DYKE) : $880,000 in 4 contractsfrom 2002 to 2004
$400,000 with Office of Assistant Secretary for Health except national centers (disused code) for Other Medical Services. Signed on 2002-05-15. Completion date: 2003-11-15.
$280,000, same as above.Signed on 2003-08-15. Completion date: 2005-12-15.
$200,000, same as above.Signed on 2003-08-15. Completion date: 2004-09-15.
$0 with Federal Emergency Management Agency for Other Medical Services. Signed on 2004-10-26. Completion date: 2005-12-19.
FOURTOWERS LP (30000 VANDYKE; small business) : $303,147 in 21 contractsfrom 1999 to 2003
Contracts for Lodging - Hotel/Motel, Passenger Motor Charter Service by Army Signed by year:2000: $139,358; 2001: $17,250; 2002: $32,870; 2003: -$2,835; 2004: $0; 2005: $0; 2006: $0.
Biggest contracts:
$79,598 with Army for Lodging - Hotel/Motel. Signed on 2000-07-17. Completion date: 2000-09-30.
$61,877, same as above.Signed on 1999-12-22. Completion date: 2000-03-31.
$59,760, same as above.Signed on 2000-04-17. Completion date: 2000-06-30.
$54,627, same as above.Signed on 1999-10-06. Completion date: 1999-12-31.
MADISON ELECTRIC COMPANY (31855 VAN DYKE AVE; small business) : $34,361 in 8 contractsfrom 2003 to 2006
Contracts for Electric Services, Electrical Hardware and Supplies, ADP Support Equipment, Miscellaneous Electrical and Electronic Components, and moreby Army, EPA Signed by year:2000: $0; 2001: $0; 2002: $0; 2003: $6,061; 2004: $13,888; 2005: $6,630; 2006: $7,782.
Biggest contracts:
$13,888 with Army for Electric Services. Signed on 2004-02-20. Completion date: 2004-03-26.
$7,782 with Army for Electrical Hardware and Supplies. Signed on 2006-05-16. Completion date: 2006-05-31.
$5,059, same as above.Signed on 2003-03-25. Completion date: 2003-04-21.
$4,197 with Army for ADP Support Equipment. Signed on 2005-03-21. Completion date: 2005-04-21.
OFFICE DESIGNS INC (28295 SCHOENHERR; small business)
$26,096 with Army for Construction of Structures and Facilities -- Office Buildings. Signed on 2001-05-11. Completion date: 2001-07-16.
WOODHAVEN ENTERPRISES (32035 VAN DYKE AVE; small business) : $24,901 in 4 contractsfrom 2005 to 2006
$12,403 with Army for Lodging - Hotel/Motel. Signed on 2005-07-13. Completion date: 2005-07-21.
$4,414, same as above.Signed on 2006-06-29. Completion date: 2006-07-04.
$4,097, same as above.Signed on 2005-06-03. Completion date: 2005-06-05.
$3,987, same as above.Signed on 2005-05-18. Completion date: 2005-05-15.
LEO R BIENIEK (29239 NORMA; small business) : $17,000 in 3 contractsfrom 2004 to 2006
$6,000 with Army for Other Professional Services. Signed on 2006-02-06. Completion date: 2005-03-22.
$6,000, same as above.Signed on 2005-02-07. Completion date: 2005-03-22.
$5,000, same as above.Signed on 2004-03-22. Completion date: 2005-03-22.
DOMINIC ROSSI FR (28103 IMPERIAL DR APT 101; small business) : $15,225 in 5 contractsfrom 2003 to 2005
Contracts for Chaplain Services by Army Signed by year:2000: $0; 2001: $0; 2002: $0; 2003: $7,400; 2004: $3,700; 2005: $4,125; 2006: $0.
Biggest contracts:
$4,125 with Army for Chaplain Services. Signed on 2005-10-06. Completion date: 2006-09-30.
$3,700, same as above.Signed on 2004-11-01. Completion date: 2004-10-01.
$3,700, same as above.Signed on 2003-10-01. Completion date: 2004-09-30.
$3,700, same as above.Signed on 2003-11-14. Completion date: 2004-09-30.
BOOZ ALLEN HAMILTON INC (31201 CHICAGO ROAD)
$4,960 with Army for Other Professional Services. Signed on 2004-03-10. Completion date: 2004-04-01.
BRUSH WELLMAN INC (27555 COLLEGE PARK DR) : $4,930 in 3 contractsin 2005
$3,471 with Navy for Bars and Rods, Nonferrous Base Metal. Signed on 2005-09-24. Completion date: 2005-09-29.
$896, same as above.Signed on 2005-01-04. Completion date: 2005-01-31.
$563, same as above.Signed on 2005-03-31. Completion date: 2005-04-28.
Top industries in this zip code by the number of employees in 2005:
Administrative and Support and Waste Management and Remediation Services: Temporary Help Services (500-999 employees: 1 establishment, 250-499 employees: 1 establishment, 100-249 employees: 3 establishments, 20-49 employees: 3 establishments, 1-4 employees: 3 establishments)
Administrative and Support and Waste Management and Remediation Services: Security Guards and Patrol Services (over 1000: 1, 1-4: 2)
Health Care and Social Assistance: Offices of Physicians (except Mental Health Specialists) (100-249: 3, 50-99: 2, 20-49: 4, 10-19: 21, 5-9: 15, 1-4: 22)
2002 - 2018 National Fire Incident Reporting System (NFIRS) incidents
According to the data from the years 2002 - 2018 the average number of fire incidents per year is 45. The highest number of reported fires - 70 took place in 2005, and the least - 28 in 2018. The data has a declining trend.
When looking into fire subcategories, the most incidents belonged to: Structure Fires (50.4%), and Mobile Property/Vehicle Fires (24.5%).
Fire incident types reported to NFIRS in Zip Code 48093


 Nearest zip codes: 48397, 48088, 48015, 48092, 48312, 48089.
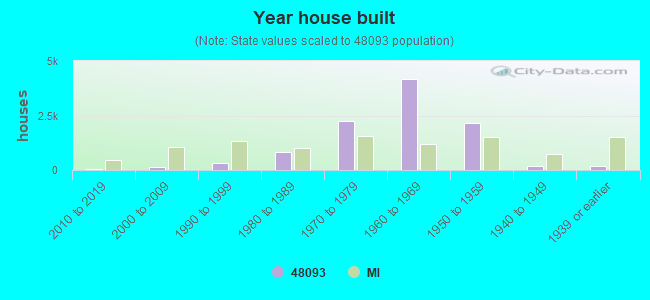


 According to the data from the years 2002 - 2018 the average number of fire incidents per year is 45. The highest number of reported fires - 70 took place in 2005, and the least - 28 in 2018. The data has a declining trend.
 When looking into fire subcategories, the most incidents belonged to: Structure Fires (50.4%), and Mobile Property/Vehicle Fires (24.5%).