Whitesburg, TN (Tennessee) Houses and Residents
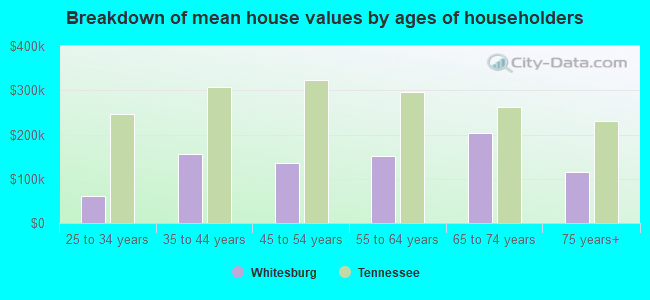
| Whitesburg: | $205,281 |
| Tennessee: | $284,800 |
Total population: 4,777 (Urban population: 557, Rural population: 3,935 (249 farm, 3,686 nonfarm))
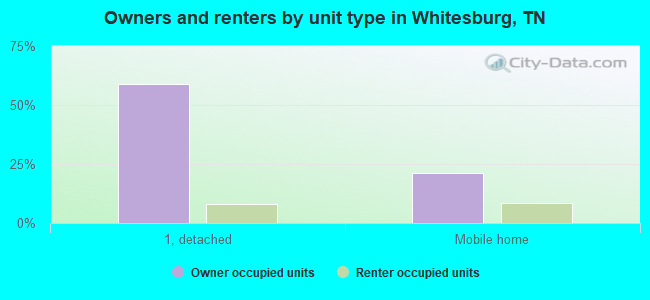
Houses: 1,884 (1,788 occupied: 1,456 owner occupied, 332 renter occupied)
| % of renters here: | 19% |
| State: | 33% |
Housing density: 41 houses/condos per square mile
Median price asked for vacant for-sale houses and condos in 2022 in this county: $148,744.
Median contract rent in 2022: $556 (lower quartile is $476, upper quartile is $627)
Median rent asked for vacant for-rent units in 2022: $402
Median gross rent in Whitesburg, TN in 2022: $706
Housing units in Whitesburg with a mortgage: 432 (64 second mortgage, 59 home equity loan, 0 both second mortgage and home equity loan)
Houses without a mortgage: 410
Compare current foreclosures near Whitesburg, TN:
| Photo | Address | Area | Beds / Baths | Price | Details |
|---|---|---|---|---|---|

|
#1
Wilburn Rd
Whitesburg, TN 37891
|
1,024 sq. feet
|
1 baths - beds |
show details | |

|
#2
Warrensburg Rd
Whitesburg, TN 37891
|
1,350 sq. feet
|
2 baths - beds |
show details | |

|
#3
Elijah Martin Rd
Whitesburg, TN 37891
|
1,651 sq. feet
|
2 baths - beds |
show details | |

|
#4
E Andrew Johnson Hwy
Whitesburg, TN 37891
|
1,672 sq. feet
|
2 baths - beds |
show details | |

|
#5
Saint Clair Rd
Whitesburg, TN 37891
|
1,200 sq. feet
|
1 baths - beds |
show details | |

|
#6
E Andrew Johnson Hwy
Whitesburg, TN 37891
|
988 sq. feet
|
1 baths - beds |
show details | |

|
#7
Lainey Jane Ct
Whitesburg, TN 37891
|
- sq. feet
|
- baths - beds |
show details | |

|
#8
Rosedale Ave
Morristown, TN 37813
|
792 sq. feet
|
1 baths 2 beds |
$165,000
|
show details |

|
#9
Weems Chapel Cv
Mosheim, TN 37818
|
1,232 sq. feet
|
2 baths 3 beds |
show details | |

|
#10
Cherrybrook Ln
Talbott, TN 37877
|
1,400 sq. feet
|
2 baths 3 beds |
show details |
| Photo | Address | Area | Beds / Baths | Price | Details |
|---|---|---|---|---|---|

|
#11
Highway 25 32
White Pine, TN 37890
|
1,428 sq. feet
|
1 baths 3 beds |
show details | |

|
#12
W 6th North St
Morristown, TN 37814
|
2,112 sq. feet
|
2 baths 3 beds |
show details | |

|
#13
Briar Thicket Rd
Bybee, TN 37713
|
2,406 sq. feet
|
2 baths 3 beds |
show details | |

|
#14
Le Conte St
Morristown, TN 37814
|
2,049 sq. feet
|
2 baths 2 beds |
show details | |

|
#15
Blair St
Morristown, TN 37814
|
672 sq. feet
|
1 baths - beds |
show details | |

|
#16
Crestview Dr
Talbott, TN 37877
|
2,100 sq. feet
|
1 baths - beds |
show details | |

|
#17
Moores Chapel Rd
Bean Station, TN 37708
|
1,400 sq. feet
|
2 baths - beds |
show details | |

|
#18
Bud Shelton Ln
Midway, TN 37809
|
1,080 sq. feet
|
2 baths - beds |
show details | |

|
#19
Tom Treece Rd
Morristown, TN 37814
|
1,152 sq. feet
|
2 baths - beds |
show details | |

|
#20
Cherokee Dr
Morristown, TN 37814
|
1,233 sq. feet
|
1 baths - beds |
show details |
| Photo | Address | Area | Beds / Baths | Price | Details |
|---|---|---|---|---|---|

|
#21
Dulaney Rd
Greeneville, TN 37743
|
1,780 sq. feet
|
1 baths - beds |
show details | |

|
#22
Pine Barren Dr
Morristown, TN 37814
|
2,294 sq. feet
|
2 baths - beds |
show details | |

|
#23
Clemons Ln
Bean Station, TN 37708
|
821 sq. feet
|
1 baths - beds |
show details | |

|
#24
Midridge Dr
Morristown, TN 37814
|
2,466 sq. feet
|
2 baths - beds |
show details | |

|
#25
E Mckinney Ave
Rogersville, TN 37857
|
1,224 sq. feet
|
2 baths - beds |
show details | |

|
#26
Blackberry Ln
Morristown, TN 37814
|
1,624 sq. feet
|
2 baths - beds |
show details | |

|
#27
N Circle Dr
Morristown, TN 37813
|
792 sq. feet
|
1 baths - beds |
show details | |

|
#28
Cedar Hills Ln
Rogersville, TN 37857
|
1,086 sq. feet
|
1 baths - beds |
show details | |

|
#29
Seven Oaks Dr
Morristown, TN 37814
|
2,340 sq. feet
|
2 baths - beds |
show details | |

|
#30
Ellis St
Bean Station, TN 37708
|
1,820 sq. feet
|
2 baths - beds |
show details |
| Photo | Address | Area | Beds / Baths | Price | Details |
|---|---|---|---|---|---|

|
#31
Cline Ave
Morristown, TN 37814
|
1,886 sq. feet
|
2 baths - beds |
show details | |

|
#32
Mullins Rd
Russellville, TN 37860
|
1,232 sq. feet
|
2 baths - beds |
show details | |

|
#33
Butcher Valley Rd
Rogersville, TN 37857
|
888 sq. feet
|
3 baths - beds |
show details | |

|
#34
Mcneil Cir
Mooresburg, TN 37811
|
1,469 sq. feet
|
1 baths - beds |
show details | |

|
#35
Kirkham Rd
Bean Station, TN 37708
|
1,092 sq. feet
|
1 baths - beds |
show details | |

|
#36
Elmer Hayes Rd
Mosheim, TN 37818
|
1,344 sq. feet
|
1 baths - beds |
show details | |

|
#37
Buell St
Talbott, TN 37877
|
1,850 sq. feet
|
1 baths - beds |
show details | |

|
#38
Lennie Ave
Morristown, TN 37813
|
1,152 sq. feet
|
1 baths - beds |
show details | |

|
#39
Bernie Cir
Talbott, TN 37877
|
1,431 sq. feet
|
2 baths - beds |
show details | |

|
#40
Union Ave
Morristown, TN 37813
|
949 sq. feet
|
1 baths - beds |
show details |
| Photo | Address | Area | Beds / Baths | Price | Details |
|---|---|---|---|---|---|

|
#41
Collinson Ford Rd
Morristown, TN 37814
|
2,592 sq. feet
|
2 baths - beds |
show details | |

|
#42
Pike Rd
Greeneville, TN 37745
|
1,188 sq. feet
|
2 baths - beds |
show details | |

|
#43
Tilley Rd
Talbott, TN 37877
|
2,080 sq. feet
|
2 baths - beds |
show details | |

|
#44
Cain Mill Rd
Russellville, TN 37860
|
2,418 sq. feet
|
2 baths - beds |
show details | |

|
#45
Shady Glen Ln
Rutledge, TN 37861
|
560 sq. feet
|
1 baths - beds |
show details | |

|
#46
Brooks Dr
Talbott, TN 37877
|
1,183 sq. feet
|
1 baths - beds |
show details | |

|
#47
Goodwater Rd
Bybee, TN 37713
|
2,304 sq. feet
|
4 baths - beds |
show details | |

|
#48
Tuggle Hill Rd
Rogersville, TN 37857
|
956 sq. feet
|
3 baths - beds |
show details | |

|
#49
Douglas St
White Pine, TN 37890
|
1,128 sq. feet
|
1 baths - beds |
show details | |

|
Check over 1 million property listings on Foreclosure.com!
|
browse all offers | |||

Household type by relationship:
Households: 61,626- In family households: 52,754 (12,150 male householders, 5,011 female householders)
12,599 spouses, 17,020 children (15,529 natural, 484 adopted, 1,007 stepchildren), 1,915 grandchildren, 610 brothers or sisters, 472 parents, foster children, 1,008 other relatives, 1,545 non-relatives
- In nonfamily households: 8,872 (3,259 male householders (2,585 living alone)), 4,140 female householders (3,716 living alone)), 1,473 nonrelatives
- In group quarters: 918 (763 institutionalized population)
8,953 married couples with children.
2,932 single-parent households (632 men, 2,300 women).
98.4% of residents of Whitesburg speak English at home.
0.4% of residents speak Spanish at home (100% speak English very well).
1.3% of residents speak other Indo-European language at home (44% speak English very well, 26% speak English well, 30% speak English not well).
Foreign born population: 35 (0.7%)
(48.6% of them are naturalized citizens)
| Here: | 6.3 |
| State: | 6.5 |
| Here: | 4.2 |
| State: | 4.4 |
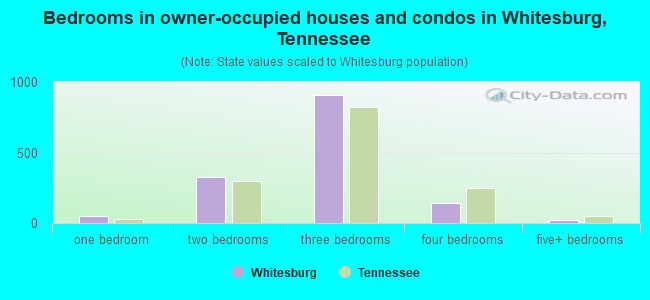
- Bedrooms in owner-occupied houses and condos in Whitesburg, Tennessee
- 6no bedroom
- 481 bedroom
- 3282 bedrooms
- 9093 bedrooms
- 1454 bedrooms
- 205+ bedrooms
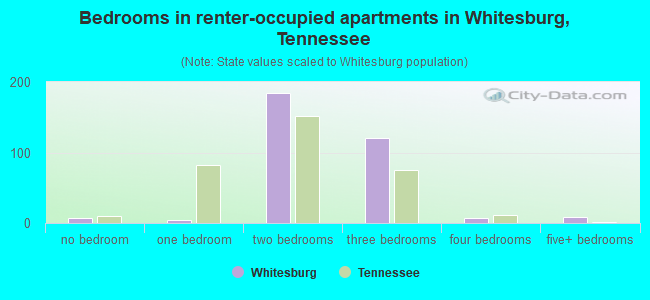
- Bedrooms in renter-occupied apartments in Whitesburg, Tennessee
- 7no bedroom
- 41 bedroom
- 1852 bedrooms
- 1213 bedrooms
- 74 bedrooms
- 85+ bedrooms
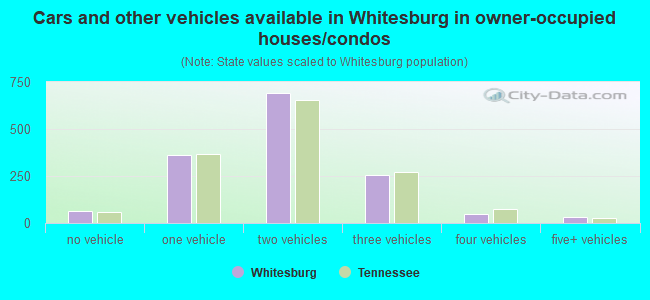
- Cars and other vehicles available in Whitesburg in owner-occupied houses/condos
- 65no vehicle
- 3601 vehicle
- 6912 vehicles
- 2573 vehicles
- 504 vehicles
- 335+ vehicles
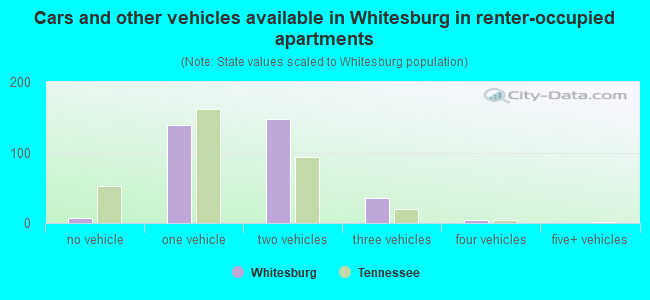
- Cars and other vehicles available in Whitesburg in renter-occupied apartments
- 7no vehicle
- 1391 vehicle
- 1472 vehicles
- 353 vehicles
- 44 vehicles
- 05+ vehicles
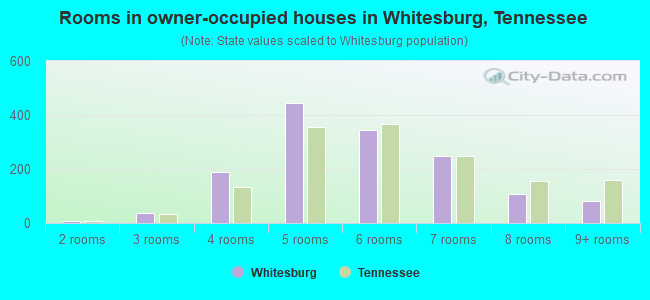
- Rooms in owner-occupied houses in Whitesburg, Tennessee
- 01 room
- 62 rooms
- 373 rooms
- 1884 rooms
- 4455 rooms
- 3436 rooms
- 2487 rooms
- 1098 rooms
- 809+ rooms
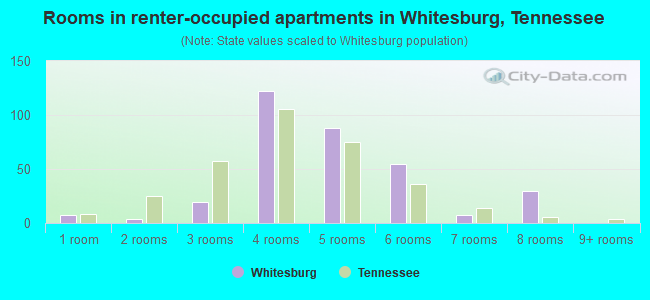
- Rooms in renter-occupied apartments in Whitesburg, Tennessee
- 71 room
- 42 rooms
- 193 rooms
- 1224 rooms
- 885 rooms
- 556 rooms
- 77 rooms
- 308 rooms
- 09+ rooms
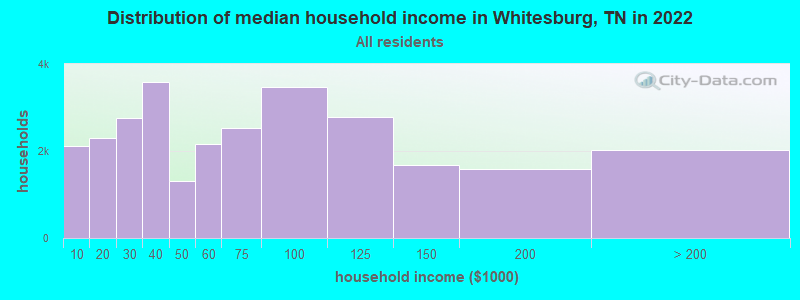
Whitesburg, TN household income distribution

- 2,104Less than $10,000
- 2,307$10,000 to $19,999
- 2,758$20,000 to $29,999
- 3,579$30,000 to $39,999
- 1,319$40,000 to $49,999
- 2,169$50,000 to $59,999
- 2,534$60,000 to $74,999
- 3,479$75,000 to $99,999
- 2,791$100,000 to $124,999
- 1,682$125,000 to $149,999
- 1,577$150,000 to $199,999
- 2,028$200,000 or more
Percentage of workers working in this county: 71.7%
Number of people working at home: 258 (10.5% of all workers)
Travel time to work (commute)
- Less than 5 minutes: 72
- 5 to 9 minutes: 248
- 10 to 14 minutes: 382
- 15 to 19 minutes: 396
- 20 to 24 minutes: 279
- 25 to 29 minutes: 153
- 30 to 34 minutes: 302
- 35 to 39 minutes: 42
- 40 to 44 minutes: 40
- 45 to 59 minutes: 40
- 60 to 89 minutes: 83
- 90 or more minutes: 35
Means of transportation to work:
- Drove a car alone: 1,774 (83.4%)
- Carpooled: 260 (12.2%)
- Walked: 38 (1.8%)
- Worked at home: 56 (2.6%)
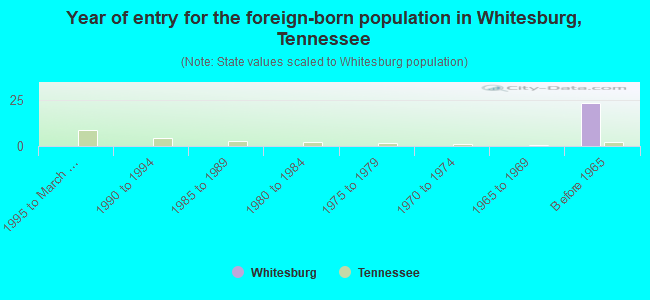
- Year of entry for the foreign-born population in Whitesburg, Tennessee
- 01995 to March 2000
- 01990 to 1994
- 01985 to 1989
- 01980 to 1984
- 01975 to 1979
- 01970 to 1974
- 01965 to 1969
- 23Before 1965
Most common places of birth for foreign-born residents (%):
| Whitesburg: | 65.2% (15) |
| Tennessee: | 4.4% (6,981) |
| Whitesburg: | 34.8% (8) |
| Tennessee: | 3.6% (5,726) |
Place of birth for U.S.-born residents:
- This state: 3,585
- Other state: 868
- Northeast: 77
- Midwest: 242
- South: 476
- West: 73
67% of Whitesburg residents lived in the same house 5 years ago.
Out of people who lived in different houses, 61% lived in this county.
Out of people who lived in different counties, 53% lived in Tennessee.
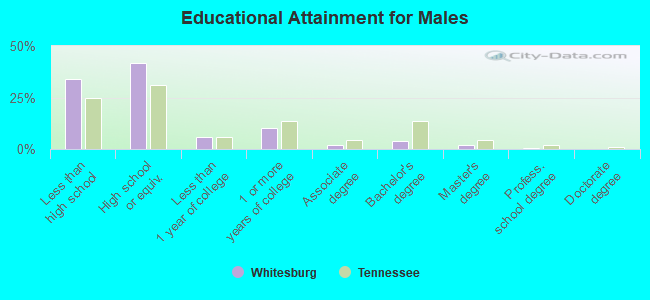
Education attainment for males 25 years and older:
- No schooling: 5
- Nursery to 4th grade: 23
- 5th and 6th grade: 31
- 7th and 8th grade: 201
- 9th grade: 60
- 10th grade: 93
- 11th grade: 38
- 12th grade, no diploma: 77
- High school graduate (or equivalency): 644
- Less than 1 year of college: 93
- Some college more than 1 year, no degree: 155
- Associate degree: 29
- Bachelor's degree: 58
- Master's degree: 31
- Professional school degree: 6
- Doctorate degree: 0
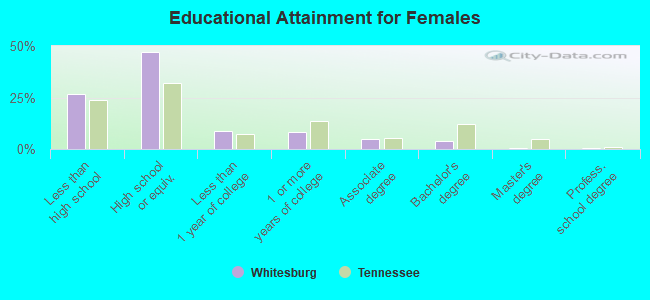
Education attainment for females 25 years and older:
- No schooling: 15
- Nursery to 4th grade: 0
- 5th and 6th grade: 51
- 7th and 8th grade: 130
- 9th grade: 85
- 10th grade: 78
- 11th grade: 26
- 12th grade, no diploma: 34
- High school graduate (or equivalency): 741
- Less than 1 year of college: 136
- Some college more than 1 year, no degree: 134
- Associate degree: 76
- Bachelor's degree: 59
- Master's degree: 9
- Professional school degree: 7
- Doctorate degree: 0


Housing units in structures:
- One, detached: 1,264
- One, attached: 27
- Two: 36
- 5 to 9: 7
- Mobile homes: 550
Median worth of mobile homes: $101,060
Housing units lacking complete kitchen facilities: 1.4%
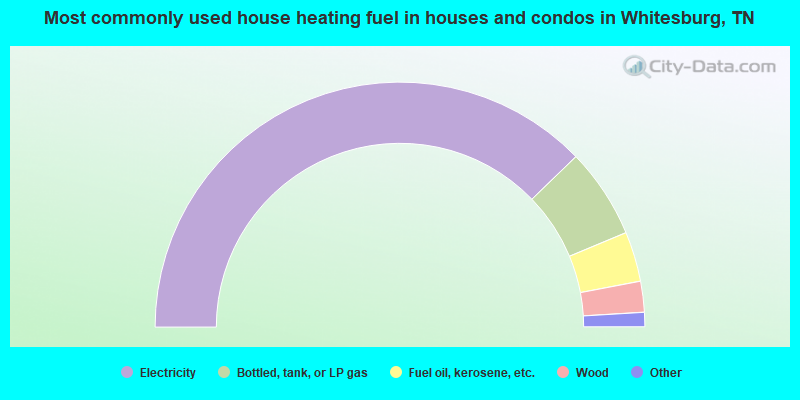
- 75.6%Electricity
- 11.9%Bottled, tank, or LP gas
- 6.6%Fuel oil, kerosene, etc.
- 4.1%Wood
- 1.2%Utility gas
- 0.6%Coal or coke
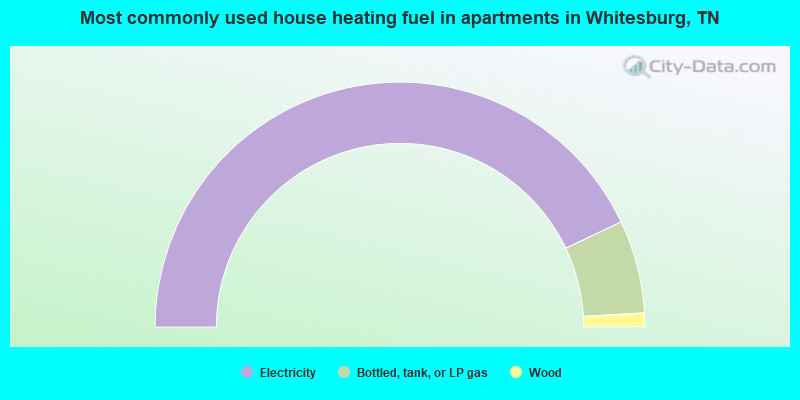
- 85.8%Electricity
- 12.3%Bottled, tank, or LP gas
- 1.8%Wood
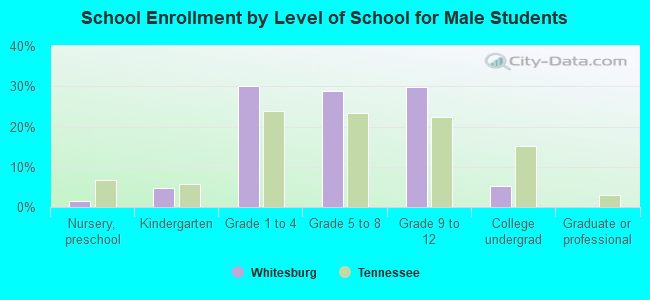
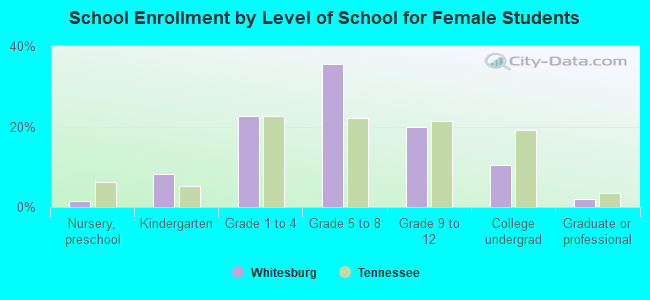
Private vs. public school enrollment:
| Here: | 1.2% |
| Tennessee: | 9.5% |
| Here: | 0.0% |
| Tennessee: | 10.4% |
| Here: | 17.6% |
| Tennessee: | 22.8% |