Flatgap, Kentucky (KY) income map, earnings map, and wages data
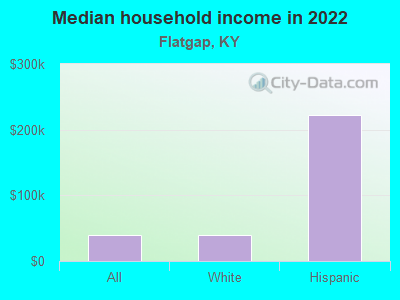
The median household income in Flatgap, KY in 2022 was $40,144, which was 47.8% less than the median annual income of $59,341 across the entire state of Kentucky. Compared to the median income of $22,750 in 2000 this represents an increase of 43.3%. The per capita income in 2022 was $24,297, which means an increase of 47.0% compared to 2000 when it was $12,884.
Income statistics for all residents
Median household income in Flatgap, KY in 2022:| Flatgap: | $40,144 |
| Kentucky: | $59,341 |
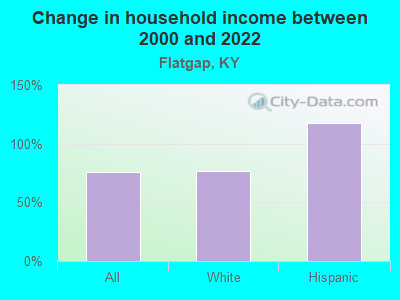
Change in median household income between 2000 and 2022:| Flatgap, Kentucky: | +76.5% |
| State: | +76.2% |
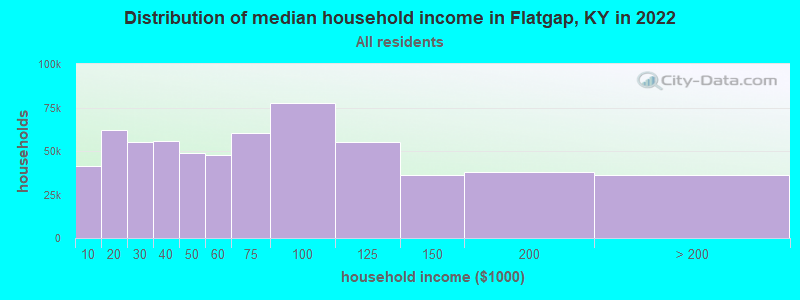
Number of households with income < $10k:| Flatgap: | 6.8% (41,599) |
| State: | 6.8% (123,697) |
Number of households with income $10k - 20k:| Flatgap: | 10.0% (61,791) |
| State: | 10.0% (182,645) |
Number of households with income $20k - 30k:| Flatgap: | 9.0% (55,286) |
| State: | 9.0% (164,092) |
Number of households with income $30k - 40k:| Flatgap: | 9.1% (55,969) |
| Kentucky: | 9.1% (165,607) |
Number of households with income $40k - 50k:| Flatgap: | 8.0% (49,014) |
| State: | 8.0% (146,315) |
Number of households with income $50k - 60k:| Flatgap: | 7.7% (47,506) |
| Kentucky: | 7.7% (140,671) |
Number of households with income $60k - 75k:| Flatgap: | 9.8% (60,382) |
| State: | 9.8% (180,002) |
Number of households with income $75k - 100k:| Flatgap: | 12.6% (77,610) |
| Kentucky: | 12.6% (230,239) |
Number of households with income $100k - 125k:| Flatgap: | 9.0% (55,419) |
| State: | 9.0% (164,398) |
Number of households with income $125k - 150k:| Flatgap: | 5.9% (36,446) |
| State: | 5.9% (108,602) |
Number of households with income $150k - 200k:| Flatgap: | 6.1% (37,758) |
| State: | 6.2% (112,813) |
Number of households with income > $200k:| Flatgap: | 5.9% (36,445) |
| State: | 6.0% (109,599) |
Aggregate household income in Flatgap in 2022: $1,205,437,503
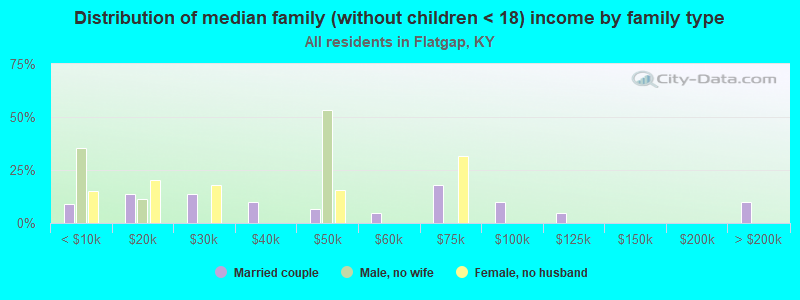
Median family income in Flatgap in 2022:| Flatgap: | $50,633 |
| State: | $76,119 |
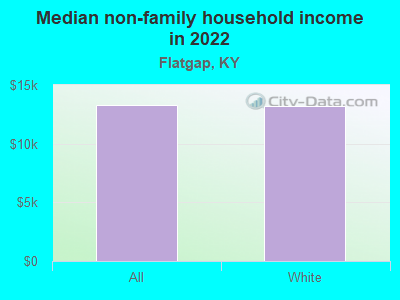
Median non-family income in Flatgap in 2022:| Flatgap: | $13,280 |
| State: | $33,993 |
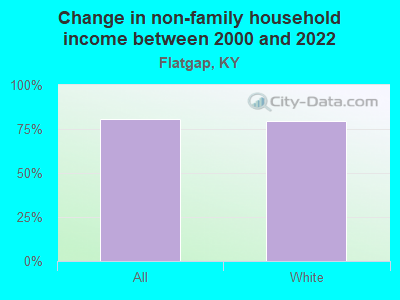
Change in median non-family income between 2000 and 2022:| Flatgap, Kentucky: | +80.5% |
| State: | +79.2% |
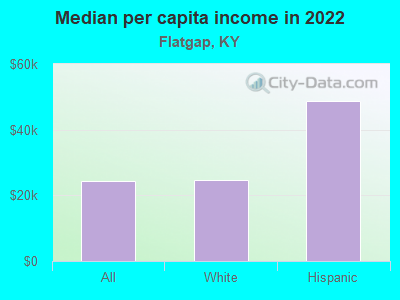
Median per capita income in Flatgap in 2022:| Flatgap: | $24,298 |
| Kentucky: | $33,980 |
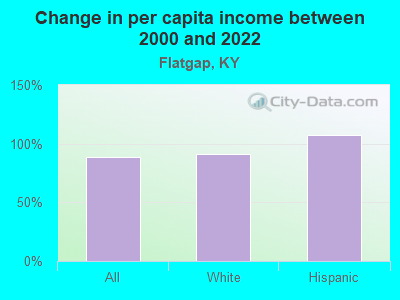
Change in median per capita income between 2000 and 2022:| Flatgap, Kentucky: | +88.6% |
| State: | +87.8% |
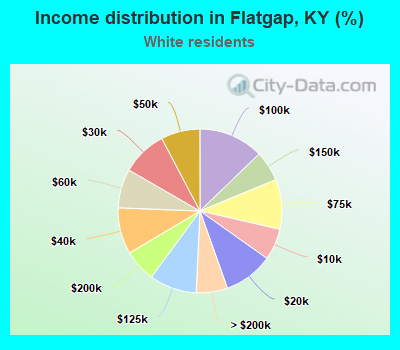
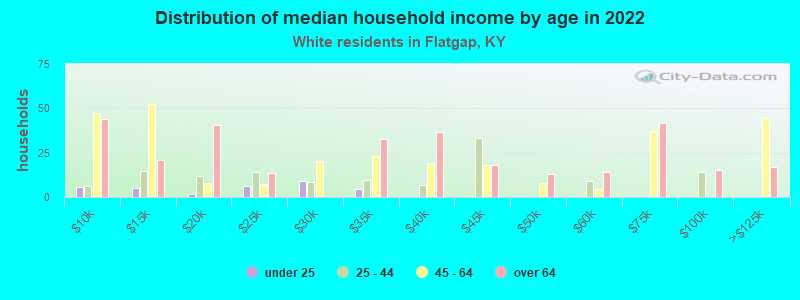
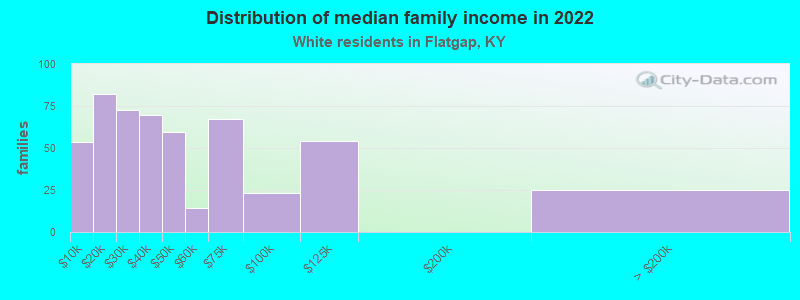
Income statistics for White residents
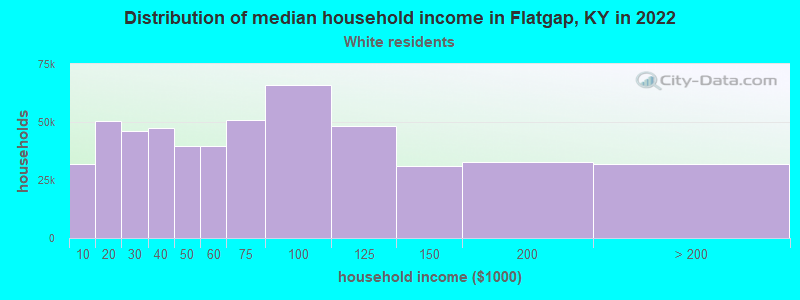
Median household income in Flatgap, KY in 2022:| Flatgap: | $40,187 |
| State: | $60,987 |
Change in median household income between 2000 and 2022:| Flatgap, Kentucky: | +76.6% |
| State: | +76.2% |
Number of households with income < $10k:| Flatgap: | 6.2% (32,095) |
| State: | 6.2% (96,690) |
Number of households with income $10k - 20k:| Flatgap: | 9.8% (50,405) |
| State: | 9.7% (151,125) |
Number of households with income $20k - 30k:| Flatgap: | 9.0% (46,262) |
| Kentucky: | 8.9% (139,532) |
Number of households with income $30k - 40k:| Flatgap: | 9.1% (47,231) |
| State: | 9.1% (142,284) |
Number of households with income $40k - 50k:| Flatgap: | 7.7% (39,800) |
| State: | 7.7% (121,151) |
Number of households with income $50k - 60k:| Flatgap: | 7.7% (39,810) |
| State: | 7.7% (119,790) |
Number of households with income $60k - 75k:| Flatgap: | 9.8% (50,686) |
| Kentucky: | 9.9% (154,174) |
Number of households with income $75k - 100k:| Flatgap: | 12.8% (66,044) |
| Kentucky: | 12.8% (199,740) |
Number of households with income $100k - 125k:| Flatgap: | 9.4% (48,286) |
| State: | 9.4% (146,284) |
Number of households with income $125k - 150k:| Flatgap: | 6.0% (30,941) |
| State: | 6.0% (94,180) |
Number of households with income $150k - 200k:| Flatgap: | 6.4% (32,939) |
| Kentucky: | 6.4% (100,702) |
Number of households with income > $200k:| Flatgap: | 6.2% (31,878) |
| Kentucky: | 6.3% (98,502) |
Aggregate household income in Flatgap in 2022: $1,049,868,691
Median family income in Flatgap in 2022:| Flatgap: | $51,346 |
| Kentucky: | $78,353 |
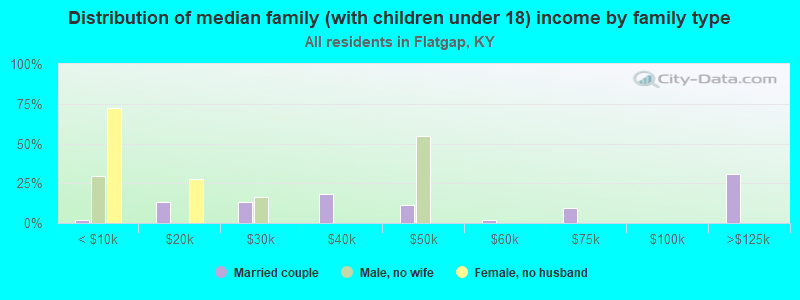
Number of families with income < $10k:| Flatgap: | 10.2% (53) |
| State: | 3.7% (37,075) |
Number of families with income $10k - 20k:| Flatgap: | 15.8% (82) |
| Kentucky: | 4.9% (49,864) |
Number of families with income $20k - 30k:| Flatgap: | 13.9% (73) |
| State: | 6.4% (64,043) |
Number of families with income $30k - 40k:| Flatgap: | 13.3% (69) |
| State: | 8.0% (81,080) |
Number of families with income $40k - 50k:| Flatgap: | 11.5% (60) |
| State: | 6.9% (69,099) |
Number of families with income $50k - 60k:| Flatgap: | 2.8% (14) |
| State: | 7.2% (72,955) |
Number of families with income $60k - 75k:| Flatgap: | 12.9% (67) |
| Kentucky: | 10.4% (104,587) |
Number of families with income $75k - 100k:| Flatgap: | 4.4% (23) |
| State: | 15.0% (151,545) |
Number of families with income $100k - 125k:| Flatgap: | 10.4% (54) |
| State: | 11.9% (120,340) |
Number of families with income > $200k:| Flatgap: | 4.8% (25) |
| Kentucky: | 8.6% (86,849) |
Median non-family income in Flatgap in 2022:| Flatgap: | $13,218 |
| State: | $34,415 |
Change in median non-family income between 2000 and 2022:| Flatgap, Kentucky: | +79.7% |
| Kentucky: | +78.3% |
Median per capita income in Flatgap in 2022:| Flatgap: | $24,714 |
| State: | $35,352 |
Change in median per capita income between 2000 and 2022:| Flatgap, Kentucky: | +90.9% |
| Kentucky: | +90.2% |
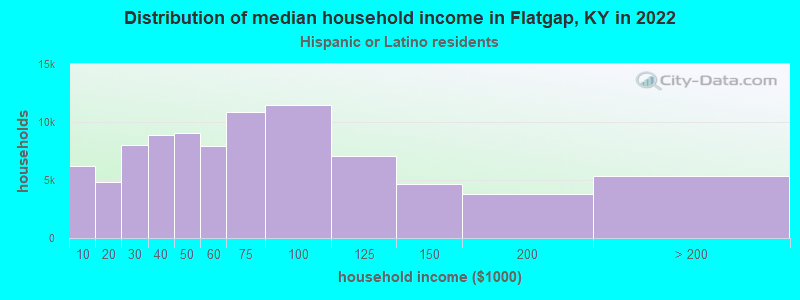
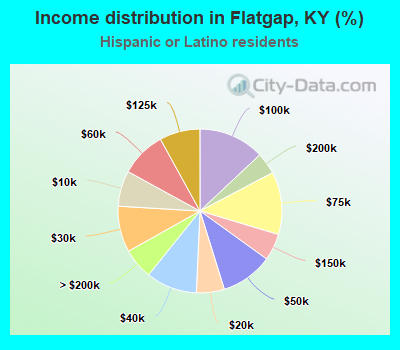
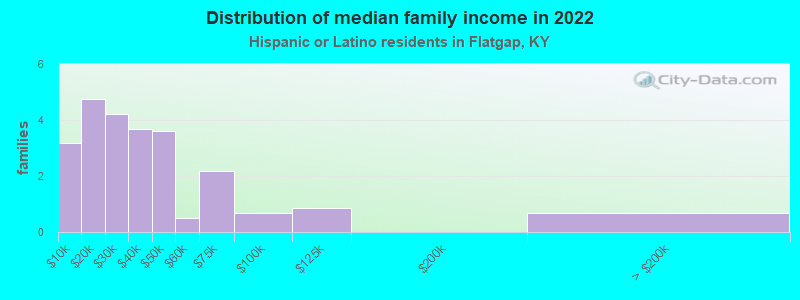
Income statistics for Hispanic or Latino residents
Median household income in Flatgap, KY in 2022:| Flatgap: | $222,766 |
| Kentucky: | $57,971 |
Change in median household income between 2000 and 2022:| Flatgap, Kentucky: | +117.8% |
| State: | +96.2% |
Number of households with income < $10k:| Flatgap: | 7.0% (6,182) |
| Kentucky: | 7.0% (3,568) |
Number of households with income $10k - 20k:| Flatgap: | 5.5% (4,835) |
| State: | 5.5% (2,811) |
Number of households with income $20k - 30k:| Flatgap: | 9.1% (7,980) |
| State: | 9.1% (4,637) |
Number of households with income $30k - 40k:| Flatgap: | 10.1% (8,850) |
| State: | 10.0% (5,109) |
Number of households with income $40k - 50k:| Flatgap: | 10.3% (9,018) |
| Kentucky: | 10.3% (5,241) |
Number of households with income $50k - 60k:| Flatgap: | 9.0% (7,919) |
| State: | 9.1% (4,609) |
Number of households with income $60k - 75k:| Flatgap: | 12.4% (10,862) |
| State: | 12.4% (6,299) |
Number of households with income $75k - 100k:| Flatgap: | 13.0% (11,424) |
| Kentucky: | 12.9% (6,562) |
Number of households with income $100k - 125k:| Flatgap: | 8.0% (7,037) |
| State: | 8.0% (4,066) |
Number of households with income $125k - 150k:| Flatgap: | 5.3% (4,661) |
| Kentucky: | 5.3% (2,685) |
Number of households with income $150k - 200k:| Flatgap: | 4.3% (3,756) |
| State: | 4.3% (2,173) |
Number of households with income > $200k:| Flatgap: | 6.1% (5,331) |
| State: | 6.1% (3,099) |
Aggregate household income in Flatgap in 2022: $2,560,325
Median family income in Flatgap in 2022:| Flatgap: | $208,034 |
| State: | $58,603 |
Number of families with income < $10k:| Flatgap: | 13.0% (3) |
| State: | 5.3% (1,907) |
Number of families with income $10k - 20k:| Flatgap: | 19.6% (5) |
| State: | 6.4% (2,298) |
Number of families with income $20k - 30k:| Flatgap: | 17.3% (4) |
| Kentucky: | 9.4% (3,414) |
Number of families with income $30k - 40k:| Flatgap: | 15.2% (4) |
| Kentucky: | 11.1% (4,022) |
Number of families with income $40k - 50k:| Flatgap: | 14.9% (4) |
| State: | 11.2% (4,054) |
Number of families with income $50k - 60k:| Flatgap: | 2.0% (0) |
| Kentucky: | 7.2% (2,594) |
Number of families with income $60k - 75k:| Flatgap: | 8.9% (2) |
| Kentucky: | 10.1% (3,652) |
Number of families with income $75k - 100k:| Flatgap: | 2.8% (1) |
| State: | 13.4% (4,856) |
Number of families with income $100k - 125k:| Flatgap: | 3.6% (1) |
| State: | 8.0% (2,906) |
Number of families with income > $200k:| Flatgap: | 2.8% (1) |
| State: | 7.9% (2,856) |
Median per capita income in Flatgap in 2022:| Flatgap: | $48,679 |
| State: | $24,650 |
Change in median per capita income between 2000 and 2022:| Flatgap, Kentucky: | +106.9% |
| Kentucky: | +106.1% |