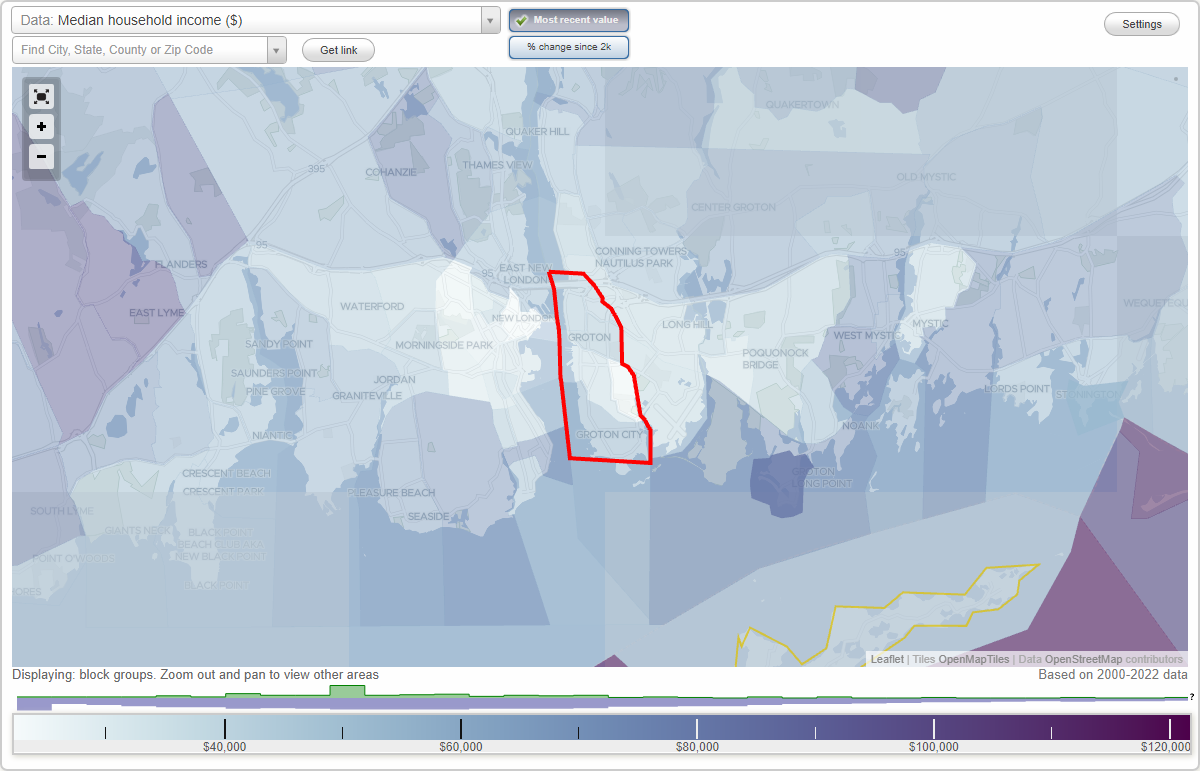
The median household income in Groton, CT in 2022 was $63,333, which was 39.6% less than the median annual income of $88,429 across the entire state of Connecticut. Compared to the median income of $40,515 in 2000 this represents an increase of 36.0%. The per capita income in 2022 was $40,347, which means an increase of 44.9% compared to 2000 when it was $22,239.
Whole page based on the data from 2000 / 2022 when the population of Groton, Connecticut was 10,010 / 9,403
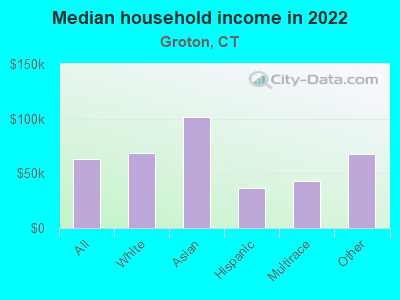
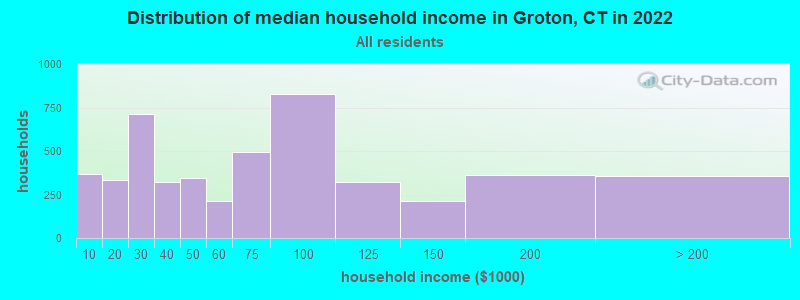
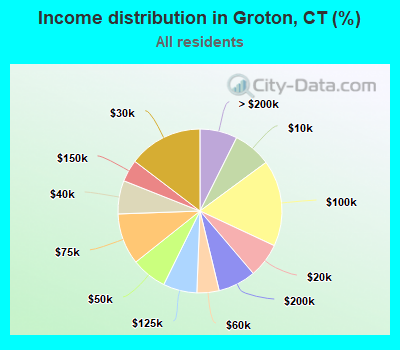
Income statistics for all residents
Median household income in Groton, CT in 2022:
Groton:
$63,333
State:
$88,429
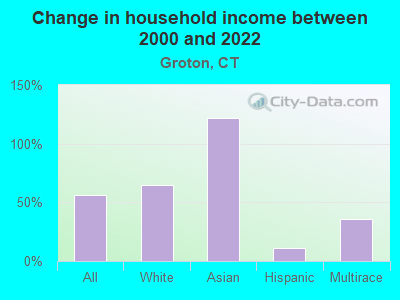
Change in median household income between 2000 and 2022:
Groton, Connecticut:
+56.3%
State:
+64.0%
Number of households with income < $10k:
Groton:
7.5% (366)
State:
5.1% (72,746)
Number of households with income $10k - 20k:
Groton:
6.8% (331)
State:
5.7% (81,643)
Number of households with income $20k - 30k:
Groton:
14.6% (712)
State:
6.5% (92,844)
Number of households with income $30k - 40k:
Groton:
6.6% (321)
State:
5.9% (83,934)
Number of households with income $40k - 50k:
Groton:
7.0% (342)
Connecticut:
5.8% (83,025)
Number of households with income $50k - 60k:
Groton:
4.4% (213)
State:
5.7% (81,788)
Number of households with income $60k - 75k:
Groton:
10.1% (492)
State:
8.1% (115,651)
Number of households with income $75k - 100k:
Groton:
17.1% (830)
Connecticut:
12.6% (180,173)
Number of households with income $100k - 125k:
Groton:
6.7% (324)
Connecticut:
9.9% (141,231)
Number of households with income $125k - 150k:
Groton:
4.3% (211)
Connecticut:
7.9% (112,826)
Number of households with income $150k - 200k:
Groton:
7.5% (364)
Connecticut:
10.8% (154,641)
Number of households with income > $200k:
Groton:
7.4% (359)
State:
16.3% (233,133)
Aggregate household income in Groton in 2022: $378,201,042
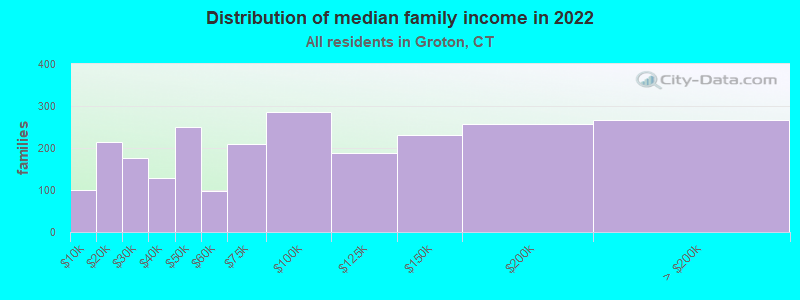
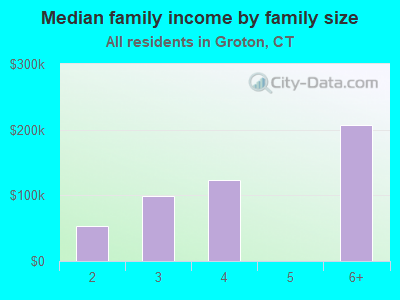
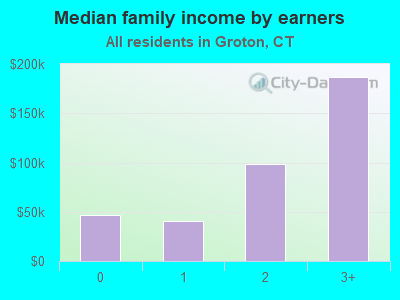
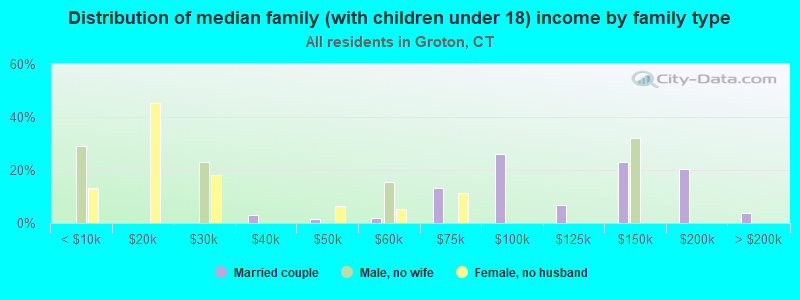
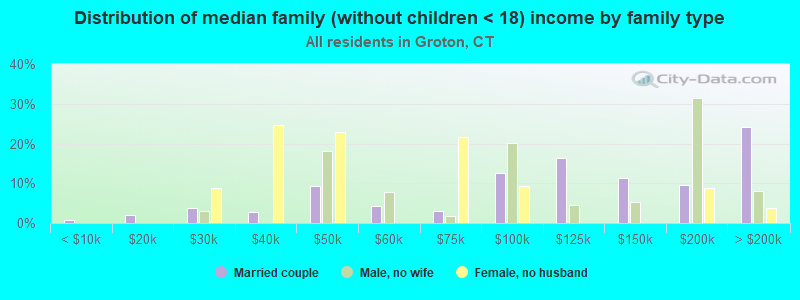
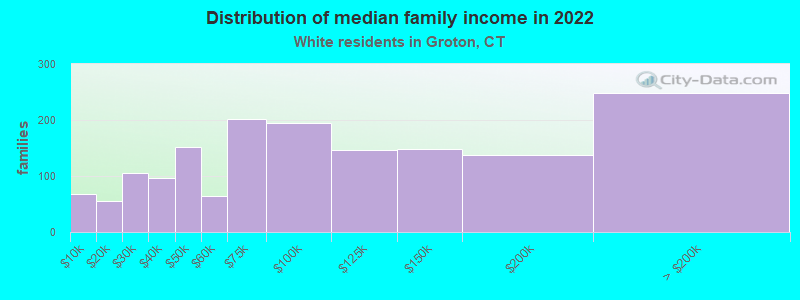
Median family income in Groton in 2022:
Groton:
$83,215
State:
$115,183
Number of families with income < $10k:
Groton:
4.2% (101)
State:
2.6% (23,251)
Number of families with income $10k - 20k:
Groton:
8.9% (214)
State:
2.8% (25,184)
Number of families with income $20k - 30k:
Groton:
7.4% (177)
State:
4.1% (36,835)
Number of families with income $30k - 40k:
Groton:
5.3% (128)
State:
4.2% (38,052)
Number of families with income $40k - 50k:
Groton:
10.4% (250)
State:
4.8% (43,104)
Number of families with income $50k - 60k:
Groton:
4.1% (98)
Connecticut:
4.8% (43,284)
Number of families with income $60k - 75k:
Groton:
8.7% (210)
Connecticut:
7.4% (66,521)
Number of families with income $75k - 100k:
Groton:
11.9% (286)
State:
12.9% (116,232)
Number of families with income $100k - 125k:
Groton:
7.8% (188)
State:
10.6% (95,504)
Number of families with income $125k - 150k:
Groton:
9.6% (232)
State:
9.5% (86,149)
Number of families with income $150k - 200k:
Groton:
10.7% (257)
Connecticut:
14.0% (125,908)
Number of families with income > $200k:
Groton:
11.1% (267)
State:
22.4% (202,515)
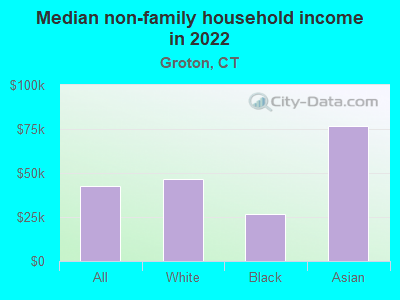
Median non-family income in Groton in 2022:
Groton:
$42,332
State:
$50,964
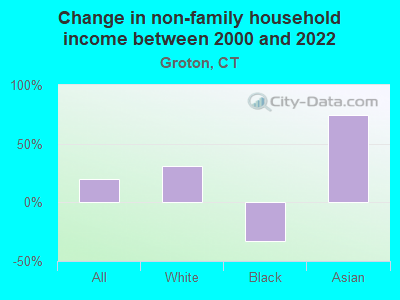
Change in median non-family income between 2000 and 2022:
Groton, Connecticut:
+19.5%
State:
+65.1%
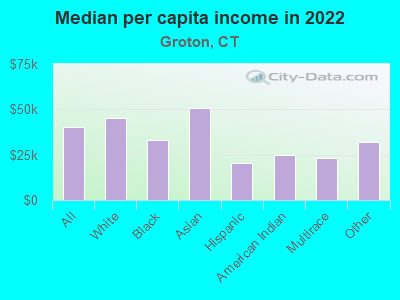
Median per capita income in Groton in 2022:
Groton:
$40,348
State:
$51,581
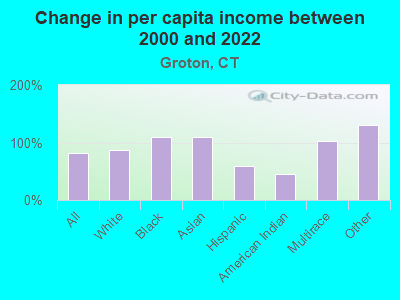
Change in median per capita income between 2000 and 2022:
Groton, Connecticut:
+81.4%
State:
+79.3%
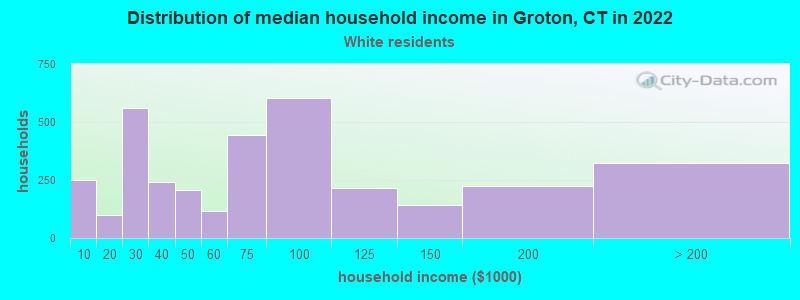
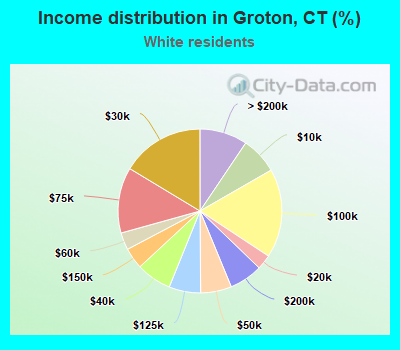
Income statistics for White residents
Median household income in Groton, CT in 2022:
Groton:
$68,876
Connecticut:
$96,890
Change in median household income between 2000 and 2022:
Groton, Connecticut:
+65.1%
State:
+68.5%
Number of households with income < $10k:
Groton:
7.3% (250)
Connecticut:
4.2% (42,265)
Number of households with income $10k - 20k:
Groton:
2.9% (101)
State:
4.8% (48,323)
Number of households with income $20k - 30k:
Groton:
16.4% (562)
Connecticut:
5.7% (57,716)
Number of households with income $30k - 40k:
Groton:
7.0% (240)
State:
5.3% (53,827)
Number of households with income $40k - 50k:
Groton:
6.1% (209)
State:
5.3% (53,301)
Number of households with income $50k - 60k:
Groton:
3.4% (117)
State:
5.5% (55,690)
Number of households with income $60k - 75k:
Groton:
13.0% (446)
State:
8.0% (80,329)
Number of households with income $75k - 100k:
Groton:
17.6% (604)
State:
12.7% (128,070)
Number of households with income $100k - 125k:
Groton:
6.3% (215)
State:
10.0% (101,210)
Number of households with income $125k - 150k:
Groton:
4.2% (143)
Connecticut:
8.0% (81,250)
Number of households with income $150k - 200k:
Groton:
6.6% (226)
State:
11.8% (119,527)
Number of households with income > $200k:
Groton:
9.4% (324)
State:
18.6% (187,875)
Aggregate household income in Groton in 2022: $283,308,836
Median family income in Groton in 2022:
Groton:
$86,812
State:
$128,955
Number of families with income < $10k:
Groton:
4.1% (67)
Connecticut:
1.9% (11,537)
Number of families with income $10k - 20k:
Groton:
3.5% (56)
State:
1.8% (11,289)
Number of families with income $20k - 30k:
Groton:
6.5% (105)
State:
3.0% (18,506)
Number of families with income $30k - 40k:
Groton:
5.9% (96)
State:
2.9% (18,160)
Number of families with income $40k - 50k:
Groton:
9.4% (151)
State:
3.9% (24,550)
Number of families with income $50k - 60k:
Groton:
4.0% (64)
State:
4.3% (26,723)
Number of families with income $60k - 75k:
Groton:
12.5% (202)
State:
7.1% (44,075)
Number of families with income $75k - 100k:
Groton:
12.0% (195)
Connecticut:
12.5% (77,679)
Number of families with income $100k - 125k:
Groton:
9.1% (147)
Connecticut:
11.1% (69,086)
Number of families with income $125k - 150k:
Groton:
9.2% (148)
State:
9.6% (59,616)
Number of families with income $150k - 200k:
Groton:
8.5% (138)
State:
15.7% (97,890)
Number of families with income > $200k:
Groton:
15.4% (249)
State:
26.3% (163,417)
Median non-family income in Groton in 2022:
Groton:
$46,597
State:
$54,067
Change in median non-family income between 2000 and 2022:
Groton, Connecticut:
+31.2%
State:
+68.7%
Median per capita income in Groton in 2022:
Groton:
$44,980
State:
$59,916
Change in median per capita income between 2000 and 2022:
Groton, Connecticut:
+86.6%
State:
+90.2%
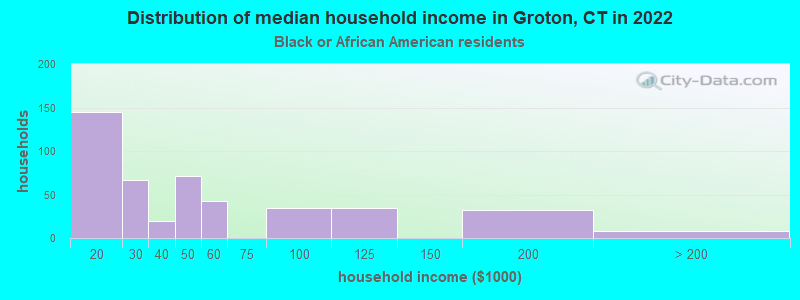
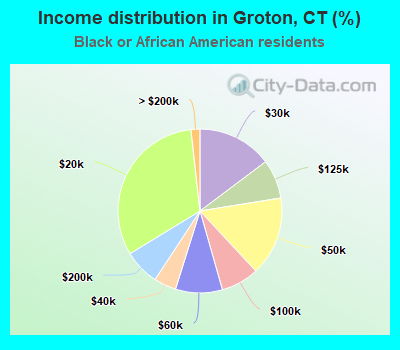
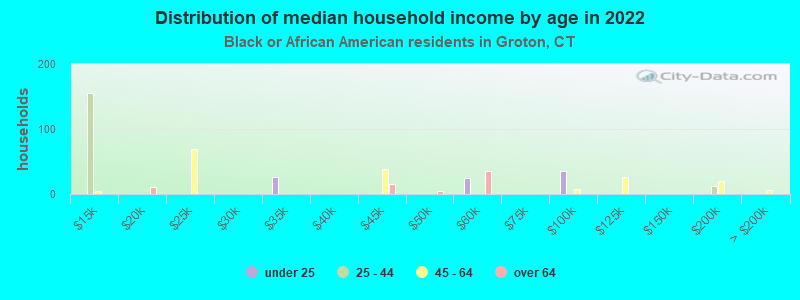
Income statistics for Black or African American residents
Number of households with income < $10k:
Groton:
0.0% (0)
Connecticut:
6.8% (9,494)
Number of households with income $10k - 20k:
Groton:
31.9% (145)
State:
7.9% (11,003)
Number of households with income $20k - 30k:
Groton:
14.8% (67)
Connecticut:
10.8% (15,045)
Number of households with income $30k - 40k:
Groton:
4.4% (20)
State:
8.2% (11,501)
Number of households with income $40k - 50k:
Groton:
15.6% (71)
State:
7.4% (10,416)
Number of households with income $50k - 60k:
Groton:
9.3% (42)
State:
7.5% (10,534)
Number of households with income $60k - 75k:
Groton:
0.0% (0)
State:
8.0% (11,244)
Number of households with income $75k - 100k:
Groton:
7.5% (34)
Connecticut:
9.6% (13,370)
Number of households with income $100k - 125k:
Groton:
7.7% (35)
State:
10.2% (14,244)
Number of households with income $125k - 150k:
Groton:
0.0% (0)
State:
8.0% (11,246)
Number of households with income $150k - 200k:
Groton:
7.0% (32)
Connecticut:
7.7% (10,727)
Number of households with income > $200k:
Groton:
1.8% (8)
State:
7.9% (11,086)
Aggregate household income in Groton in 2022: $25,613,483
Median non-family income in Groton in 2022:
Groton:
$26,976
State:
$38,608
Change in median non-family income between 2000 and 2022:: -33.1%
Groton, Connecticut:
-33.1%
State:
+77.0%
Median per capita income in Groton in 2022:
Groton:
$33,060
Connecticut:
$36,289
Change in median per capita income between 2000 and 2022:
Groton, Connecticut:
+108.7%
State:
+117.5%
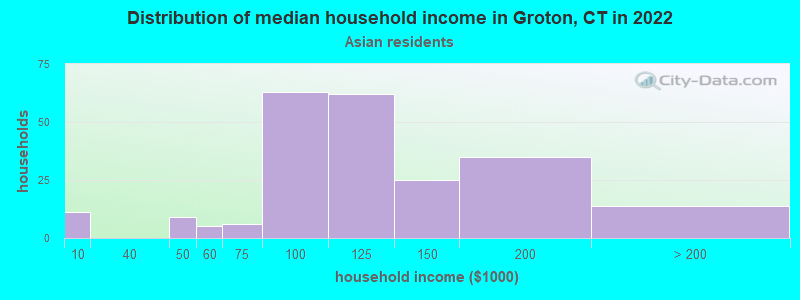
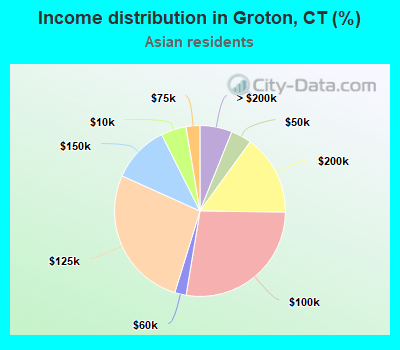
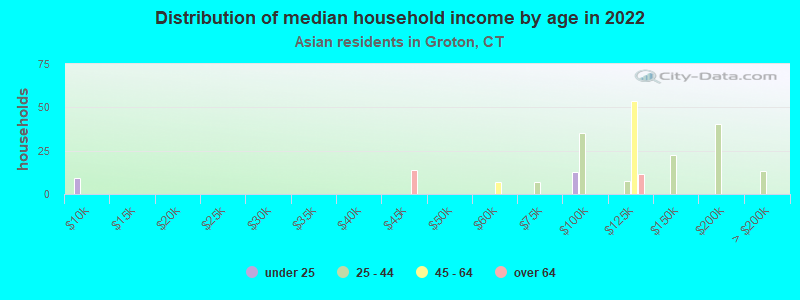
Income statistics for Asian residents
Median household income in Groton, CT in 2022:
Groton:
$101,592
State:
$110,568
Change in median household income between 2000 and 2022:
Groton, Connecticut:
+122.1%
State:
+79.5%
Number of households with income < $10k:
Groton:
4.8% (11)
Connecticut:
7.1% (4,245)
Number of households with income $10k - 20k:
Groton:
0.0% (0)
State:
3.5% (2,087)
Number of households with income $20k - 30k:
Groton:
0.0% (0)
State:
4.1% (2,464)
Number of households with income $30k - 40k:
Groton:
0.0% (0)
State:
4.1% (2,478)
Number of households with income $40k - 50k:
Groton:
3.9% (9)
State:
3.3% (1,983)
Number of households with income $50k - 60k:
Groton:
2.2% (5)
State:
3.9% (2,328)
Number of households with income $60k - 75k:
Groton:
2.6% (6)
Connecticut:
7.0% (4,228)
Number of households with income $75k - 100k:
Groton:
27.4% (63)
Connecticut:
11.5% (6,911)
Number of households with income $100k - 125k:
Groton:
27.0% (62)
Connecticut:
10.2% (6,127)
Number of households with income $125k - 150k:
Groton:
10.9% (25)
State:
8.5% (5,079)
Number of households with income $150k - 200k:
Groton:
15.2% (35)
Connecticut:
12.4% (7,434)
Number of households with income > $200k:
Groton:
6.1% (14)
State:
24.4% (14,661)
Aggregate household income in Groton in 2022: $24,953,831
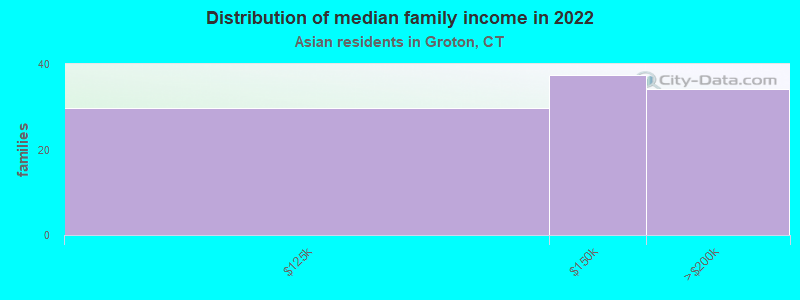
Median family income in Groton in 2022:
Groton:
$125,645
State:
$134,548
Number of families with income $100k - 125k:
Groton:
29.3% (30)
Connecticut:
10.5% (4,621)
Number of families with income $125k - 150k:
Groton:
36.9% (37)
State:
8.2% (3,588)
Number of families with income $150k - 200k:
Groton:
33.8% (34)
Connecticut:
14.2% (6,237)
Median non-family income in Groton in 2022:
Groton:
$76,461
State:
$63,785
Change in median non-family income between 2000 and 2022:
Groton, Connecticut:
+74.8%
State:
+77.9%
Median per capita income in Groton in 2022:
Groton:
$51,010
State:
$55,295
Change in median per capita income between 2000 and 2022:
Groton, Connecticut:
+109.4%
State:
+97.8%
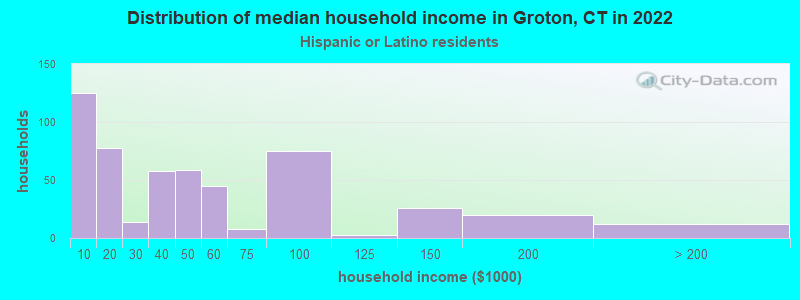
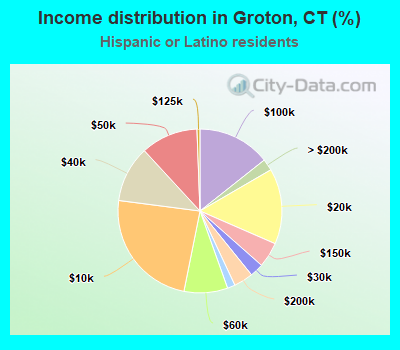
Income statistics for Hispanic or Latino residents
Median household income in Groton, CT in 2022:
Groton:
$36,280
State:
$60,275
Change in median household income between 2000 and 2022:
Groton, Connecticut:
+11.4%
State:
+87.9%
Number of households with income < $10k:
Groton:
23.9% (125)
Connecticut:
8.7% (18,584)
Number of households with income $10k - 20k:
Groton:
14.9% (78)
State:
9.1% (19,235)
Number of households with income $20k - 30k:
Groton:
2.7% (14)
State:
8.9% (18,989)
Number of households with income $30k - 40k:
Groton:
11.1% (58)
State:
7.5% (15,967)
Number of households with income $40k - 50k:
Groton:
11.3% (59)
State:
8.7% (18,466)
Number of households with income $50k - 60k:
Groton:
8.6% (45)
State:
6.9% (14,706)
Number of households with income $60k - 75k:
Groton:
1.5% (8)
State:
8.9% (18,888)
Number of households with income $75k - 100k:
Groton:
14.3% (75)
Connecticut:
13.5% (28,669)
Number of households with income $100k - 125k:
Groton:
0.6% (3)
Connecticut:
8.2% (17,434)
Number of households with income $125k - 150k:
Groton:
5.0% (26)
State:
6.5% (13,752)
Number of households with income $150k - 200k:
Groton:
3.8% (20)
Connecticut:
6.6% (14,114)
Number of households with income > $200k:
Groton:
2.3% (12)
State:
6.4% (13,630)
Aggregate household income in Groton in 2022: $25,298,543
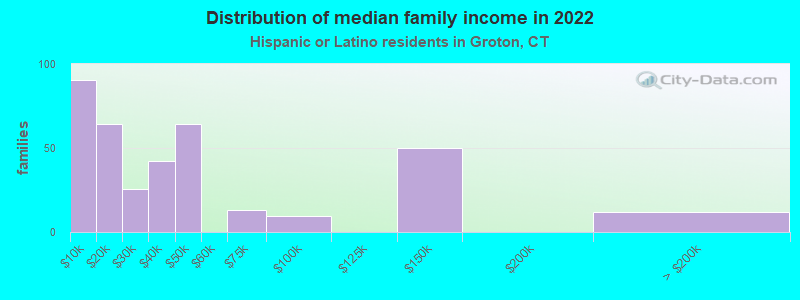
Median family income in Groton in 2022:
Groton:
$27,765
State:
$68,336
Number of families with income < $10k:
Groton:
24.3% (90)
State:
5.2% (7,456)
Number of families with income $10k - 20k:
Groton:
17.4% (65)
State:
6.0% (8,616)
Number of families with income $20k - 30k:
Groton:
6.8% (25)
State:
8.9% (12,680)
Number of families with income $30k - 40k:
Groton:
11.4% (42)
Connecticut:
8.5% (12,090)
Number of families with income $40k - 50k:
Groton:
17.3% (64)
State:
8.8% (12,624)
Number of families with income $60k - 75k:
Groton:
3.5% (13)
State:
8.9% (12,677)
Number of families with income $75k - 100k:
Groton:
2.6% (10)
State:
14.3% (20,457)
Number of families with income $125k - 150k:
Groton:
13.5% (50)
State:
8.2% (11,729)
Number of families with income > $200k:
Groton:
3.1% (12)
State:
7.4% (10,622)
Median per capita income in Groton in 2022:
Groton:
$20,563
State:
$28,507
Change in median per capita income between 2000 and 2022:
Groton, Connecticut:
+60.0%
State:
+117.2%
Income statistics for American Indian and Alaska Native residents
Aggregate household income in Groton in 2022: $3,161,154
Median per capita income in Groton in 2022:
Groton:
$24,850
Connecticut:
$25,355
Change in median per capita income between 2000 and 2022:
Groton, Connecticut:
+45.9%
State:
+39.4%
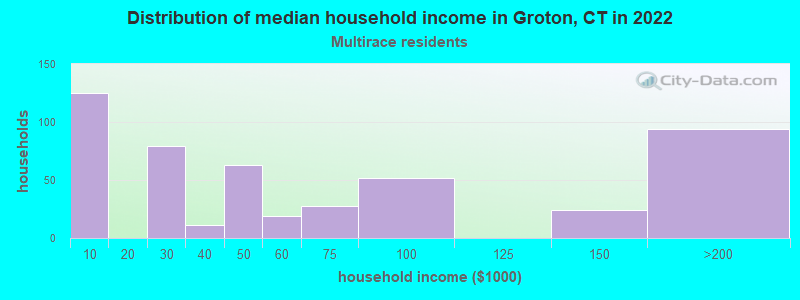
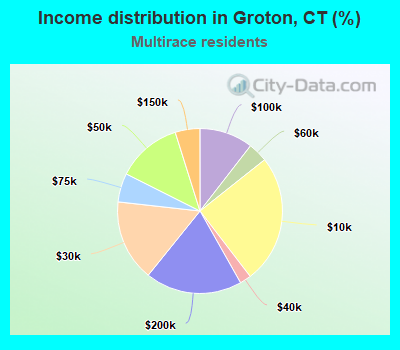
Income statistics for Multirace residents
Median household income in Groton, CT in 2022:
Groton:
$43,183
State:
$77,277
Change in median household income between 2000 and 2022:
Groton, Connecticut:
+36.0%
State:
+113.6%
Number of households with income < $10k:
Groton:
25.3% (125)
State:
6.0% (7,457)
Number of households with income $10k - 20k:
Groton:
0.0% (0)
State:
8.1% (10,139)
Number of households with income $20k - 30k:
Groton:
16.0% (79)
State:
7.0% (8,702)
Number of households with income $30k - 40k:
Groton:
2.2% (11)
Connecticut:
6.9% (8,546)
Number of households with income $40k - 50k:
Groton:
12.7% (63)
State:
7.0% (8,712)
Number of households with income $50k - 60k:
Groton:
3.8% (19)
State:
5.9% (7,331)
Number of households with income $60k - 75k:
Groton:
5.7% (28)
State:
8.5% (10,634)
Number of households with income $75k - 100k:
Groton:
10.5% (52)
State:
14.1% (17,600)
Number of households with income $100k - 125k:
Groton:
0.0% (0)
State:
9.9% (12,383)
Number of households with income $125k - 150k:
Groton:
4.8% (24)
Connecticut:
7.2% (8,921)
Number of households with income $150k - 200k:
Groton:
19.0% (94)
State:
8.8% (10,922)
Number of households with income > $200k:
Groton:
0.0% (0)
Connecticut:
10.6% (13,247)
Aggregate household income in Groton in 2022: $30,084,346
Median per capita income in Groton in 2022:
Groton:
$23,066
Connecticut:
$32,794
Change in median per capita income between 2000 and 2022:
Groton, Connecticut:
+103.1%
State:
+117.2%
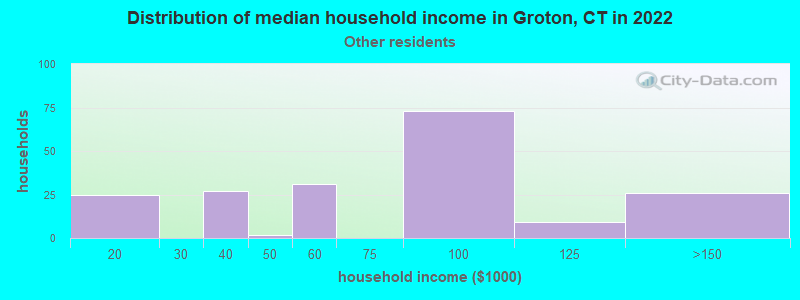
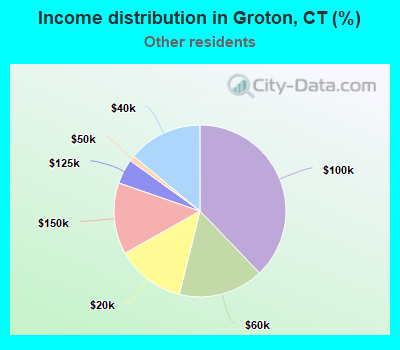
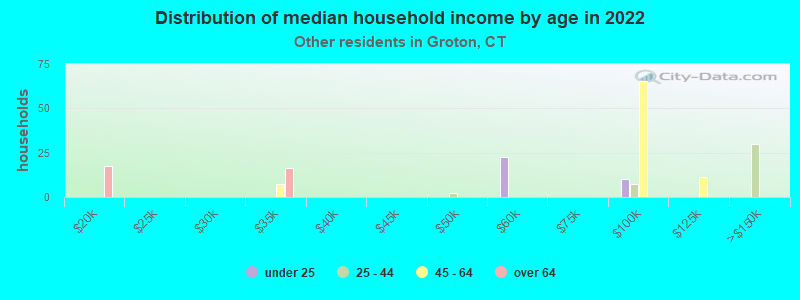
Income statistics for other residents
Median household income in Groton, CT in 2022:
Groton:
$67,935
Connecticut:
$59,588
Number of households with income < $10k:
Groton:
0.0% (0)
State:
9.0% (8,596)
Number of households with income $10k - 20k:
Groton:
13.0% (25)
State:
10.2% (9,773)
Number of households with income $20k - 30k:
Groton:
0.0% (0)
State:
9.1% (8,691)
Number of households with income $30k - 40k:
Groton:
14.0% (27)
State:
7.8% (7,447)
Number of households with income $40k - 50k:
Groton:
1.0% (2)
State:
8.2% (7,860)
Number of households with income $50k - 60k:
Groton:
16.1% (31)
State:
6.0% (5,757)
Number of households with income $60k - 75k:
Groton:
0.0% (0)
State:
9.3% (8,942)
Number of households with income $75k - 100k:
Groton:
37.8% (73)
State:
14.3% (13,700)
Number of households with income $100k - 125k:
Groton:
4.7% (9)
State:
7.2% (6,906)
Number of households with income $125k - 150k:
Groton:
13.5% (26)
Connecticut:
6.5% (6,215)
Number of households with income $150k - 200k:
Groton:
0.0% (0)
State:
6.1% (5,865)
Number of households with income > $200k:
Groton:
0.0% (0)
State:
6.3% (6,065)
Aggregate household income in Groton in 2022: $14,834,120
Median per capita income in Groton in 2022:
Groton:
$31,935
State:
$29,353
Change in median per capita income between 2000 and 2022:
Groton, Connecticut:
+130.1%
State:
+165.8%
Discuss Groton, Connecticut (CT) on our hugely popular Connecticut forum.