Groton, Connecticut Submit your own pictures of this city and show them to the world
OSM Map
General Map
Google Map
MSN Map
OSM Map
General Map
Google Map
MSN Map
OSM Map
General Map
Google Map
MSN Map
OSM Map
General Map
Google Map
MSN Map
Please wait while loading the map...
Population in 2022: 9,349 (100% urban, 0% rural). Population change since 2000: -6.6%Males: 5,007 Females: 4,342
March 2022 cost of living index in Groton: 106.3 (more than average, U.S. average is 100) Percentage of residents living in poverty in 2022: 16.1%for White Non-Hispanic residents , 36.7% for Black residents , 37.8% for Hispanic or Latino residents , 15.0% for other race residents , 41.7% for two or more races residents )
Profiles of local businesses
Business Search - 14 Million verified businesses
Data:
Median household income ($)
Median household income (% change since 2000)
Household income diversity
Ratio of average income to average house value (%)
Ratio of average income to average rent
Median household income ($) - White
Median household income ($) - Black or African American
Median household income ($) - Asian
Median household income ($) - Hispanic or Latino
Median household income ($) - American Indian and Alaska Native
Median household income ($) - Multirace
Median household income ($) - Other Race
Median household income for houses/condos with a mortgage ($)
Median household income for apartments without a mortgage ($)
Races - White alone (%)
Races - White alone (% change since 2000)
Races - Black alone (%)
Races - Black alone (% change since 2000)
Races - American Indian alone (%)
Races - American Indian alone (% change since 2000)
Races - Asian alone (%)
Races - Asian alone (% change since 2000)
Races - Hispanic (%)
Races - Hispanic (% change since 2000)
Races - Native Hawaiian and Other Pacific Islander alone (%)
Races - Native Hawaiian and Other Pacific Islander alone (% change since 2000)
Races - Two or more races (%)
Races - Two or more races (% change since 2000)
Races - Other race alone (%)
Races - Other race alone (% change since 2000)
Racial diversity
Unemployment (%)
Unemployment (% change since 2000)
Unemployment (%) - White
Unemployment (%) - Black or African American
Unemployment (%) - Asian
Unemployment (%) - Hispanic or Latino
Unemployment (%) - American Indian and Alaska Native
Unemployment (%) - Multirace
Unemployment (%) - Other Race
Population density (people per square mile)
Population - Males (%)
Population - Females (%)
Population - Males (%) - White
Population - Males (%) - Black or African American
Population - Males (%) - Asian
Population - Males (%) - Hispanic or Latino
Population - Males (%) - American Indian and Alaska Native
Population - Males (%) - Multirace
Population - Males (%) - Other Race
Population - Females (%) - White
Population - Females (%) - Black or African American
Population - Females (%) - Asian
Population - Females (%) - Hispanic or Latino
Population - Females (%) - American Indian and Alaska Native
Population - Females (%) - Multirace
Population - Females (%) - Other Race
Coronavirus confirmed cases (Apr 27, 2024)
Deaths caused by coronavirus (Apr 27, 2024)
Coronavirus confirmed cases (per 100k population) (Apr 27, 2024)
Deaths caused by coronavirus (per 100k population) (Apr 27, 2024)
Daily increase in number of cases (Apr 27, 2024)
Weekly increase in number of cases (Apr 27, 2024)
Cases doubled (in days) (Apr 27, 2024)
Hospitalized patients (Apr 18, 2022)
Negative test results (Apr 18, 2022)
Total test results (Apr 18, 2022)
COVID Vaccine doses distributed (per 100k population) (Sep 19, 2023)
COVID Vaccine doses administered (per 100k population) (Sep 19, 2023)
COVID Vaccine doses distributed (Sep 19, 2023)
COVID Vaccine doses administered (Sep 19, 2023)
Likely homosexual households (%)
Likely homosexual households (% change since 2000)
Likely homosexual households - Lesbian couples (%)
Likely homosexual households - Lesbian couples (% change since 2000)
Likely homosexual households - Gay men (%)
Likely homosexual households - Gay men (% change since 2000)
Cost of living index
Median gross rent ($)
Median contract rent ($)
Median monthly housing costs ($)
Median house or condo value ($)
Median house or condo value ($ change since 2000)
Mean house or condo value by units in structure - 1, detached ($)
Mean house or condo value by units in structure - 1, attached ($)
Mean house or condo value by units in structure - 2 ($)
Mean house or condo value by units in structure by units in structure - 3 or 4 ($)
Mean house or condo value by units in structure - 5 or more ($)
Mean house or condo value by units in structure - Boat, RV, van, etc. ($)
Mean house or condo value by units in structure - Mobile home ($)
Median house or condo value ($) - White
Median house or condo value ($) - Black or African American
Median house or condo value ($) - Asian
Median house or condo value ($) - Hispanic or Latino
Median house or condo value ($) - American Indian and Alaska Native
Median house or condo value ($) - Multirace
Median house or condo value ($) - Other Race
Median resident age
Resident age diversity
Median resident age - Males
Median resident age - Females
Median resident age - White
Median resident age - Black or African American
Median resident age - Asian
Median resident age - Hispanic or Latino
Median resident age - American Indian and Alaska Native
Median resident age - Multirace
Median resident age - Other Race
Median resident age - Males - White
Median resident age - Males - Black or African American
Median resident age - Males - Asian
Median resident age - Males - Hispanic or Latino
Median resident age - Males - American Indian and Alaska Native
Median resident age - Males - Multirace
Median resident age - Males - Other Race
Median resident age - Females - White
Median resident age - Females - Black or African American
Median resident age - Females - Asian
Median resident age - Females - Hispanic or Latino
Median resident age - Females - American Indian and Alaska Native
Median resident age - Females - Multirace
Median resident age - Females - Other Race
Commute - mean travel time to work (minutes)
Travel time to work - Less than 5 minutes (%)
Travel time to work - Less than 5 minutes (% change since 2000)
Travel time to work - 5 to 9 minutes (%)
Travel time to work - 5 to 9 minutes (% change since 2000)
Travel time to work - 10 to 19 minutes (%)
Travel time to work - 10 to 19 minutes (% change since 2000)
Travel time to work - 20 to 29 minutes (%)
Travel time to work - 20 to 29 minutes (% change since 2000)
Travel time to work - 30 to 39 minutes (%)
Travel time to work - 30 to 39 minutes (% change since 2000)
Travel time to work - 40 to 59 minutes (%)
Travel time to work - 40 to 59 minutes (% change since 2000)
Travel time to work - 60 to 89 minutes (%)
Travel time to work - 60 to 89 minutes (% change since 2000)
Travel time to work - 90 or more minutes (%)
Travel time to work - 90 or more minutes (% change since 2000)
Marital status - Never married (%)
Marital status - Now married (%)
Marital status - Separated (%)
Marital status - Widowed (%)
Marital status - Divorced (%)
Median family income ($)
Median family income (% change since 2000)
Median non-family income ($)
Median non-family income (% change since 2000)
Median per capita income ($)
Median per capita income (% change since 2000)
Median family income ($) - White
Median family income ($) - Black or African American
Median family income ($) - Asian
Median family income ($) - Hispanic or Latino
Median family income ($) - American Indian and Alaska Native
Median family income ($) - Multirace
Median family income ($) - Other Race
Median year house/condo built
Median year apartment built
Year house built - Built 2005 or later (%)
Year house built - Built 2000 to 2004 (%)
Year house built - Built 1990 to 1999 (%)
Year house built - Built 1980 to 1989 (%)
Year house built - Built 1970 to 1979 (%)
Year house built - Built 1960 to 1969 (%)
Year house built - Built 1950 to 1959 (%)
Year house built - Built 1940 to 1949 (%)
Year house built - Built 1939 or earlier (%)
Average household size
Household density (households per square mile)
Average household size - White
Average household size - Black or African American
Average household size - Asian
Average household size - Hispanic or Latino
Average household size - American Indian and Alaska Native
Average household size - Multirace
Average household size - Other Race
Occupied housing units (%)
Vacant housing units (%)
Owner occupied housing units (%)
Renter occupied housing units (%)
Vacancy status - For rent (%)
Vacancy status - For sale only (%)
Vacancy status - Rented or sold, not occupied (%)
Vacancy status - For seasonal, recreational, or occasional use (%)
Vacancy status - For migrant workers (%)
Vacancy status - Other vacant (%)
Residents with income below the poverty level (%)
Residents with income below 50% of the poverty level (%)
Children below poverty level (%)
Poor families by family type - Married-couple family (%)
Poor families by family type - Male, no wife present (%)
Poor families by family type - Female, no husband present (%)
Poverty status for native-born residents (%)
Poverty status for foreign-born residents (%)
Poverty among high school graduates not in families (%)
Poverty among people who did not graduate high school not in families (%)
Residents with income below the poverty level (%) - White
Residents with income below the poverty level (%) - Black or African American
Residents with income below the poverty level (%) - Asian
Residents with income below the poverty level (%) - Hispanic or Latino
Residents with income below the poverty level (%) - American Indian and Alaska Native
Residents with income below the poverty level (%) - Multirace
Residents with income below the poverty level (%) - Other Race
Air pollution - Air Quality Index (AQI)
Air pollution - CO
Air pollution - NO2
Air pollution - SO2
Air pollution - Ozone
Air pollution - PM10
Air pollution - PM25
Air pollution - Pb
Crime - Murders per 100,000 population
Crime - Rapes per 100,000 population
Crime - Robberies per 100,000 population
Crime - Assaults per 100,000 population
Crime - Burglaries per 100,000 population
Crime - Thefts per 100,000 population
Crime - Auto thefts per 100,000 population
Crime - Arson per 100,000 population
Crime - City-data.com crime index
Crime - Violent crime index
Crime - Property crime index
Crime - Murders per 100,000 population (5 year average)
Crime - Rapes per 100,000 population (5 year average)
Crime - Robberies per 100,000 population (5 year average)
Crime - Assaults per 100,000 population (5 year average)
Crime - Burglaries per 100,000 population (5 year average)
Crime - Thefts per 100,000 population (5 year average)
Crime - Auto thefts per 100,000 population (5 year average)
Crime - Arson per 100,000 population (5 year average)
Crime - City-data.com crime index (5 year average)
Crime - Violent crime index (5 year average)
Crime - Property crime index (5 year average)
1996 Presidential Elections Results (%) - Democratic Party (Clinton)
1996 Presidential Elections Results (%) - Republican Party (Dole)
1996 Presidential Elections Results (%) - Other
2000 Presidential Elections Results (%) - Democratic Party (Gore)
2000 Presidential Elections Results (%) - Republican Party (Bush)
2000 Presidential Elections Results (%) - Other
2004 Presidential Elections Results (%) - Democratic Party (Kerry)
2004 Presidential Elections Results (%) - Republican Party (Bush)
2004 Presidential Elections Results (%) - Other
2008 Presidential Elections Results (%) - Democratic Party (Obama)
2008 Presidential Elections Results (%) - Republican Party (McCain)
2008 Presidential Elections Results (%) - Other
2012 Presidential Elections Results (%) - Democratic Party (Obama)
2012 Presidential Elections Results (%) - Republican Party (Romney)
2012 Presidential Elections Results (%) - Other
2016 Presidential Elections Results (%) - Democratic Party (Clinton)
2016 Presidential Elections Results (%) - Republican Party (Trump)
2016 Presidential Elections Results (%) - Other
2020 Presidential Elections Results (%) - Democratic Party (Biden)
2020 Presidential Elections Results (%) - Republican Party (Trump)
2020 Presidential Elections Results (%) - Other
Ancestries Reported - Arab (%)
Ancestries Reported - Czech (%)
Ancestries Reported - Danish (%)
Ancestries Reported - Dutch (%)
Ancestries Reported - English (%)
Ancestries Reported - French (%)
Ancestries Reported - French Canadian (%)
Ancestries Reported - German (%)
Ancestries Reported - Greek (%)
Ancestries Reported - Hungarian (%)
Ancestries Reported - Irish (%)
Ancestries Reported - Italian (%)
Ancestries Reported - Lithuanian (%)
Ancestries Reported - Norwegian (%)
Ancestries Reported - Polish (%)
Ancestries Reported - Portuguese (%)
Ancestries Reported - Russian (%)
Ancestries Reported - Scotch-Irish (%)
Ancestries Reported - Scottish (%)
Ancestries Reported - Slovak (%)
Ancestries Reported - Subsaharan African (%)
Ancestries Reported - Swedish (%)
Ancestries Reported - Swiss (%)
Ancestries Reported - Ukrainian (%)
Ancestries Reported - United States (%)
Ancestries Reported - Welsh (%)
Ancestries Reported - West Indian (%)
Ancestries Reported - Other (%)
Educational Attainment - No schooling completed (%)
Educational Attainment - Less than high school (%)
Educational Attainment - High school or equivalent (%)
Educational Attainment - Less than 1 year of college (%)
Educational Attainment - 1 or more years of college (%)
Educational Attainment - Associate degree (%)
Educational Attainment - Bachelor's degree (%)
Educational Attainment - Master's degree (%)
Educational Attainment - Professional school degree (%)
Educational Attainment - Doctorate degree (%)
School Enrollment - Nursery, preschool (%)
School Enrollment - Kindergarten (%)
School Enrollment - Grade 1 to 4 (%)
School Enrollment - Grade 5 to 8 (%)
School Enrollment - Grade 9 to 12 (%)
School Enrollment - College undergrad (%)
School Enrollment - Graduate or professional (%)
School Enrollment - Not enrolled in school (%)
School enrollment - Public schools (%)
School enrollment - Private schools (%)
School enrollment - Not enrolled (%)
Median number of rooms in houses and condos
Median number of rooms in apartments
Housing units lacking complete plumbing facilities (%)
Housing units lacking complete kitchen facilities (%)
Density of houses
Urban houses (%)
Rural houses (%)
Households with people 60 years and over (%)
Households with people 65 years and over (%)
Households with people 75 years and over (%)
Households with one or more nonrelatives (%)
Households with no nonrelatives (%)
Population in households (%)
Family households (%)
Nonfamily households (%)
Population in families (%)
Family households with own children (%)
Median number of bedrooms in owner occupied houses
Mean number of bedrooms in owner occupied houses
Median number of bedrooms in renter occupied houses
Mean number of bedrooms in renter occupied houses
Median number of vehichles in owner occupied houses
Mean number of vehichles in owner occupied houses
Median number of vehichles in renter occupied houses
Mean number of vehichles in renter occupied houses
Mortgage status - with mortgage (%)
Mortgage status - with second mortgage (%)
Mortgage status - with home equity loan (%)
Mortgage status - with both second mortgage and home equity loan (%)
Mortgage status - without a mortgage (%)
Average family size
Average family size - White
Average family size - Black or African American
Average family size - Asian
Average family size - Hispanic or Latino
Average family size - American Indian and Alaska Native
Average family size - Multirace
Average family size - Other Race
Geographical mobility - Same house 1 year ago (%)
Geographical mobility - Moved within same county (%)
Geographical mobility - Moved from different county within same state (%)
Geographical mobility - Moved from different state (%)
Geographical mobility - Moved from abroad (%)
Place of birth - Born in state of residence (%)
Place of birth - Born in other state (%)
Place of birth - Native, outside of US (%)
Place of birth - Foreign born (%)
Housing units in structures - 1, detached (%)
Housing units in structures - 1, attached (%)
Housing units in structures - 2 (%)
Housing units in structures - 3 or 4 (%)
Housing units in structures - 5 to 9 (%)
Housing units in structures - 10 to 19 (%)
Housing units in structures - 20 to 49 (%)
Housing units in structures - 50 or more (%)
Housing units in structures - Mobile home (%)
Housing units in structures - Boat, RV, van, etc. (%)
House/condo owner moved in on average (years ago)
Renter moved in on average (years ago)
Year householder moved into unit - Moved in 1999 to March 2000 (%)
Year householder moved into unit - Moved in 1995 to 1998 (%)
Year householder moved into unit - Moved in 1990 to 1994 (%)
Year householder moved into unit - Moved in 1980 to 1989 (%)
Year householder moved into unit - Moved in 1970 to 1979 (%)
Year householder moved into unit - Moved in 1969 or earlier (%)
Means of transportation to work - Drove car alone (%)
Means of transportation to work - Carpooled (%)
Means of transportation to work - Public transportation (%)
Means of transportation to work - Bus or trolley bus (%)
Means of transportation to work - Streetcar or trolley car (%)
Means of transportation to work - Subway or elevated (%)
Means of transportation to work - Railroad (%)
Means of transportation to work - Ferryboat (%)
Means of transportation to work - Taxicab (%)
Means of transportation to work - Motorcycle (%)
Means of transportation to work - Bicycle (%)
Means of transportation to work - Walked (%)
Means of transportation to work - Other means (%)
Working at home (%)
Industry diversity
Most Common Industries - Agriculture, forestry, fishing and hunting, and mining (%)
Most Common Industries - Agriculture, forestry, fishing and hunting (%)
Most Common Industries - Mining, quarrying, and oil and gas extraction (%)
Most Common Industries - Construction (%)
Most Common Industries - Manufacturing (%)
Most Common Industries - Wholesale trade (%)
Most Common Industries - Retail trade (%)
Most Common Industries - Transportation and warehousing, and utilities (%)
Most Common Industries - Transportation and warehousing (%)
Most Common Industries - Utilities (%)
Most Common Industries - Information (%)
Most Common Industries - Finance and insurance, and real estate and rental and leasing (%)
Most Common Industries - Finance and insurance (%)
Most Common Industries - Real estate and rental and leasing (%)
Most Common Industries - Professional, scientific, and management, and administrative and waste management services (%)
Most Common Industries - Professional, scientific, and technical services (%)
Most Common Industries - Management of companies and enterprises (%)
Most Common Industries - Administrative and support and waste management services (%)
Most Common Industries - Educational services, and health care and social assistance (%)
Most Common Industries - Educational services (%)
Most Common Industries - Health care and social assistance (%)
Most Common Industries - Arts, entertainment, and recreation, and accommodation and food services (%)
Most Common Industries - Arts, entertainment, and recreation (%)
Most Common Industries - Accommodation and food services (%)
Most Common Industries - Other services, except public administration (%)
Most Common Industries - Public administration (%)
Occupation diversity
Most Common Occupations - Management, business, science, and arts occupations (%)
Most Common Occupations - Management, business, and financial occupations (%)
Most Common Occupations - Management occupations (%)
Most Common Occupations - Business and financial operations occupations (%)
Most Common Occupations - Computer, engineering, and science occupations (%)
Most Common Occupations - Computer and mathematical occupations (%)
Most Common Occupations - Architecture and engineering occupations (%)
Most Common Occupations - Life, physical, and social science occupations (%)
Most Common Occupations - Education, legal, community service, arts, and media occupations (%)
Most Common Occupations - Community and social service occupations (%)
Most Common Occupations - Legal occupations (%)
Most Common Occupations - Education, training, and library occupations (%)
Most Common Occupations - Arts, design, entertainment, sports, and media occupations (%)
Most Common Occupations - Healthcare practitioners and technical occupations (%)
Most Common Occupations - Health diagnosing and treating practitioners and other technical occupations (%)
Most Common Occupations - Health technologists and technicians (%)
Most Common Occupations - Service occupations (%)
Most Common Occupations - Healthcare support occupations (%)
Most Common Occupations - Protective service occupations (%)
Most Common Occupations - Fire fighting and prevention, and other protective service workers including supervisors (%)
Most Common Occupations - Law enforcement workers including supervisors (%)
Most Common Occupations - Food preparation and serving related occupations (%)
Most Common Occupations - Building and grounds cleaning and maintenance occupations (%)
Most Common Occupations - Personal care and service occupations (%)
Most Common Occupations - Sales and office occupations (%)
Most Common Occupations - Sales and related occupations (%)
Most Common Occupations - Office and administrative support occupations (%)
Most Common Occupations - Natural resources, construction, and maintenance occupations (%)
Most Common Occupations - Farming, fishing, and forestry occupations (%)
Most Common Occupations - Construction and extraction occupations (%)
Most Common Occupations - Installation, maintenance, and repair occupations (%)
Most Common Occupations - Production, transportation, and material moving occupations (%)
Most Common Occupations - Production occupations (%)
Most Common Occupations - Transportation occupations (%)
Most Common Occupations - Material moving occupations (%)
People in Group quarters - Institutionalized population (%)
People in Group quarters - Correctional institutions (%)
People in Group quarters - Federal prisons and detention centers (%)
People in Group quarters - Halfway houses (%)
People in Group quarters - Local jails and other confinement facilities (including police lockups) (%)
People in Group quarters - Military disciplinary barracks (%)
People in Group quarters - State prisons (%)
People in Group quarters - Other types of correctional institutions (%)
People in Group quarters - Nursing homes (%)
People in Group quarters - Hospitals/wards, hospices, and schools for the handicapped (%)
People in Group quarters - Hospitals/wards and hospices for chronically ill (%)
People in Group quarters - Hospices or homes for chronically ill (%)
People in Group quarters - Military hospitals or wards for chronically ill (%)
People in Group quarters - Other hospitals or wards for chronically ill (%)
People in Group quarters - Hospitals or wards for drug/alcohol abuse (%)
People in Group quarters - Mental (Psychiatric) hospitals or wards (%)
People in Group quarters - Schools, hospitals, or wards for the mentally retarded (%)
People in Group quarters - Schools, hospitals, or wards for the physically handicapped (%)
People in Group quarters - Institutions for the deaf (%)
People in Group quarters - Institutions for the blind (%)
People in Group quarters - Orthopedic wards and institutions for the physically handicapped (%)
People in Group quarters - Wards in general hospitals for patients who have no usual home elsewhere (%)
People in Group quarters - Wards in military hospitals for patients who have no usual home elsewhere (%)
People in Group quarters - Juvenile institutions (%)
People in Group quarters - Long-term care (%)
People in Group quarters - Homes for abused, dependent, and neglected children (%)
People in Group quarters - Residential treatment centers for emotionally disturbed children (%)
People in Group quarters - Training schools for juvenile delinquents (%)
People in Group quarters - Short-term care, detention or diagnostic centers for delinquent children (%)
People in Group quarters - Type of juvenile institution unknown (%)
People in Group quarters - Noninstitutionalized population (%)
People in Group quarters - College dormitories (includes college quarters off campus) (%)
People in Group quarters - Military quarters (%)
People in Group quarters - On base (%)
People in Group quarters - Barracks, unaccompanied personnel housing (UPH), (Enlisted/Officer), ;and similar group living quarters for military personnel (%)
People in Group quarters - Transient quarters for temporary residents (%)
People in Group quarters - Military ships (%)
People in Group quarters - Group homes (%)
People in Group quarters - Homes or halfway houses for drug/alcohol abuse (%)
People in Group quarters - Homes for the mentally ill (%)
People in Group quarters - Homes for the mentally retarded (%)
People in Group quarters - Homes for the physically handicapped (%)
People in Group quarters - Other group homes (%)
People in Group quarters - Religious group quarters (%)
People in Group quarters - Dormitories (%)
People in Group quarters - Agriculture workers' dormitories on farms (%)
People in Group quarters - Job Corps and vocational training facilities (%)
People in Group quarters - Other workers' dormitories (%)
People in Group quarters - Crews of maritime vessels (%)
People in Group quarters - Other nonhousehold living situations (%)
People in Group quarters - Other noninstitutional group quarters (%)
Residents speaking English at home (%)
Residents speaking English at home - Born in the United States (%)
Residents speaking English at home - Native, born elsewhere (%)
Residents speaking English at home - Foreign born (%)
Residents speaking Spanish at home (%)
Residents speaking Spanish at home - Born in the United States (%)
Residents speaking Spanish at home - Native, born elsewhere (%)
Residents speaking Spanish at home - Foreign born (%)
Residents speaking other language at home (%)
Residents speaking other language at home - Born in the United States (%)
Residents speaking other language at home - Native, born elsewhere (%)
Residents speaking other language at home - Foreign born (%)
Class of Workers - Employee of private company (%)
Class of Workers - Self-employed in own incorporated business (%)
Class of Workers - Private not-for-profit wage and salary workers (%)
Class of Workers - Local government workers (%)
Class of Workers - State government workers (%)
Class of Workers - Federal government workers (%)
Class of Workers - Self-employed workers in own not incorporated business and Unpaid family workers (%)
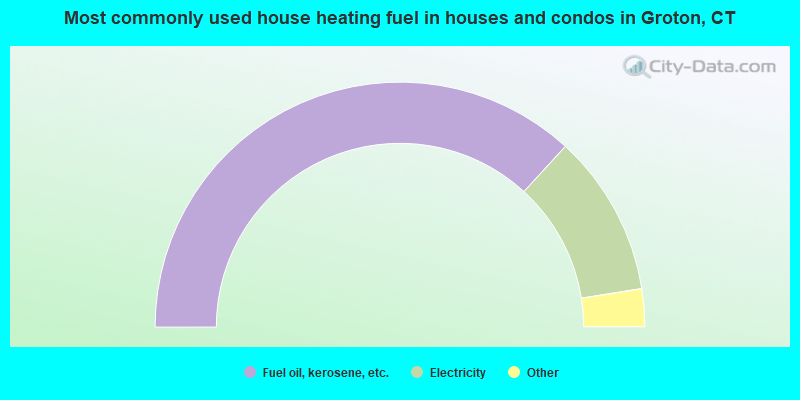
House heating fuel used in houses and condos - Utility gas (%)
House heating fuel used in houses and condos - Bottled, tank, or LP gas (%)
House heating fuel used in houses and condos - Electricity (%)
House heating fuel used in houses and condos - Fuel oil, kerosene, etc. (%)
House heating fuel used in houses and condos - Coal or coke (%)
House heating fuel used in houses and condos - Wood (%)
House heating fuel used in houses and condos - Solar energy (%)
House heating fuel used in houses and condos - Other fuel (%)
House heating fuel used in houses and condos - No fuel used (%)
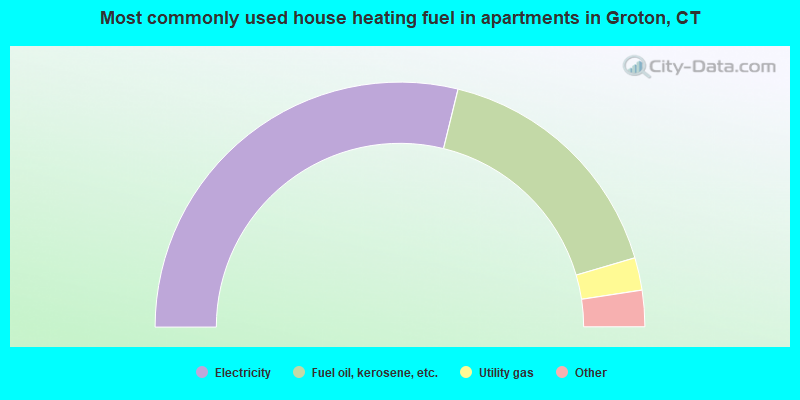
House heating fuel used in apartments - Utility gas (%)
House heating fuel used in apartments - Bottled, tank, or LP gas (%)
House heating fuel used in apartments - Electricity (%)
House heating fuel used in apartments - Fuel oil, kerosene, etc. (%)
House heating fuel used in apartments - Coal or coke (%)
House heating fuel used in apartments - Wood (%)
House heating fuel used in apartments - Solar energy (%)
House heating fuel used in apartments - Other fuel (%)
House heating fuel used in apartments - No fuel used (%)
Armed forces status - In Armed Forces (%)
Armed forces status - Civilian (%)
Armed forces status - Civilian - Veteran (%)
Armed forces status - Civilian - Nonveteran (%)
Fatal accidents locations in years 2005-2021
Fatal accidents locations in 2005
Fatal accidents locations in 2006
Fatal accidents locations in 2007
Fatal accidents locations in 2008
Fatal accidents locations in 2009
Fatal accidents locations in 2010
Fatal accidents locations in 2011
Fatal accidents locations in 2012
Fatal accidents locations in 2013
Fatal accidents locations in 2014
Fatal accidents locations in 2015
Fatal accidents locations in 2016
Fatal accidents locations in 2017
Fatal accidents locations in 2018
Fatal accidents locations in 2019
Fatal accidents locations in 2020
Fatal accidents locations in 2021
Alcohol use - People drinking some alcohol every month (%)
Alcohol use - People not drinking at all (%)
Alcohol use - Average days/month drinking alcohol
Alcohol use - Average drinks/week
Alcohol use - Average days/year people drink much
Audiometry - Average condition of hearing (%)
Audiometry - People that can hear a whisper from across a quiet room (%)
Audiometry - People that can hear normal voice from across a quiet room (%)
Audiometry - Ears ringing, roaring, buzzing (%)
Audiometry - Had a job exposure to loud noise (%)
Audiometry - Had off-work exposure to loud noise (%)
Blood Pressure & Cholesterol - Has high blood pressure (%)
Blood Pressure & Cholesterol - Checking blood pressure at home (%)
Blood Pressure & Cholesterol - Frequently checking blood cholesterol (%)
Blood Pressure & Cholesterol - Has high cholesterol level (%)
Consumer Behavior - Money monthly spent on food at supermarket/grocery store
Consumer Behavior - Money monthly spent on food at other stores
Consumer Behavior - Money monthly spent on eating out
Consumer Behavior - Money monthly spent on carryout/delivered foods
Consumer Behavior - Income spent on food at supermarket/grocery store (%)
Consumer Behavior - Income spent on food at other stores (%)
Consumer Behavior - Income spent on eating out (%)
Consumer Behavior - Income spent on carryout/delivered foods (%)
Current Health Status - General health condition (%)
Current Health Status - Blood donors (%)
Current Health Status - Has blood ever tested for HIV virus (%)
Current Health Status - Left-handed people (%)
Dermatology - People using sunscreen (%)
Diabetes - Diabetics (%)
Diabetes - Had a blood test for high blood sugar (%)
Diabetes - People taking insulin (%)
Diet Behavior & Nutrition - Diet health (%)
Diet Behavior & Nutrition - Milk product consumption (# of products/month)
Diet Behavior & Nutrition - Meals not home prepared (#/week)
Diet Behavior & Nutrition - Meals from fast food or pizza place (#/week)
Diet Behavior & Nutrition - Ready-to-eat foods (#/month)
Diet Behavior & Nutrition - Frozen meals/pizza (#/month)
Drug Use - People that ever used marijuana or hashish (%)
Drug Use - Ever used hard drugs (%)
Drug Use - Ever used any form of cocaine (%)
Drug Use - Ever used heroin (%)
Drug Use - Ever used methamphetamine (%)
Health Insurance - People covered by health insurance (%)
Kidney Conditions-Urology - Avg. # of times urinating at night
Medical Conditions - People with asthma (%)
Medical Conditions - People with anemia (%)
Medical Conditions - People with psoriasis (%)
Medical Conditions - People with overweight (%)
Medical Conditions - Elderly people having difficulties in thinking or remembering (%)
Medical Conditions - People who ever received blood transfusion (%)
Medical Conditions - People having trouble seeing even with glass/contacts (%)
Medical Conditions - People with arthritis (%)
Medical Conditions - People with gout (%)
Medical Conditions - People with congestive heart failure (%)
Medical Conditions - People with coronary heart disease (%)
Medical Conditions - People with angina pectoris (%)
Medical Conditions - People who ever had heart attack (%)
Medical Conditions - People who ever had stroke (%)
Medical Conditions - People with emphysema (%)
Medical Conditions - People with thyroid problem (%)
Medical Conditions - People with chronic bronchitis (%)
Medical Conditions - People with any liver condition (%)
Medical Conditions - People who ever had cancer or malignancy (%)
Mental Health - People who have little interest in doing things (%)
Mental Health - People feeling down, depressed, or hopeless (%)
Mental Health - People who have trouble sleeping or sleeping too much (%)
Mental Health - People feeling tired or having little energy (%)
Mental Health - People with poor appetite or overeating (%)
Mental Health - People feeling bad about themself (%)
Mental Health - People who have trouble concentrating on things (%)
Mental Health - People moving or speaking slowly or too fast (%)
Mental Health - People having thoughts they would be better off dead (%)
Oral Health - Average years since last visit a dentist
Oral Health - People embarrassed because of mouth (%)
Oral Health - People with gum disease (%)
Oral Health - General health of teeth and gums (%)
Oral Health - Average days a week using dental floss/device
Oral Health - Average days a week using mouthwash for dental problem
Oral Health - Average number of teeth
Pesticide Use - Households using pesticides to control insects (%)
Pesticide Use - Households using pesticides to kill weeds (%)
Physical Activity - People doing vigorous-intensity work activities (%)
Physical Activity - People doing moderate-intensity work activities (%)
Physical Activity - People walking or bicycling (%)
Physical Activity - People doing vigorous-intensity recreational activities (%)
Physical Activity - People doing moderate-intensity recreational activities (%)
Physical Activity - Average hours a day doing sedentary activities
Physical Activity - Average hours a day watching TV or videos
Physical Activity - Average hours a day using computer
Physical Functioning - People having limitations keeping them from working (%)
Physical Functioning - People limited in amount of work they can do (%)
Physical Functioning - People that need special equipment to walk (%)
Physical Functioning - People experiencing confusion/memory problems (%)
Physical Functioning - People requiring special healthcare equipment (%)
Prescription Medications - Average number of prescription medicines taking
Preventive Aspirin Use - Adults 40+ taking low-dose aspirin (%)
Reproductive Health - Vaginal deliveries (%)
Reproductive Health - Cesarean deliveries (%)
Reproductive Health - Deliveries resulted in a live birth (%)
Reproductive Health - Pregnancies resulted in a delivery (%)
Reproductive Health - Women breastfeeding newborns (%)
Reproductive Health - Women that had a hysterectomy (%)
Reproductive Health - Women that had both ovaries removed (%)
Reproductive Health - Women that have ever taken birth control pills (%)
Reproductive Health - Women taking birth control pills (%)
Reproductive Health - Women that have ever used Depo-Provera or injectables (%)
Reproductive Health - Women that have ever used female hormones (%)
Sexual Behavior - People 18+ that ever had sex (vaginal, anal, or oral) (%)
Sexual Behavior - Males 18+ that ever had vaginal sex with a woman (%)
Sexual Behavior - Males 18+ that ever performed oral sex on a woman (%)
Sexual Behavior - Males 18+ that ever had anal sex with a woman (%)
Sexual Behavior - Males 18+ that ever had any sex with a man (%)
Sexual Behavior - Females 18+ that ever had vaginal sex with a man (%)
Sexual Behavior - Females 18+ that ever performed oral sex on a man (%)
Sexual Behavior - Females 18+ that ever had anal sex with a man (%)
Sexual Behavior - Females 18+ that ever had any kind of sex with a woman (%)
Sexual Behavior - Average age people first had sex
Sexual Behavior - Average number of female sex partners in lifetime (males 18+)
Sexual Behavior - Average number of female vaginal sex partners in lifetime (males 18+)
Sexual Behavior - Average age people first performed oral sex on a woman (18+)
Sexual Behavior - Average number of woman performed oral sex on in lifetime (18+)
Sexual Behavior - Average number of male sex partners in lifetime (males 18+)
Sexual Behavior - Average number of male anal sex partners in lifetime (males 18+)
Sexual Behavior - Average age people first performed oral sex on a man (18+)
Sexual Behavior - Average number of male oral sex partners in lifetime (18+)
Sexual Behavior - People using protection when performing oral sex (%)
Sexual Behavior - Average number of times people have vaginal or anal sex a year
Sexual Behavior - People having sex without condom (%)
Sexual Behavior - Average number of male sex partners in lifetime (females 18+)
Sexual Behavior - Average number of male vaginal sex partners in lifetime (females 18+)
Sexual Behavior - Average number of female sex partners in lifetime (females 18+)
Sexual Behavior - Circumcised males 18+ (%)
Sleep Disorders - Average hours sleeping at night
Sleep Disorders - People that has trouble sleeping (%)
Smoking-Cigarette Use - People smoking cigarettes (%)
Taste & Smell - People 40+ having problems with smell (%)
Taste & Smell - People 40+ having problems with taste (%)
Taste & Smell - People 40+ that ever had wisdom teeth removed (%)
Taste & Smell - People 40+ that ever had tonsils teeth removed (%)
Taste & Smell - People 40+ that ever had a loss of consciousness because of a head injury (%)
Taste & Smell - People 40+ that ever had a broken nose or other serious injury to face or skull (%)
Taste & Smell - People 40+ that ever had two or more sinus infections (%)
Weight - Average height (inches)
Weight - Average weight (pounds)
Weight - Average BMI
Weight - People that are obese (%)
Weight - People that ever were obese (%)
Weight - People trying to lose weight (%)
Officers per 1,000 residents here:
2.02Connecticut average:
2.10
Latest news from Groton, CT collected exclusively by city-data.com from local newspapers, TV, and radio stations
Ancestries: Irish (10.6%), Italian (10.1%), German (6.8%), American (6.4%), English (3.9%), Brazilian (3.3%).
Current Local Time:
Incorporated on 05/10/1705
Land area: 3.19 square miles.
Population density: 2,931 people per square mile (average).
970 residents are foreign born (4.7% Latin America , 3.6% Asia , 1.4% Europe ).
This city:
10.3%Connecticut:
15.0%
Median real estate property taxes paid for housing units with mortgages in 2022: $4,340 (1.6%)Median real estate property taxes paid for housing units with no mortgage in 2022: $3,994 (1.5%)
Nearest city with pop. 50,000+: Manchester, CT
Nearest city with pop. 200,000+: Boston, MA
Nearest city with pop. 1,000,000+: Bronx, NY
Nearest cities:
Latitude: 41.35 N, Longitude: 72.07 W
Daytime population change due to commuting: +10,272 (+109.2%)Workers who live and work in this city: 1,635 (30.7%)
Area code commonly used in this area: 860
Groton tourist attractions:
Single-family new house construction building permits:
2022: 4 buildings , average cost: $408,3002021: 5 buildings , average cost: $380,0002020: 6 buildings , average cost: $210,9002019: 2 buildings , average cost: $130,0002018: 2 buildings , average cost: $130,0002017: 3 buildings , average cost: $90,0002016: 5 buildings , average cost: $98,0002015: 3 buildings , average cost: $188,3002014: 4 buildings , average cost: $101,6002013: 6 buildings , average cost: $171,9002012: 6 buildings , average cost: $171,9002011: 3 buildings , average cost: $113,3002010: 2 buildings , average cost: $124,5002009: 2 buildings , average cost: $262,5002008: 5 buildings , average cost: $119,7002007: 6 buildings , average cost: $179,0002006: 7 buildings , average cost: $171,0002005: 9 buildings , average cost: $146,3002004: 12 buildings , average cost: $139,1002003: 10 buildings , average cost: $108,7002002: 9 buildings , average cost: $108,2002001: 8 buildings , average cost: $108,2002000: 9 buildings , average cost: $108,2001999: 10 buildings , average cost: $113,8001998: 4 buildings , average cost: $63,8001997: 5 buildings , average cost: $38,400Unemployment in December 2023: Here:
3.7%Connecticut:
3.9%
Population change in the 1990s: +55 (+0.6%).
Most common industries in Groton, CT (%)
Both Males Females
Arts, entertainment, recreation (11.7%)
Accommodation & food services (10.7%)
Transportation equipment (9.0%)
Chemicals (7.0%)
Health care (6.8%)
Public administration (5.6%)
Professional, scientific, technical services (5.3%)
Arts, entertainment, recreation (13.2%)
Transportation equipment (12.6%)
Accommodation & food services (10.1%)
Construction (9.0%)
Chemicals (7.8%)
Public administration (7.6%)
Professional, scientific, technical services (4.5%)
Health care (11.4%)
Accommodation & food services (11.4%)
Arts, entertainment, recreation (10.1%)
Educational services (8.4%)
Chemicals (6.2%)
Professional, scientific, technical services (6.0%)
Transportation equipment (5.1%)
Most common occupations in Groton, CT (%)
Both Males Females
Supervisors and other personal care and service workers, except child care workers (4.7%)
Cashiers (4.0%)
Secretaries and administrative assistants (3.6%)
Engineers (3.5%)
Other office and administrative support workers, including supervisors (3.4%)
Building and grounds cleaning and maintenance occupations (3.3%)
Computer specialists (3.1%)
Engineers (5.9%)
Supervisors and other personal care and service workers, except child care workers (4.7%)
Computer specialists (4.2%)
Electrical equipment mechanics and other installation, maintenance, and repair workers, including supervisors (4.0%)
Cooks and food preparation workers (3.9%)
Other production occupations, including supervisors (3.9%)
Other management occupations, except farmers and farm managers (3.5%)
Secretaries and administrative assistants (7.3%)
Cashiers (6.4%)
Supervisors and other personal care and service workers, except child care workers (4.7%)
Other office and administrative support workers, including supervisors (4.7%)
Other sales and related occupations, including supervisors (4.0%)
Information and record clerks, except customer service representatives (4.0%)
Building and grounds cleaning and maintenance occupations (3.8%)
Tornado activity:
Groton-area historical tornado activity is below Connecticut state average. It is 54% smaller than the overall U.S. average.
On 7/10/1989, a category F4 (max. wind speeds 207-260 mph) tornado 43.0 miles away from the Groton city center injured 40 people and caused between $50,000,000 and $500,000,000 in damages.
On 8/21/1951, a category F3 (max. wind speeds 158-206 mph) tornado 27.4 miles away from the city center injured 8 people and caused between $50,000 and $500,000 in damages.
Earthquake activity:
Groton-area historical earthquake activity is significantly above Connecticut state average. It is 73% smaller than the overall U.S. average. On 10/7/1983 at 10:18:46, a magnitude 5.3 (5.1 MB, 5.3 LG, 5.1 ML, Class: Moderate, Intensity: VI - VII) earthquake occurred 214.1 miles away from the city center On 4/20/2002 at 10:50:47, a magnitude 5.3 (5.3 ML, Depth: 3.0 mi) earthquake occurred 234.0 miles away from the city center On 4/20/2002 at 10:50:47, a magnitude 5.2 (5.2 MB, 4.2 MS, 5.2 MW, 5.0 MW) earthquake occurred 232.7 miles away from the city center On 1/19/1982 at 00:14:42, a magnitude 4.7 (4.5 MB, 4.7 MD, 4.5 LG, Class: Light, Intensity: IV - V) earthquake occurred 151.0 miles away from Groton center On 8/22/1992 at 12:20:32, a magnitude 4.8 (4.8 MB, 3.8 MS, 4.7 LG, Depth: 6.2 mi) earthquake occurred 180.5 miles away from the city center On 10/16/2012 at 23:12:25, a magnitude 4.7 (4.7 ML, Depth: 10.0 mi) earthquake occurred 171.7 miles away from Groton center Magnitude types: regional Lg-wave magnitude (LG), body-wave magnitude (MB), duration magnitude (MD), local magnitude (ML), surface-wave magnitude (MS), moment magnitude (MW) Natural disasters: The number of natural disasters in New London County (22) is greater than the US average (15).Major Disasters (Presidential) Declared: 12Emergencies Declared: 10Hurricanes: 6, Snowstorms: 5, Storms: 5, Floods: 4, Blizzards: 3, Winter Storms: 3, Snows: 2, Snowfall: 1, Tropical Storm: 1, Wind: 1 (Note: some incidents may be assigned to more than one category). Hospitals and medical centers in Groton: FAIRVIEW (235 LESTERTOWN RD)
GROTON REGENCY CENTER (1145 POQUONNOCK RD)
GROTON REGENCY RETIREMENT NURS CTR (1145 POQUONOCK RD)
Amtrak stations near Groton: 2 miles: NEW LONDON (27 WATER ST.) Services: ticket office, partially wheelchair accessible, enclosed waiting area, public restrooms, public payphones, paid short-term parking, paid long-term parking, call for car rental service, taxi stand, intercity bus service, public transit connection.
6 miles: MYSTIC (RTE. 1) Services: enclosed waiting area, public restrooms, public payphones, free short-term parking, call for car rental service, call for taxi service, public transit connection.
10 miles: FOXWOOD CASINO (LEDYARD, ROUTE 2) - Bus Station Operable nuclear power plants near Groton:
4 miles: Millstone 1 and 2 in Waterford, CT.4 miles: Millstone 3 in Waterford, CT.
Colleges/Universities in Groton: University of Connecticut-Avery Point Full-time enrollment: 657; Location: 1084 Shennecossett Rd; Public; Website: uconn.edu/)
Connecticut Center for Massage Therapy-Groton Full-time enrollment: 86; Location: 1154 Poquonnock Rd; Private, for-profit; Website: www.ccmt.edu)
Colleges/universities with over 2000 students nearest to Groton:
Connecticut College (about 3 miles; New London, CT ; Full-time enrollment: 2,068)
Three Rivers Community College (about 12 miles; Norwich, CT ; FT enrollment: 2,897)
Eastern Connecticut State University (about 28 miles; Willimantic, CT ; FT enrollment: 4,985)
University of Rhode Island (about 30 miles; Kingston, RI ; FT enrollment: 14,656)
University of Connecticut (about 34 miles; Storrs, CT ; FT enrollment: 22,037)
Wesleyan University (about 34 miles; Middletown, CT ; FT enrollment: 3,517)
New England Institute of Technology (about 37 miles; East Greenwich, RI ; FT enrollment: 3,183)
Public high schools in Groton:
Private high school in Groton: STEDFAST CHRISTIAN ACADEMY Students: 62, Location: 1041 POQUONNOCK RD, Grades: KG-12)
Public elementary/middle schools in Groton: CLAUDE CHESTER SCHOOL Students: 457, Location: ONE HARRY DAY ROAD, Grades: KG-5)MARY MORRISSON SCHOOL Students: 413, Location: 154 TOLL GATE STREET, Grades: PK-5)CHARLES BARNUM SCHOOL Students: 352, Location: 68 BRIAR HILL ROAD, Grades: PK-5)WEST SIDE MIDDLE SCHOOL Students: 324, Location: 250 BRANDEGEE AVENUE, Grades: 6-8)PLEASANT VALLEY SCHOOL Students: 269, Location: 380 PLEASANT VALLEY ROAD SOU, Grades: KG-5)NORTHEAST ACADEMY ELEMENTARY SCHOOL Location: 15 OSLO STREET, Grades: KG-5)
CATHERINE KOLNASKI MAGNET SCHOOL Location: 500 POQUONNOCK ROAD, Grades: PK-5)
Private elementary/middle school in Groton: SACRED HEART SCHOOL Students: 202, Location: 50 SACRED HEART DR, Grades: PK-8)
See full list of schools located in Groton Libraries in Groton: GROTON PUBLIC LIBRARY Operating income: $1,931,754; Location: 52 NEWTOWN ROAD, ROUTE 117; 130,634 books ; 2,699 e-books ; 9,893 audio materials ; 8,303 video materials ; 4 local licensed databases ; 30 state licensed databases ; 238 print serial subscriptions )
BILL MEMORIAL LIBRARY Operating income: $193,401; Location: 240 MONUMENT ST.; 21,065 books ; 18 e-books ; 350 audio materials ; 222 video materials ; 30 state licensed databases ; 65 print serial subscriptions )
Notable locations in Groton: (A) , Groton Fire Department Eastern Point Station (B) , City of Groton Fire Department Station 1 (C) , US Coast Guard Research and Development Technical Library (D) , Groton City Municipal Building (E) , Groton Balle Museum (F) , Bill Memorial Library (G) , Avery House (H) , Electric Boat Fire Department and Emergency Medical Services (I) , Pfizer Incorporated Protective Services (J) . Display/hide their locations on the map
Shopping Center: (1) . Display/hide its location on the map
Churches in Groton include: (A) , Groton Church of the Nazarene (B) , Groton Heights Baptist Church (C) , Rock of Salvation Church (D) , Sacred Heart Church (E) , Saint Johns Christian Church (F) . Display/hide their locations on the map
Cemetery: (1) . Display/hide its location on the map
Lake: (A) . Display/hide its location on the map
Creek: (A) . Display/hide its location on the map
Parks in Groton include: (1) , Washington Park (2) , Fort Griswold State Park (3) , USS Croaker Memorial (4) , United States Submarine World War II Veterans Memorial East (5) , Groton Bank Historic District (6) , Groton Monument (7) . Display/hide their locations on the map
Beach: (A) . Display/hide its location on the map
Tourist attractions:
Hotels:
Court:
Birthplace of: Eddie Lucas - Basketball player, Nathan Daboll - Mathematician, Ron Athey - Performance artist, Lou Palazzi - Football official, Nathan Daboll (politician) - Politician, Pierre Thuot - astronaut, Silas Deane - (1737-1789), politician and diplomat., Elijah F. Smith - Politician, George Hall (American football) - Football player, Walt Ellis - Football player.
New London County has a predicted average indoor radon screening level greater than 4 pCi/L (pico curies per liter) - Highest Potential Drinking water stations with addresses in Groton and their reported violations in the past:
OAKRIDGE GARDENS, LLC (Population served: 70, Groundwater):
Past health violations:
MCL, Monthly (TCR) - In NOV-2012, Contaminant: Coliform. Follow-up actions: St Public Notif requested (NOV-21-2012), St BCA signed (DEC-21-2012), St Public Notif received (DEC-27-2012), St Compliance achieved (JAN-31-2013)
MCL, Monthly (TCR) - In AUG-2012, Contaminant: Coliform. Follow-up actions: St Public Notif requested (SEP-18-2012), St Violation/Reminder Notice (SEP-18-2012), St BCA signed (DEC-21-2012), St Public Notif received (DEC-27-2012), St Compliance achieved (JAN-31-2013)
MCL, Monthly (TCR) - In JUL-2012, Contaminant: Coliform. Follow-up actions: St Public Notif requested (JUL-23-2012), St Violation/Reminder Notice (JUL-23-2012), St Public Notif received (AUG-02-2012), St BCA signed (DEC-21-2012), St Compliance achieved (JAN-31-2013)
MCL, Acute (TCR) - In JUL-2011, Contaminant: Coliform. Follow-up actions: St Compliance achieved (AUG-30-2011), St Public Notif requested (SEP-08-2011), St Violation/Reminder Notice (SEP-08-2011), St BCA signed (DEC-21-2012), St Public Notif received (DEC-27-2012)
MCL, Monthly (TCR) - In JUL-2011, Contaminant: Coliform. Follow-up actions: St Compliance achieved (AUG-30-2011), St Public Notif requested (SEP-08-2011), St Violation/Reminder Notice (SEP-08-2011), St BCA signed (DEC-21-2012), St Public Notif received (DEC-27-2012)
MCL, Monthly (TCR) - In JUL-2010, Contaminant: Coliform. Follow-up actions: St Public Notif requested (AUG-10-2010), St Violation/Reminder Notice (AUG-10-2010), St Public Notif received (AUG-30-2010), St Compliance achieved (AUG-31-2010), St BCA signed (DEC-21-2012)
6 other older health violations
Past monitoring violations:
Follow-up Or Routine LCR Tap M/R - In JUL-01-2014, Contaminant: Lead and Copper Rule
Follow-up Or Routine LCR Tap M/R - In OCT-01-2013, Contaminant: Lead and Copper Rule. Follow-up actions: St Violation/Reminder Notice (MAY-06-2014), St Compliance achieved (JUN-04-2014)
Monitoring, Repeat Major (TCR) - In NOV-2012, Contaminant: Coliform (TCR). Follow-up actions: St Compliance achieved (JAN-31-2013), St Public Notif requested (APR-11-2013), St Violation/Reminder Notice (APR-11-2013), St Public Notif received (MAY-01-2013)
Monitoring, Source Water (GWR) - In AUG-30-2012, Contaminant: E. COLI. Follow-up actions: St Compliance achieved (NOV-30-2012), St Public Notif requested (DEC-31-2012), St Violation/Reminder Notice (DEC-31-2012), St Public Notif received (MAR-11-2013)
Monitoring, Repeat Major (TCR) - In AUG-2012, Contaminant: Coliform (TCR). Follow-up actions: St Compliance achieved (NOV-30-2012), St Public Notif requested (DEC-31-2012), St Violation/Reminder Notice (DEC-31-2012), St Public Notif received (MAR-11-2013)
16 routine major monitoring violations
One minor monitoring violation
49 regular monitoring violations
One other older monitoring violation
Population served: 33, Groundwater):
Past health violations:
MCL, Monthly (TCR) - Between JUL-2010 and SEP-2010, Contaminant: Coliform. Follow-up actions: St Public Notif requested (SEP-29-2010), St Violation/Reminder Notice (SEP-29-2010), St Compliance achieved (JUN-30-2011)
Past monitoring violations:
Monitoring, Source Water (GWR) - In SEP-20-2010, Contaminant: E. COLI. Follow-up actions: St Public Notif requested (DEC-30-2010), St Violation/Reminder Notice (DEC-30-2010), St Compliance achieved (OCT-25-2013), St Public Notif received (DEC-10-2013)
Follow-up Or Routine LCR Tap M/R - In OCT-01-2003, Contaminant: Lead and Copper Rule. Follow-up actions: St Public Notif requested (JAN-09-2004), St AO (w/penalty) issued (JAN-09-2004), St Compliance achieved (FEB-23-2004), St Public Notif received (MAY-06-2004), St Compliance achieved (JUN-16-2005)
3 routine major monitoring violations
One minor monitoring violation
377 regular monitoring violations
Drinking water stations with addresses in Groton that have no violations reported:
GROTON UTILITIES (Population served: 30,200, Primary Water Source Type: Surface water)
GROTON LONG POINT ASSOCIATION (Population served: 2,400, Primary Water Source Type: Purch surface water)
TRINITY LUTHERAN PRE-SCHOOL (Serves RI, Population served: 45, Primary Water Source Type: Groundwater)
Average household size: This city:
2.2 peopleConnecticut:
2.5 people
Percentage of family households: This city:
57.2%Whole state:
66.3%
Percentage of households with unmarried partners: This city:
8.3%Whole state:
6.6%
Likely homosexual households (counted as self-reported same-sex unmarried-partner households)
Lesbian couples: 0.5% of all households Gay men: 0.3% of all households
994 people in military ships in 2010people in group homes for juveniles (non-correctional) in 2010People in group quarters in Groton in 2000:
722 people in military ships
17 people in unknown juvenile institutions
15 people in religious group quarters
Banks with branches in Groton (2011 data):
Chelsea Groton Bank: Center Groton Branch at Routes 184 And 117, branch established on 1978/05/20; Groton Branch at 904 Poquonnock Road, branch established on 1956/02/20. Info updated 2010/06/21: Bank assets: $836.6 mil, Deposits: $688.4 mil, headquarters in Norwich, CT, positive income , Mortgage Lending Specialization, 14 total offices
Savings Institute Bank and Trust Company: Groton Branch at 971 Poquonnock Road, branch established on 1997/10/16. Info updated 2011/07/21: Bank assets: $939.9 mil, Deposits: $718.1 mil, headquarters in Willimantic, CT, positive income , Commercial Lending Specialization, 21 total offices
Webster Bank, National Association: Groton Branch at 654 Long Hill Road, branch established on 2005/04/11. Info updated 2008/12/23: Bank assets: $18,674.3 mil, Deposits: $13,861.5 mil, headquarters in Waterbury, CT, positive income , Commercial Lending Specialization, 167 total offices , Holding Company: Webster Financial Corporation
RBS Citizens, National Association: Groton Branch at 816 Long Hill Road, branch established on 1999/02/01. Info updated 2007/09/19: Bank assets: $106,940.6 mil, Deposits: $75,690.2 mil, headquarters in Providence, RI, positive income , 1135 total offices , Holding Company: Uk Financial Investments Limited
Bank of America, National Association: Groton Branch at 738 Long Hill Road, branch established on 1960/02/23. Info updated 2009/11/18: Bank assets: $1,451,969.3 mil, Deposits: $1,077,176.8 mil, headquarters in Charlotte, NC, positive income , 5782 total offices , Holding Company: Bank Of America Corporation
Liberty Bank: Groton Square Mall Branch at 597 Long Hill Road, branch established on 1987/10/09. Info updated 2011/01/06: Bank assets: $3,394.1 mil, Deposits: $2,747.0 mil, headquarters in Middletown, CT, positive income , Commercial Lending Specialization, 43 total offices
People's United Bank: Groton Super Branch at 220 Groton Square, branch established on 1997/07/29. Info updated 2012/02/16: Bank assets: $27,319.3 mil, Deposits: $20,835.4 mil, headquarters in Bridgeport, CT, positive income , Commercial Lending Specialization, 374 total offices
For population 15 years and over in Groton:
Never married: 46.0%Now married: 33.7%Separated: 0.9%Widowed: 4.6%Divorced: 14.8% For population 25 years and over in Groton:
High school or higher: 90.9%Bachelor's degree or higher: 30.6%Graduate or professional degree: 9.3%Unemployed: 6.4%Mean travel time to work (commute): 16.5 minutes
Education Gini index (Inequality in education) Here:
10.7Connecticut average:
12.6
Religion statistics for Groton, CT (based on New London County data)
Religion Adherents Congregations Catholic 84,765 34 Mainline Protestant 18,993 79 Evangelical Protestant 9,320 75 Other 5,022 32 Black Protestant 2,594 10 Orthodox 2,456 4 None 150,905 -
Source: Clifford Grammich, Kirk Hadaway, Richard Houseal, Dale E.Jones, Alexei Krindatch, Richie Stanley and Richard H.Taylor. 2012. 2010 U.S.Religion Census: Religious Congregations & Membership Study. Association of Statisticians of American Religious Bodies. Jones, Dale E., et al. 2002. Congregations and Membership in the United States 2000. Nashville, TN: Glenmary Research Center. Graphs represent county-level data
Food Environment Statistics: Number of grocery stores : 48New London County :
1.82 / 10,000 pop.State :
2.21 / 10,000 pop.
Number of supercenters and club stores : 3New London County :
0.11 / 10,000 pop.Connecticut :
0.07 / 10,000 pop.
Number of convenience stores (no gas) : 36New London County :
1.36 / 10,000 pop.Connecticut :
1.02 / 10,000 pop.
Number of convenience stores (with gas) : 85New London County :
3.22 / 10,000 pop.State :
2.27 / 10,000 pop.
Number of full-service restaurants : 264Here :
10.01 / 10,000 pop.Connecticut :
9.19 / 10,000 pop.
Adult diabetes rate : New London County :
7.6%Connecticut :
7.3%
Adult obesity rate : New London County :
22.4%Connecticut :
21.5%
Low-income preschool obesity rate : New London County :
16.5%Connecticut :
15.8%
Health and Nutrition:
Average overall health of teeth and gums : Groton:
47.6%Connecticut:
47.5%
Average BMI : This city:
28.5Connecticut:
28.7
People feeling badly about themselves : Groton:
19.7%Connecticut:
20.9%
People not drinking alcohol at all : Groton:
10.9%Connecticut:
10.5%
Average hours sleeping at night : Groton:
6.8Connecticut:
6.8
Overweight people : Groton:
31.6%Connecticut:
34.2%
General health condition : Groton:
57.8%Connecticut:
56.4%
Average condition of hearing : This city:
80.4%Connecticut:
78.9%
More about Health and Nutrition of Groton, CT Residents
Local government employment and payroll (March 2019)
Function
Full-time employees
Monthly full-time payroll
Average yearly full-time wage
Part-time employees
Monthly part-time payroll
Electric Power
63 $344,906 $65,696 0 $0 Water Supply
41 $423,628 $123,989 0 $0 Police Protection - Officers
25 $226,978 $108,949 0 $0 Streets and Highways
19 $106,144 $67,038 0 $0 Firefighters
13 $134,637 $124,280 0 $0 Other Government Administration
10 $57,292 $68,750 0 $0 Police - Other
9 $42,262 $56,349 1 $1,563 Solid Waste Management
6 $42,302 $84,604 0 $0 Financial Administration
5 $32,639 $78,334 0 $0 Parks and Recreation
5 $23,139 $55,534 6 $7,174 Fire - Other
2 $16,014 $96,084 0 $0
Totals for Government
198 $1,449,941 $87,875 7 $8,738
Groton government finances - Expenditure in 2021 (per resident):
Current Operations - Electric Utilities: $67,173,000 ($7185.05)
Water Utilities: $8,790,000 ($940.21)Police Protection: $4,991,000 ($533.85)Local Fire Protection: $3,027,000 ($323.78)Sewerage: $2,336,000 ($249.87)Regular Highways: $1,935,000 ($206.97)Parks and Recreation: $1,179,000 ($126.11)Central Staff Services: $1,094,000 ($117.02)Solid Waste Management: $990,000 ($105.89)Financial Administration: $936,000 ($100.12)General - Other: $834,000 ($89.21)General Public Buildings: $140,000 ($14.97)Electric Utilities - Interest on Debt: $1,260,000 ($134.77)
General - Interest on Debt: $27,000 ($2.89)
Other Capital Outlay - General - Other: $1,081,000 ($115.63)
Water Utilities - Interest on Debt: $24,000 ($2.57)
Groton government finances - Revenue in 2021 (per resident):
Charges - Sewerage: $3,779,000 ($404.21)
Other: $868,000 ($92.84)Parks and Recreation: $195,000 ($20.86)Solid Waste Management: $9,000 ($0.96)Local Intergovernmental - Other: $2,907,000 ($310.94)
Highways: $2,440,000 ($260.99)General Local Government Support: $46,000 ($4.92)Miscellaneous - Interest Earnings: $358,000 ($38.29)
General Revenue - Other: $304,000 ($32.52)Fines and Forfeits: $28,000 ($2.99)Revenue - Electric Utilities: $76,821,000 ($8217.03)
Water Utilities: $10,879,000 ($1163.65)State Intergovernmental - Water Utilities: $8,449,000 ($903.73)
Other: $350,000 ($37.44)Highways: $83,000 ($8.88)Tax - Property: $5,514,000 ($589.80)
Other License: $622,000 ($66.53)
Groton government finances - Debt in 2021 (per resident):
Long Term Debt - Beginning Outstanding - Unspecified Public Purpose: $50,415,000 ($5392.56)
Outstanding Unspecified Public Purpose: $44,898,000 ($4802.44)Retired Unspecified Public Purpose: $5,517,000 ($590.12)
Groton government finances - Cash and Securities in 2021 (per resident):
Bond Funds - Cash and Securities: $1,254,000 ($134.13)
Other Funds - Cash and Securities: $76,129,000 ($8143.01)
6.16% of this county's 2021 resident taxpayers lived in other counties in 2020 ($81,025 average adjusted gross income )
Here:
6.16%Connecticut average:
5.79%
0.04% of residents moved from foreign countries ($359 average AGI )New London County:
0.04%Connecticut average:
0.02%
Top counties from which taxpayers relocated into this county between 2020 and 2021:
6.02% of this county's 2020 resident taxpayers moved to other counties in 2021 ($71,482 average adjusted gross income )
Here:
6.02%Connecticut average:
5.82%
0.05% of residents moved to foreign countries ($502 average AGI )New London County:
0.05%Connecticut average:
0.02%
Top counties to which taxpayers relocated from this county between 2020 and 2021:
Businesses in Groton, CT
Name Count Name Count
AT&T 1 McDonald's 1 Advance Auto Parts 1 Nike 2 Applebee's 1 Nissan 1 AutoZone 1 Payless 1 Best Western 1 Penske 1 Burger King 1 Pizza Hut 1 CVS 1 Quality 1 Casual Male XL 1 Quiznos 1 Dairy Queen 1 RadioShack 1 Days Inn 1 Ramada 1 Domino's Pizza 1 Sprint Nextel 1 Dunkin Donuts 7 Starbucks 3 Econo Lodge 1 Stop & Shop 1 Fashion Bug 1 Subway 3 FedEx 5 Super 8 1 GNC 2 T-Mobile 2 GameStop 1 T.J.Maxx 1 Goodwill 5 Taco Bell 1 H&R Block 2 Toys"R"Us 1 Hilton 2 True Value 1 Howard Johnson 1 U-Haul 2 Jones New York 2 UPS 6 KFC 1 Vans 1 Knights Inn 1 Walgreens 1 Kohl's 1 Walmart 1 Marriott 1 Wendy's 1 MasterBrand Cabinets 4
Strongest AM radio stations in Groton:
WSUB (980 AM; 1 kW; GROTON, CT; Owner: CITADEL BROADCASTING COMPANY)
WALE (990 AM; 50 kW; GREENVILLE, RI; Owner: NORTH AMERICAN BROADCASTING CO., INC.)
WTIC (1080 AM; 50 kW; HARTFORD, CT; Owner: INFINITY RADIO OPERATIONS INC.)
WICH (1310 AM; 5 kW; NORWICH, CT; Owner: WICH, INCORPORATED)
WNNZ (640 AM; 50 kW; WESTFIELD, MA; Owner: CLEAR CHANNEL BROADCASTING LICENSES, INC.)
WCRN (830 AM; 50 kW; WORCESTER, MA; Owner: CARTER BROADCASTING CORPORATION)
WLIS (1420 AM; 5 kW; OLD SAYBROOK, CT; Owner: CROSSROADS COMM. OLD SAYBROOK, LLC)
WEEI (850 AM; 50 kW; BOSTON, MA; Owner: ENTERCOM BOSTON LICENSE, LLC)
WRKO (680 AM; 50 kW; BOSTON, MA; Owner: ENTERCOM BOSTON LICENSE, LLC)
WVNE (760 AM; daytime; 25 kW; LEICESTER, MA; Owner: BLOUNT MASSCOM, INC.)
WFAN (660 AM; 50 kW; NEW YORK, NY; Owner: INFINITY BROADCASTING OPERATIONS, INC.)
WKOX (1200 AM; 50 kW; FRAMINGHAM, MA; Owner: CAPSTAR TX LIMITED PARTNERSHIP)
WBIX (1060 AM; 40 kW; NATICK, MA; Owner: LANGER BROADCASTING CORPORATION)
Strongest FM radio stations in Groton:
WNLC (98.7 FM; EAST LYME, CT; Owner: HALL COMMUNICATIONS, INC.)
WQGN-FM (105.5 FM; GROTON, CT; Owner: CITADEL BROADCASTING COMPANY)
W233AG (94.5 FM; NEW LONDON, CT; Owner: MONROE BOARD OF EDUCATION)
WCNI (90.9 FM; NEW LONDON, CT; Owner: CONNECTICUT COLLEGE BROADCASTING ASSOCIATION, INC.)
WBMW (106.5 FM; LEDYARD, CT; Owner: RED WOLF BROADCASTING CORPORATION)
WKNL (100.9 FM; NEW LONDON, CT; Owner: HALL COMMUNICATIONS, INC.)
WCTY (97.7 FM; NORWICH, CT; Owner: WICH, INC.)
WHJM (107.7 FM; PAWCATUCK, CT; Owner: FULLER BROADCASTING INTERNATIONAL, LLC)
WXLM (102.3 FM; STONINGTON, CT; Owner: CITADEL BROADCASTING COMPANY)
WWRX-FM (103.7 FM; WESTERLY, RI; Owner: FNX BROADCASTING OF RHODE ISLAND, LLC)
WRCH (100.5 FM; NEW BRITAIN, CT; Owner: INFINITY RADIO OPERATIONS INC.)
WILI-FM (98.3 FM; WILLIMANTIC, CT; Owner: NUTMEG BROADCASTING COMPANY)
WKCI-FM (101.3 FM; HAMDEN, CT; Owner: CLEAR CHANNEL BROADCASTING LICENSES, INC.)
WSKO-FM (99.7 FM; WAKEFIELD-PEACEDALE, RI; Owner: CITADEL BROADCASTING COMPANY)
WSUF (89.9 FM; NOYACK, NY; Owner: SACRED HEART UNIVERSITY, INC.)
W227AJ (93.3 FM; NORTHFORD, CT; Owner: SACRED HEART UNIVERSITY)
WECS (90.1 FM; WILLIMANTIC, CT; Owner: EASTERN CONNECTICUT STATE COLLEGE)
WHBE (96.7 FM; EAST HAMPTON, NY; Owner: AAA ENTERTAINMENT LICENSING LLC)
WMOS (104.7 FM; MONTAUK, NY; Owner: CITADEL BROADCASTING COMPANY)
TV broadcast stations around Groton:
WHPX (Channel 26; NEW LONDON, CT; Owner: PAXSON HARTFORD LICENSE, INC.)
WEDN (Channel 53; NORWICH, CT; Owner: CONNECTICUT PUBLIC BROADCASTING, INC.)
WPXQ (Channel 69; BLOCK ISLAND, RI; Owner: OCEAN STATE TELEVISION, L.L.C.)
WTIC-TV (Channel 61; HARTFORD, CT; Owner: TRIBUNE TELEVISION COMPANY)
W11BJ (Channel 11; HARTFORD, CT; Owner: COMMUNICATIONS SITE MANAGEMENT LLC)
WTXX (Channel 20; WATERBURY, CT; Owner: WTXX INC.)
WVIT (Channel 30; NEW BRITAIN, CT; Owner: OUTLET BROADCASTING, INC)
National Bridge Inventory (NBI) Statistics 7 Number of bridges640ft / 195m Total length $135,000,000 Total costs170,500 Total average daily traffic19,702 Total average daily truck traffic
Home Mortgage Disclosure Act Aggregated Statistics For Year 2009(Based on 3 full tracts) A) FHA, FSA/RHS & VA B) Conventional C) Refinancings D) Home Improvement Loans E) Loans on Dwellings For 5+ Families F) Non-occupant Loans on G) Loans On Manufactured Number Average Value Number Average Value Number Average Value Number Average Value Number Average Value Number Average Value Number Average Value
LOANS ORIGINATED 39 $184,564 24 $152,167 140 $172,421 24 $46,583 0 $0 12 $190,000 0 $0 APPLICATIONS APPROVED, NOT ACCEPTED 2 $135,000 3 $127,667 8 $125,500 2 $54,000 0 $0 2 $174,500 1 $15,000 APPLICATIONS DENIED 14 $160,071 4 $120,500 60 $189,217 7 $80,143 0 $0 7 $149,429 0 $0 APPLICATIONS WITHDRAWN 1 $102,000 7 $153,143 35 $183,143 2 $134,500 1 $100,000 0 $0 1 $76,000 FILES CLOSED FOR INCOMPLETENESS 0 $0 0 $0 5 $210,400 1 $80,000 0 $0 0 $0 0 $0
Aggregated Statistics For Year 2008(Based on 3 full tracts) A) FHA, FSA/RHS & VA B) Conventional C) Refinancings D) Home Improvement Loans E) Loans on Dwellings For 5+ Families F) Non-occupant Loans on G) Loans On Manufactured Number Average Value Number Average Value Number Average Value Number Average Value Number Average Value Number Average Value Number Average Value
LOANS ORIGINATED 26 $188,923 44 $192,818 82 $175,988 29 $60,966 1 $3,174,000 17 $189,000 1 $31,000 APPLICATIONS APPROVED, NOT ACCEPTED 0 $0 7 $241,714 8 $177,875 2 $27,500 0 $0 1 $332,000 0 $0 APPLICATIONS DENIED 2 $208,000 6 $153,500 68 $164,779 27 $38,148 0 $0 5 $123,400 2 $90,000 APPLICATIONS WITHDRAWN 3 $242,000 3 $238,000 21 $186,857 4 $105,750 0 $0 2 $210,000 0 $0 FILES CLOSED FOR INCOMPLETENESS 0 $0 1 $360,000 2 $153,000 2 $39,500 0 $0 0 $0 0 $0
Aggregated Statistics For Year 2007(Based on 3 full tracts) A) FHA, FSA/RHS & VA B) Conventional C) Refinancings D) Home Improvement Loans F) Non-occupant Loans on Number Average Value Number Average Value Number Average Value Number Average Value Number Average Value
LOANS ORIGINATED 17 $196,588 99 $168,485 104 $162,606 54 $52,278 20 $183,400 APPLICATIONS APPROVED, NOT ACCEPTED 0 $0 10 $213,500 17 $174,294 6 $50,833 4 $158,000 APPLICATIONS DENIED 1 $246,000 18 $210,667 88 $181,489 25 $70,320 6 $117,833 APPLICATIONS WITHDRAWN 1 $169,000 13 $218,923 47 $182,426 4 $177,750 6 $192,500 FILES CLOSED FOR INCOMPLETENESS 0 $0 2 $172,500 11 $181,727 1 $25,000 1 $222,000
Aggregated Statistics For Year 2006(Based on 3 full tracts) A) FHA, FSA/RHS & VA B) Conventional C) Refinancings D) Home Improvement Loans F) Non-occupant Loans on Number Average Value Number Average Value Number Average Value Number Average Value Number Average Value
LOANS ORIGINATED 32 $197,875 150 $163,560 179 $169,346 52 $70,115 34 $234,647 APPLICATIONS APPROVED, NOT ACCEPTED 0 $0 16 $174,062 37 $176,054 4 $87,750 3 $606,333 APPLICATIONS DENIED 3 $176,000 33 $146,424 101 $182,327 29 $85,517 8 $326,750 APPLICATIONS WITHDRAWN 0 $0 9 $120,667 73 $163,630 4 $40,000 3 $115,333 FILES CLOSED FOR INCOMPLETENESS 0 $0 8 $125,375 8 $174,625 0 $0 2 $27,000
Aggregated Statistics For Year 2005(Based on 3 full tracts) A) FHA, FSA/RHS & VA B) Conventional C) Refinancings D) Home Improvement Loans F) Non-occupant Loans on G) Loans On Manufactured Number Average Value Number Average Value Number Average Value Number Average Value Number Average Value Number Average Value
LOANS ORIGINATED 21 $174,190 135 $149,793 176 $138,307 67 $59,493 21 $210,667 1 $112,000 APPLICATIONS APPROVED, NOT ACCEPTED 0 $0 9 $257,222 22 $120,455 4 $116,000 1 $998,000 0 $0 APPLICATIONS DENIED 0 $0 23 $124,565 103 $146,583 33 $46,606 4 $121,750 4 $34,250 APPLICATIONS WITHDRAWN 1 $169,000 17 $178,706 105 $153,448 4 $77,500 7 $332,714 0 $0 FILES CLOSED FOR INCOMPLETENESS 0 $0 9 $153,778 10 $166,500 1 $30,000 1 $176,000 1 $35,000
Aggregated Statistics For Year 2004(Based on 3 full tracts) A) FHA, FSA/RHS & VA B) Conventional C) Refinancings D) Home Improvement Loans E) Loans on Dwellings For 5+ Families F) Non-occupant Loans on G) Loans On Manufactured Number Average Value Number Average Value Number Average Value Number Average Value Number Average Value Number Average Value Number Average Value
LOANS ORIGINATED 15 $158,267 142 $145,458 182 $134,522 70 $56,571 2 $955,000 30 $143,700 1 $142,000 APPLICATIONS APPROVED, NOT ACCEPTED 3 $198,333 16 $146,500 26 $141,462 9 $35,000 1 $450,000 3 $84,667 0 $0 APPLICATIONS DENIED 2 $122,000 35 $138,057 87 $130,195 20 $67,450 1 $500,000 3 $167,000 3 $59,667 APPLICATIONS WITHDRAWN 0 $0 16 $107,438 98 $136,408 7 $49,143 1 $188,000 3 $94,333 1 $40,000 FILES CLOSED FOR INCOMPLETENESS 0 $0 1 $150,000 8 $179,000 2 $122,500 0 $0 1 $150,000 0 $0
Aggregated Statistics For Year 2003(Based on 3 full tracts) A) FHA, FSA/RHS & VA B) Conventional C) Refinancings D) Home Improvement Loans E) Loans on Dwellings For 5+ Families F) Non-occupant Loans on Number Average Value Number Average Value Number Average Value Number Average Value Number Average Value Number Average Value
LOANS ORIGINATED 24 $133,125 136 $137,824 410 $119,900 54 $44,019 3 $436,667 42 $117,095 APPLICATIONS APPROVED, NOT ACCEPTED 3 $90,667 10 $119,100 42 $130,024 8 $39,625 0 $0 3 $113,667 APPLICATIONS DENIED 2 $153,000 24 $135,958 112 $133,500 15 $37,200 0 $0 16 $103,688 APPLICATIONS WITHDRAWN 1 $203,000 10 $132,800 88 $123,955 4 $32,750 0 $0 6 $140,833 FILES CLOSED FOR INCOMPLETENESS 1 $96,000 1 $152,000 3 $145,333 0 $0 0 $0 1 $70,000
Aggregated Statistics For Year 2002(Based on 3 full tracts) A) FHA, FSA/RHS & VA B) Conventional C) Refinancings D) Home Improvement Loans E) Loans on Dwellings For 5+ Families F) Non-occupant Loans on Number Average Value Number Average Value Number Average Value Number Average Value Number Average Value Number Average Value
LOANS ORIGINATED 27 $120,815 104 $123,769 243 $112,329 54 $40,704 2 $6,600,000 26 $114,077 APPLICATIONS APPROVED, NOT ACCEPTED 2 $99,000 8 $100,375 28 $119,750 8 $21,250 0 $0 4 $118,250 APPLICATIONS DENIED 6 $107,167 8 $121,625 80 $104,862 19 $27,158 0 $0 7 $105,286 APPLICATIONS WITHDRAWN 1 $125,000 9 $215,000 40 $113,500 4 $39,750 1 $160,000 5 $87,400 FILES CLOSED FOR INCOMPLETENESS 1 $122,000 4 $95,250 9 $691,000 1 $118,000 0 $0 3 $74,333
Aggregated Statistics For Year 2001(Based on 3 full tracts) A) FHA, FSA/RHS & VA B) Conventional C) Refinancings D) Home Improvement Loans E) Loans on Dwellings For 5+ Families F) Non-occupant Loans on Number Average Value Number Average Value Number Average Value Number Average Value Number Average Value Number Average Value
LOANS ORIGINATED 50 $116,920 79 $105,190 153 $105,059 64 $41,391 2 $370,500 29 $89,379 APPLICATIONS APPROVED, NOT ACCEPTED 2 $150,500 7 $137,000 13 $79,846 6 $43,167 0 $0 2 $68,500 APPLICATIONS DENIED 5 $128,600 9 $89,778 67 $82,627 21 $30,238 1 $255,000 7 $106,429 APPLICATIONS WITHDRAWN 4 $136,750 7 $89,429 47 $102,681 9 $23,222 0 $0 3 $76,333 FILES CLOSED FOR INCOMPLETENESS 0 $0 4 $104,250 4 $129,750 1 $43,000 0 $0 0 $0
Aggregated Statistics For Year 2000(Based on 3 full tracts) A) FHA, FSA/RHS & VA B) Conventional C) Refinancings D) Home Improvement Loans E) Loans on Dwellings For 5+ Families F) Non-occupant Loans on Number Average Value Number Average Value Number Average Value Number Average Value Number Average Value Number Average Value
LOANS ORIGINATED 35 $106,943 82 $112,744 50 $88,300 62 $29,935 1 $4,773,000 14 $83,143 APPLICATIONS APPROVED, NOT ACCEPTED 2 $86,000 7 $92,286 11 $81,545 7 $21,286 0 $0 2 $67,000 APPLICATIONS DENIED 1 $111,000 13 $68,846 37 $71,622 20 $26,100 1 $5,200,000 3 $40,000 APPLICATIONS WITHDRAWN 2 $95,500 5 $105,200 29 $74,172 11 $31,182 1 $4,200,000 1 $85,000 FILES CLOSED FOR INCOMPLETENESS 0 $0 1 $113,000 4 $75,000 0 $0 0 $0 1 $85,000
Aggregated Statistics For Year 1999(Based on 2 full and 1 partial tracts) A) FHA, FSA/RHS & VA B) Conventional C) Refinancings D) Home Improvement Loans E) Loans on Dwellings For 5+ Families F) Non-occupant Loans on Number Average Value Number Average Value Number Average Value Number Average Value Number Average Value Number Average Value
LOANS ORIGINATED 40 $94,422 59 $114,114 83 $101,225 52 $32,491 1 $196,180 14 $104,265 APPLICATIONS APPROVED, NOT ACCEPTED 0 $0 9 $86,814 20 $78,732 4 $10,395 0 $0 7 $87,853 APPLICATIONS DENIED 1 $84,130 24 $61,632 38 $75,714 17 $35,463 0 $0 11 $91,773 APPLICATIONS WITHDRAWN 5 $102,986 14 $145,150 29 $71,199 11 $36,063 0 $0 2 $89,550 FILES CLOSED FOR INCOMPLETENESS 0 $0 1 $219,550 10 $103,781 0 $0 0 $0 0 $0
Detailed HMDA statistics for the following Tracts:
7024.00
, 7025.00 , 7026.00
Private Mortgage Insurance Companies Aggregated Statistics For Year 2009(Based on 1 full tract) A) Conventional B) Refinancings Number Average Value Number Average Value
LOANS ORIGINATED 2 $189,000 2 $186,000 APPLICATIONS APPROVED, NOT ACCEPTED 1 $118,000 0 $0 APPLICATIONS DENIED 0 $0 0 $0 APPLICATIONS WITHDRAWN 0 $0 0 $0 FILES CLOSED FOR INCOMPLETENESS 0 $0 0 $0
Aggregated Statistics For Year 2008(Based on 3 full tracts) A) Conventional B) Refinancings C) Non-occupant Loans on Number Average Value Number Average Value Number Average Value
LOANS ORIGINATED 13 $190,385 10 $205,500 1 $190,000 APPLICATIONS APPROVED, NOT ACCEPTED 6 $215,333 6 $252,833 0 $0 APPLICATIONS DENIED 1 $100,000 7 $429,286 1 $516,000 APPLICATIONS WITHDRAWN 0 $0 0 $0 0 $0 FILES CLOSED FOR INCOMPLETENESS 1 $280,000 0 $0 1 $280,000
Aggregated Statistics For Year 2007(Based on 3 full tracts) A) Conventional B) Refinancings C) Non-occupant Loans on Number Average Value Number Average Value Number Average Value
LOANS ORIGINATED 37 $182,054 5 $214,200 4 $167,500 APPLICATIONS APPROVED, NOT ACCEPTED 6 $176,333 1 $297,000 0 $0 APPLICATIONS DENIED 0 $0 2 $254,000 0 $0 APPLICATIONS WITHDRAWN 1 $260,000 0 $0 0 $0 FILES CLOSED FOR INCOMPLETENESS 0 $0 0 $0 0 $0
Aggregated Statistics For Year 2006(Based on 3 full tracts) A) Conventional B) Refinancings C) Non-occupant Loans on Number Average Value Number Average Value Number Average Value
LOANS ORIGINATED 27 $165,148 4 $227,750 6 $164,667 APPLICATIONS APPROVED, NOT ACCEPTED 7 $168,143 2 $170,500 0 $0 APPLICATIONS DENIED 0 $0 0 $0 0 $0 APPLICATIONS WITHDRAWN 0 $0 0 $0 0 $0 FILES CLOSED FOR INCOMPLETENESS 0 $0 0 $0 0 $0
Aggregated Statistics For Year 2005(Based on 3 full tracts) A) Conventional B) Refinancings C) Non-occupant Loans on Number Average Value Number Average Value Number Average Value
LOANS ORIGINATED 21 $185,476 2 $146,500 2 $153,500 APPLICATIONS APPROVED, NOT ACCEPTED 5 $232,200 2 $187,500 0 $0 APPLICATIONS DENIED 1 $220,000 0 $0 1 $220,000 APPLICATIONS WITHDRAWN 1 $230,000 0 $0 0 $0 FILES CLOSED FOR INCOMPLETENESS 1 $63,000 0 $0 0 $0
Aggregated Statistics For Year 2004(Based on 3 full tracts) A) Conventional B) Refinancings C) Non-occupant Loans on Number Average Value Number Average Value Number Average Value
LOANS ORIGINATED 33 $169,364 7 $138,143 5 $192,200 APPLICATIONS APPROVED, NOT ACCEPTED 7 $194,286 2 $145,500 3 $152,000 APPLICATIONS DENIED 0 $0 2 $173,500 0 $0 APPLICATIONS WITHDRAWN 0 $0 0 $0 0 $0 FILES CLOSED FOR INCOMPLETENESS 0 $0 0 $0 0 $0
Aggregated Statistics For Year 2003(Based on 3 full tracts) A) Conventional B) Refinancings C) Non-occupant Loans on Number Average Value Number Average Value Number Average Value
LOANS ORIGINATED 36 $131,306 22 $141,364 4 $134,250 APPLICATIONS APPROVED, NOT ACCEPTED 7 $144,143 2 $118,500 0 $0 APPLICATIONS DENIED 1 $142,000 0 $0 1 $142,000 APPLICATIONS WITHDRAWN 2 $146,500 1 $148,000 1 $144,000 FILES CLOSED FOR INCOMPLETENESS 1 $160,000 0 $0 0 $0
Aggregated Statistics For Year 2002(Based on 3 full tracts) A) Conventional B) Refinancings C) Non-occupant Loans on Number Average Value Number Average Value Number Average Value
LOANS ORIGINATED 31 $125,645 20 $127,150 4 $127,250 APPLICATIONS APPROVED, NOT ACCEPTED 5 $174,600 6 $107,000 2 $91,000 APPLICATIONS DENIED 2 $111,500 1 $88,000 1 $146,000 APPLICATIONS WITHDRAWN 1 $154,000 2 $80,000 1 $42,000 FILES CLOSED FOR INCOMPLETENESS 0 $0 0 $0 0 $0
Aggregated Statistics For Year 2001(Based on 3 full tracts) A) Conventional B) Refinancings C) Non-occupant Loans on Number Average Value Number Average Value Number Average Value
LOANS ORIGINATED 26 $111,462 12 $122,667 4 $78,000 APPLICATIONS APPROVED, NOT ACCEPTED 8 $133,125 5 $124,200 2 $105,000 APPLICATIONS DENIED 0 $0 0 $0 0 $0 APPLICATIONS WITHDRAWN 0 $0 0 $0 0 $0 FILES CLOSED FOR INCOMPLETENESS 0 $0 0 $0 0 $0
Aggregated Statistics For Year 2000(Based on 3 full tracts) A) Conventional B) Refinancings C) Non-occupant Loans on Number Average Value Number Average Value Number Average Value
LOANS ORIGINATED 29 $116,345 7 $97,000 2 $50,000 APPLICATIONS APPROVED, NOT ACCEPTED 8 $90,125 1 $113,000 3 $79,000 APPLICATIONS DENIED 0 $0 0 $0 0 $0 APPLICATIONS WITHDRAWN 0 $0 0 $0 0 $0 FILES CLOSED FOR INCOMPLETENESS 0 $0 1 $86,000 1 $86,000
Aggregated Statistics For Year 1999(Based on 2 full and 1 partial tracts) A) Conventional B) Refinancings C) Non-occupant Loans on Number Average Value Number Average Value Number Average Value
LOANS ORIGINATED 16 $99,631 9 $118,170 5 $101,840 APPLICATIONS APPROVED, NOT ACCEPTED 1 $111,820 0 $0 0 $0 APPLICATIONS DENIED 0 $0 0 $0 0 $0 APPLICATIONS WITHDRAWN 0 $0 1 $74,370 0 $0 FILES CLOSED FOR INCOMPLETENESS 0 $0 1 $174,060 0 $0
Detailed PMIC statistics for the following Tracts:
7024.00
, 7025.00 , 7026.00 Fire-safe hotels and motels in Groton, Connecticut:
Ramada Inn Groton, 156 Kings Hwy, Groton, Connecticut 06340 Phone: (860) 446-0660, Fax: (860) 445-4082
Econolodge Inn & Suites, 605 Goldstar Hwy, Groton, Connecticut 06340 Phone: (860) 445-1986, Fax: (860) 449-9426
Baymont Inn & Suites, 360 Rt 12, Groton, Connecticut 06340 Phone: (860) 445-8000, Fax: (860) 449-9173
Knights Inn, 425 Bridge St, Groton, Connecticut 06340 Phone: (860) 445-6550, Fax: (860) 455-5833
Groton Inn & Suites, 99 Gold Star Hwy, Groton, Connecticut 06340 Phone: (860) 445-9784
Days Inn & Suites Groton, 135 Gold Star Hwy, Groton, Connecticut 06340 Phone: (860) 448-3000, Fax: (860) 445-1152
Quality Inn, 404 Bridge St, Groton, Connecticut 06340 Phone: (860) 445-8141, Fax: (860) 445-8141
Thames Harbour Inn, 193 Thames St, Groton, Connecticut 06340 Phone: (860) 445-8111
5 other hotels and motels
All 13 fire-safe hotels and motels in Groton, Connecticut
Most common first names in Groton, CT among deceased individuals Name Count Lived (average)
Mary 215 81.4 years John 213 75.3 years William 171 73.6 years Robert 128 72.7 years Charles 106 76.3 years Dorothy 101 80.3 years James 100 70.5 years Elizabeth 96 81.2 years Joseph 92 75.9 years Helen 91 80.6 years
Most common last names in Groton, CT among deceased individuals Last name Count Lived (average)
Smith 60 78.3 years Brown 47 76.2 years Johnson 43 77.2 years Anderson 32 78.2 years Chapman 27 79.6 years Miller 25 74.3 years Sullivan 24 77.1 years Robinson 23 68.2 years Edwards 21 76.4 years Davis 20 73.7 years
Groton compared to Connecticut state average:
Unemployed percentage below state average. Median age significantly below state average. Foreign-born population percentage below state average. Renting percentage above state average. Length of stay since moving in significantly above state average.
#5 on the list of "Top 101 cities with the largest percentage of people in military ships (population 1,000+)"
#45 on the list of "Top 101 cities with largest percentage of males in occupations: architecture and engineering occupations (population 5,000+)"
#53 on the list of "Top 101 cities that people commute into (largest positive percentage daily daytime population change due to commuting) (population 5,000+)"
#90 on the list of "Top 100 cities with strongest arts, entertainment, recreation, accommodation and food services industries (pop. 5,000+)"
#92 on the list of "Top 101 cities with the lowest number of burglaries per 100,000 residents (population 5,000+)"
#16 on the list of "Top 101 counties with the lowest average weight of females"
#28 on the list of "Top 101 counties with the highest percentage of residents that visited a dentist within the past year"
#28 on the list of "Top 101 counties with highest percentage of residents voting for Obama (Democrat) in the 2012 Presidential Election"
#51 on the list of "Top 101 counties with the lowest percentage of residents that drank alcohol in the past 30 days"
#66 on the list of "Top 101 counties with the lowest percentage of residents that keep firearms around their homes"
Top Patent Applicants
Jinquan Xu (27)
Joel S. Douglas (18)
Rajesh Kumar (17)
Ravi M. Shanker (17)
Vincent Mascitti (14)
Robert L. Dow (11)
Ye Che (8)
Michael Joseph Luzzio (7)
Matthew P. Wilson (7)
Victor Stancovski (6)
Total of 278 patent applications in 2008-2024.


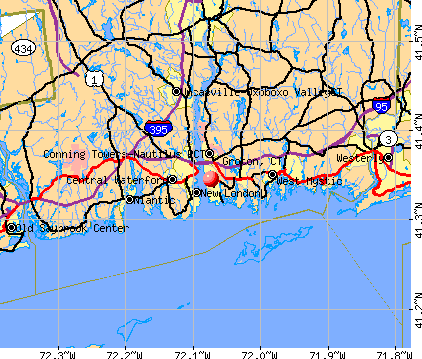


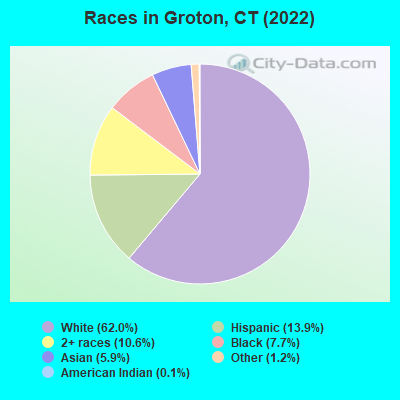
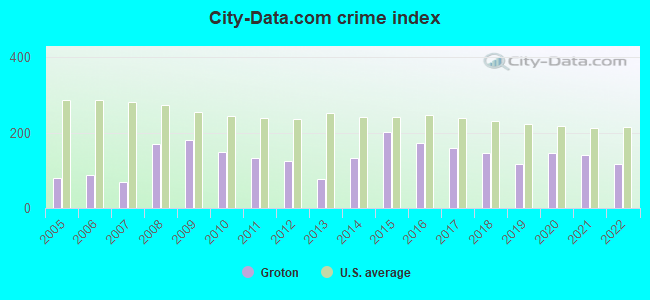
 Recent articles from our blog. Our writers, many of them Ph.D. graduates or candidates, create easy-to-read articles on a wide variety of topics.

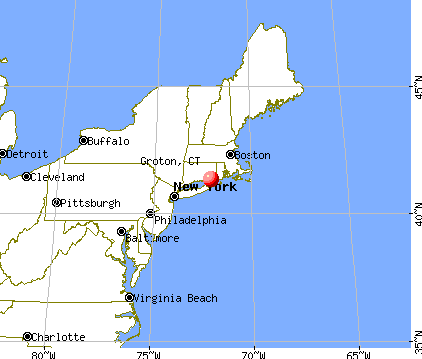
 (38.0 miles
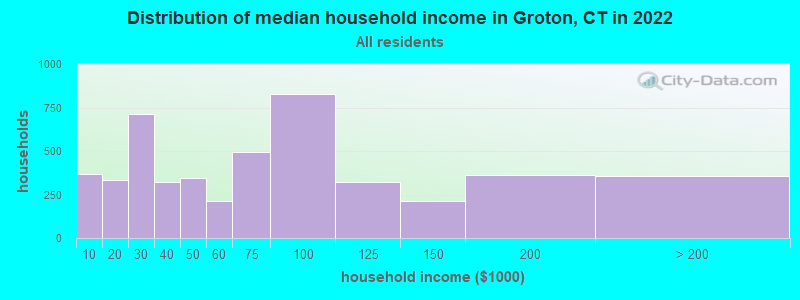
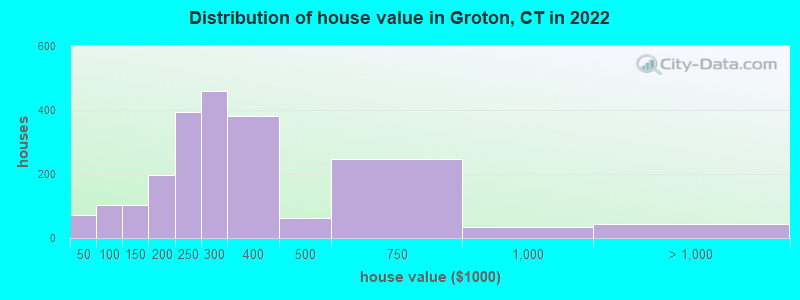
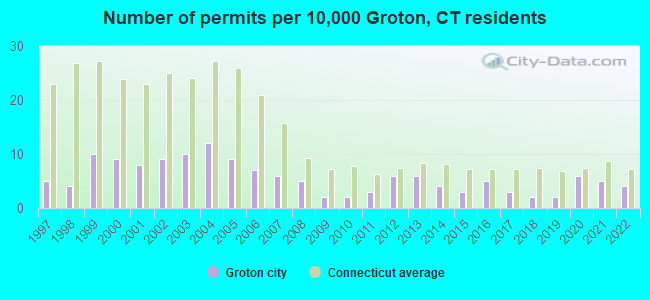
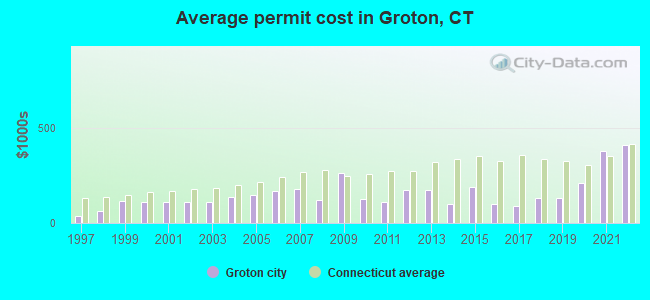
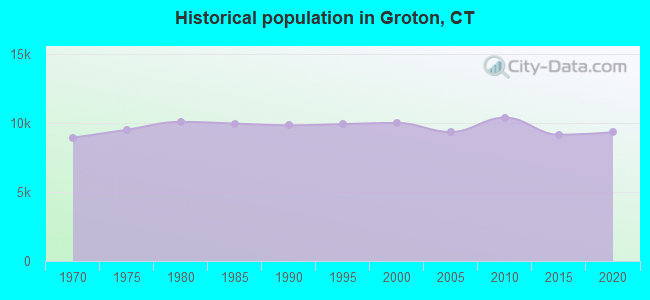
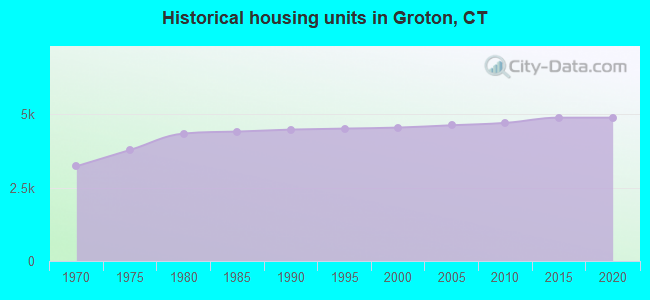
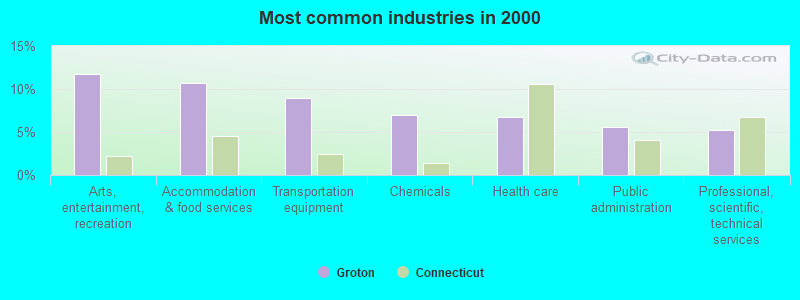
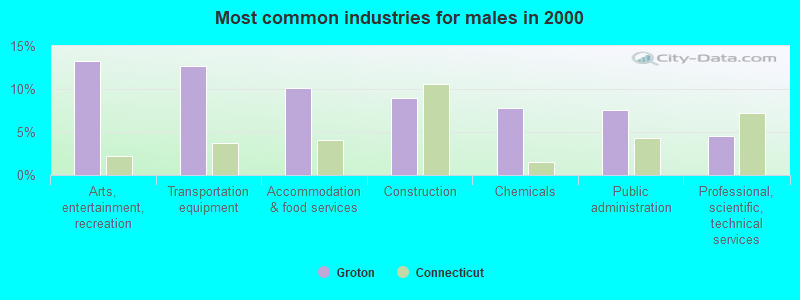
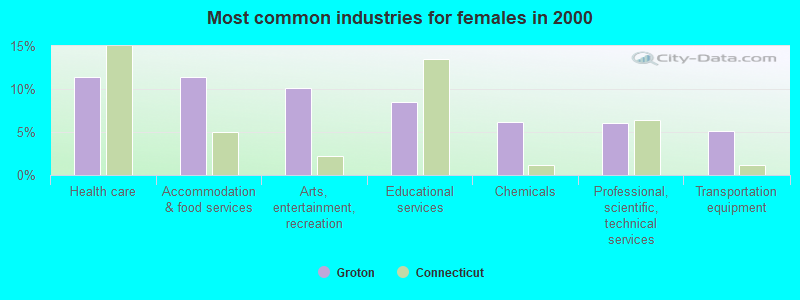
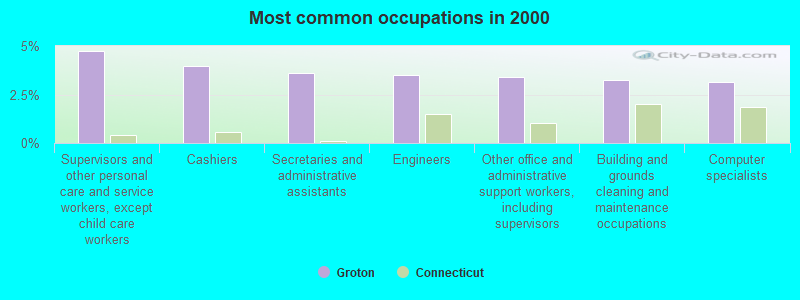
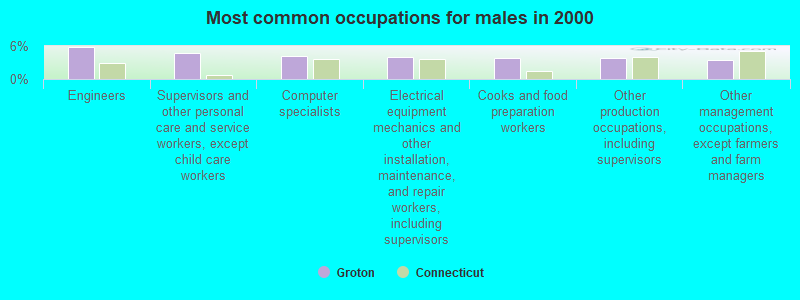
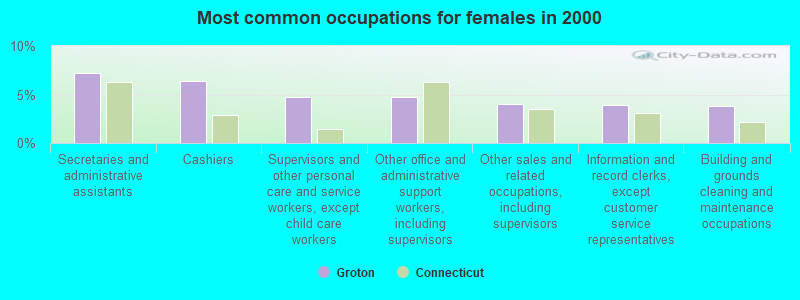
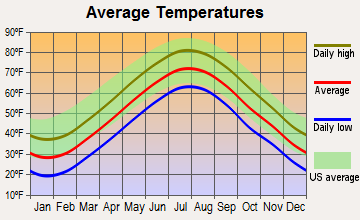
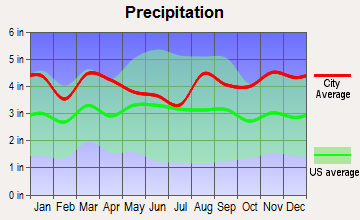
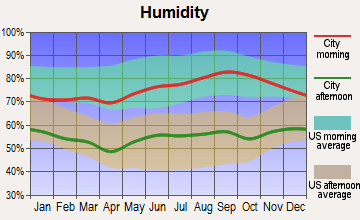
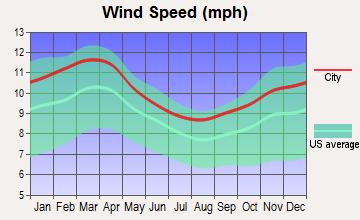
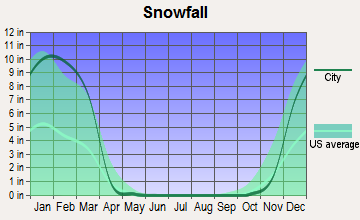
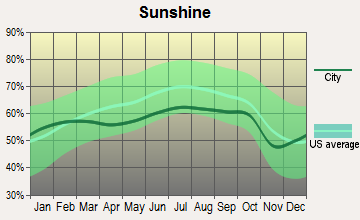
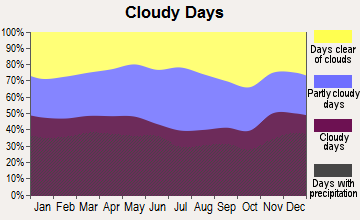
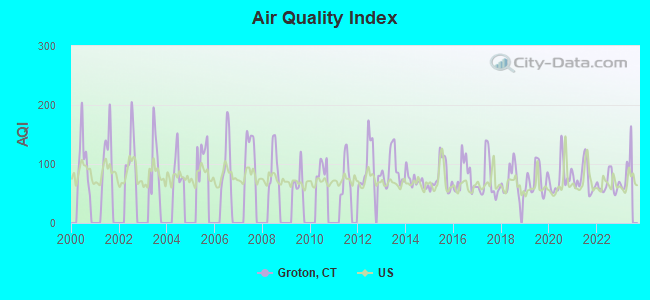
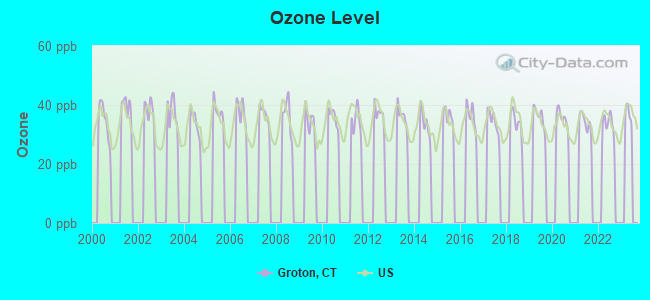
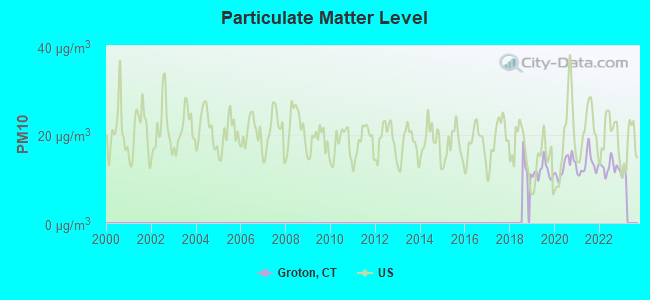
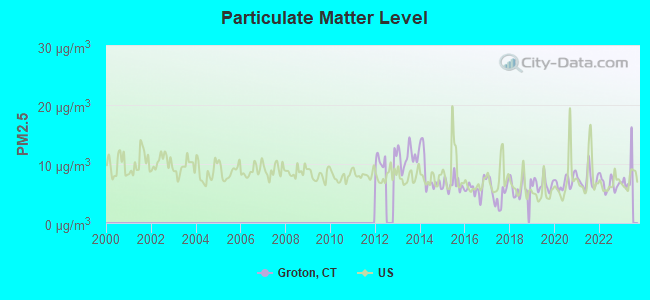
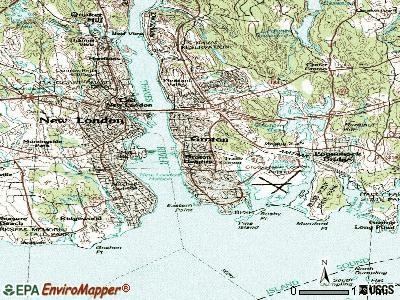
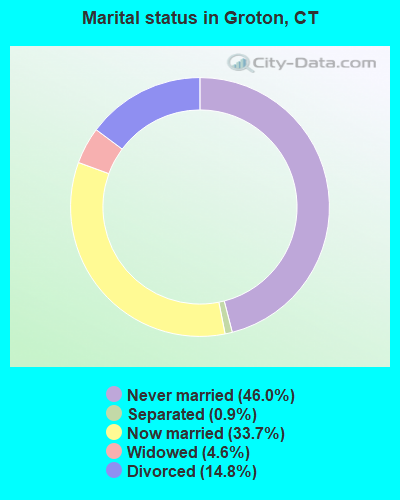
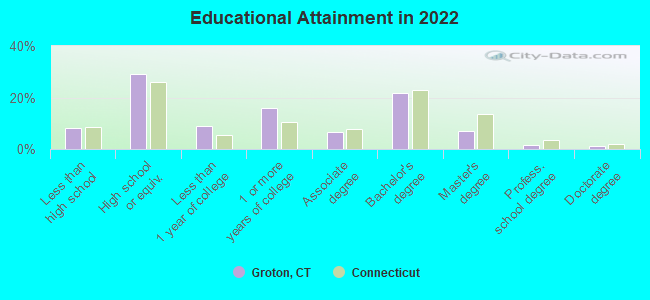
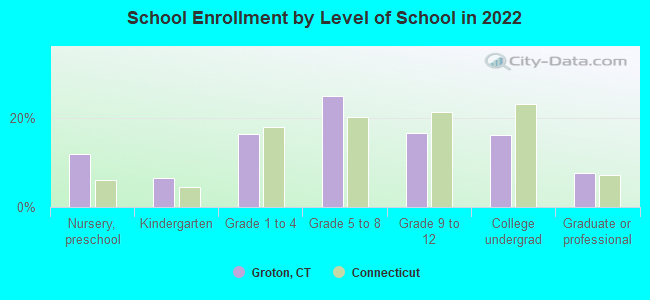
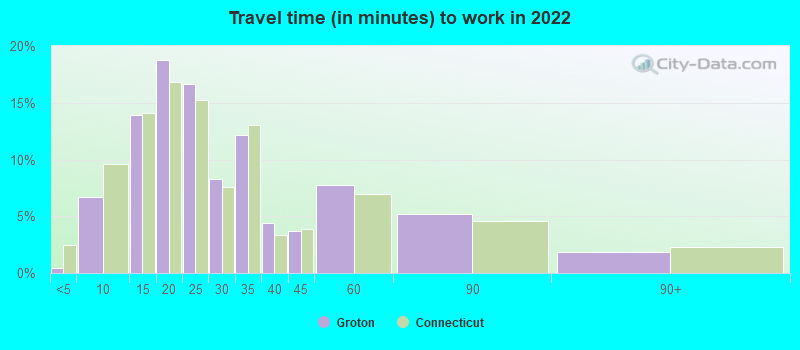
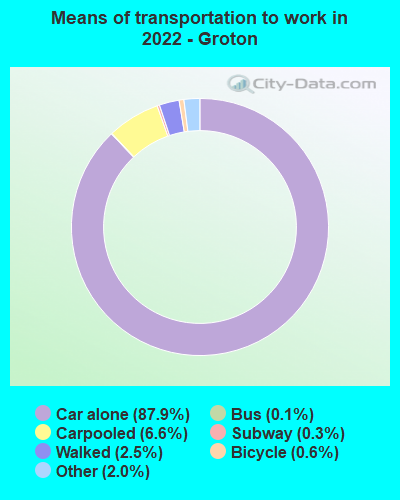
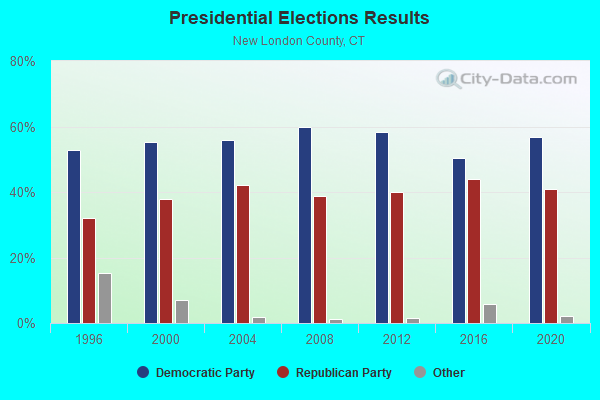
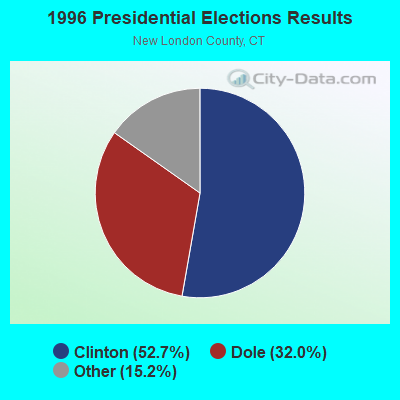
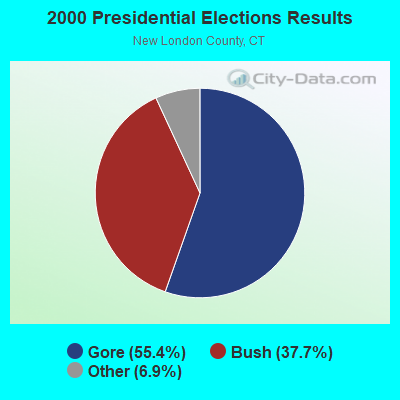

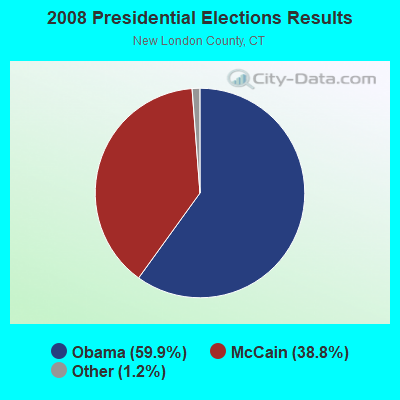

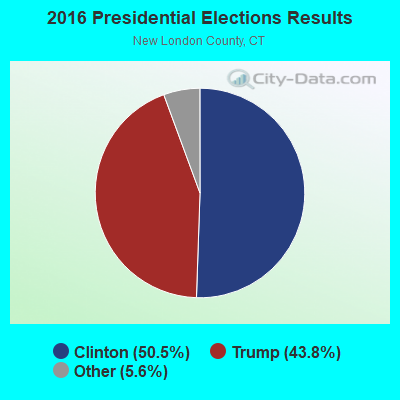
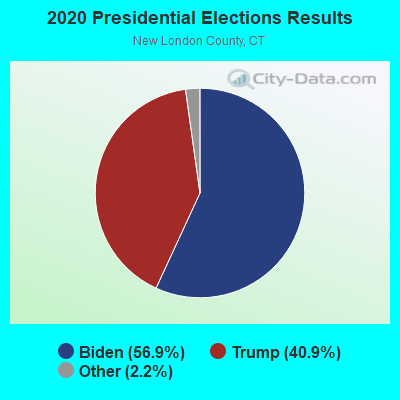
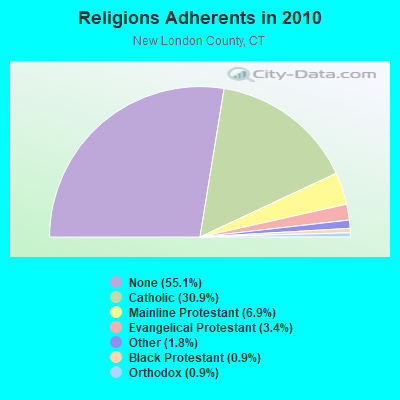
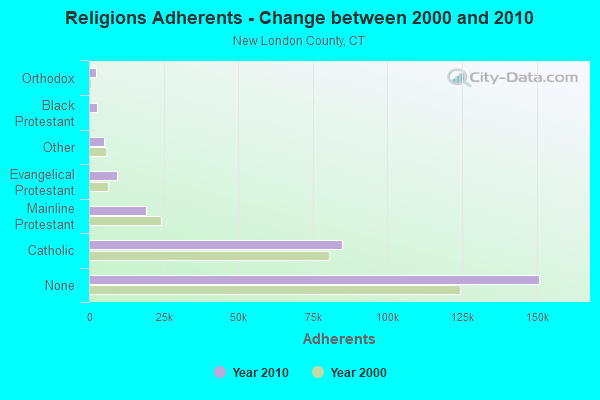
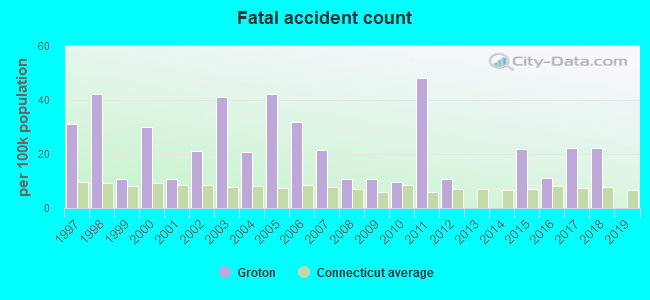
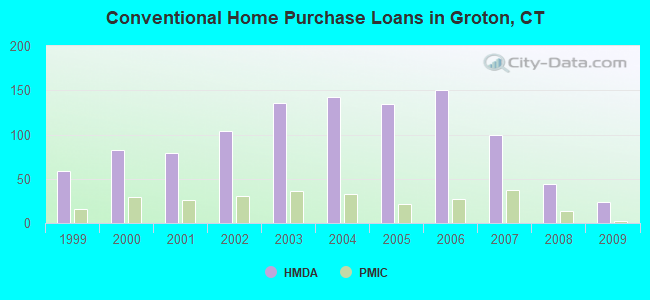
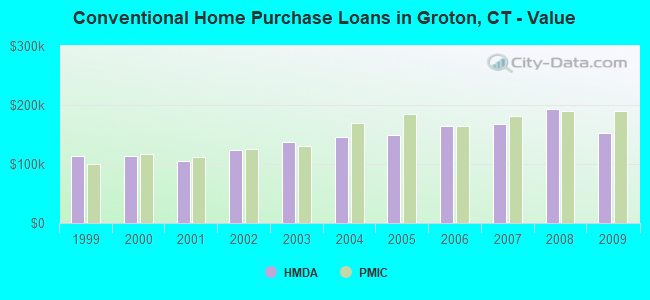
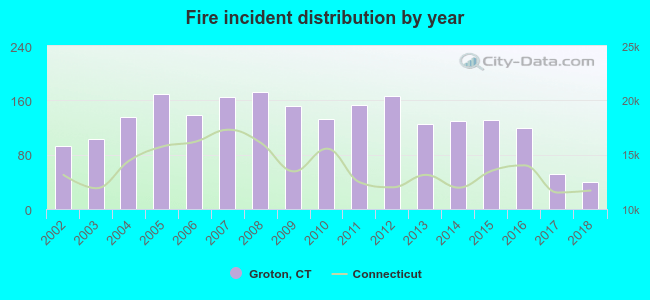 Based on the data from the years 2002 - 2018 the average number of fires per year is 128. The highest number of fires - 172 took place in 2008, and the least - 40 in 2018. The data has a dropping trend.
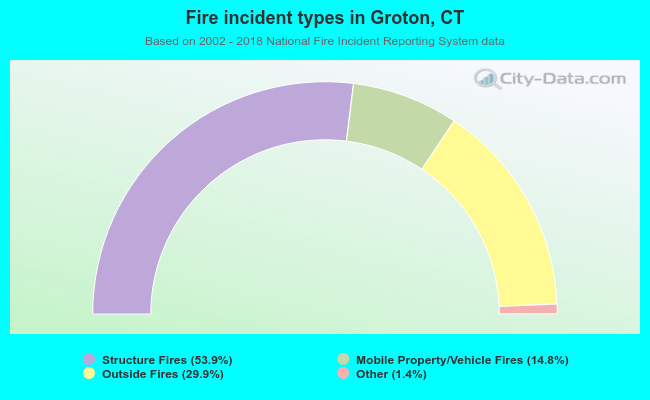 When looking into fire subcategories, the most incidents belonged to: Structure Fires (53.9%), and Outside Fires (29.9%).