Groton, CT (Connecticut) Houses and Residents
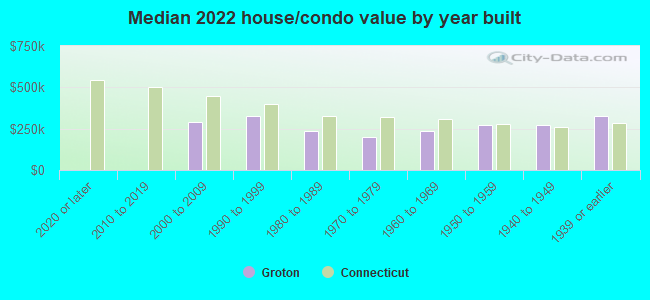
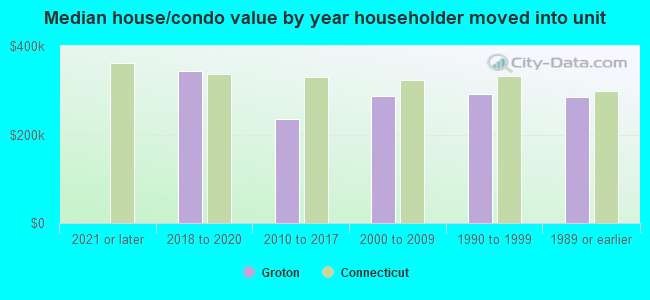
Estimated median house or condo value in 2022: $275,979 (it was $123,500 in 2000 )
Groton:
$275,979Connecticut:
$347,200
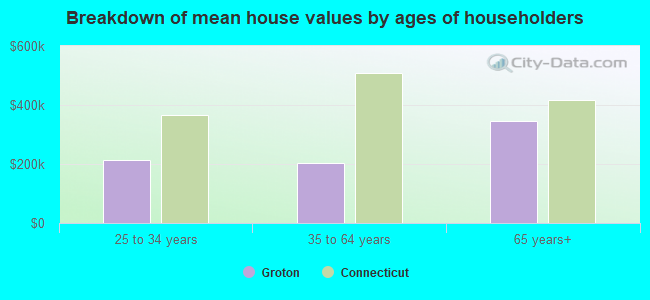
Lower value quartile - upper value quartile: $212,499 - $362,511Mean price in 2022: Detached houses: $323,298 Here:
$323,298State:
$503,946
Townhouses or other attached units: $243,291 Here:
$243,291State:
$304,959
In 2-unit structures: $221,758 Here:
$221,758State:
$304,133
In 5-or-more-unit structures: $172,488 Here:
$172,488State:
$249,308
Total population: 9,299 (All urban)
Houses: 5,229 (4,717 occupied: 2,158 owner occupied, 2,610 renter occupied )
% of renters here:
55%State:
34%
Housing density: 1,639 houses/condos per square mile
Median price asked for vacant for-sale houses and condos in 2022: $306,420.
Median contract rent in 2022: $988 (lower quartile is $603, upper quartile is $1,221)
Median rent asked for vacant for-rent units in 2022: $1,148
Median gross rent in Groton, CT in 2022: $1,088
Housing units in Groton with a mortgage: 1,143 (112 second mortgage, 15 home equity loan, 67 both second mortgage and home equity loan )Houses without a mortgage: 41
Median household income for houses/condos with a mortgage: $113,776
Median household income for apartments without a mortgage: $81,526
Median monthly housing costs: $1,109
Data:
Median house or condo value ($)
Median house or condo value ($ change since 2000)
Median house or condo value ($) - White
Median house or condo value ($) - Black or African American
Median house or condo value ($) - Asian
Median house or condo value ($) - Hispanic or Latino
Median house or condo value ($) - American Indian and Alaska Native
Median house or condo value ($) - Multirace
Median house or condo value ($) - Other Race
Median price asked for mobile homes ($)
Household density (households per square mile)
Mean house or condo value by units in structure - 1, detached ($)
Mean house or condo value by units in structure - 1, attached ($)
Mean house or condo value by units in structure - 2 ($)
Mean house or condo value by units in structure by units in structure - 3 or 4 ($)
Mean house or condo value by units in structure - 5 or more ($)
Mean house or condo value by units in structure - Boat, RV, van, etc. ($)
Mean house or condo value by units in structure - Mobile home ($)
Median contract rent ($)
Median contract rent - Lower quartile ($)
Median contract rent - Upper quartile ($)
Median gross rent ($)
Urban houses (%)
Rural houses (%)
Houses occupied (%)
Houses occupied (% change since 2000)
Houses owner occupied (%)
Houses owner occupied (% change since 2000)
Houses renter occupied (%)
Houses renter occupied (% change since 2000)
Vacant housing units - For rent (%)
Vacant housing units - For rent (% change since 2000)
Vacant housing units - For sale only (%)
Vacant housing units - For sale only (% change since 2000)
Vacant housing units - Rented or sold, not occupied (%)
Vacant housing units - Rented or sold, not occupied (% change since 2000)
Vacant housing units - For seasonal, recreational, or occasional use (%)
Vacant housing units - For seasonal, recreational, or occasional use (% change since 2000)
Vacant housing units - For migrant workers (%)
Vacant housing units - For migrant workers (% change since 2000)
Vacant housing units - Other vacant (%)
Vacant housing units - Other vacant (% change since 2000)
Median monthly housing costs ($)
Median household income for houses/condos with a mortgage ($)
Median household income for houses/condos without a mortgage ($)
Median household income ($)
Median household income ($) - White
Median household income ($) - Black or African American
Median household income ($) - Asian
Median household income ($) - Hispanic or Latino
Median household income ($) - American Indian and Alaska Native
Median household income ($) - Multirace
Median household income ($) - Other Race
Mortgage status - with mortgage (%)
Mortgage status - with second mortgage (%)
Mortgage status - with home equity loan (%)
Mortgage status - with both second mortgage and home equity loan (%)
Mortgage status - without a mortgage (%)
Median year house/condo built
Median year apartment built
Household type by relationship - Male householder living alone (%)
Household type by relationship - Male householder not living alone (%)
Household type by relationship - Female householder living alone (%)
Household type by relationship - Female householder not living alone (%)
Household type by relationship - Opposite-Sex spouse (%)
Household type by relationship - Same-Sex spouse (%)
Household type by relationship - Opposite-Sex unmarried partner (%)
Household type by relationship - Same-Sex unmarried partner (%)
Household type by relationship - In group quarters (%)
Size of family households - 2-person household (%)
Size of family households - 3-person household (%)
Size of family households - 4-person household (%)
Size of family households - 5-person household (%)
Size of family households - 6-person household (%)
Size of family households - 7-or-more-person household (%)
Size of nonfamily households - 1-person household (%)
Size of nonfamily households - 2-person household (%)
Size of nonfamily households - 3-person household (%)
Size of nonfamily households - 4-person household (%)
Size of nonfamily households - 5-person household (%)
Size of nonfamily households - 6-person household (%)
Size of nonfamily households - 7-or-moreperson household (%)
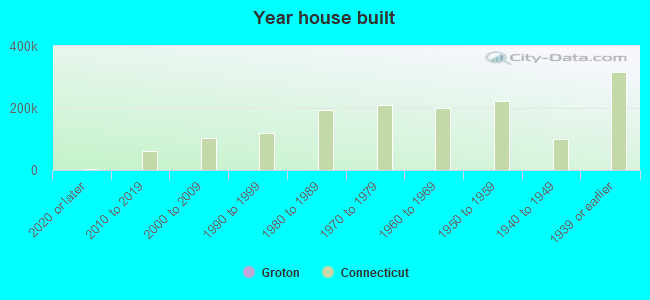
Year house built - Built 2010 or later (%)
Year house built - Built 2000 to 2009 (%)
Year house built - Built 1990 to 1999 (%)
Year house built - Built 1980 to 1989 (%)
Year house built - Built 1970 to 1979 (%)
Year house built - Built 1960 to 1969 (%)
Year house built - Built 1950 to 1959 (%)
Year house built - Built 1940 to 1949 (%)
Year house built - Built 1939 or earlier (%)
Median number of rooms in houses and condos
Median number of rooms in apartments
Median number of bedrooms in owner occupied houses
Mean number of bedrooms in owner occupied houses
Median number of bedrooms in renter occupied houses
Mean number of bedrooms in renter occupied houses
Median number of vehichles in owner occupied houses
Mean number of vehichles in owner occupied houses
Median number of vehichles in renter occupied houses
Mean number of vehichles in renter occupied houses
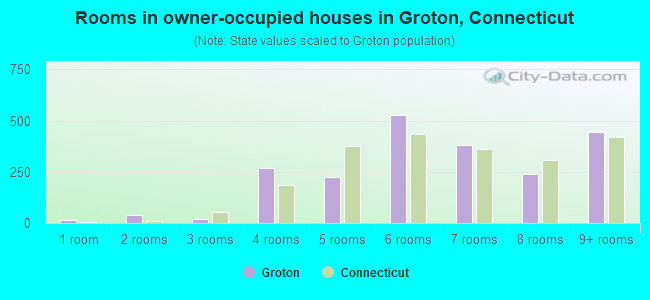
Rooms in owner-occupied houses - 1 room (%)
Rooms in owner-occupied houses - 2 rooms (%)
Rooms in owner-occupied houses - 3 rooms (%)
Rooms in owner-occupied houses - 4 rooms (%)
Rooms in owner-occupied houses - 5 rooms (%)
Rooms in owner-occupied houses - 6 rooms (%)
Rooms in owner-occupied houses - 7 rooms (%)
Rooms in owner-occupied houses - 8 rooms (%)
Rooms in owner-occupied houses - 9+ rooms (%)
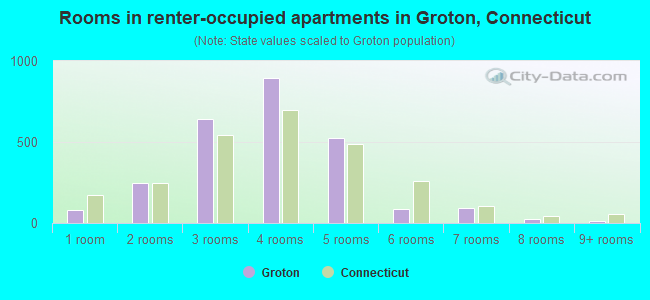
Rooms in renter-occupied houses - 1 room (%)
Rooms in renter-occupied houses - 2 rooms (%)
Rooms in renter-occupied houses - 3 rooms (%)
Rooms in renter-occupied houses - 4 rooms (%)
Rooms in renter-occupied houses - 5 rooms (%)
Rooms in renter-occupied houses - 6 rooms (%)
Rooms in renter-occupied houses - 7 rooms (%)
Rooms in renter-occupied houses - 8 rooms (%)
Rooms in renter-occupied houses - 9+ rooms (%)
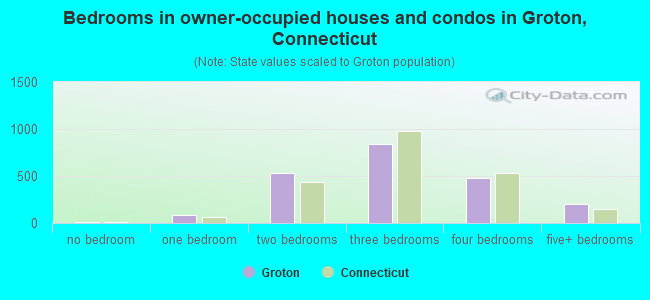
Bedrooms in owner-occupied houses - no bedrooms (%)
Bedrooms in owner-occupied houses - 1 bedroom (%)
Bedrooms in owner-occupied houses - 2 bedrooms (%)
Bedrooms in owner-occupied houses - 3 bedrooms (%)
Bedrooms in owner-occupied houses - 4 bedrooms (%)
Bedrooms in owner-occupied houses - 5+ bedrooms (%)
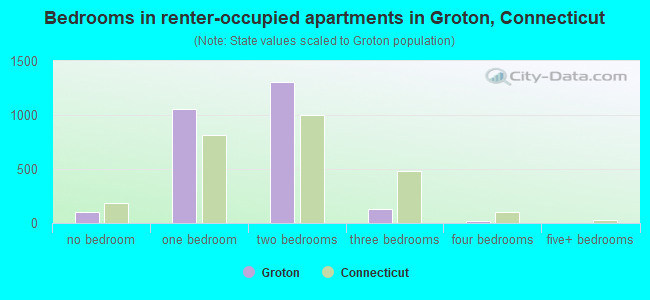
Bedrooms in renter-occupied houses - no bedrooms (%)
Bedrooms in renter-occupied houses - 1 bedroom (%)
Bedrooms in renter-occupied houses - 2 bedrooms (%)
Bedrooms in renter-occupied houses - 3 bedrooms (%)
Bedrooms in renter-occupied houses - 4 bedrooms (%)
Bedrooms in renter-occupied houses - 5+ bedrooms (%)
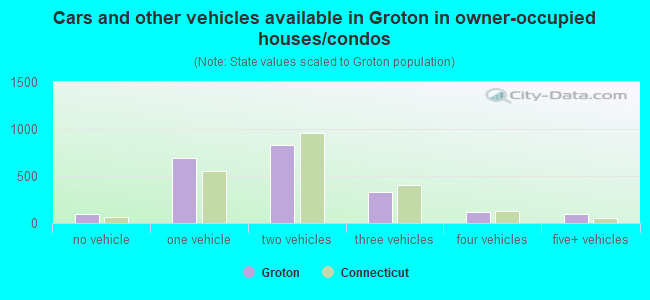
Vehicles available in owner-occupied houses - no vehicle available (%)
Vehicles available in owner-occupied houses - 1 vehicle available(%)
Vehicles available in owner-occupied houses - 2 Vehicles available (%)
Vehicles available in owner-occupied houses - 3 Vehicles available (%)
Vehicles available in owner-occupied houses - 4 Vehicles available (%)
Vehicles available in owner-occupied houses - 5+ Vehicles available (%)
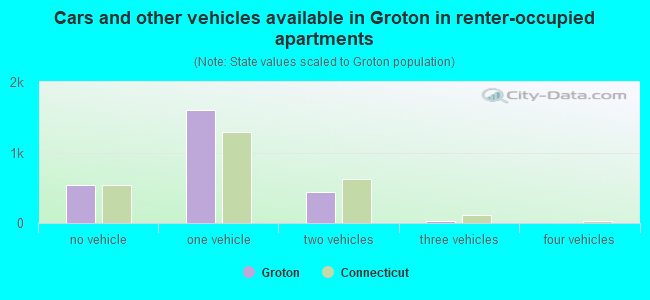
Vehicles available in renter-occupied houses - no vehicle available (%)
Vehicles available in renter-occupied houses - 1 vehicle available (%)
Vehicles available in renter-occupied houses - 2 Vehicles available (%)
Vehicles available in renter-occupied houses - 3 Vehicles available (%)
Vehicles available in renter-occupied houses - 4 Vehicles available (%)
Vehicles available in renter-occupied houses - 5+ Vehicles available (%)
Housing units in structures - 1, detached (%)
Housing units in structures - 1, attached (%)
Housing units in structures - 2 (%)
Housing units in structures - 3 or 4 (%)
Housing units in structures - 5 to 9 (%)
Housing units in structures - 10 to 19 (%)
Housing units in structures - 20 to 49 (%)
Housing units in structures - 50 or more (%)
Housing units in structures - Mobile home (%)
Housing units in structures - Boat, RV, van, etc. (%)
Housing units in structures - Owners - 1, detached (%)
Housing units in structures - Owners - 1, attached (%)
Housing units in structures - Owners - 2 (%)
Housing units in structures - Owners - 3 or 4 (%)
Housing units in structures - Owners - 5 to 9 (%)
Housing units in structures - Owners - 10 to 19 (%)
Housing units in structures - Owners - 20 to 49 (%)
Housing units in structures - Owners - 50 or more (%)
Housing units in structures - Owners - Mobile home (%)
Housing units in structures - Owners - Boat, RV, van, etc. (%)
Housing units in structures - Renters - 1, detached (%)
Housing units in structures - Renters - 1, attached (%)
Housing units in structures - Renters - 2 (%)
Housing units in structures - Renters - 3 or 4 (%)
Housing units in structures - Renters - 5 to 9 (%)
Housing units in structures - Renters - 10 to 19 (%)
Housing units in structures - Renters - 20 to 49 (%)
Housing units in structures - Renters - 50 or more (%)
Housing units in structures - Renters - Mobile home (%)
Housing units in structures - Renters - Boat, RV, van, etc. (%)
House/condo owner moved in on average (years ago)
Renter moved in on average (years ago)
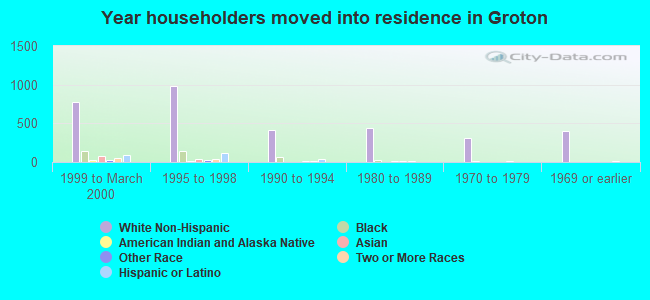
Year householder moved into unit - Moved in 1999 to March 2000 (%)
Year householder moved into unit - Moved in 1999 to March 2000 (%) - White
Year householder moved into unit - Moved in 1999 to March 2000 (%) - Black or African American
Year householder moved into unit - Moved in 1999 to March 2000 (%) - Asian
Year householder moved into unit - Moved in 1999 to March 2000 (%) - Hispanic or Latino
Year householder moved into unit - Moved in 1999 to March 2000 (%) - American Indian and Alaska Native
Year householder moved into unit - Moved in 1999 to March 2000 (%) - Multirace
Year householder moved into unit - Moved in 1999 to March 2000 (%) - Other Race
Year householder moved into unit - Moved in 1995 to 1998 (%)
Year householder moved into unit - Moved in 1995 to 1998 (%) - White
Year householder moved into unit - Moved in 1995 to 1998 (%) - Black or African American
Year householder moved into unit - Moved in 1995 to 1998 (%) - Asian
Year householder moved into unit - Moved in 1995 to 1998 (%) - Hispanic or Latino
Year householder moved into unit - Moved in 1995 to 1998 (%) - American Indian and Alaska Native
Year householder moved into unit - Moved in 1995 to 1998 (%) - Multirace
Year householder moved into unit - Moved in 1995 to 1998 (%) - Other Race
Year householder moved into unit - Moved in 1990 to 1994 (%)
Year householder moved into unit - Moved in 1990 to 1994 (%) - White
Year householder moved into unit - Moved in 1990 to 1994 (%) - Black or African American
Year householder moved into unit - Moved in 1990 to 1994 (%) - Asian
Year householder moved into unit - Moved in 1990 to 1994 (%) - Hispanic or Latino
Year householder moved into unit - Moved in 1990 to 1994 (%) - American Indian and Alaska Native
Year householder moved into unit - Moved in 1990 to 1994 (%) - Multirace
Year householder moved into unit - Moved in 1990 to 1994 (%) - Other Race
Year householder moved into unit - Moved in 1980 to 1989 (%)
Year householder moved into unit - Moved in 1980 to 1989 (%) - White
Year householder moved into unit - Moved in 1980 to 1989 (%) - Black or African American
Year householder moved into unit - Moved in 1980 to 1989 (%) - Asian
Year householder moved into unit - Moved in 1980 to 1989 (%) - Hispanic or Latino
Year householder moved into unit - Moved in 1980 to 1989 (%) - American Indian and Alaska Native
Year householder moved into unit - Moved in 1980 to 1989 (%) - Multirace
Year householder moved into unit - Moved in 1980 to 1989 (%) - Other Race
Year householder moved into unit - Moved in 1970 to 1979 (%)
Year householder moved into unit - Moved in 1970 to 1979 (%) - White
Year householder moved into unit - Moved in 1970 to 1979 (%) - Black or African American
Year householder moved into unit - Moved in 1970 to 1979 (%) - Asian
Year householder moved into unit - Moved in 1970 to 1979 (%) - Hispanic or Latino
Year householder moved into unit - Moved in 1970 to 1979 (%) - American Indian and Alaska Native
Year householder moved into unit - Moved in 1970 to 1979 (%) - Multirace
Year householder moved into unit - Moved in 1970 to 1979 (%) - Other Race
Year householder moved into unit - Moved in 1969 or earlier (%)
Year householder moved into unit - Moved in 1969 or earlier (%) - White
Year householder moved into unit - Moved in 1969 or earlier (%) - Black or African American
Year householder moved into unit - Moved in 1969 or earlier (%) - Asian
Year householder moved into unit - Moved in 1969 or earlier (%) - Hispanic or Latino
Year householder moved into unit - Moved in 1969 or earlier (%) - American Indian and Alaska Native
Year householder moved into unit - Moved in 1969 or earlier (%) - Multirace
Year householder moved into unit - Moved in 1969 or earlier (%) - Other Race
Housing units lacking complete plumbing facilities (%)
Housing units lacking complete kitchen facilities (%)
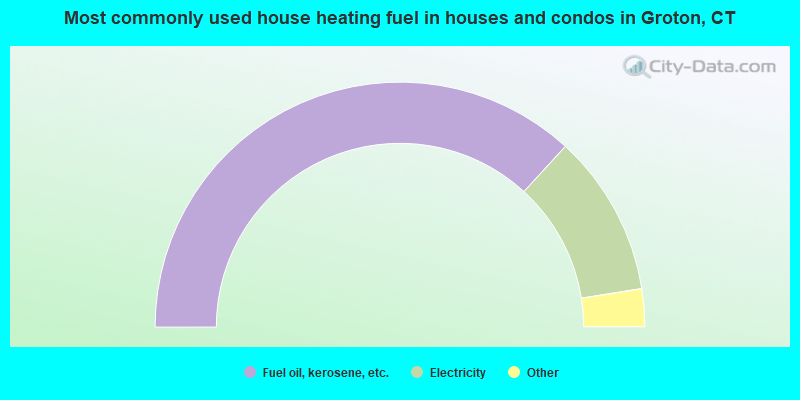
House heating fuel used in houses and condos - Utility gas (%)
House heating fuel used in houses and condos - Bottled, tank, or LP gas (%)
House heating fuel used in houses and condos - Electricity (%)
House heating fuel used in houses and condos - Fuel oil, kerosene, etc. (%)
House heating fuel used in houses and condos - Coal or coke (%)
House heating fuel used in houses and condos - Wood (%)
House heating fuel used in houses and condos - Solar energy (%)
House heating fuel used in houses and condos - Other fuel (%)
House heating fuel used in houses and condos - No fuel used (%)
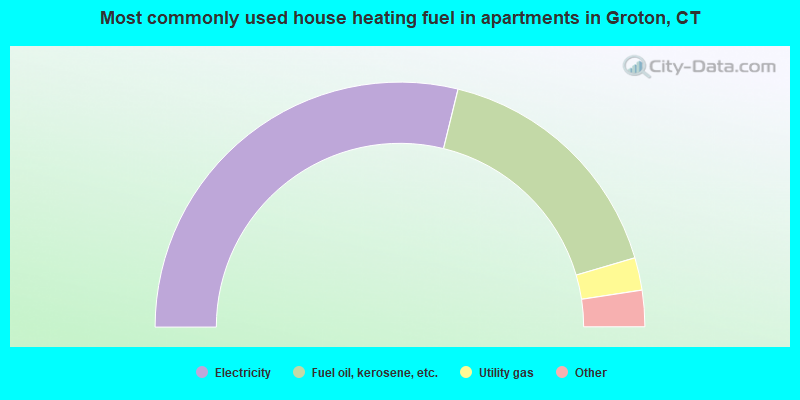
House heating fuel used in apartments - Utility gas (%)
House heating fuel used in apartments - Bottled, tank, or LP gas (%)
House heating fuel used in apartments - Electricity (%)
House heating fuel used in apartments - Fuel oil, kerosene, etc. (%)
House heating fuel used in apartments - Coal or coke (%)
House heating fuel used in apartments - Wood (%)
House heating fuel used in apartments - Solar energy (%)
House heating fuel used in apartments - Other fuel (%)
House heating fuel used in apartments - No fuel used (%)
Latest news about housing in Groton, CT collected exclusively by city-data.com from local newspapers, TV, and radio stations
Median year house/condo built: 1962Median year apartment built: 1974Household type by relationship:
Households: 9,402
Male householders: 2,699 (1,371 living alone ), Female householders: 2,010 (709 living alone )1,216 spouses (1,206 opposite-sex spouses ), 287 unmarried partners , (282 opposite-sex unmarried partners ), 2,310 children (2,200 natural , 0 adopted , 110 stepchildren ), 146 grandchildren , 131 brothers or sisters , 127 parents , 0 foster children , 132 other relatives , 330 non-relatives In group quarters: 10
Size of family households: 1,271 2-persons , 574 3-persons , 314 4-persons , 178 5-persons , 35 6-persons , 8 7-or-more-persons .
Size of nonfamily households: 2,197 1-person , 216 2-persons , 12 3-persons , 3 4-persons .
690 married couples with children. single-parent households (130 men , 682 women ).
87.4% of residents of Groton speak English at home. of residents speak Spanish at home (59% speak English very well , 10% speak English well , 6% speak English not well , 25% don't speak English at all ).of residents speak other Indo-European language at home (55% speak English very well , 27% speak English well , 17% speak English not well ).of residents speak Asian or Pacific Island language at home (66% speak English very well , 25% speak English well , 9% speak English not well ).
Foreign born population: 970 (10.3%)of them are naturalized citizens )
Median number of rooms in houses and condos:
Median number of rooms in apartments
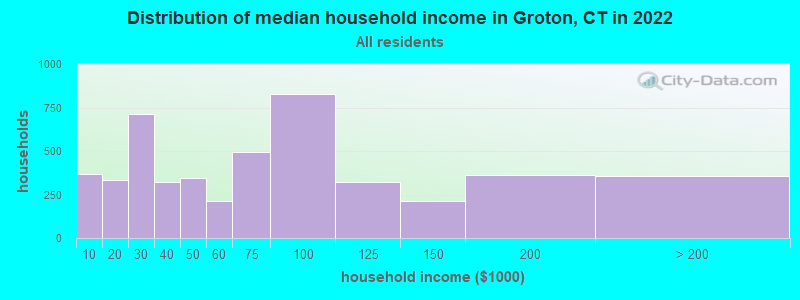
Groton, CT household income distribution 366 Less than $10,000331 $10,000 to $19,999712 $20,000 to $29,999321 $30,000 to $39,999342 $40,000 to $49,999213 $50,000 to $59,999492 $60,000 to $74,999830 $75,000 to $99,999324 $100,000 to $124,999211 $125,000 to $149,999364 $150,000 to $199,999359 $200,000 or more
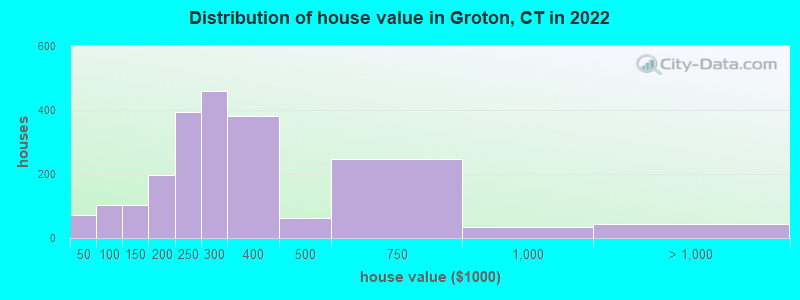
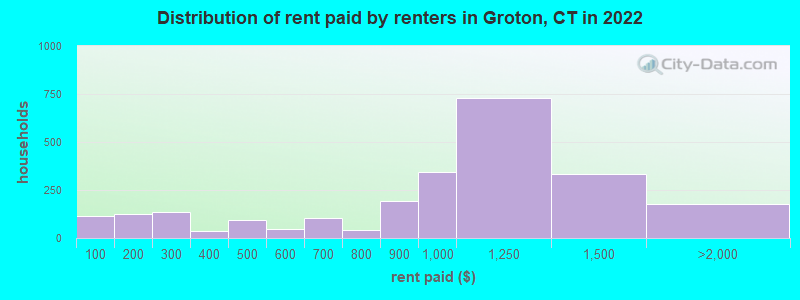
Home value of owner - occupied houses in 2022 in Groton, CT 62 Less than $10,0009 $10,000 to $14,99914 $70,000 to $79,99987 $80,000 to $89,99963 $100,000 to $124,99939 $125,000 to $149,999109 $150,000 to $174,99988 $175,000 to $199,999392 $200,000 to $249,999457 $250,000 to $299,999381 $300,000 to $399,99964 $400,000 to $499,999246 $500,000 to $749,99933 $750,000 to $999,99913 $1,000,000 to $1,499,99911 $1,500,000 to $1,999,99918 $2,000,000 or moreRent paid by renters in 2022 in Groton, CT 117 Less than $100127 $100 to $14953 $200 to $24979 $250 to $29934 $300 to $34935 $400 to $44958 $450 to $49920 $500 to $54926 $550 to $59975 $600 to $64928 $650 to $69917 $700 to $74922 $750 to $799194 $800 to $899342 $900 to $999729 $1,000 to $1,249333 $1,250 to $1,499167 $1,500 to $1,9996 $2,000 to $2,4994 $3,000 to $3,499
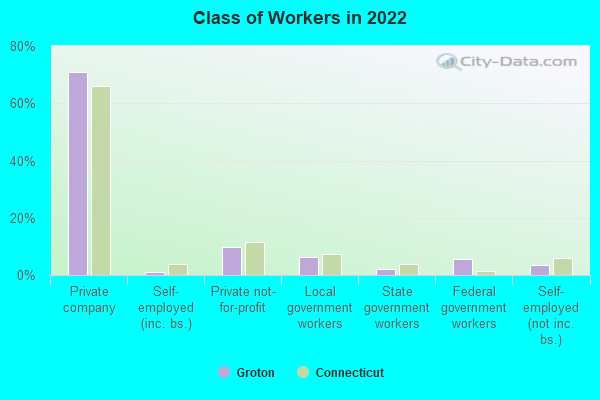
Percentage of workers working in this county: 92.4%Number of people working at home: 285 (5.4% of all workers )
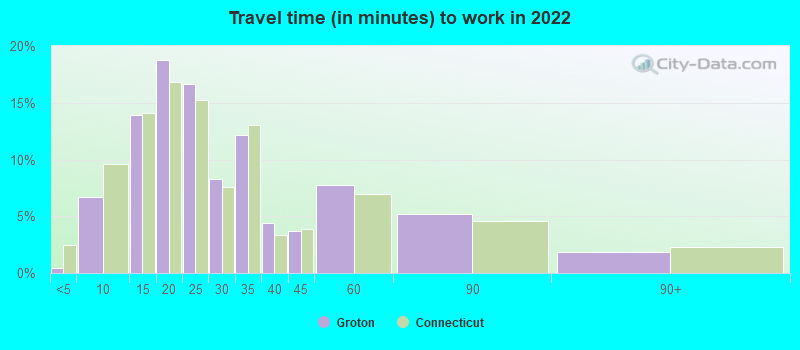
Travel time to work (commute)
Less than 5 minutes: 715 to 9 minutes: 90910 to 14 minutes: 1,20215 to 19 minutes: 1,03520 to 24 minutes: 48425 to 29 minutes: 18030 to 34 minutes: 52135 to 39 minutes: 1040 to 44 minutes: 12045 to 59 minutes: 20560 to 89 minutes: 11790 or more minutes: 7
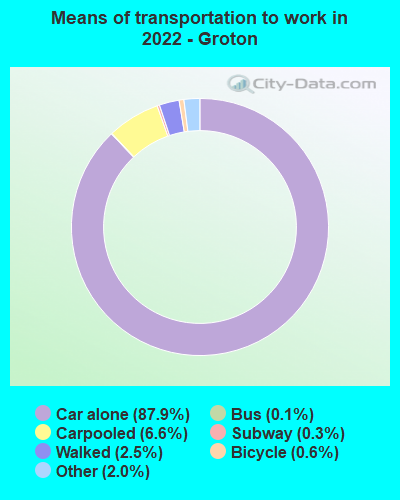
Means of transportation to work:
Drove a car alone: 12,842 (82.4%)Carpooled: 1,020 (6.5%)Bus : 16 (0.1%)Long-distance train or commuter rail : 34 (0.2%)Taxi: 349 (2.2%)Bicycle: 74 (0.5%)Walked: 391 (2.5%)Worked at home: 285 (1.8%)
Unemployment by race in 2022
Unemployment rate for White non-Hispanic residents 7.6% Males1.4% FemalesUnemployment rate for Black residents 4.8% MalesUnemployment rate for Asian residents 7.9% MalesUnemployment rate for two or more race residents 2.1% Males14.2% FemalesUnemployment rate for Hispanic or Latino residents 2.2% Males3.3% Females
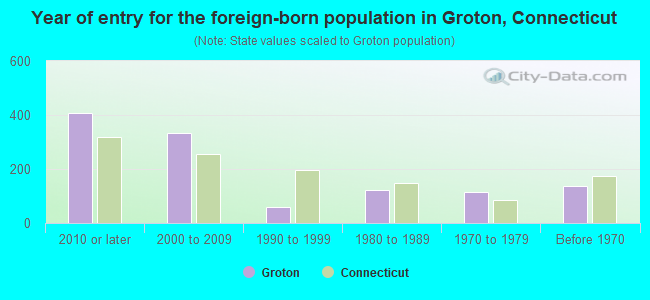
Year of entry for the foreign-born population in Groton, Connecticut
409 2010 or later 334 2000 to 2009 61 1990 to 1999 123 1980 to 1989 115 1970 to 1979 136 Before 1970
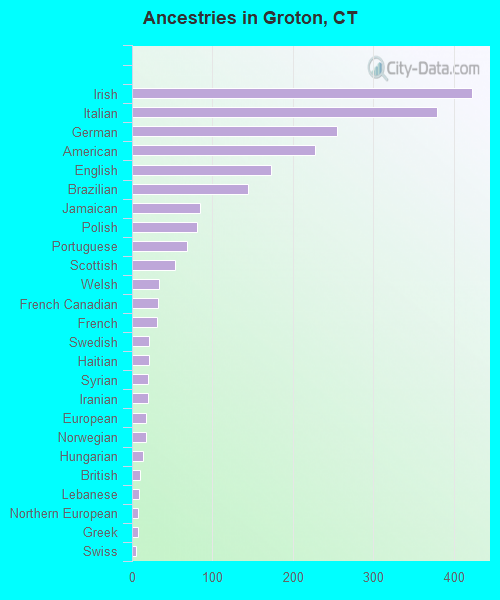
First ancestries reported:
Irish: 423 (11.3%)
Italian: 379 (10.1%)
German: 255 (6.8%)
American: 228 (6.1%)
English: 173 (4.6%)
Brazilian: 144 (3.8%)
Jamaican: 85 (2.3%)
Polish: 81 (2.2%)
Portuguese: 68 (1.8%)
Scottish: 54 (1.4%)
Welsh: 34 (0.9%)
French Canadian: 32 (0.9%)
French: 31 (0.8%)
Swedish: 21 (0.6%)
Haitian: 21 (0.6%)
Syrian: 20 (0.5%)
Iranian: 20 (0.5%)
European: 18 (0.5%)
Norwegian: 17 (0.5%)
Hungarian: 14 (0.4%)
British: 10 (0.3%)
Lebanese: 9 (0.2%)
Northern European: 8 (0.2%)
Greek: 7 (0.2%)
Swiss: 5 (0.1%)
African: 4 (0.1%) Most common places of birth for foreign-born residents (%): Dominican Republic Groton:
18.5% (179)Connecticut:
5.0% (27,361)
Philippines Groton:
16.8% (163)Connecticut:
1.9% (10,545)
Brazil Groton:
13.4% (130)Connecticut:
4.7% (25,461)
Jamaica Groton:
9.0% (87)Connecticut:
7.5% (40,568)
India Groton:
6.2% (60)Connecticut:
7.3% (39,879)
Italy Groton:
4.0% (39)Connecticut:
2.8% (15,141)
Portugal Groton:
3.8% (37)Connecticut:
1.7% (9,214)
Chile Groton:
3.7% (36)Connecticut:
0.4% (2,399)
Iran Groton:
2.8% (27)Connecticut:
0.3% (1,784)
Ireland Groton:
2.4% (23)Connecticut:
0.6% (3,115)
Haiti Groton:
2.1% (20)Connecticut:
2.4% (12,881)
Panama Groton:
2.0% (19)Connecticut:
0.1% (668)
Place of birth for U.S.-born residents:
This state: 4,597Other state: 3,689Northeast: 1,981Midwest: 231South: 837West: 631 80.5% of Groton residents lived in the same house 1 years ago.
Out of people who lived in different houses, 32.3% lived in this county.
Out of people who lived in different counties, 28.5% lived in Connecticut.
Groton:
80.5%State average:
88.4%
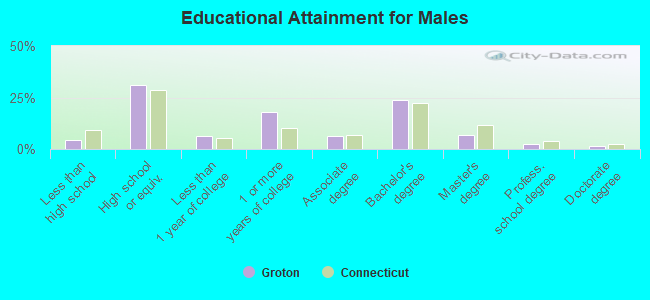
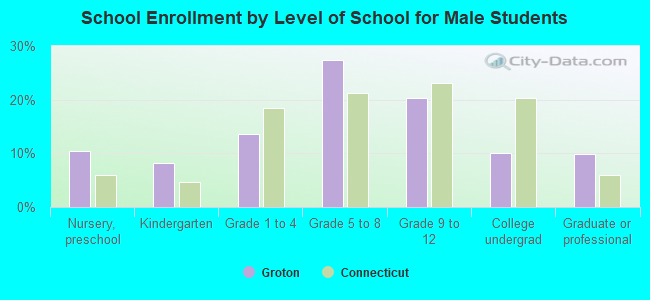
Education attainment for males 25 years and older:
No schooling: 25Nursery to 4th grade: 05th and 6th grade: 247th and 8th grade: 69th grade: 010th grade: 911th grade: 1012th grade, no diploma: 74High school graduate (or equivalency): 1,092Less than 1 year of college: 222Some college more than 1 year, no degree: 628Associate degree: 220Bachelor's degree: 848Master's degree: 244Professional school degree: 79Doctorate degree: 55
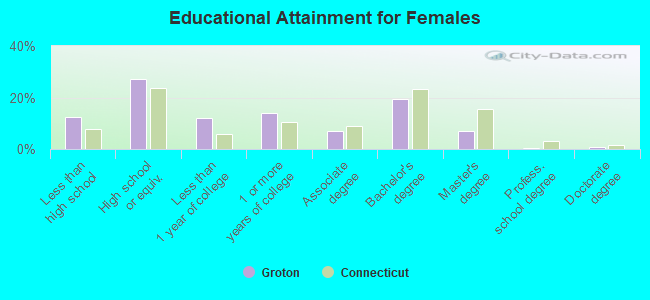
Education attainment for females 25 years and older:
No schooling: 52Nursery to 4th grade: 215th and 6th grade: 07th and 8th grade: 749th grade: 13210th grade: 7111th grade: 1412th grade, no diploma: 34High school graduate (or equivalency): 872Less than 1 year of college: 383Some college more than 1 year, no degree: 455Associate degree: 219Bachelor's degree: 627Master's degree: 227Professional school degree: 14Doctorate degree: 20
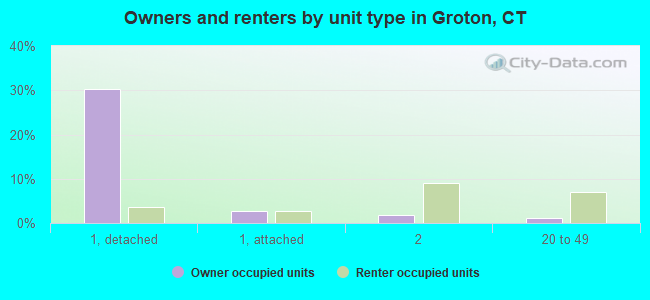
Housing units in structures:
One, detached: 2,054One, attached: 159Two: 4573 or 4: 9555 to 9: 66410 to 19: 26420 to 49: 44350 or more: 212Mobile homes: 16Housing units lacking complete plumbing facilities in 2022: 0.8%Housing units lacking complete kitchen facilities in 2022: 0.2%House/condo owner moved in on average 12 years ago
Renter moved in on average 3 years ago
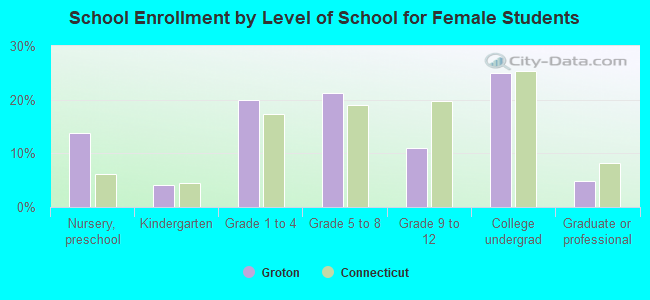
Private vs. public school enrollment:
Students in private schools in grades 1 to 8 (elementary and middle school): 45 Here:
6.2%Connecticut:
9.5%
Students in private schools in grades 9 to 12 (high school): 2 Here:
0.7%Connecticut:
12.9%
Students in private undergraduate colleges: 54 Here:
19.4%Connecticut:
35.5%