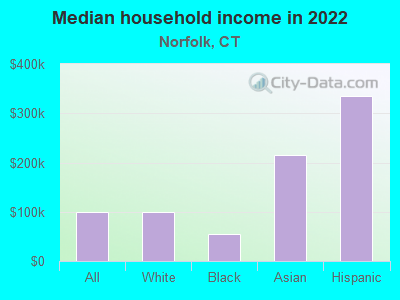
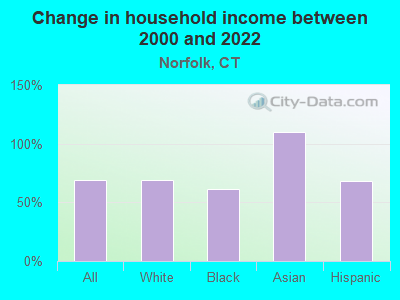
The median household income in Norfolk, CT in 2022 was $99,677, which was 11.3% greater than the median annual income of $88,429 across the entire state of Connecticut. Compared to the median income of $58,906 in 2000 this represents an increase of 40.9%. The per capita income in 2022 was $62,232, which means an increase of 45.3% compared to 2000 when it was $34,020.
Income statistics for all residents
Median household income in Norfolk, CT in 2022:
Norfolk:
$99,677
State:
$88,429
Change in median household income between 2000 and 2022:
Norfolk, Connecticut:
+69.2%
Connecticut:
+64.0%
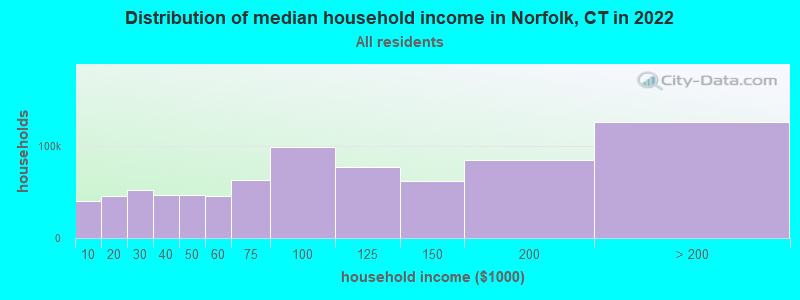
Number of households with income < $10k:
Norfolk:
5.2% (40,600)
State:
5.1% (72,746)
Number of households with income $10k - 20k:
Norfolk:
5.8% (45,782)
Connecticut:
5.7% (81,643)
Number of households with income $20k - 30k:
Norfolk:
6.6% (51,822)
State:
6.5% (92,844)
Number of households with income $30k - 40k:
Norfolk:
5.9% (46,507)
State:
5.9% (83,934)
Number of households with income $40k - 50k:
Norfolk:
5.9% (46,209)
State:
5.8% (83,025)
Number of households with income $50k - 60k:
Norfolk:
5.8% (45,310)
State:
5.7% (81,788)
Number of households with income $60k - 75k:
Norfolk:
8.1% (63,486)
State:
8.1% (115,651)
Number of households with income $75k - 100k:
Norfolk:
12.6% (99,150)
Connecticut:
12.6% (180,173)
Number of households with income $100k - 125k:
Norfolk:
9.8% (77,187)
Connecticut:
9.9% (141,231)
Number of households with income $125k - 150k:
Norfolk:
7.8% (61,642)
State:
7.9% (112,826)
Number of households with income $150k - 200k:
Norfolk:
10.7% (84,321)
Connecticut:
10.8% (154,641)
Number of households with income > $200k:
Norfolk:
16.0% (125,970)
Connecticut:
16.3% (233,133)
Aggregate household income in Norfolk in 2022: $2,411,397,956
Median family income in Norfolk in 2022:
Norfolk:
$120,554
State:
$115,183
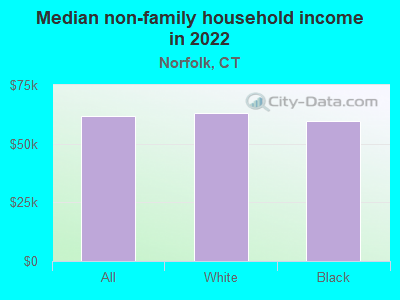
Median non-family income in Norfolk in 2022:
Norfolk:
$61,944
State:
$50,964
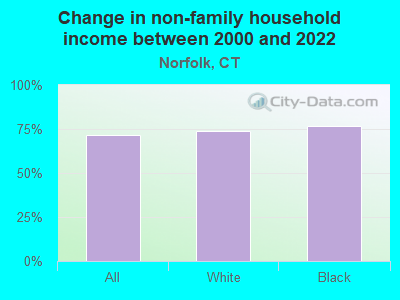
Change in median non-family income between 2000 and 2022:
Norfolk, Connecticut:
+71.5%
State:
+65.1%
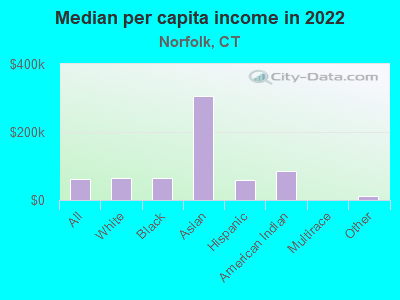
Median per capita income in Norfolk in 2022:
Norfolk:
$62,233
State:
$51,581
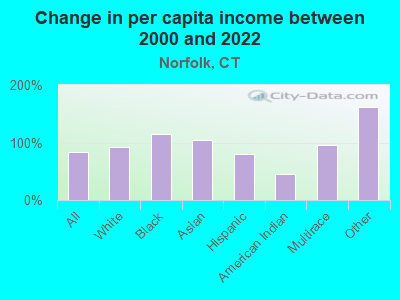
Change in median per capita income between 2000 and 2022:
Norfolk, Connecticut:
+82.9%
Connecticut:
+79.3%
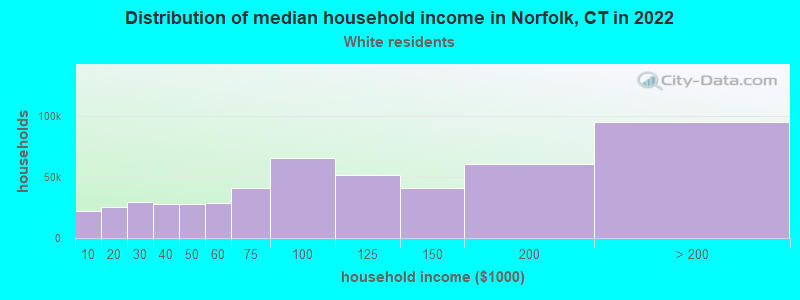
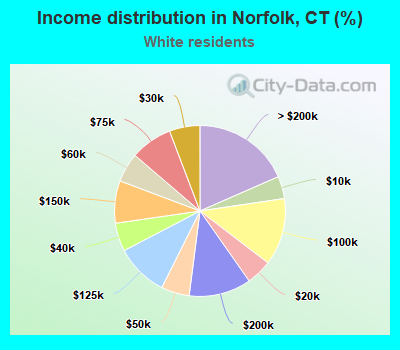
Income statistics for White residents
Median household income in Norfolk, CT in 2022:
Norfolk:
$100,070
Connecticut:
$96,890
Change in median household income between 2000 and 2022:
Norfolk, Connecticut:
+69.4%
State:
+68.5%
Number of households with income < $10k:
Norfolk:
4.2% (21,887)
State:
4.2% (42,265)
Number of households with income $10k - 20k:
Norfolk:
4.9% (25,164)
Connecticut:
4.8% (48,323)
Number of households with income $20k - 30k:
Norfolk:
5.8% (29,927)
Connecticut:
5.7% (57,716)
Number of households with income $30k - 40k:
Norfolk:
5.4% (27,702)
State:
5.3% (53,827)
Number of households with income $40k - 50k:
Norfolk:
5.3% (27,587)
State:
5.3% (53,301)
Number of households with income $50k - 60k:
Norfolk:
5.6% (28,710)
State:
5.5% (55,690)
Number of households with income $60k - 75k:
Norfolk:
7.9% (41,028)
Connecticut:
8.0% (80,329)
Number of households with income $75k - 100k:
Norfolk:
12.7% (65,742)
State:
12.7% (128,070)
Number of households with income $100k - 125k:
Norfolk:
10.0% (51,623)
State:
10.0% (101,210)
Number of households with income $125k - 150k:
Norfolk:
8.0% (41,444)
State:
8.0% (81,250)
Number of households with income $150k - 200k:
Norfolk:
11.8% (60,940)
Connecticut:
11.8% (119,527)
Number of households with income > $200k:
Norfolk:
18.4% (95,399)
Connecticut:
18.6% (187,875)
Aggregate household income in Norfolk in 2022: $1,823,852,850
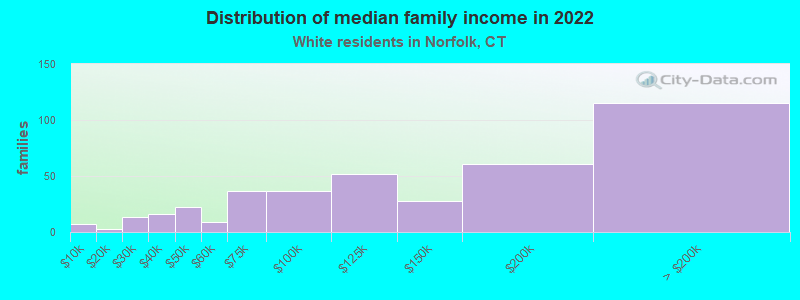
Median family income in Norfolk in 2022:
Norfolk:
$123,717
State:
$128,955
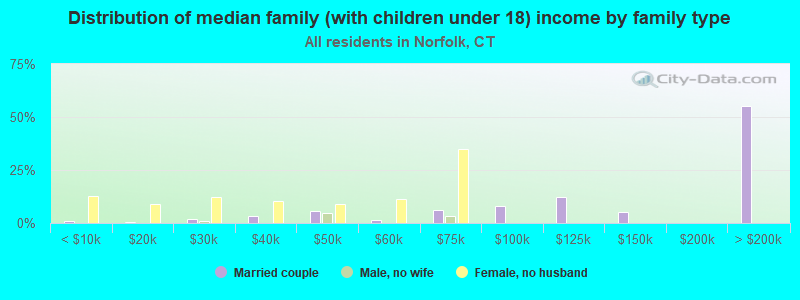
Number of families with income < $10k:
Norfolk:
1.7% (7)
Connecticut:
1.9% (11,537)
Number of families with income $10k - 20k:
Norfolk:
0.7% (3)
State:
1.8% (11,289)
Number of families with income $20k - 30k:
Norfolk:
3.3% (13)
Connecticut:
3.0% (18,506)
Number of families with income $30k - 40k:
Norfolk:
4.1% (16)
State:
2.9% (18,160)
Number of families with income $40k - 50k:
Norfolk:
5.6% (22)
State:
3.9% (24,550)
Number of families with income $50k - 60k:
Norfolk:
2.3% (9)
Connecticut:
4.3% (26,723)
Number of families with income $60k - 75k:
Norfolk:
9.2% (37)
State:
7.1% (44,075)
Number of families with income $75k - 100k:
Norfolk:
9.2% (37)
Connecticut:
12.5% (77,679)
Number of families with income $100k - 125k:
Norfolk:
13.0% (52)
State:
11.1% (69,086)
Number of families with income $125k - 150k:
Norfolk:
7.0% (28)
State:
9.6% (59,616)
Number of families with income $150k - 200k:
Norfolk:
15.1% (61)
Connecticut:
15.7% (97,890)
Number of families with income > $200k:
Norfolk:
28.8% (115)
Connecticut:
26.3% (163,417)
Median non-family income in Norfolk in 2022:
Norfolk:
$62,957
State:
$54,067
Change in median non-family income between 2000 and 2022:
Norfolk, Connecticut:
+73.7%
State:
+68.7%
Median per capita income in Norfolk in 2022:
Norfolk:
$64,352
Connecticut:
$59,916
Change in median per capita income between 2000 and 2022:
Norfolk, Connecticut:
+92.1%
Connecticut:
+90.2%
Income statistics for Black or African American residents
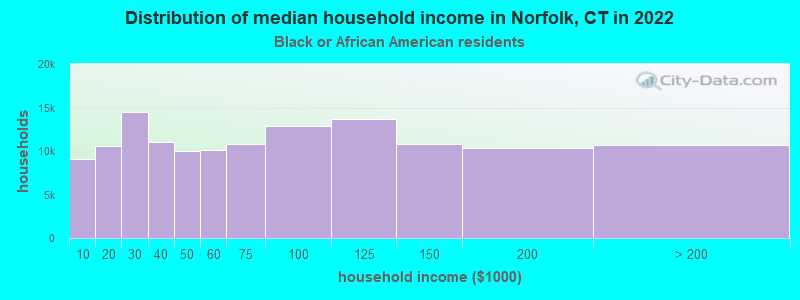
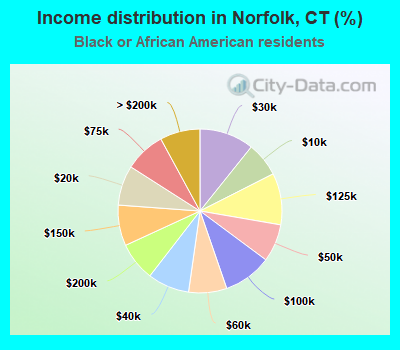
Median household income in Norfolk, CT in 2022:
Norfolk:
$54,307
State:
$61,803
Change in median household income between 2000 and 2022:
Norfolk, Connecticut:
+60.9%
State:
+76.1%
Number of households with income < $10k:
Norfolk:
6.8% (9,128)
State:
6.8% (9,494)
Number of households with income $10k - 20k:
Norfolk:
7.9% (10,578)
State:
7.9% (11,003)
Number of households with income $20k - 30k:
Norfolk:
10.8% (14,464)
State:
10.8% (15,045)
Number of households with income $30k - 40k:
Norfolk:
8.2% (11,057)
State:
8.2% (11,501)
Number of households with income $40k - 50k:
Norfolk:
7.4% (10,014)
State:
7.4% (10,416)
Number of households with income $50k - 60k:
Norfolk:
7.5% (10,128)
State:
7.5% (10,534)
Number of households with income $60k - 75k:
Norfolk:
8.0% (10,810)
Connecticut:
8.0% (11,244)
Number of households with income $75k - 100k:
Norfolk:
9.6% (12,854)
State:
9.6% (13,370)
Number of households with income $100k - 125k:
Norfolk:
10.2% (13,695)
State:
10.2% (14,244)
Number of households with income $125k - 150k:
Norfolk:
8.0% (10,812)
State:
8.0% (11,246)
Number of households with income $150k - 200k:
Norfolk:
7.7% (10,313)
State:
7.7% (10,727)
Number of households with income > $200k:
Norfolk:
7.9% (10,658)
State:
7.9% (11,086)
Aggregate household income in Norfolk in 2022: $165,747
Median non-family income in Norfolk in 2022:
Norfolk:
$59,730
State:
$38,608
Change in median non-family income between 2000 and 2022:
Norfolk, Connecticut:
+77.0%
Connecticut:
+77.0%
Median per capita income in Norfolk in 2022:
Norfolk:
$63,769
Connecticut:
$36,289
Change in median per capita income between 2000 and 2022:
Norfolk, Connecticut:
+115.2%
State:
+117.5%
Income statistics for Asian residents
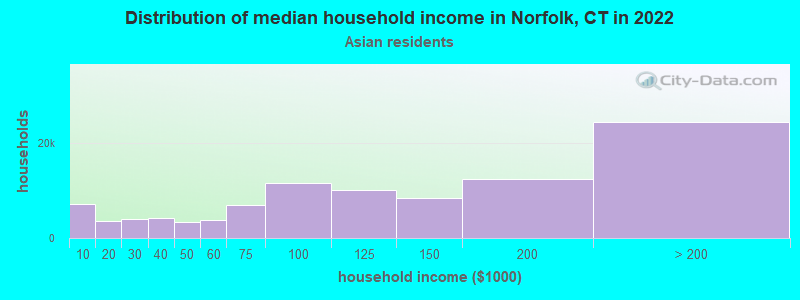
Median household income in Norfolk, CT in 2022:
Norfolk:
$214,844
State:
$110,568
Change in median household income between 2000 and 2022:
Norfolk, Connecticut:
+110.1%
State:
+79.5%
Number of households with income < $10k:
Norfolk:
7.1% (7,049)
Connecticut:
7.1% (4,245)
Number of households with income $10k - 20k:
Norfolk:
3.5% (3,465)
State:
3.5% (2,087)
Number of households with income $20k - 30k:
Norfolk:
4.1% (4,091)
Connecticut:
4.1% (2,464)
Number of households with income $30k - 40k:
Norfolk:
4.1% (4,115)
Connecticut:
4.1% (2,478)
Number of households with income $40k - 50k:
Norfolk:
3.3% (3,293)
State:
3.3% (1,983)
Number of households with income $50k - 60k:
Norfolk:
3.9% (3,866)
State:
3.9% (2,328)
Number of households with income $60k - 75k:
Norfolk:
7.0% (7,021)
State:
7.0% (4,228)
Number of households with income $75k - 100k:
Norfolk:
11.5% (11,476)
State:
11.5% (6,911)
Number of households with income $100k - 125k:
Norfolk:
10.2% (10,174)
Connecticut:
10.2% (6,127)
Number of households with income $125k - 150k:
Norfolk:
8.5% (8,434)
Connecticut:
8.5% (5,079)
Number of households with income $150k - 200k:
Norfolk:
12.4% (12,344)
Connecticut:
12.4% (7,434)
Number of households with income > $200k:
Norfolk:
24.4% (24,344)
State:
24.4% (14,661)
Aggregate household income in Norfolk in 2022: $1,573,174
Median family income in Norfolk in 2022:
Norfolk:
$212,516
State:
$134,548
Median per capita income in Norfolk in 2022:
Norfolk:
$307,005
State:
$55,295
Change in median per capita income between 2000 and 2022:
Norfolk, Connecticut:
+103.6%
State:
+97.8%
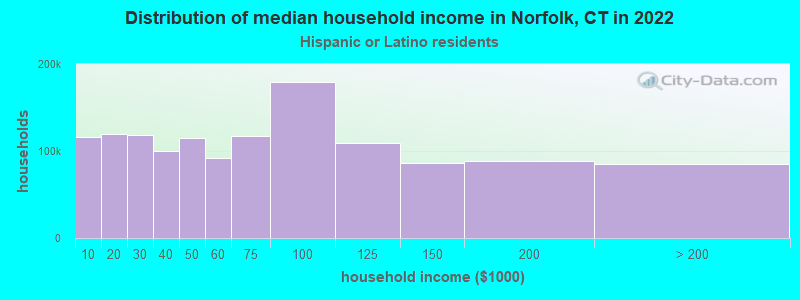
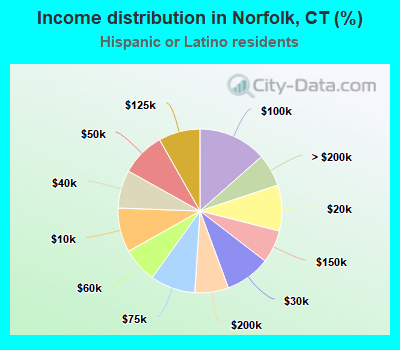
Income statistics for Hispanic or Latino residents
Median household income in Norfolk, CT in 2022:
Norfolk:
$335,590
State:
$60,275
Change in median household income between 2000 and 2022:
Norfolk, Connecticut:
+67.8%
Connecticut:
+87.9%
Number of households with income < $10k:
Norfolk:
8.7% (115,879)
State:
8.7% (18,584)
Number of households with income $10k - 20k:
Norfolk:
9.1% (119,938)
Connecticut:
9.1% (19,235)
Number of households with income $20k - 30k:
Norfolk:
8.9% (118,405)
Connecticut:
8.9% (18,989)
Number of households with income $30k - 40k:
Norfolk:
7.5% (99,561)
Connecticut:
7.5% (15,967)
Number of households with income $40k - 50k:
Norfolk:
8.7% (115,143)
Connecticut:
8.7% (18,466)
Number of households with income $50k - 60k:
Norfolk:
6.9% (91,698)
State:
6.9% (14,706)
Number of households with income $60k - 75k:
Norfolk:
8.9% (117,775)
State:
8.9% (18,888)
Number of households with income $75k - 100k:
Norfolk:
13.5% (178,763)
Connecticut:
13.5% (28,669)
Number of households with income $100k - 125k:
Norfolk:
8.2% (108,708)
Connecticut:
8.2% (17,434)
Number of households with income $125k - 150k:
Norfolk:
6.5% (85,749)
State:
6.5% (13,752)
Number of households with income $150k - 200k:
Norfolk:
6.6% (88,007)
State:
6.6% (14,114)
Number of households with income > $200k:
Norfolk:
6.4% (84,989)
State:
6.4% (13,630)
Aggregate household income in Norfolk in 2022: $4,997,612
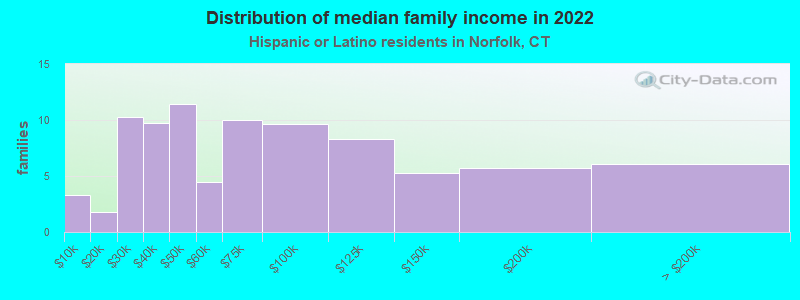
Median family income in Norfolk in 2022:
Norfolk:
$342,163
State:
$68,336
Number of families with income < $10k:
Norfolk:
3.9% (3)
State:
5.2% (7,456)
Number of families with income $10k - 20k:
Norfolk:
2.1% (2)
State:
6.0% (8,616)
Number of families with income $20k - 30k:
Norfolk:
11.9% (10)
Connecticut:
8.9% (12,680)
Number of families with income $30k - 40k:
Norfolk:
11.3% (10)
State:
8.5% (12,090)
Number of families with income $40k - 50k:
Norfolk:
13.3% (11)
State:
8.8% (12,624)
Number of families with income $50k - 60k:
Norfolk:
5.1% (4)
State:
8.4% (11,924)
Number of families with income $60k - 75k:
Norfolk:
11.6% (10)
Connecticut:
8.9% (12,677)
Number of families with income $75k - 100k:
Norfolk:
11.2% (10)
State:
14.3% (20,457)
Number of families with income $100k - 125k:
Norfolk:
9.7% (8)
Connecticut:
8.2% (11,720)
Number of families with income $125k - 150k:
Norfolk:
6.2% (5)
State:
8.2% (11,729)
Number of families with income $150k - 200k:
Norfolk:
6.6% (6)
Connecticut:
7.1% (10,096)
Number of families with income > $200k:
Norfolk:
7.1% (6)
State:
7.4% (10,622)
Median per capita income in Norfolk in 2022:
Norfolk:
$57,641
State:
$28,507
Change in median per capita income between 2000 and 2022:
Norfolk, Connecticut:
+80.3%
Connecticut:
+117.2%
Income statistics for American Indian and Alaska Native residents
Number of households with income < $10k:
Norfolk:
8.4% (400,193)
State:
10.2% (340)
Number of households with income $10k - 20k:
Norfolk:
9.4% (446,606)
State:
8.5% (283)
Number of households with income $20k - 30k:
Norfolk:
8.5% (403,961)
Connecticut:
9.4% (314)
Number of households with income $30k - 40k:
Norfolk:
9.1% (432,794)
State:
10.1% (337)
Number of households with income $40k - 50k:
Norfolk:
8.3% (396,988)
Connecticut:
13.4% (447)
Number of households with income $50k - 60k:
Norfolk:
7.8% (374,326)
State:
3.1% (104)
Number of households with income $60k - 75k:
Norfolk:
9.8% (466,581)
Connecticut:
5.6% (188)
Number of households with income $75k - 100k:
Norfolk:
12.6% (602,282)
State:
13.4% (447)
Number of households with income $100k - 125k:
Norfolk:
9.4% (450,387)
State:
9.5% (317)
Number of households with income $125k - 150k:
Norfolk:
5.6% (269,644)
Connecticut:
3.9% (131)
Number of households with income $150k - 200k:
Norfolk:
6.0% (284,256)
State:
6.3% (212)
Number of households with income > $200k:
Norfolk:
5.2% (246,040)
State:
6.8% (228)
Median per capita income in Norfolk in 2022:
Norfolk:
$86,503
State:
$25,355
Change in median per capita income between 2000 and 2022:
Norfolk, Connecticut:
+45.9%
Connecticut:
+39.4%
Income statistics for Multirace residents
Number of households with income < $10k:
Norfolk:
6.0% (198)
Connecticut:
6.0% (7,457)
Number of households with income $10k - 20k:
Norfolk:
8.1% (269)
State:
8.1% (10,139)
Number of households with income $20k - 30k:
Norfolk:
7.0% (230)
State:
7.0% (8,702)
Number of households with income $30k - 40k:
Norfolk:
6.9% (227)
State:
6.9% (8,546)
Number of households with income $40k - 50k:
Norfolk:
7.0% (231)
State:
7.0% (8,712)
Number of households with income $50k - 60k:
Norfolk:
5.9% (194)
Connecticut:
5.9% (7,331)
Number of households with income $60k - 75k:
Norfolk:
8.5% (282)
State:
8.5% (10,634)
Number of households with income $75k - 100k:
Norfolk:
14.1% (466)
State:
14.1% (17,600)
Number of households with income $100k - 125k:
Norfolk:
9.9% (328)
State:
9.9% (12,383)
Number of households with income $125k - 150k:
Norfolk:
7.1% (236)
State:
7.2% (8,921)
Number of households with income $150k - 200k:
Norfolk:
8.8% (289)
State:
8.8% (10,922)
Number of households with income > $200k:
Norfolk:
10.6% (351)
Connecticut:
10.6% (13,247)
Median per capita income in Norfolk in 2022:
Norfolk:
$782
State:
$32,794
Income statistics for other residents
Aggregate household income in Norfolk in 2022: $227,080
Median family income in Norfolk in 2022:
Norfolk:
$61,683
State:
$67,610
Median per capita income in Norfolk in 2022:
Norfolk:
$12,594
Connecticut:
$29,353
Discuss Norfolk, Connecticut (CT) on our hugely popular Connecticut forum.