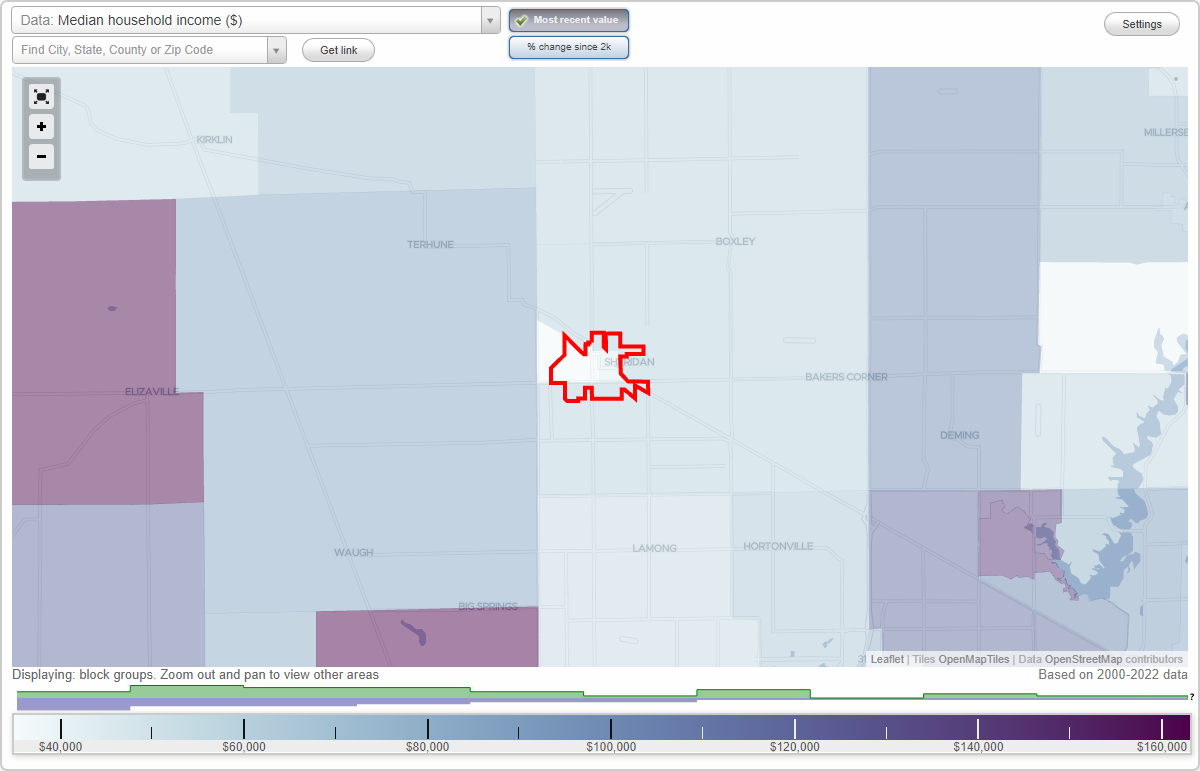
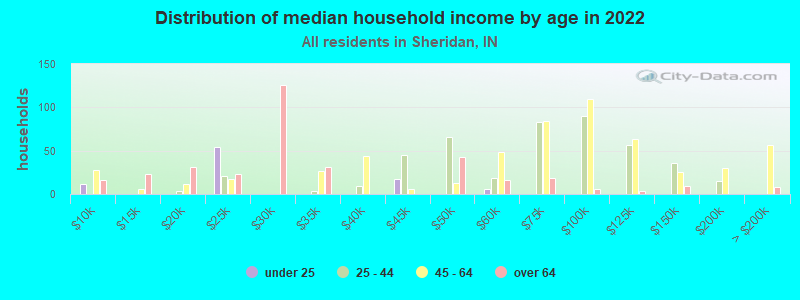
The median household income in Sheridan, IN in 2022 was $57,991, which was 15.2% less than the median annual income of $66,785 across the entire state of Indiana. Compared to the median income of $38,390 in 2000 this represents an increase of 33.8%. The per capita income in 2022 was $28,477, which means an increase of 37.5% compared to 2000 when it was $17,802.
Whole page based on the data from 2000 / 2022 when the population of Sheridan, Indiana was 2,520 / 3,617
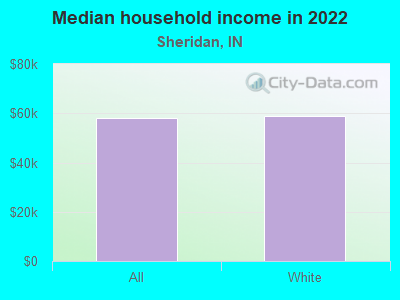
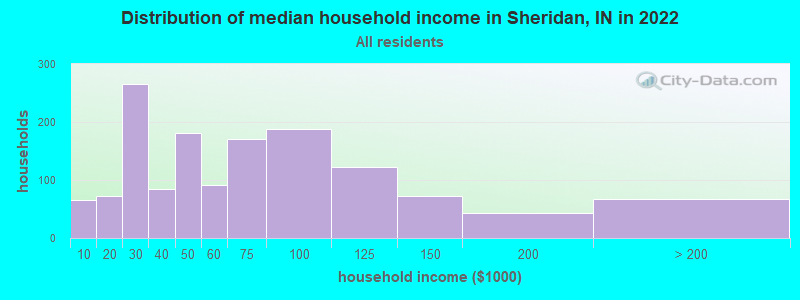
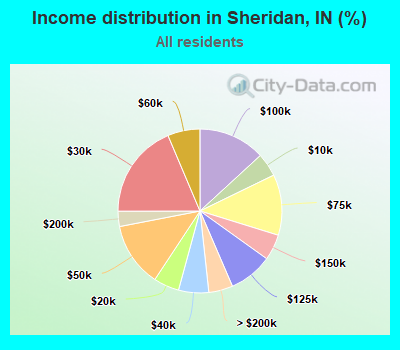
Income statistics for all residents
Median household income in Sheridan, IN in 2022:
Sheridan:
$57,991
State:
$66,785
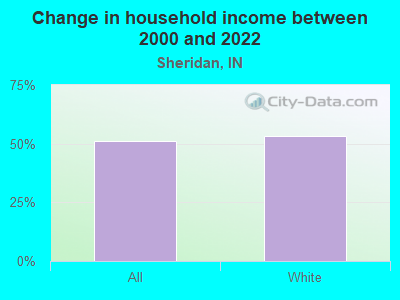
Change in median household income between 2000 and 2022:
Sheridan, Indiana:
+51.1%
State:
+60.7%
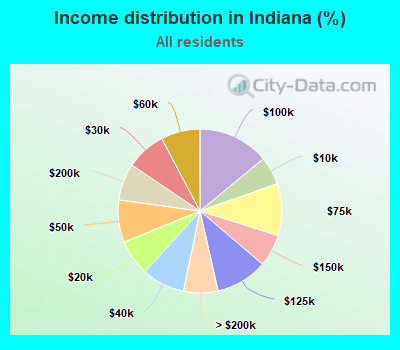
Number of households with income < $10k:
Sheridan:
4.6% (66)
Indiana:
5.6% (151,905)
Number of households with income $10k - 20k:
Sheridan:
5.0% (72)
Indiana:
7.1% (193,665)
Number of households with income $20k - 30k:
Sheridan:
18.6% (266)
Indiana:
7.8% (213,166)
Number of households with income $30k - 40k:
Sheridan:
6.0% (85)
State:
8.5% (231,051)
Number of households with income $40k - 50k:
Sheridan:
12.7% (181)
Indiana:
8.4% (227,994)
Number of households with income $50k - 60k:
Sheridan:
6.4% (91)
State:
7.7% (210,699)
Number of households with income $60k - 75k:
Sheridan:
12.0% (171)
Indiana:
10.3% (279,665)
Number of households with income $75k - 100k:
Sheridan:
13.2% (188)
State:
14.1% (383,225)
Number of households with income $100k - 125k:
Sheridan:
8.6% (123)
State:
10.3% (279,559)
Number of households with income $125k - 150k:
Sheridan:
5.1% (73)
State:
6.3% (172,553)
Number of households with income $150k - 200k:
Sheridan:
3.0% (43)
State:
7.3% (198,086)
Number of households with income > $200k:
Sheridan:
4.8% (68)
State:
6.8% (184,921)
Aggregate household income in Sheridan in 2022: $99,510,926
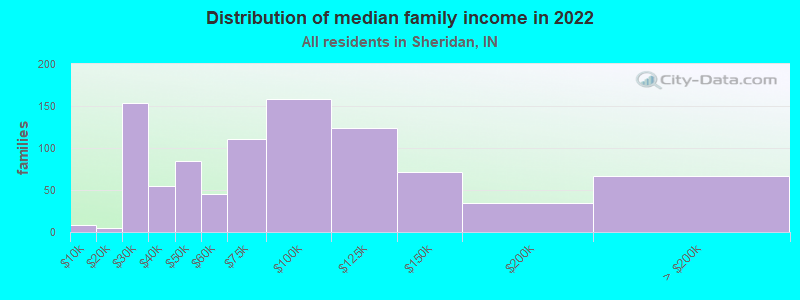
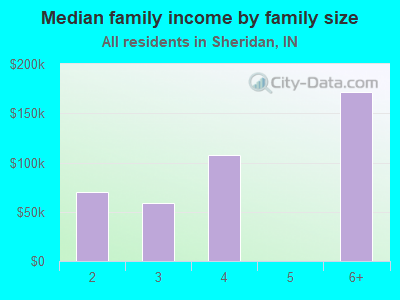
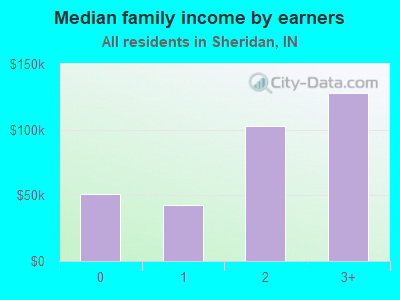
Median family income in Sheridan in 2022:
Sheridan:
$82,158
State:
$84,508
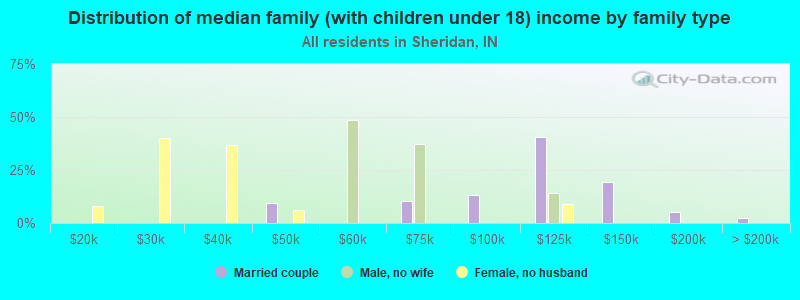
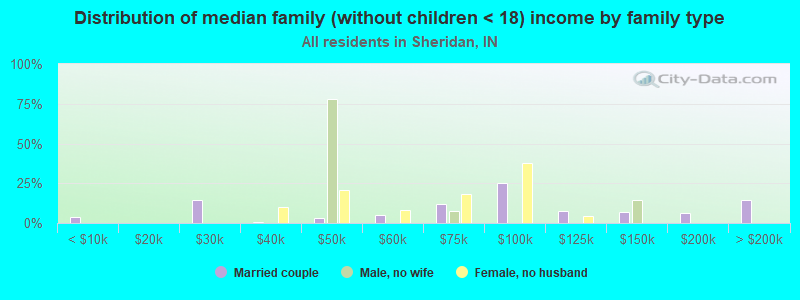
Number of families with income < $10k:
Sheridan:
0.9% (8)
Indiana:
3.5% (60,982)
Number of families with income $10k - 20k:
Sheridan:
0.5% (5)
Indiana:
3.8% (66,551)
Number of families with income $20k - 30k:
Sheridan:
16.7% (154)
Indiana:
4.7% (82,197)
Number of families with income $30k - 40k:
Sheridan:
6.0% (55)
Indiana:
6.2% (108,519)
Number of families with income $40k - 50k:
Sheridan:
9.2% (85)
State:
7.3% (126,404)
Number of families with income $50k - 60k:
Sheridan:
4.9% (45)
State:
7.4% (128,779)
Number of families with income $60k - 75k:
Sheridan:
12.1% (111)
State:
10.7% (185,712)
Number of families with income $75k - 100k:
Sheridan:
17.2% (158)
Indiana:
16.1% (280,434)
Number of families with income $100k - 125k:
Sheridan:
13.5% (124)
Indiana:
12.7% (221,659)
Number of families with income $125k - 150k:
Sheridan:
7.9% (72)
Indiana:
8.2% (142,241)
Number of families with income $150k - 200k:
Sheridan:
3.8% (35)
State:
9.9% (171,875)
Number of families with income > $200k:
Sheridan:
7.3% (67)
State:
9.5% (164,753)
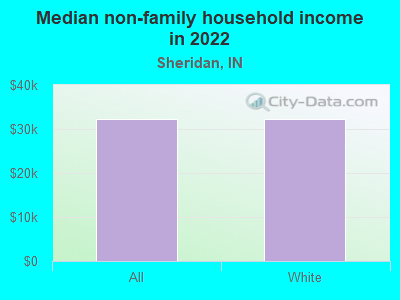
Median non-family income in Sheridan in 2022:
Sheridan:
$32,234
State:
$39,768
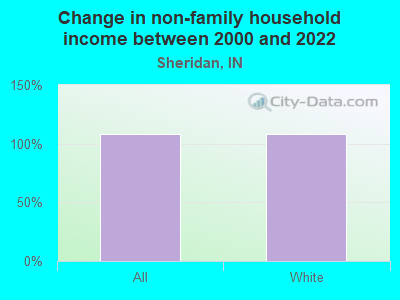
Change in median non-family income between 2000 and 2022:
Sheridan, Indiana:
+108.4%
Indiana:
+67.9%
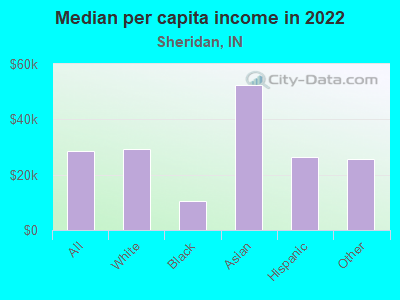
Median per capita income in Sheridan in 2022:
Sheridan:
$28,477
Indiana:
$35,984
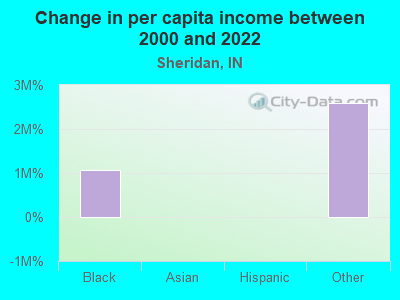
Change in median per capita income between 2000 and 2022:
Sheridan, Indiana:
+60.0%
State:
+76.4%
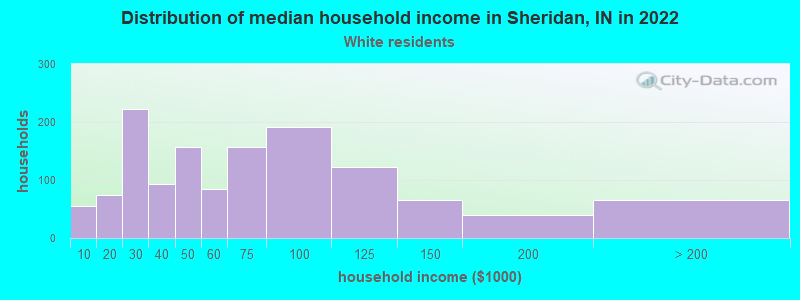
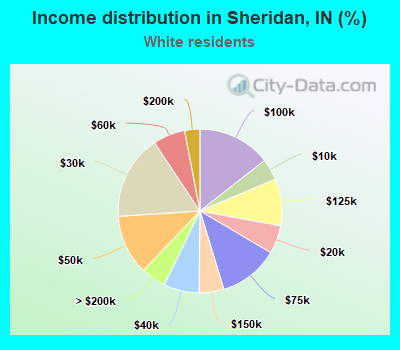
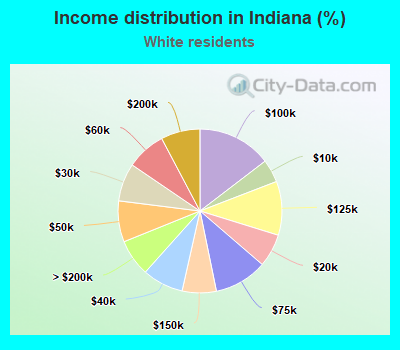
Income statistics for White residents
Median household income in Sheridan, IN in 2022:
Sheridan:
$58,852
Indiana:
$70,619
Change in median household income between 2000 and 2022:
Sheridan, Indiana:
+53.3%
Indiana:
+65.2%
Number of households with income < $10k:
Sheridan:
4.2% (56)
State:
4.5% (100,447)
Number of households with income $10k - 20k:
Sheridan:
5.6% (74)
State:
6.5% (144,216)
Number of households with income $20k - 30k:
Sheridan:
16.7% (222)
State:
7.5% (166,045)
Number of households with income $30k - 40k:
Sheridan:
7.0% (93)
State:
8.1% (179,206)
Number of households with income $40k - 50k:
Sheridan:
11.8% (157)
State:
8.1% (178,985)
Number of households with income $50k - 60k:
Sheridan:
6.3% (84)
State:
7.8% (171,865)
Number of households with income $60k - 75k:
Sheridan:
11.8% (157)
State:
10.5% (231,572)
Number of households with income $75k - 100k:
Sheridan:
14.4% (192)
State:
14.6% (323,007)
Number of households with income $100k - 125k:
Sheridan:
9.3% (123)
State:
10.6% (235,112)
Number of households with income $125k - 150k:
Sheridan:
4.9% (65)
State:
6.7% (148,936)
Number of households with income $150k - 200k:
Sheridan:
3.0% (40)
State:
7.7% (170,750)
Number of households with income > $200k:
Sheridan:
5.0% (66)
Indiana:
7.3% (160,805)
Aggregate household income in Sheridan in 2022: $93,748,142
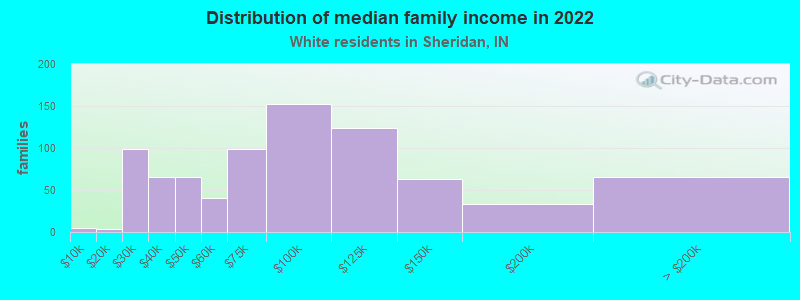
Median family income in Sheridan in 2022:
Sheridan:
$85,380
State:
$88,109
Number of families with income < $10k:
Sheridan:
0.6% (5)
State:
2.5% (35,020)
Number of families with income $10k - 20k:
Sheridan:
0.5% (4)
Indiana:
3.3% (47,383)
Number of families with income $20k - 30k:
Sheridan:
12.1% (99)
State:
4.2% (60,156)
Number of families with income $30k - 40k:
Sheridan:
8.0% (65)
State:
5.8% (82,106)
Number of families with income $40k - 50k:
Sheridan:
8.1% (66)
State:
6.9% (98,385)
Number of families with income $50k - 60k:
Sheridan:
4.9% (40)
Indiana:
7.3% (104,303)
Number of families with income $60k - 75k:
Sheridan:
12.2% (99)
State:
10.7% (152,202)
Number of families with income $75k - 100k:
Sheridan:
18.7% (152)
State:
16.8% (237,844)
Number of families with income $100k - 125k:
Sheridan:
15.2% (124)
State:
13.2% (187,178)
Number of families with income $125k - 150k:
Sheridan:
7.7% (63)
Indiana:
8.6% (122,703)
Number of families with income $150k - 200k:
Sheridan:
4.0% (33)
Indiana:
10.5% (148,889)
Number of families with income > $200k:
Sheridan:
8.1% (66)
State:
10.1% (143,001)
Median non-family income in Sheridan in 2022:
Sheridan:
$32,160
Indiana:
$41,009
Change in median non-family income between 2000 and 2022:
Sheridan, Indiana:
+108.0%
State:
+69.4%
Median per capita income in Sheridan in 2022:
Sheridan:
$29,311
State:
$38,746
Change in median per capita income between 2000 and 2022:
Sheridan, Indiana:
+65.6%
Indiana:
+82.8%
Income statistics for Black or African American residents
Median per capita income in Sheridan in 2022:
Sheridan:
$10,573
Indiana:
$25,414
Income statistics for Asian residents
Median per capita income in Sheridan in 2022:
Sheridan:
$52,506
Indiana:
$41,211
Change in median per capita income between 2000 and 2022:
Sheridan, Indiana:
+75.0%
State:
+83.8%
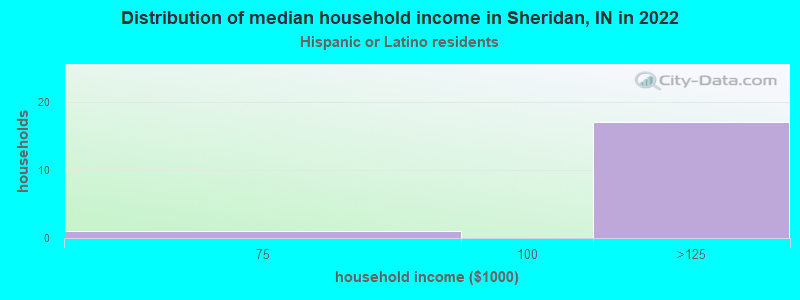
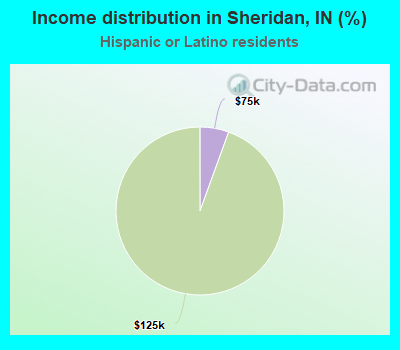
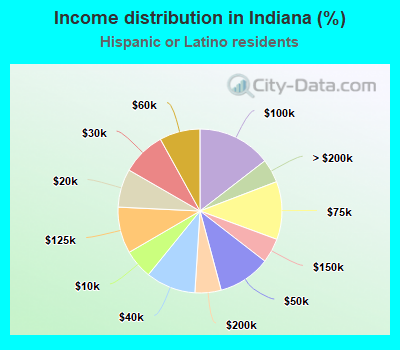
Income statistics for Hispanic or Latino residents
Number of households with income < $10k:
Sheridan:
0.0% (0)
State:
5.8% (8,513)
Number of households with income $10k - 20k:
Sheridan:
0.0% (0)
State:
7.6% (11,151)
Number of households with income $20k - 30k:
Sheridan:
0.0% (0)
State:
8.7% (12,768)
Number of households with income $30k - 40k:
Sheridan:
0.0% (0)
Indiana:
9.8% (14,507)
Number of households with income $40k - 50k:
Sheridan:
0.0% (0)
State:
10.4% (15,272)
Number of households with income $50k - 60k:
Sheridan:
0.0% (0)
State:
8.0% (11,829)
Number of households with income $60k - 75k:
Sheridan:
5.6% (1)
Indiana:
11.4% (16,875)
Number of households with income $75k - 100k:
Sheridan:
0.0% (0)
Indiana:
14.5% (21,434)
Number of households with income $100k - 125k:
Sheridan:
94.4% (17)
State:
9.2% (13,525)
Number of households with income $125k - 150k:
Sheridan:
0.0% (0)
State:
4.9% (7,171)
Number of households with income $150k - 200k:
Sheridan:
0.0% (0)
Indiana:
5.2% (7,618)
Number of households with income > $200k:
Sheridan:
0.0% (0)
State:
4.7% (6,892)
Aggregate household income in Sheridan in 2022: $1,204,824
Median per capita income in Sheridan in 2022:
Sheridan:
$26,261
State:
$22,779
Change in median per capita income between 2000 and 2022:: -21.3%
Sheridan, Indiana:
-21.3%
State:
+76.3%
Income statistics for other residents
Median per capita income in Sheridan in 2022:
Sheridan:
$25,833
State:
$23,719
Discuss Sheridan, Indiana (IN) on our hugely popular Indiana forum.