South West City, Missouri (MO) income map, earnings map, and wages data
The median household income in South West City, MO in 2022 was $48,544, which was 33.5% less than the median annual income of $64,811 across the entire state of Missouri. Compared to the median income of $22,721 in 2000 this represents an increase of 53.2%. The per capita income in 2022 was $23,646, which means an increase of 59.7% compared to 2000 when it was $9,526.
Whole page based on the data from 2000 / 2022 when the population of South West City, Missouri was 855 / 992
Income statistics for all residents
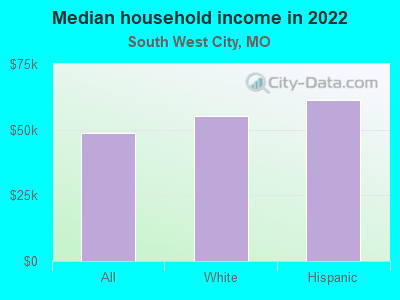
Median household income in South West City, MO in 2022:| South West City: | $48,544 |
| Missouri: | $64,811 |
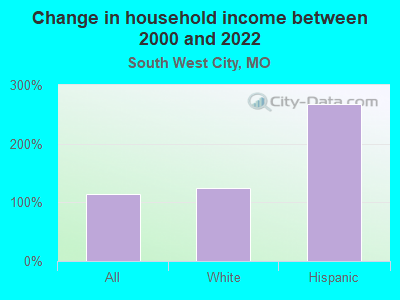
Change in median household income between 2000 and 2022:| South West City, Missouri: | +113.7% |
| State: | +70.9% |
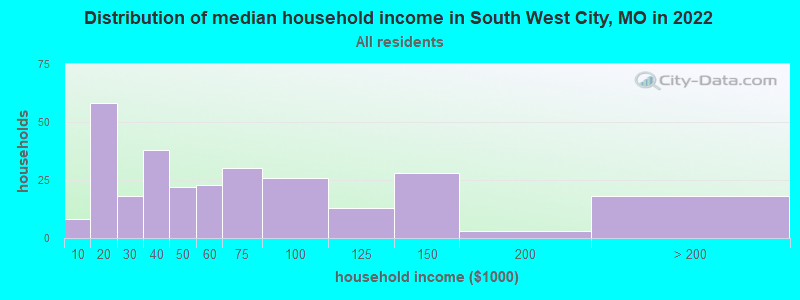
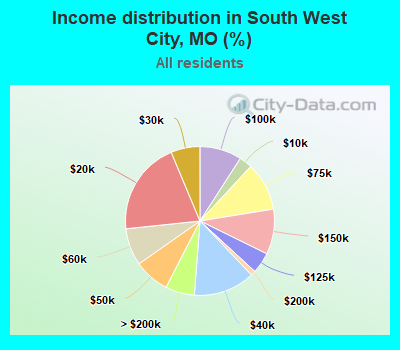
Number of households with income < $10k:| South West City: | 2.8% (8) |
| Missouri: | 5.7% (144,208) |
Number of households with income $10k - 20k:| South West City: | 20.4% (58) |
| Missouri: | 8.2% (205,541) |
Number of households with income $20k - 30k:| South West City: | 6.3% (18) |
| State: | 7.8% (197,162) |
Number of households with income $30k - 40k:| South West City: | 13.3% (38) |
| Missouri: | 8.7% (220,088) |
Number of households with income $40k - 50k:| South West City: | 7.7% (22) |
| Missouri: | 8.2% (206,651) |
Number of households with income $50k - 60k:| South West City: | 8.1% (23) |
| Missouri: | 7.8% (196,521) |
Number of households with income $60k - 75k:| South West City: | 10.5% (30) |
| State: | 10.1% (255,043) |
Number of households with income $75k - 100k:| South West City: | 9.1% (26) |
| State: | 13.4% (337,210) |
Number of households with income $100k - 125k:| South West City: | 4.6% (13) |
| State: | 9.8% (247,187) |
Number of households with income $125k - 150k:| South West City: | 9.8% (28) |
| Missouri: | 6.4% (160,260) |
Number of households with income $150k - 200k:| South West City: | 1.1% (3) |
| State: | 6.9% (174,947) |
Number of households with income > $200k:| South West City: | 6.3% (18) |
| Missouri: | 7.0% (177,014) |
Aggregate household income in South West City in 2022: $22,658,669
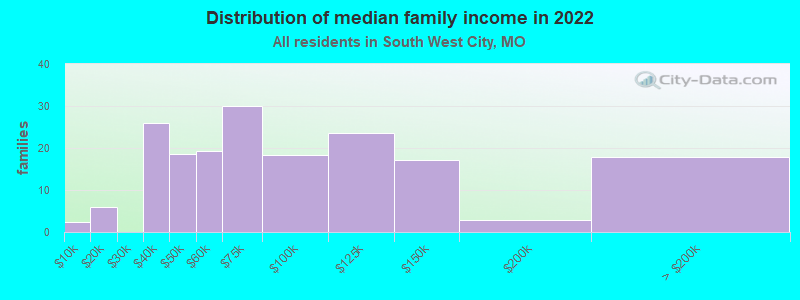
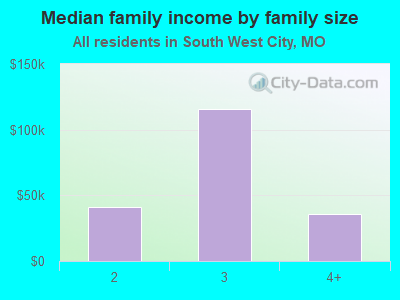
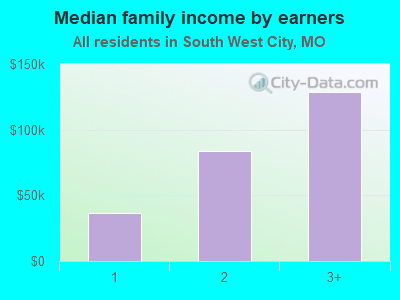
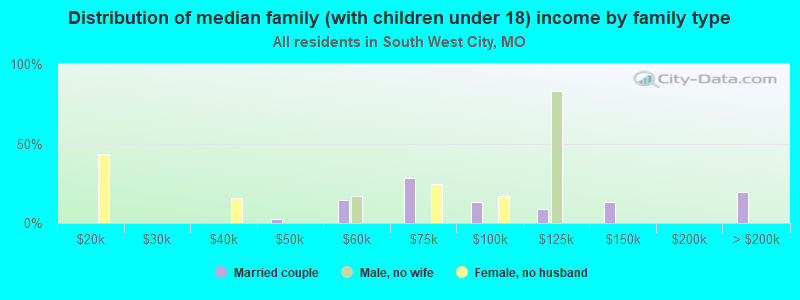
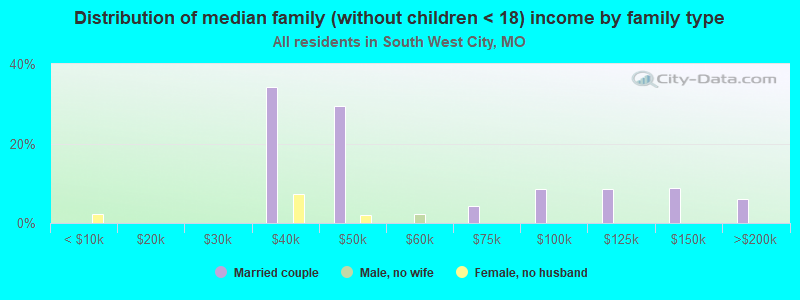
Median family income in South West City in 2022:| South West City: | $67,183 |
| State: | $83,420 |
Number of families with income < $10k:| South West City: | 1.3% (2) |
| State: | 3.2% (49,878) |
Number of families with income $10k - 20k:| South West City: | 3.3% (6) |
| State: | 3.9% (61,082) |
Number of families with income $30k - 40k:| South West City: | 14.2% (26) |
| State: | 6.7% (104,645) |
Number of families with income $40k - 50k:| South West City: | 10.2% (19) |
| Missouri: | 7.2% (113,014) |
Number of families with income $50k - 60k:| South West City: | 10.6% (19) |
| State: | 7.4% (116,279) |
Number of families with income $60k - 75k:| South West City: | 16.5% (30) |
| State: | 10.5% (165,163) |
Number of families with income $75k - 100k:| South West City: | 10.1% (18) |
| State: | 15.5% (243,177) |
Number of families with income $100k - 125k:| South West City: | 13.0% (24) |
| State: | 12.3% (192,410) |
Number of families with income $125k - 150k:| South West City: | 9.4% (17) |
| State: | 8.5% (133,872) |
Number of families with income $150k - 200k:| South West City: | 1.6% (3) |
| State: | 9.7% (152,662) |
Number of families with income > $200k:| South West City: | 9.8% (18) |
| State: | 9.8% (153,310) |
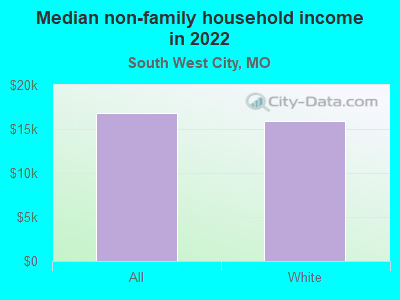
Median non-family income in South West City in 2022:| South West City: | $16,767 |
| State: | $38,435 |
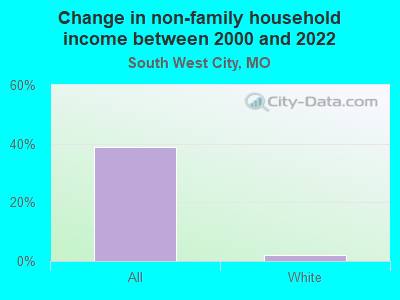
Change in median non-family income between 2000 and 2022:| South West City, Missouri: | +38.8% |
| State: | +72.4% |
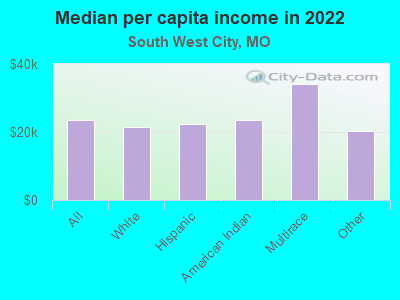
Median per capita income in South West City in 2022:| South West City: | $23,646 |
| State: | $36,640 |
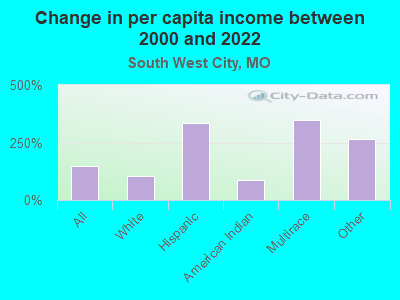
Change in median per capita income between 2000 and 2022:| South West City, Missouri: | +148.2% |
| State: | +83.8% |
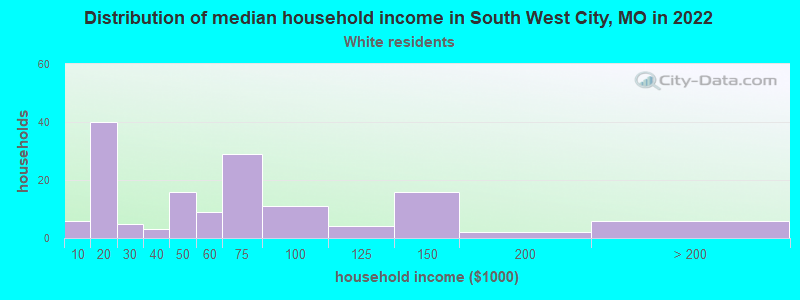
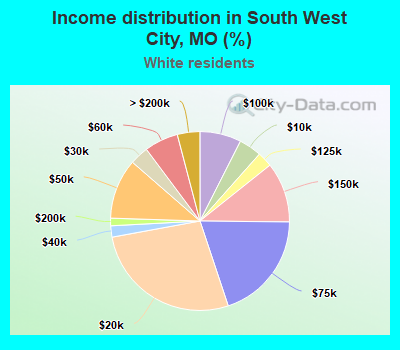
Income statistics for White residents
Median household income in South West City, MO in 2022:| South West City: | $55,210 |
| Missouri: | $68,771 |
Change in median household income between 2000 and 2022:| South West City, Missouri: | +124.0% |
| State: | +73.5% |
Number of households with income < $10k:| South West City: | 4.1% (6) |
| Missouri: | 4.9% (98,067) |
Number of households with income $10k - 20k:| South West City: | 27.2% (40) |
| State: | 7.3% (146,436) |
Number of households with income $20k - 30k:| South West City: | 3.4% (5) |
| State: | 7.6% (153,201) |
Number of households with income $30k - 40k:| South West City: | 2.0% (3) |
| Missouri: | 8.4% (169,042) |
Number of households with income $40k - 50k:| South West City: | 10.9% (16) |
| State: | 8.0% (160,724) |
Number of households with income $50k - 60k:| South West City: | 6.1% (9) |
| Missouri: | 7.7% (155,924) |
Number of households with income $60k - 75k:| South West City: | 19.7% (29) |
| Missouri: | 10.2% (205,080) |
Number of households with income $75k - 100k:| South West City: | 7.5% (11) |
| State: | 14.1% (283,507) |
Number of households with income $100k - 125k:| South West City: | 2.7% (4) |
| State: | 10.2% (205,898) |
Number of households with income $125k - 150k:| South West City: | 10.9% (16) |
| State: | 6.7% (135,287) |
Number of households with income $150k - 200k:| South West City: | 1.4% (2) |
| State: | 7.4% (148,450) |
Number of households with income > $200k:| South West City: | 4.1% (6) |
| Missouri: | 7.6% (153,213) |
Aggregate household income in South West City in 2022: $8,966,519
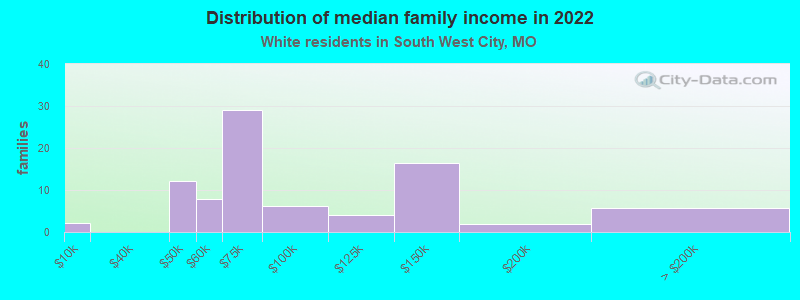
Median family income in South West City in 2022:| South West City: | $67,873 |
| Missouri: | $87,438 |
Number of families with income < $10k:| South West City: | 2.5% (2) |
| State: | 2.5% (31,792) |
Number of families with income $40k - 50k:| South West City: | 14.2% (12) |
| State: | 6.8% (86,154) |
Number of families with income $50k - 60k:| South West City: | 9.3% (8) |
| State: | 7.3% (92,637) |
Number of families with income $60k - 75k:| South West City: | 33.8% (29) |
| State: | 10.4% (131,937) |
Number of families with income $75k - 100k:| South West City: | 7.1% (6) |
| State: | 16.2% (206,529) |
Number of families with income $100k - 125k:| South West City: | 4.8% (4) |
| State: | 12.9% (164,015) |
Number of families with income $125k - 150k:| South West City: | 19.3% (16) |
| State: | 8.9% (113,643) |
Number of families with income $150k - 200k:| South West City: | 2.3% (2) |
| State: | 10.1% (129,106) |
Number of families with income > $200k:| South West City: | 6.8% (6) |
| State: | 10.4% (132,544) |
Median non-family income in South West City in 2022:| South West City: | $15,881 |
| State: | $40,207 |
Change in median non-family income between 2000 and 2022:| South West City, Missouri: | +2.1% |
| State: | +75.5% |
Median per capita income in South West City in 2022:| South West City: | $21,433 |
| Missouri: | $39,160 |
Change in median per capita income between 2000 and 2022:| South West City, Missouri: | +105.2% |
| Missouri: | +86.9% |
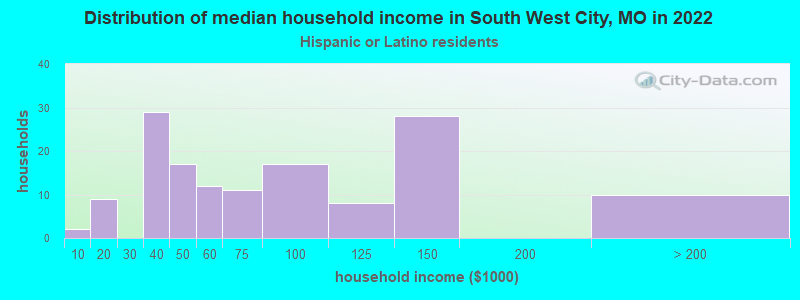
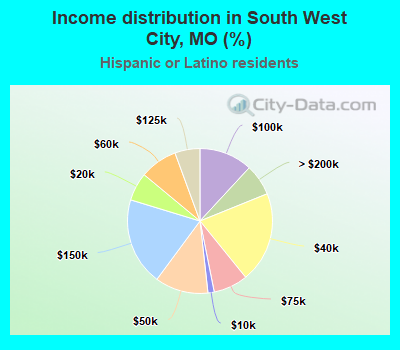
Income statistics for Hispanic or Latino residents
Median household income in South West City, MO in 2022:| South West City: | $61,212 |
| Missouri: | $56,460 |
Number of households with income < $10k:| South West City: | 1.4% (2) |
| State: | 5.1% (4,373) |
Number of households with income $10k - 20k:| South West City: | 6.3% (9) |
| Missouri: | 7.0% (6,006) |
Number of households with income $20k - 30k:| South West City: | 0.0% (0) |
| State: | 10.1% (8,643) |
Number of households with income $30k - 40k:| South West City: | 20.3% (29) |
| State: | 11.7% (9,989) |
Number of households with income $40k - 50k:| South West City: | 11.9% (17) |
| State: | 10.2% (8,742) |
Number of households with income $50k - 60k:| South West City: | 8.4% (12) |
| State: | 9.2% (7,818) |
Number of households with income $60k - 75k:| South West City: | 7.7% (11) |
| Missouri: | 11.2% (9,570) |
Number of households with income $75k - 100k:| South West City: | 11.9% (17) |
| State: | 13.8% (11,820) |
Number of households with income $100k - 125k:| South West City: | 5.6% (8) |
| State: | 7.1% (6,070) |
Number of households with income $125k - 150k:| South West City: | 19.6% (28) |
| State: | 5.7% (4,859) |
Number of households with income $150k - 200k:| South West City: | 0.0% (0) |
| State: | 5.1% (4,323) |
Number of households with income > $200k:| South West City: | 7.0% (10) |
| State: | 3.8% (3,228) |
Aggregate household income in South West City in 2022: $15,152,290
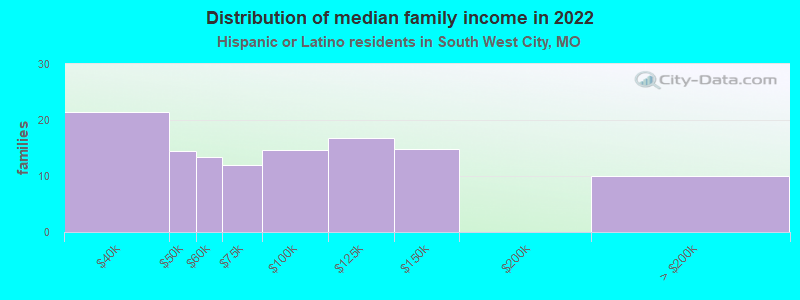
Median family income in South West City in 2022:| South West City: | $67,087 |
| Missouri: | $63,314 |
Number of families with income $30k - 40k:| South West City: | 18.3% (21) |
| Missouri: | 9.7% (5,440) |
Number of families with income $40k - 50k:| South West City: | 12.4% (15) |
| State: | 8.9% (4,992) |
Number of families with income $50k - 60k:| South West City: | 11.5% (13) |
| Missouri: | 7.8% (4,364) |
Number of families with income $60k - 75k:| South West City: | 10.2% (12) |
| State: | 13.0% (7,266) |
Number of families with income $75k - 100k:| South West City: | 12.4% (15) |
| State: | 15.4% (8,626) |
Number of families with income $100k - 125k:| South West City: | 14.3% (17) |
| Missouri: | 7.7% (4,334) |
Number of families with income $125k - 150k:| South West City: | 12.5% (15) |
| State: | 6.4% (3,573) |
Number of families with income > $200k:| South West City: | 8.5% (10) |
| State: | 5.1% (2,862) |
Median per capita income in South West City in 2022:| South West City: | $22,302 |
| State: | $23,656 |
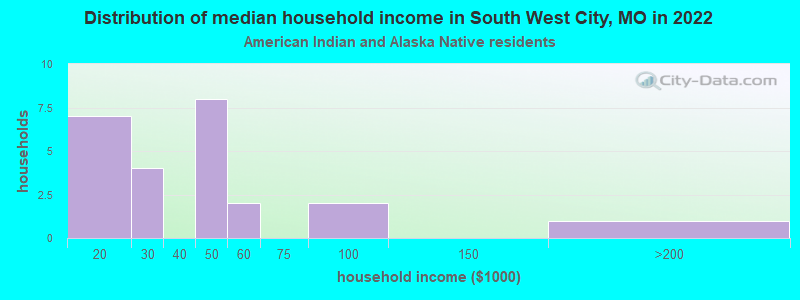
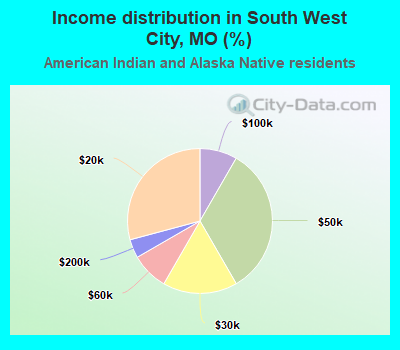
Income statistics for American Indian and Alaska Native residents
Number of households with income < $10k:| South West City: | 0.0% (0) |
| State: | 8.8% (546) |
Number of households with income $10k - 20k:| South West City: | 29.2% (7) |
| State: | 8.1% (503) |
Number of households with income $20k - 30k:| South West City: | 16.7% (4) |
| State: | 5.2% (320) |
Number of households with income $30k - 40k:| South West City: | 0.0% (0) |
| State: | 6.3% (388) |
Number of households with income $40k - 50k:| South West City: | 33.3% (8) |
| State: | 13.1% (809) |
Number of households with income $50k - 60k:| South West City: | 8.3% (2) |
| State: | 5.7% (349) |
Number of households with income $60k - 75k:| South West City: | 0.0% (0) |
| State: | 11.6% (718) |
Number of households with income $75k - 100k:| South West City: | 8.3% (2) |
| State: | 14.9% (920) |
Number of households with income $100k - 125k:| South West City: | 0.0% (0) |
| Missouri: | 13.3% (819) |
Number of households with income $125k - 150k:| South West City: | 0.0% (0) |
| State: | 4.9% (304) |
Number of households with income $150k - 200k:| South West City: | 4.2% (1) |
| State: | 5.9% (367) |
Number of households with income > $200k:| South West City: | 0.0% (0) |
| State: | 2.1% (130) |
Aggregate household income in South West City in 2022: $1,147,731
Median per capita income in South West City in 2022:| South West City: | $23,563 |
| State: | $31,281 |
Change in median per capita income between 2000 and 2022:| South West City, Missouri: | +87.5% |
| State: | +116.2% |
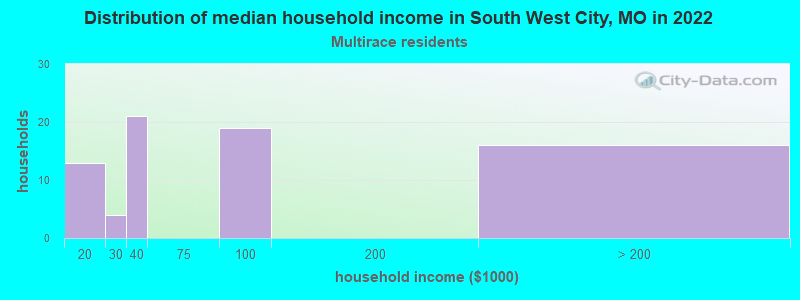
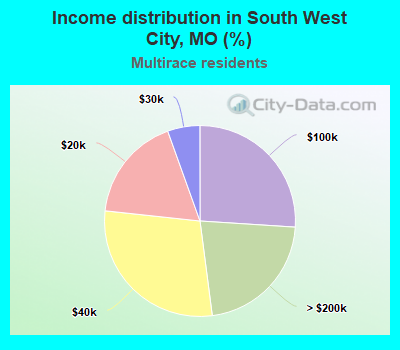
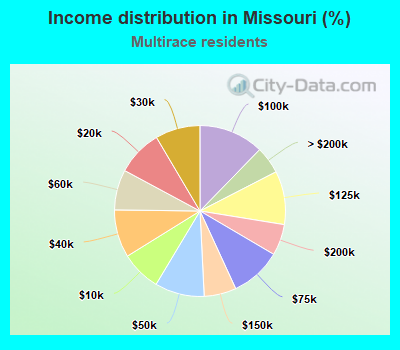
Income statistics for Multirace residents
Number of households with income < $10k:| South West City: | 0.0% (0) |
| Missouri: | 7.6% (10,901) |
Number of households with income $10k - 20k:| South West City: | 17.8% (13) |
| Missouri: | 8.7% (12,480) |
Number of households with income $20k - 30k:| South West City: | 5.5% (4) |
| Missouri: | 8.5% (12,233) |
Number of households with income $30k - 40k:| South West City: | 28.8% (21) |
| Missouri: | 9.1% (13,060) |
Number of households with income $40k - 50k:| South West City: | 0.0% (0) |
| State: | 9.4% (13,506) |
Number of households with income $50k - 60k:| South West City: | 0.0% (0) |
| Missouri: | 7.6% (11,002) |
Number of households with income $60k - 75k:| South West City: | 0.0% (0) |
| State: | 9.7% (13,948) |
Number of households with income $75k - 100k:| South West City: | 26.0% (19) |
| Missouri: | 12.3% (17,702) |
Number of households with income $100k - 125k:| South West City: | 0.0% (0) |
| Missouri: | 10.1% (14,590) |
Number of households with income $125k - 150k:| South West City: | 0.0% (0) |
| State: | 6.1% (8,758) |
Number of households with income $150k - 200k:| South West City: | 0.0% (0) |
| State: | 5.9% (8,516) |
Number of households with income > $200k:| South West City: | 21.9% (16) |
| State: | 5.2% (7,429) |
Aggregate household income in South West City in 2022: $12,683,388
Median per capita income in South West City in 2022:| South West City: | $34,066 |
| State: | $25,564 |
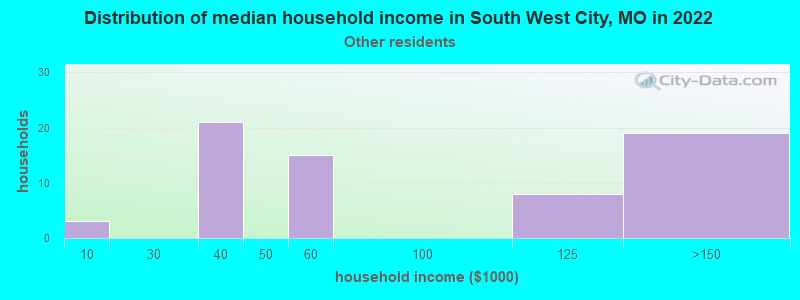
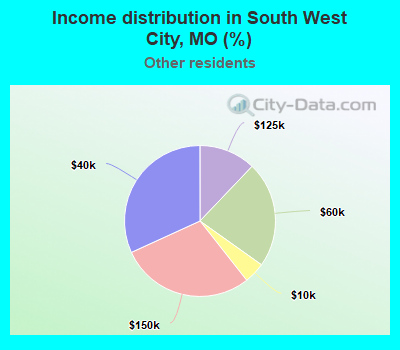
Income statistics for other residents
Number of households with income < $10k:| South West City: | 4.5% (3) |
| State: | 6.5% (2,051) |
Number of households with income $10k - 20k:| South West City: | 0.0% (0) |
| State: | 8.0% (2,525) |
Number of households with income $20k - 30k:| South West City: | 0.0% (0) |
| State: | 9.9% (3,128) |
Number of households with income $30k - 40k:| South West City: | 31.8% (21) |
| State: | 9.7% (3,040) |
Number of households with income $40k - 50k:| South West City: | 0.0% (0) |
| State: | 7.9% (2,476) |
Number of households with income $50k - 60k:| South West City: | 22.7% (15) |
| State: | 10.1% (3,183) |
Number of households with income $60k - 75k:| South West City: | 0.0% (0) |
| State: | 13.8% (4,353) |
Number of households with income $75k - 100k:| South West City: | 0.0% (0) |
| State: | 11.9% (3,760) |
Number of households with income $100k - 125k:| South West City: | 12.1% (8) |
| Missouri: | 5.0% (1,588) |
Number of households with income $125k - 150k:| South West City: | 28.8% (19) |
| State: | 6.6% (2,070) |
Number of households with income $150k - 200k:| South West City: | 0.0% (0) |
| Missouri: | 7.1% (2,231) |
Number of households with income > $200k:| South West City: | 0.0% (0) |
| State: | 3.5% (1,093) |
Aggregate household income in South West City in 2022: $4,545,654
Median per capita income in South West City in 2022:| South West City: | $20,387 |
| Missouri: | $24,560 |