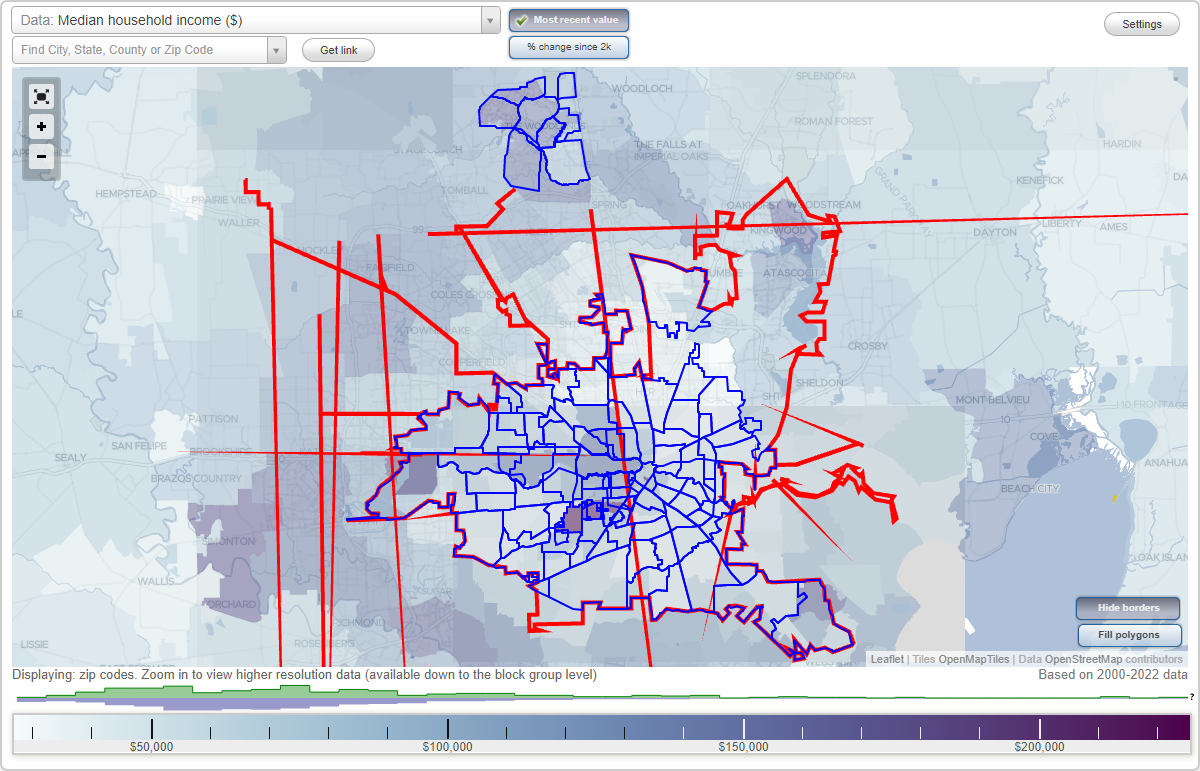
Houston, Texas Neighborhood Map - Income, House Prices, Occupations, Boundaries
Settings
X

- City boundary
- Neighborhood boundaries
Business Search - 14 Million verified businesses
Neighborhoods:
Acres Homes, Alden Bridge, Alief, Allendale, Astrodome, Belle Court, Binz, Braeburn, Braesview Terrace, Braeswood Place, Briar Forest, Briar Meadow, Central Southwest, Clear Lake, Clinton Park, Cochran's Crossing`, College Court Place, College Park, Colonial Terrace, Creekside Park, Cunningham Terrace, Dorado, Downtown, East End, East Houston, East Little York, Eastwood, Edgebrook, Eldridge, Fairbanks, Fifth Ward, Fondren Gardens, Fondren Park, Fondren Southwest, Fonmeadow, Forth Ward, Garden Oaks, George Bush International Airport, Golfcrest, Greater Heights, Greater Hobby, Greater Inwood, Greenspoint, Grogan's Mill, Gulfgate, Gulfton, Harrisburg, Herman Park, Hidden Valley, Houston Heights, Huntwood, Independence Heights, Jensen, Kashmere Gardens, Langwood, Lazy Brook, Macgregor, Magnolia Park, Medical Center, Memorial, Memorial Park, Midtown, Minnetex, Monticello, Montrose, Museum District, Myerland, Neartown, North Shore, Northside, Northside Village, Panther Creek, Park Place, Park Ten, Pecan Park, Pemberton, Pleasantville, Port Houston, Research Forest, Rice Court, Rice Village, Richmond Plaza, River Oaks, Second Ward, Settegast, Sharpstown, South Acres, South Main, South Main Gardens, South Park, South Union, Southbelt, Spring, Spring Branch, Spring Branch Central, Spring Branch East, Spring Branch West, Spring Shadows, Sterling Ridge, Sunnyside, Sunset Terrace, The Villages, Third Ward, Trinity, University Place, Upper Kirby, Uptown, Virginia Court, Washington Ave., Wayside, West University Place, Westbury, Westchase, Westwood, Willow BendAcres Homes neighborhood in Houston statistics: (Find on map)
Area: 8.844 square miles
Population: 26,023
Population density:
Median household income in 2021:
Median rent in in 2021:
Male vs Females
Median age
Housing prices:
Average estimated value of detached houses in 2021 (76.8% of all units):
Average estimated value of townhouses or other attached units in 2021 (1.5% of all units):
Most popular occupations of males: sales and office occupations (22.6%); construction, extraction, and maintenance occupations (16.8%); service occupations (15.0%); material moving occupations (11.2%); management occupations (except farmers) (7.5%); production occupations (4.9%); transportation occupations (4.7%)
Most popular occupations of females: sales and office occupations (36.1%); service occupations (27.1%); management occupations (except farmers) (9.5%); education, training, and library occupations (5.1%); healthcare practitioners and technical occupations (3.8%); business and financial operations occupations (3.4%); arts, design, entertainment, sports, and media occupations (3.0%)
Highways in this neighborhood: N Shepherd Dr (State Spur 261).
Roads and streets: W Montgomery Rd; W Tidwell Rd; W Little York Rd; Mansfield St; Wheatley St; Paul Quinn St; S Victory Dr (S Victory St); Creekmont Dr; Knox St; de Soto St; Dewalt St; Ferguson Way; de Priest St; Ellington St; W Donovan St; Carver Rd; Wilburforce St; Easter St (Rolland); Lucky St; Garapan St; Marjorie St; Dolly Wright St (Dolly Wright Ave); Esther Dr; Conklin St; T C Jester Blvd; Willow St; Granville Dr; Tuskegee St; Areba St; Cebra Rd (Duoto St, Rosslyn Rd); Maxroy St; Wall St; Marcella St; N Victory Dr; Stuebner Airline Rd (Veterans Memorial Dr); Homer St; Neiman Ln; Dolly Wright St; Carmel Ave (Carmel St); Druid Ave (Druid St); Cliffdale St (Cliffdale Ave); Lawn St; Junell St; Marcolin St; Ringold St; Dalview Ave (Dalview St); Glen Ave (Glen Ln); Sealey St; Beckley St; W Rittenhouse Rd; Green Meadow Ln; Venus St; Bland St; Mount St; Morrow St; Phillips St; Balbo St; Goldspier St; Dillard St; Wavell St; St Clair St; Bayou Vista Dr; W Gulf Bank Rd; Maybell St; Whitecastle Ln; Tower St; Prosper St; Nuben St; Oak Shadows Dr; Grenshaw St; Beall St; Sunnyhill St; Fallen Oaks Dr; Tarberry Rd; S Lane St (South Ln); Garfield Ave; Observatory St; Diplomat Way; Fortune St; Stallings Dr; Elkhart St; Davidson St; Randolph St; Banjo St; Washington St; Lincoln St; Lovers Ln; Calvin Ave (Calvin St); Dyer St; Prairie View Dr; James Franklin St; Virgil St; Millville Dr; Hampton St; Walcott Ln; Saddle Rock Dr; Mc Crarey Dr; Sandle St; Willow Rock Rd; Fashion Hill Dr; Haynes St; Rutherford Ln; Ezzard Charles Ln; Donley Dr; Glenn; Armada Dr; Cottage Oak Ln; Rainy River Dr; du Boise Rd; Pickering St; Enterprise St; Mayview Dr; Yorkdale Dr; Apollo St; Rosie St; Hidden Valley Dr; Burleson St; Ashmole Ln; Orebo St; Morehouse Ln; Emma Lou St; Cora St; Arabella St; Cohn St; Utah St; Couch St; D S Bailey Ln; Rachel St; Hezekiah Ln; Vega St; Irby St; Fair St; Taft Ave; Radcliffe St; Moon Beam St; Bayou View Dr; Burt St; Grant Ave; Alba Rd; Garden City Dr; Garwood Dr; Tippett St; Parkway Dr; Golf Dr; Brinkman St; Beaver Bend Rd; Twinbrooke Dr; Ponnel Ln; Bertellis Ln; Ashton; Mc Kinley Ave; Blue Sky St; Orion St; Rigel Rd; Redrock St; Winter Bay Ln; Bunche Dr; Bethune Dr; Mc Williams Dr; Covington Dr; Victory Dr; Cathcart Dr; Greenhurst St; Polk Ave; Charlie St; Melon St; Proswimmer St; Reverend B J Lewis Dr; Double St; Damascus Dr; North Ln (N Lane St); Mosher Ln; Cool Spring Dr; N Star; Sherman St; Annex Dr (Reverend B J Lewis Dr); Hanfro Ln; Williamsdell St; Cotton Gate Ln (Cottage Gate Ln); Ivy Spring Ln; Shepherd Pr Two Dr; Golden Forest Dr; Sand; Cliffmarshall St; Anchor St; Whitehead St; Mountwood St; Lonallen St; Gloyna St; Genemaury St; Acres Homes Tc One Dr; Park Plaza Dr; Arabelle St; Peach Spring Dr; N Victory St; S Victory St; Lonnie Ln; Sue Marie Ln; Rollins St; Alexander Ave; Glenhouse Dr; Glidden; Bonazzi Blvd (Bonazzi St); Shepherd Pr Four Dr; Bersey Ln; Rufus St; Dunsmere Rd (Dunsmere St); Old Ledge Ln; Candlecrest Dr; E Maxroy St; Bradmar St; Hornsby Ln; Greenhood St (Greenhurst St); Wendemere St; Vinson St; Smilax St; Clift Haven Dr; Chaney Allen; Price St; Brian Haven Dr; Sam Rose St (Samrose Dr); Diplomat Ct; Boeneman Dr; Edmont Ln; Burg Ln (Burg St); Joe Louis Ln; Henrietta St; Rosslyn Rd; Parkes; Balbo; Benchfield Dr; Denalt St; Chas Ln (Chase Ln); Adolph Dr; Midgeley St; Branford St; Fitzgerald St; Champion Ln; Candletree Dr; ; Felicia; Andy Dr; Candlemist Dr; Bundick Dr; Charles St; Shirley Mae Ln; Mahalia Dr; Fred St; Creeping Vine Ln; Tillison St; Shepherd Pr Five Dr; Jeff St; Horne St; Weathersby St; Hattie St; Cottage Gate Ln; Grenshaw; Bergstrom St; Boots Rd; Karelian Dr; Aransas Dr; Homer Dr; Jumada Cir; Carino Dr; Hillsgrove Ct; Montgomery Rd; Parkway; Dayport; Carillo Dr; Acres Homes Tc Three Dr; Iron Liege Ct; Ardley Cir; Sunmore Ct; Nip St; Citation Ct; Aspen View Ct; Modley Ct; Odet Ct; Avert Ct; Dayport St; Phillips; Banjo; Glenhouse Ct; Luke St; Shepherd Pr Three Dr; W Parker Rd; Sam St; Hohen Cir; Leago St.
Other features: White Oak Byu; Vogel Crk; Little White Oak Byu; Cole Crk.
Acres Homes neighborhood detailed profile
Area: 8.844 square miles
Population: 26,023
Population density:
| Acres Homes: | 2,942 people per square mile |
| Houston: | 3,947 people per square mile |
Median household income in 2021:
| Acres Homes: | $60,015 |
| Houston: | $55,499 |
Median rent in in 2021:
| Acres Homes: | $738 |
| Houston: | $974 |
Male vs Females
| Males: | 12,783 |
| Females: | 13,240 |
Median age
| Males: | 34.7 years |
| Females: | 39.7 years |
Housing prices:
Average estimated value of detached houses in 2021 (76.8% of all units):
| Acres Homes: | $130,710 |
| Houston: | $304,685 |
Average estimated value of townhouses or other attached units in 2021 (1.5% of all units):
| This neighborhood: | $73,485 |
| city: | $305,463 |
Most popular occupations of males: sales and office occupations (22.6%); construction, extraction, and maintenance occupations (16.8%); service occupations (15.0%); material moving occupations (11.2%); management occupations (except farmers) (7.5%); production occupations (4.9%); transportation occupations (4.7%)
Most popular occupations of females: sales and office occupations (36.1%); service occupations (27.1%); management occupations (except farmers) (9.5%); education, training, and library occupations (5.1%); healthcare practitioners and technical occupations (3.8%); business and financial operations occupations (3.4%); arts, design, entertainment, sports, and media occupations (3.0%)
Highways in this neighborhood: N Shepherd Dr (State Spur 261).
Roads and streets: W Montgomery Rd; W Tidwell Rd; W Little York Rd; Mansfield St; Wheatley St; Paul Quinn St; S Victory Dr (S Victory St); Creekmont Dr; Knox St; de Soto St; Dewalt St; Ferguson Way; de Priest St; Ellington St; W Donovan St; Carver Rd; Wilburforce St; Easter St (Rolland); Lucky St; Garapan St; Marjorie St; Dolly Wright St (Dolly Wright Ave); Esther Dr; Conklin St; T C Jester Blvd; Willow St; Granville Dr; Tuskegee St; Areba St; Cebra Rd (Duoto St, Rosslyn Rd); Maxroy St; Wall St; Marcella St; N Victory Dr; Stuebner Airline Rd (Veterans Memorial Dr); Homer St; Neiman Ln; Dolly Wright St; Carmel Ave (Carmel St); Druid Ave (Druid St); Cliffdale St (Cliffdale Ave); Lawn St; Junell St; Marcolin St; Ringold St; Dalview Ave (Dalview St); Glen Ave (Glen Ln); Sealey St; Beckley St; W Rittenhouse Rd; Green Meadow Ln; Venus St; Bland St; Mount St; Morrow St; Phillips St; Balbo St; Goldspier St; Dillard St; Wavell St; St Clair St; Bayou Vista Dr; W Gulf Bank Rd; Maybell St; Whitecastle Ln; Tower St; Prosper St; Nuben St; Oak Shadows Dr; Grenshaw St; Beall St; Sunnyhill St; Fallen Oaks Dr; Tarberry Rd; S Lane St (South Ln); Garfield Ave; Observatory St; Diplomat Way; Fortune St; Stallings Dr; Elkhart St; Davidson St; Randolph St; Banjo St; Washington St; Lincoln St; Lovers Ln; Calvin Ave (Calvin St); Dyer St; Prairie View Dr; James Franklin St; Virgil St; Millville Dr; Hampton St; Walcott Ln; Saddle Rock Dr; Mc Crarey Dr; Sandle St; Willow Rock Rd; Fashion Hill Dr; Haynes St; Rutherford Ln; Ezzard Charles Ln; Donley Dr; Glenn; Armada Dr; Cottage Oak Ln; Rainy River Dr; du Boise Rd; Pickering St; Enterprise St; Mayview Dr; Yorkdale Dr; Apollo St; Rosie St; Hidden Valley Dr; Burleson St; Ashmole Ln; Orebo St; Morehouse Ln; Emma Lou St; Cora St; Arabella St; Cohn St; Utah St; Couch St; D S Bailey Ln; Rachel St; Hezekiah Ln; Vega St; Irby St; Fair St; Taft Ave; Radcliffe St; Moon Beam St; Bayou View Dr; Burt St; Grant Ave; Alba Rd; Garden City Dr; Garwood Dr; Tippett St; Parkway Dr; Golf Dr; Brinkman St; Beaver Bend Rd; Twinbrooke Dr; Ponnel Ln; Bertellis Ln; Ashton; Mc Kinley Ave; Blue Sky St; Orion St; Rigel Rd; Redrock St; Winter Bay Ln; Bunche Dr; Bethune Dr; Mc Williams Dr; Covington Dr; Victory Dr; Cathcart Dr; Greenhurst St; Polk Ave; Charlie St; Melon St; Proswimmer St; Reverend B J Lewis Dr; Double St; Damascus Dr; North Ln (N Lane St); Mosher Ln; Cool Spring Dr; N Star; Sherman St; Annex Dr (Reverend B J Lewis Dr); Hanfro Ln; Williamsdell St; Cotton Gate Ln (Cottage Gate Ln); Ivy Spring Ln; Shepherd Pr Two Dr; Golden Forest Dr; Sand; Cliffmarshall St; Anchor St; Whitehead St; Mountwood St; Lonallen St; Gloyna St; Genemaury St; Acres Homes Tc One Dr; Park Plaza Dr; Arabelle St; Peach Spring Dr; N Victory St; S Victory St; Lonnie Ln; Sue Marie Ln; Rollins St; Alexander Ave; Glenhouse Dr; Glidden; Bonazzi Blvd (Bonazzi St); Shepherd Pr Four Dr; Bersey Ln; Rufus St; Dunsmere Rd (Dunsmere St); Old Ledge Ln; Candlecrest Dr; E Maxroy St; Bradmar St; Hornsby Ln; Greenhood St (Greenhurst St); Wendemere St; Vinson St; Smilax St; Clift Haven Dr; Chaney Allen; Price St; Brian Haven Dr; Sam Rose St (Samrose Dr); Diplomat Ct; Boeneman Dr; Edmont Ln; Burg Ln (Burg St); Joe Louis Ln; Henrietta St; Rosslyn Rd; Parkes; Balbo; Benchfield Dr; Denalt St; Chas Ln (Chase Ln); Adolph Dr; Midgeley St; Branford St; Fitzgerald St; Champion Ln; Candletree Dr; ; Felicia; Andy Dr; Candlemist Dr; Bundick Dr; Charles St; Shirley Mae Ln; Mahalia Dr; Fred St; Creeping Vine Ln; Tillison St; Shepherd Pr Five Dr; Jeff St; Horne St; Weathersby St; Hattie St; Cottage Gate Ln; Grenshaw; Bergstrom St; Boots Rd; Karelian Dr; Aransas Dr; Homer Dr; Jumada Cir; Carino Dr; Hillsgrove Ct; Montgomery Rd; Parkway; Dayport; Carillo Dr; Acres Homes Tc Three Dr; Iron Liege Ct; Ardley Cir; Sunmore Ct; Nip St; Citation Ct; Aspen View Ct; Modley Ct; Odet Ct; Avert Ct; Dayport St; Phillips; Banjo; Glenhouse Ct; Luke St; Shepherd Pr Three Dr; W Parker Rd; Sam St; Hohen Cir; Leago St.
Other features: White Oak Byu; Vogel Crk; Little White Oak Byu; Cole Crk.
Acres Homes neighborhood detailed profile
Alden Bridge neighborhood in Houston statistics: (Find on map)
Area: 4.727 square miles
Population: 18,359
Population density:
Median household income in 2021:
Median rent in in 2021:
Male vs Females
Median age
Housing prices:
Average estimated value of detached houses in 2021 (96.5% of all units):
Average estimated value of townhouses or other attached units in 2021 (2.0% of all units):
Most popular occupations of males: sales and office occupations (23.5%); management occupations (except farmers) (23.0%); business and financial operations occupations (13.4%); education, training, and library occupations (11.3%); architecture and engineering occupations (7.5%); healthcare practitioners and technical occupations (3.5%); service occupations (3.3%)
Most popular occupations of females: education, training, and library occupations (26.2%); healthcare practitioners and technical occupations (16.8%); sales and office occupations (15.3%); business and financial operations occupations (14.1%); management occupations (except farmers) (11.4%); service occupations (6.7%); community and social services occupations (3.3%)
Highways in this neighborhood: College Park Dr (State Hwy 242).
Roads and streets: Alden Bridge Dr; Research Forest Dr; Crownridge Dr; Kuykendahl Rd; Green Bridge Dr; Bristol Oak Cir (S Taylor Point Dr); Northway Dr; FM 1488 Rd (FM 1488); Kendall Green Dr; Branch Crossing Dr; Green Gables Cir; N Windvale Ridge Cir; W Windvale Cir; Evangeline Oaks; N Acacia Park Cir; S Winterport Cir; Egypt Ln; N Linton Ridge Cir; Bay Branch Dr; W Russet Grove Cir; N Westwinds Cir; Pleasant Bend Dr; Slatestone Cir; N Piney Plains Cir; Millport Dr; Maple Path Pl; S Piney Plains Cir; Autumn Branch Dr; S Bristol Oak Cir; S Brooksedge Cir; Glentrace Cir; S Hawthorne Hollow Cir; Noble Bend Dr; W Sundance Cir; Marlberry Branch Dr; E Windvale Cir; W Greywing Cir; S Downey Willow Cir; Laurelhurst Cir; S Golden Vine Cir; W Bristol Oak Cir; Lattice Gate St; N Goldenvine Cir; W Fairbranch Cir; S Hawthorne Hollow Cir (N Hawthorne Hollow Cir); N Willow Point Cir; Bristol Bend Cir; Alden Glen Dr; N Greenvine Cir; N Wooded Brook Cir; E Fairbranch Cir; E Sundance Cir; S Plum Crest Cir; S Bethany Bend Cir; W Latestone Cir (Slatestone Cir); E Greywing Cir; E Foxbriar Forest Cir; Meadow Brook Pl; N Maple Glade Cir; Hidden Meadow Dr; E Whistlers Bend Cir; N Whistlers Bend Cir; Eagle Mead Pl; S Crisp Morning Cir; Clingstone Pl; N Brooksedge Cir; Trellis Gate St; N Villa Oaks Dr; N Wynnoak Cir; E Green Gables Cir; N Holly Laurel Cir; N Bethany Bend Cir; Golden Autumn Pl; Alden Bend Dr; N Old Cedar Cir; S Willow Point Cir; E Stockbridge Landing Cir (Stockbridge Lndg); Wooded Brook Dr; N Bluff Creek Cir; S Acacia Park Dr; S Benton Woods Cir; W Sandalbranch Cir; N Evangeline Oaks Cir; N Merryweather Cir; Cypress Lake Pl (Talbot Bend); Greenvine Cir; S Wynnoak Cir; Clover Gate Cir; Harvest Wind Pl; Wintergreen Trl; Tethered Vine Pl; S Bluff Creek Cir; S Lace Arbor Dr; Sienna Bend Dr; W Stockbridge Landing Cir; N Apple Springs Cir; W Hobbit Glen Dr; Cottage Mill Pl; E Hobbit Glen Dr; N Walden Elms Cir; E Russet Grove Cir; N Downey Willow Cir; S Clovergate Cir; E Evangeline Oaks Cir; Sundance Dr; W Laurelhurst Cir; N Flickering Sun Cir; Wildflower Trace Pl; N Lace Arbor Dr; Camber Pine Pl; Benton Woods Dr; S Greywing Cir; N Winterport Cir; Webb Creek Pl; Trilling Bird Pl; S Old Cedar Cir; N Valley Oaks Cir; N Millport Cir; S Millport Cir; S Holly Laurel Cir; Orchard Pines Pl; Wind Harp Pl; S Merryweather Cir; N York Gate Ct; W Alden Bridge Dr; Auburn Path Dr; Vista Mill Pl; Lamps Glow Pl; Courtland Green (Courtland Green St); Teak Mill Pl; Ardsley Square Pl; Sentry Maple Pl; Wrens Song Pl; Bethany Bend Dr; New Avery Pl; Lightwood Trace Dr; Sorrel Tree Pl; S Flickering Sun Cir; Taupewood Pl; S Evangeline Oaks Cir; W Evangeline Oaks Cir; N Plum Crest Cir; S Walden Elms Cir; W Whistlers Bend Cir; E Sandalbranch Cir; S Apple Springs Cir; Spiceberry Pl; Westwinds Cir; Hermit Thrush Pl; W Greenhill Terrace Pl; Goldleaf Pl; Brooksedge Dr N; Freestone Pl; Belcarra Pl; E Autumn Branch Cir; N Crisp Morning Cir; Plum Crest Cir; S Veranda Ridge Dr; Blackbird Ln; Pinery Ridge Pl; Silkbay Pl; Ashley Greens; Anise Tree Pl; Sandlebranch Dr; Valley Mead Pl; June Breeze Pl; Valley Oaks Cir; Latticeleaf Pl; S Maple Glade Cir; Pipers Meadow St; Rosedown Pl; Alderon Woods Pl; N Veranda Ridge Dr; Canoe Birch Pl; Hollylaurel Dr; Crested Point Pl; Broadweather Pl; Hufsmith Conroe Rd (Conroe Huffsmith Rd, FM 2978 Rd, FM 2978); W Cottage Green; S Linton Ridge Cir; W Honey Grove Pl; Baylark Pl; Keelrock Pl; E Greenhill Terrace Pl; Sunspree Pl; Rillwood Pl; Juniper Grove Pl; E Cottage Green St; Ivy Garden St; Glade Bank Pl; Greycrest Pl (Graycrest Pl); Fortuneberry Pl; Melville Glen Pl; Endor Forest Pl; W Sienna Pl; Howell Creek Pl; Lyreleaf Pl; Linton Downs Pl; N Benton Woods Cir; E Honey Grove Pl; Dovewing Pl; Redland Pl; Stone Creek Pl; N Camellia Grove Cir; Wineberry Pl; Classic Oaks Pl; Tivoli Garden Ct; Ryanwyck Pl; Sagamore Bend; Veranda Ridge Dr; Camborn Pl; Golden Vine Ct; Merryweather Pl; E Sienna Pl; Doeskin Pl; E Bellmead Pl; Moss Bluff Ct; Abby Ln; Paddock Pines Pl; Rippled Pond Pl (Rippled Pond); Felicity Trace Pl; N Auburn Path Dr; Bluff Creek Pl; Gabled Pines Pl; Wintergrass Pl; Tallow Hill Pl; W Ardsley Square Pl; Bluff Creek Cir; Harpstone Pl; Dalea Pl; Long Springs Pl; Serenity Woods Pl; W Foxbriar Forest Cir; Barn Lattern Pl; Beckett Hill Pl; Leaf Spring Pl; S Villa Oaks Dr; Shellbark Pl; Watermint Pl; Rowan Tree Pl; S Camellia Grove Cir; Harmony Arbor Ct; Scenic Mill Pl; Merit Woods Pl; Wildflower Pl; Woodlily Pl; E Ardsley Square Pl; Rockledge; E Gaslight Pl; Westward Ridge Pl; Clarion Ridge Ct; Almond Branch Pl; Timberstar St; Coachman Ridge Pl; N Belfair Pl; Columnberry Ct; Betony Pl; Currymead Pl; Weeping Spruce Pl; Teakwood Pl; W Bellmead Pl; Marble Rock Pl; S Belfair Pl; S Wynn Oak Dr (Wynnoak Dr); W Gaslight Pl; Sheerborne Ct; Serene Creek Pl; Emery Mill Pl; Rustic Bend Pl; Bethany Bend Ct; Blackstar Pl; S Manorcliff Pl; Verdant Valley Pl; Musgrove Pl; Penny Ln; Sunlit Grove St; Empire Forest Pl; Legend Hollow Ct; S Ashley Greens; English Oaks; Vinca Trl; Egan Lake Pl; Wild Colt Pl; Wistful Vista Pl; Clearbend Pl; Long Hearth Pl; Orchard Dale Cir; Opaline Pl; Cross Lake Dr; Fallsbury Ct; S Wynn Oak Dr; Mulberry Glen Pl; Willow Point Pl; Benton Woods Ct; Indian Corn Pl; Glen Erin Dr; Bonnaire Dr; Cane Mill Pl; Bel Canto Green; Lightwood Trce; S York Gate Ct; Tudor Glen Pl; Spooner Ridge Ct; Fallsbury Way; Emory Xing; Truevine Pl; Pine Island Pl; Forest Perch Pl; Owls Cove Pl; Scotch Pine Ct; Kenmare Ct; Hobbit Glen Pl; Blushwood Pl; Royal Ridge Pl; W Slatestone Cir; Butterfly Branch Pl; Beach Bark Pl; Wintercorn Pl; Verbena Bend Pl; Grand Bayou Pl; Cloud Bank Pl; Edgecliff Pl; Dukedale Dr; Lancepine Pl; Cheshire Glen; Twelve Oaks; N Manorcliff; Cleerebrook Pl; Seneca Pl; Flintshire Pl; Legend Mill Ct; Merryvale Dr; Bluff Creek Ct; Silk Tree Pl; Chelsea Ridge Ct (Chelsea Bridge Ct); Roslyn Bend Ct; Acacia Park Pl; Timberlea Pl; Churchdale Pl; Stockbridge Landing Ct; Mayborough Ct; Jasmine Bend Dr; Argonne Pl; Heaven Tree Pl; Candlenut Dr; Mystic Glade Ct; Stockbridge Landing Dr; Rockledge Dr; Deepdale Dr; Sleeping Creek Pl; Tree Sparrow Dr; Eastwood Pl; W Fowbriar Forest Cir; Ascot Way Ct; Westwinds Dr; Russet Grove; Midnight Dr; Shimmerwood Dr; Camellia Grove Dr; Shadeberry Pl; Sweet Birch Pl; Willow Point Ct; Pocket Flower Ct; Ridgeling Dr; Walden Elms Dr; Winrock Pl; Sonnet Grove Ct; N Scarlet Elm Ct; Mystic Arbor Pl; Thornapple Dr; Acadia Branch Pl; Guinevere Pl; Wildaster Ct; Old River Pl; Shale Run Pl; Doveplum Pl; Weeping Spruce Ct; Gillium Bluff Pl; Summer Lark Pl; Devon Mill Pl; Cheshire Glen Ct; Pleasant Bend Pl; Valleybrook Pl; Sunloft Ct (Sun Loft Ct); Newland Ct; Silver Rock 77382; Almond Dale Ct; Candlespice Pl; N Wynn Oak Cir; Noble Bend Pl; Barongate Ct; Thistle Brook Pl; Harvest Green Pl; Kingpine Ct; Troll Woods Ct; Flickering Sun Ct; Brooksedge Ct; Merit Woods Creek; Dewdrift Pl; Chorale Grove Ct; Evian Path Ct; Heartridge Ct; Musk Rose Ct; Windbluff Ct; E Greenhill Cir; Shelter Rock Ct; W Winterport Cir; Lively Oaks Pl.
Other features: Panther Br; Nickaburr Crk.
Alden Bridge neighborhood detailed profile
Area: 4.727 square miles
Population: 18,359
Population density:
| Alden Bridge (Village of Alden Bridge): | 3,884 people per square mile |
| Houston: | 3,947 people per square mile |
Median household income in 2021:
| Alden Bridge (Village of Alden Bridge): | $161,512 |
| Houston: | $55,499 |
Median rent in in 2021:
| Alden Bridge (Village of Alden Bridge): | $2,745 |
| Houston: | $974 |
Male vs Females
| Males: | 8,936 |
| Females: | 9,422 |
Median age
| Males: | 39.3 years |
| Females: | 42.0 years |
Housing prices:
Average estimated value of detached houses in 2021 (96.5% of all units):
| Alden Bridge (Village of Alden Bridge): | $402,966 |
| Houston: | $304,685 |
Average estimated value of townhouses or other attached units in 2021 (2.0% of all units):
| This neighborhood: | $190,000 |
| city: | $305,463 |
Most popular occupations of males: sales and office occupations (23.5%); management occupations (except farmers) (23.0%); business and financial operations occupations (13.4%); education, training, and library occupations (11.3%); architecture and engineering occupations (7.5%); healthcare practitioners and technical occupations (3.5%); service occupations (3.3%)
Most popular occupations of females: education, training, and library occupations (26.2%); healthcare practitioners and technical occupations (16.8%); sales and office occupations (15.3%); business and financial operations occupations (14.1%); management occupations (except farmers) (11.4%); service occupations (6.7%); community and social services occupations (3.3%)
Highways in this neighborhood: College Park Dr (State Hwy 242).
Roads and streets: Alden Bridge Dr; Research Forest Dr; Crownridge Dr; Kuykendahl Rd; Green Bridge Dr; Bristol Oak Cir (S Taylor Point Dr); Northway Dr; FM 1488 Rd (FM 1488); Kendall Green Dr; Branch Crossing Dr; Green Gables Cir; N Windvale Ridge Cir; W Windvale Cir; Evangeline Oaks; N Acacia Park Cir; S Winterport Cir; Egypt Ln; N Linton Ridge Cir; Bay Branch Dr; W Russet Grove Cir; N Westwinds Cir; Pleasant Bend Dr; Slatestone Cir; N Piney Plains Cir; Millport Dr; Maple Path Pl; S Piney Plains Cir; Autumn Branch Dr; S Bristol Oak Cir; S Brooksedge Cir; Glentrace Cir; S Hawthorne Hollow Cir; Noble Bend Dr; W Sundance Cir; Marlberry Branch Dr; E Windvale Cir; W Greywing Cir; S Downey Willow Cir; Laurelhurst Cir; S Golden Vine Cir; W Bristol Oak Cir; Lattice Gate St; N Goldenvine Cir; W Fairbranch Cir; S Hawthorne Hollow Cir (N Hawthorne Hollow Cir); N Willow Point Cir; Bristol Bend Cir; Alden Glen Dr; N Greenvine Cir; N Wooded Brook Cir; E Fairbranch Cir; E Sundance Cir; S Plum Crest Cir; S Bethany Bend Cir; W Latestone Cir (Slatestone Cir); E Greywing Cir; E Foxbriar Forest Cir; Meadow Brook Pl; N Maple Glade Cir; Hidden Meadow Dr; E Whistlers Bend Cir; N Whistlers Bend Cir; Eagle Mead Pl; S Crisp Morning Cir; Clingstone Pl; N Brooksedge Cir; Trellis Gate St; N Villa Oaks Dr; N Wynnoak Cir; E Green Gables Cir; N Holly Laurel Cir; N Bethany Bend Cir; Golden Autumn Pl; Alden Bend Dr; N Old Cedar Cir; S Willow Point Cir; E Stockbridge Landing Cir (Stockbridge Lndg); Wooded Brook Dr; N Bluff Creek Cir; S Acacia Park Dr; S Benton Woods Cir; W Sandalbranch Cir; N Evangeline Oaks Cir; N Merryweather Cir; Cypress Lake Pl (Talbot Bend); Greenvine Cir; S Wynnoak Cir; Clover Gate Cir; Harvest Wind Pl; Wintergreen Trl; Tethered Vine Pl; S Bluff Creek Cir; S Lace Arbor Dr; Sienna Bend Dr; W Stockbridge Landing Cir; N Apple Springs Cir; W Hobbit Glen Dr; Cottage Mill Pl; E Hobbit Glen Dr; N Walden Elms Cir; E Russet Grove Cir; N Downey Willow Cir; S Clovergate Cir; E Evangeline Oaks Cir; Sundance Dr; W Laurelhurst Cir; N Flickering Sun Cir; Wildflower Trace Pl; N Lace Arbor Dr; Camber Pine Pl; Benton Woods Dr; S Greywing Cir; N Winterport Cir; Webb Creek Pl; Trilling Bird Pl; S Old Cedar Cir; N Valley Oaks Cir; N Millport Cir; S Millport Cir; S Holly Laurel Cir; Orchard Pines Pl; Wind Harp Pl; S Merryweather Cir; N York Gate Ct; W Alden Bridge Dr; Auburn Path Dr; Vista Mill Pl; Lamps Glow Pl; Courtland Green (Courtland Green St); Teak Mill Pl; Ardsley Square Pl; Sentry Maple Pl; Wrens Song Pl; Bethany Bend Dr; New Avery Pl; Lightwood Trace Dr; Sorrel Tree Pl; S Flickering Sun Cir; Taupewood Pl; S Evangeline Oaks Cir; W Evangeline Oaks Cir; N Plum Crest Cir; S Walden Elms Cir; W Whistlers Bend Cir; E Sandalbranch Cir; S Apple Springs Cir; Spiceberry Pl; Westwinds Cir; Hermit Thrush Pl; W Greenhill Terrace Pl; Goldleaf Pl; Brooksedge Dr N; Freestone Pl; Belcarra Pl; E Autumn Branch Cir; N Crisp Morning Cir; Plum Crest Cir; S Veranda Ridge Dr; Blackbird Ln; Pinery Ridge Pl; Silkbay Pl; Ashley Greens; Anise Tree Pl; Sandlebranch Dr; Valley Mead Pl; June Breeze Pl; Valley Oaks Cir; Latticeleaf Pl; S Maple Glade Cir; Pipers Meadow St; Rosedown Pl; Alderon Woods Pl; N Veranda Ridge Dr; Canoe Birch Pl; Hollylaurel Dr; Crested Point Pl; Broadweather Pl; Hufsmith Conroe Rd (Conroe Huffsmith Rd, FM 2978 Rd, FM 2978); W Cottage Green; S Linton Ridge Cir; W Honey Grove Pl; Baylark Pl; Keelrock Pl; E Greenhill Terrace Pl; Sunspree Pl; Rillwood Pl; Juniper Grove Pl; E Cottage Green St; Ivy Garden St; Glade Bank Pl; Greycrest Pl (Graycrest Pl); Fortuneberry Pl; Melville Glen Pl; Endor Forest Pl; W Sienna Pl; Howell Creek Pl; Lyreleaf Pl; Linton Downs Pl; N Benton Woods Cir; E Honey Grove Pl; Dovewing Pl; Redland Pl; Stone Creek Pl; N Camellia Grove Cir; Wineberry Pl; Classic Oaks Pl; Tivoli Garden Ct; Ryanwyck Pl; Sagamore Bend; Veranda Ridge Dr; Camborn Pl; Golden Vine Ct; Merryweather Pl; E Sienna Pl; Doeskin Pl; E Bellmead Pl; Moss Bluff Ct; Abby Ln; Paddock Pines Pl; Rippled Pond Pl (Rippled Pond); Felicity Trace Pl; N Auburn Path Dr; Bluff Creek Pl; Gabled Pines Pl; Wintergrass Pl; Tallow Hill Pl; W Ardsley Square Pl; Bluff Creek Cir; Harpstone Pl; Dalea Pl; Long Springs Pl; Serenity Woods Pl; W Foxbriar Forest Cir; Barn Lattern Pl; Beckett Hill Pl; Leaf Spring Pl; S Villa Oaks Dr; Shellbark Pl; Watermint Pl; Rowan Tree Pl; S Camellia Grove Cir; Harmony Arbor Ct; Scenic Mill Pl; Merit Woods Pl; Wildflower Pl; Woodlily Pl; E Ardsley Square Pl; Rockledge; E Gaslight Pl; Westward Ridge Pl; Clarion Ridge Ct; Almond Branch Pl; Timberstar St; Coachman Ridge Pl; N Belfair Pl; Columnberry Ct; Betony Pl; Currymead Pl; Weeping Spruce Pl; Teakwood Pl; W Bellmead Pl; Marble Rock Pl; S Belfair Pl; S Wynn Oak Dr (Wynnoak Dr); W Gaslight Pl; Sheerborne Ct; Serene Creek Pl; Emery Mill Pl; Rustic Bend Pl; Bethany Bend Ct; Blackstar Pl; S Manorcliff Pl; Verdant Valley Pl; Musgrove Pl; Penny Ln; Sunlit Grove St; Empire Forest Pl; Legend Hollow Ct; S Ashley Greens; English Oaks; Vinca Trl; Egan Lake Pl; Wild Colt Pl; Wistful Vista Pl; Clearbend Pl; Long Hearth Pl; Orchard Dale Cir; Opaline Pl; Cross Lake Dr; Fallsbury Ct; S Wynn Oak Dr; Mulberry Glen Pl; Willow Point Pl; Benton Woods Ct; Indian Corn Pl; Glen Erin Dr; Bonnaire Dr; Cane Mill Pl; Bel Canto Green; Lightwood Trce; S York Gate Ct; Tudor Glen Pl; Spooner Ridge Ct; Fallsbury Way; Emory Xing; Truevine Pl; Pine Island Pl; Forest Perch Pl; Owls Cove Pl; Scotch Pine Ct; Kenmare Ct; Hobbit Glen Pl; Blushwood Pl; Royal Ridge Pl; W Slatestone Cir; Butterfly Branch Pl; Beach Bark Pl; Wintercorn Pl; Verbena Bend Pl; Grand Bayou Pl; Cloud Bank Pl; Edgecliff Pl; Dukedale Dr; Lancepine Pl; Cheshire Glen; Twelve Oaks; N Manorcliff; Cleerebrook Pl; Seneca Pl; Flintshire Pl; Legend Mill Ct; Merryvale Dr; Bluff Creek Ct; Silk Tree Pl; Chelsea Ridge Ct (Chelsea Bridge Ct); Roslyn Bend Ct; Acacia Park Pl; Timberlea Pl; Churchdale Pl; Stockbridge Landing Ct; Mayborough Ct; Jasmine Bend Dr; Argonne Pl; Heaven Tree Pl; Candlenut Dr; Mystic Glade Ct; Stockbridge Landing Dr; Rockledge Dr; Deepdale Dr; Sleeping Creek Pl; Tree Sparrow Dr; Eastwood Pl; W Fowbriar Forest Cir; Ascot Way Ct; Westwinds Dr; Russet Grove; Midnight Dr; Shimmerwood Dr; Camellia Grove Dr; Shadeberry Pl; Sweet Birch Pl; Willow Point Ct; Pocket Flower Ct; Ridgeling Dr; Walden Elms Dr; Winrock Pl; Sonnet Grove Ct; N Scarlet Elm Ct; Mystic Arbor Pl; Thornapple Dr; Acadia Branch Pl; Guinevere Pl; Wildaster Ct; Old River Pl; Shale Run Pl; Doveplum Pl; Weeping Spruce Ct; Gillium Bluff Pl; Summer Lark Pl; Devon Mill Pl; Cheshire Glen Ct; Pleasant Bend Pl; Valleybrook Pl; Sunloft Ct (Sun Loft Ct); Newland Ct; Silver Rock 77382; Almond Dale Ct; Candlespice Pl; N Wynn Oak Cir; Noble Bend Pl; Barongate Ct; Thistle Brook Pl; Harvest Green Pl; Kingpine Ct; Troll Woods Ct; Flickering Sun Ct; Brooksedge Ct; Merit Woods Creek; Dewdrift Pl; Chorale Grove Ct; Evian Path Ct; Heartridge Ct; Musk Rose Ct; Windbluff Ct; E Greenhill Cir; Shelter Rock Ct; W Winterport Cir; Lively Oaks Pl.
Other features: Panther Br; Nickaburr Crk.
Alden Bridge neighborhood detailed profile
Alief neighborhood in Houston statistics: (Find on map)
Area: 14.200 square miles
Population: 71,435
Population density:
Median household income in 2021:
Median rent in in 2021:
Male vs Females
Median age
Average estimated value of detached houses in 2021 (55.4% of all units):
Most popular occupations of males: service occupations (21.6%); construction, extraction, and maintenance occupations (18.2%); sales and office occupations (13.5%); production occupations (9.2%); material moving occupations (7.9%); transportation occupations (6.0%); management occupations (except farmers) (5.8%)
Most popular occupations of females: service occupations (44.8%); sales and office occupations (29.0%); healthcare practitioners and technical occupations (7.9%); material moving occupations (4.2%); education, training, and library occupations (3.7%); management occupations (except farmers) (3.6%); transportation occupations (2.2%)
Roads and streets: W Bellfort Ave; Huntington Venture Dr; Synott Rd (FM 1876, N Eldridge St); Huntington Estates Dr; Sue Ln; Webb Ln; Crow Valley Ln; Club Ln; Tenneco Dr; Huntington Point Dr; Judia Ln; Belknap Pl; Cobleskill Ln; Craddock Dr; Clark Towne Ln; Landcross Dr; Cobbleskill Ln; Hat St; Huntington Dale Dr; W Club Ln; Cook Rd; Dairy Ashford Rd; Huntington Wood Dr.
Other features: Keegans Byu.
Highways in this neighborhood: State Loop 8 (Sam Houston Pkwy, Beltway 8); US Hwy 59 (Southwest Fwy).
Roads and streets: Wilcrest Dr; Bellaire Blvd; S Kirkwood Rd; S Dairy Ashford Rd (S Dairy Ashford St); High Star Dr; Cook Rd; Beechnut St; Bissonnet St; Boone Rd; Carvel Ln; Leawood Blvd; Synott Rd (FM 1876 N); Belle Park Dr; W Bellfort St; Sharpview Dr; Corona Ln; South Dr; Newbrook Dr; Harwin Dr; Shannon Hills Dr; Bexley Dr; Alief Clodine Rd; Stancliff Rd; Plumbrook Dr; Spring Grove Dr; Langdon Ln; Fairpoint Dr; Stroud Dr; Sela Ln; Glenwolde Dr; Bandlon Dr; Sandstone St (Sandstone Rd); Amblewood Dr; Alief Clodine Rd (Alief Rd); Pompano Ln; Hazen St; Plumpoint Dr; Leader St; Triola Ln; Brooklet Dr; Baneway Dr; Belle Glen Dr; Clarewood Dr; Hendon Ln; Longbrook Dr; Lima Dr; Kinghurst St; Riptide Dr; Sharpcrest Ln; Huntington Place Dr; Concho St; Vanderford Dr; Keegan Rd; Evesborough Dr; Westbranch Dr; Herald Square Dr; Creekhurst Dr; Sea Shore Dr; Green Glade Dr; S Course Dr; Rockley Rd; Spice Ln; Huntington Field Dr; Pine Knoll Dr; Ensbrook Dr; Leamont Dr; Moonmist Dr; Dairy View Ln; Huntington Way Dr; Briar Glade Dr; Wildacres Dr; Brookglade Cir; Barrett Brae Dr; Tambourine Dr; Yupon Ridge Dr; Radford Ln; Maplecrest Dr; Dashwood Dr; Montverde Ln; Fallstone Rd; Roark Rd; Mulholland Dr; Brookwulf Dr; Bugle Rd; Larkdale Dr; Landsbury Dr; Wellington Park Dr (Wellington Park); Cliffgate Dr; W 7th St; 5th St; 6th St; Town Park Dr; Riderwood Dr; Troulon Dr; Jetty Ln; Grandvale Dr; Briar Terrace Dr; Huntington Estates Dr; Gladewell Dr; Hunting Briar Dr; Nobility Dr; Lands End Dr; Caddo Lake Ln; Ketchwood Dr; Villawood Ln; Hunting Brook Dr; Willow Beach Dr; Huntington Venture Dr; Grove Glen Dr; Oakcenter Dr; White Cap Ln; Elmsworth Dr; Ashling Dr; Boone Loop Rd; Aqua Ln; Rowan Ln; Kinney Rd; Collingham St; Covey Ln; Beech Cove Ln; Huntington Park Dr; Harold Square Dr; Misty Glen Ln; Rolke Rd; Milfoil Ln; Westwick Dr; Sands Point Dr; Bellerive Dr; Burlingame Dr; Tenneco Dr; N Course Dr; Bellspring Dr; S Briar Bayou Dr; S Glen Dr; Huntington Wood Dr; Universal Dr; Willwood Dr; Huntington Dale Dr; Hornbrook Dr; Bayou Place Dr; Zarroll Dr; Gaby Virbo Dr; Longvine Dr; Huntington Glen Dr; Huntington View Dr; Neff St; Chesswood Dr; Kalewood Dr; Greenway Chase St; Whittingham Ln; Treewater Dr; Avonshire Dr; Verbena Ln; Agarita Ln; Susanna Ln; Roos Rd (Roos Dr); Windmark Dr; Tennis Dr; Valeview Dr; Rogerdale Rd; Rain Lily Ln; Windjammer St; Village Bend Ln; Windward Passage St; Vinedale Dr; Elmcroft Dr; Lewis Dr; Gladefield Dr; S Sharpbill Dr (Sharpbill Dr); Timberway Ln; Acadian Dr; Carruth Ln; F St; L St; H St; J St; D St; Cedar Gap Ln; Alief Village Dr; Campeachy Ln; Court Glen Dr; B St; Leaders Xing Dr; Chapel Hill Dr; Amir St; Sun Meadow Dr; Alpha; Palm Desert Ln; Robinglen Dr; Tanager St; Longcommon Dr; Shiner Ln; Cape Province Dr; Jaguar Dr; Grand Cross Ln; Swan Glen Dr; Berry Limb Dr; Oxford Glen Ln; del Glen Ln; Kindlewood Dr; Adamsborough Dr; Lands Walk Dr; Brookledge Dr; Tenneta Dr; Bellaire Gardens Dr; Apple Glen Ln; Dairy Brook Dr; Havendale Dr; Continental Dr; Barret Brae Dr; Turtlewood Dr; Sashay Dr; Rodeo Square Dr; S Pinesap Dr; Crownwest St; Wirevine Ln; Garden Trail Ct; Braewood Glen Ln; Boone Loop Dr; Sunnyfield Dr; Basilica St; Sherburne Dr; S Greenpark Dr; Firebird Dr; Trompilla Ln; Cinnamon Ln; Summer Glen Ln; E Park West Dr; Winter Glen Ln; Wilde Glen Ln; Turtlewood Ct; Golden Tee Ln; Meadway Dr; W Park West Dr; Intrepid Dr (Intrepid St); Harpers Glen Ln; Knollwest Dr; Autumn Grove Dr; Baynard Dr; E St; G St; Windmark Pl; Brendam Ln; Saulsworth St; Linnhaven Dr; Cheviot Cir; C St; Indian Blanket Ln; Lamprey St; Ashcott Dr; Beckfield Dr; Holworth Dr; Bayou Place Ln; Colebrook Dr; Somerford Dr; Ashkirk Dr; Zircon Ct; Gambit Dr; Wispwind Dr; Emery Dr; Odyssey Ct; Caesar Dr; Pet Worth Dr; Umber Ct; Imperial Point St (Imperial Point Rd); Kinney; Pender Ln; S Court Dr; W Club Ln; Landsbury Ct; Coventry Square Dr; Peach Grove Dr; Chariot Dr; I St; Farmingham Dr; Ainsworth Dr; Windvine Dr; Braysworth Dr; Hollow Glen Ln; Miller Glen Ln; Knotty Glen Ln; Carvel Cir; Bellfair Dr; Regentview Dr; Weststar Ln; Gondola Dr; Wellington Park (Hazlett Dr); Ruscote Ln (Wellington Park); Wellington Park (Ayre Dr); Wellington Park (Scharlet Ln); Carnelian Dr; Crest Lake Dr; Ridgeside Dr; Springcrest Dr; Fairplum Dr; Leaf Glen Ln; Landsbury Cir; Sutters Field Dr; K St; Manor Ct; Newborough Dr; Seaboard Loop W; Wennington Dr; Huntington Point Dr; Twinkle Ct; Seaboard Loop E; Songbrook Dr; Kenwall Dr; Midhurst Dr; Fair Acres St; Twinridge Ln; Alief Pr One Dr; Park Vista Dr; S Briar Knoll Dr; Craddock Dr; Karlwood Ln; Rolling Ridge Dr; State Loop 8; Cook Wind Dr; Mellow Brook Dr; Pagoda Dr; Autumn Leaf Ln; Peach Limb Dr; Cook Glass Dr; Heatherview Dr; S Bayou Knoll Dr; Alief Place Dr; Pacific Pearl St; Pebblestone; Cooksteel Dr; Canda Ln; Cabrina Ln; Trogon Ln; Cherry Limb Dr; Centre Ct; Seaboard Loop; Carnelian Ct; Golden Glen Dr; Garden Estates St; Dawnridge Ln; Shadow Hill Ln; Wellwood Ct; Huntington Crest Dr; Pear Limb Dr; Huntington Wick Dr; Windrow Ln; Huntington Hill Dr; Meadow Pines Dr; Dunfield Ln; Sceptre Cir; Huntington Valley Dr; Canasta Ln; Llama Ln; Camporee Ln; Sun City Ct; Greenway Chase Ct; Sashay; Longvine Ct; Shelton Ct; Canebrake Ln; Meadow Trail Ln; Cookwood Dr; Grantley Dr; Vinewood Ln; Montbrook Dr; Lands End Cir; Tufa Ct; Cinnabar Dr; Kemerton Dr; Celestite Dr; Montford Dr; Golden Tee Ct; Leader Trl; Lansbury Dr; Pagoda; Black Fin Ln; Julliane Ct; Medell St; Unicorn Ln; Westbranch Ct; Nepau Dr; Meadow Pines Ct; Ram Ct; Bayou Place Ct; Landover Ln; Illiad Ct; Wrenwood Cir; Jody Ct; Kirkwood Rd; Windmark Ln; Danielle Ct; Sam Houston Pkwy (State Loop 8); Benmore Dr; Margate Dr; Brookcrest Cir; Leywood Cir; Brooksure Cir; Brookren Cir; Mayridge Cir; Newdale Dr; Starfish Ln; Wallaby Ct; Covey Ct; Richard Arms Cir; Tennis Ct; Autumn Dawn Ln; Newbrook Cir; Two Worlds Ln; Campeachy Cir; N Kitmore Dr; Heathton Dr; Parkvale Dr; Daleside Dr; Bellaire Gardens Trl; Landcross Dr; Blair Meadow Dr; Leawood Ct; Boca Ct; Crown Point Dr; Berry Glen Ln; Petworth Dr; Leading Cir; Shannon Hill Cir.
Other features: Wennington Byu.
Other features: Brays Byu; Keegans Byu.
Alief neighborhood detailed profile
Area: 14.200 square miles
Population: 71,435
Population density:
| Alief: | 5,031 people per square mile |
| Houston: | 3,947 people per square mile |
Median household income in 2021:
| Alief: | $55,743 |
| Houston: | $55,499 |
Median rent in in 2021:
| Alief: | $945 |
| Houston: | $974 |
Male vs Females
| Males: | 35,658 |
| Females: | 35,777 |
Median age
| Males: | 35.1 years |
| Females: | 35.5 years |
Average estimated value of detached houses in 2021 (55.4% of all units):
| Alief: | $156,815 |
| Houston: | $304,685 |
Most popular occupations of males: service occupations (21.6%); construction, extraction, and maintenance occupations (18.2%); sales and office occupations (13.5%); production occupations (9.2%); material moving occupations (7.9%); transportation occupations (6.0%); management occupations (except farmers) (5.8%)
Most popular occupations of females: service occupations (44.8%); sales and office occupations (29.0%); healthcare practitioners and technical occupations (7.9%); material moving occupations (4.2%); education, training, and library occupations (3.7%); management occupations (except farmers) (3.6%); transportation occupations (2.2%)
Roads and streets: W Bellfort Ave; Huntington Venture Dr; Synott Rd (FM 1876, N Eldridge St); Huntington Estates Dr; Sue Ln; Webb Ln; Crow Valley Ln; Club Ln; Tenneco Dr; Huntington Point Dr; Judia Ln; Belknap Pl; Cobleskill Ln; Craddock Dr; Clark Towne Ln; Landcross Dr; Cobbleskill Ln; Hat St; Huntington Dale Dr; W Club Ln; Cook Rd; Dairy Ashford Rd; Huntington Wood Dr.
Other features: Keegans Byu.
Highways in this neighborhood: State Loop 8 (Sam Houston Pkwy, Beltway 8); US Hwy 59 (Southwest Fwy).
Roads and streets: Wilcrest Dr; Bellaire Blvd; S Kirkwood Rd; S Dairy Ashford Rd (S Dairy Ashford St); High Star Dr; Cook Rd; Beechnut St; Bissonnet St; Boone Rd; Carvel Ln; Leawood Blvd; Synott Rd (FM 1876 N); Belle Park Dr; W Bellfort St; Sharpview Dr; Corona Ln; South Dr; Newbrook Dr; Harwin Dr; Shannon Hills Dr; Bexley Dr; Alief Clodine Rd; Stancliff Rd; Plumbrook Dr; Spring Grove Dr; Langdon Ln; Fairpoint Dr; Stroud Dr; Sela Ln; Glenwolde Dr; Bandlon Dr; Sandstone St (Sandstone Rd); Amblewood Dr; Alief Clodine Rd (Alief Rd); Pompano Ln; Hazen St; Plumpoint Dr; Leader St; Triola Ln; Brooklet Dr; Baneway Dr; Belle Glen Dr; Clarewood Dr; Hendon Ln; Longbrook Dr; Lima Dr; Kinghurst St; Riptide Dr; Sharpcrest Ln; Huntington Place Dr; Concho St; Vanderford Dr; Keegan Rd; Evesborough Dr; Westbranch Dr; Herald Square Dr; Creekhurst Dr; Sea Shore Dr; Green Glade Dr; S Course Dr; Rockley Rd; Spice Ln; Huntington Field Dr; Pine Knoll Dr; Ensbrook Dr; Leamont Dr; Moonmist Dr; Dairy View Ln; Huntington Way Dr; Briar Glade Dr; Wildacres Dr; Brookglade Cir; Barrett Brae Dr; Tambourine Dr; Yupon Ridge Dr; Radford Ln; Maplecrest Dr; Dashwood Dr; Montverde Ln; Fallstone Rd; Roark Rd; Mulholland Dr; Brookwulf Dr; Bugle Rd; Larkdale Dr; Landsbury Dr; Wellington Park Dr (Wellington Park); Cliffgate Dr; W 7th St; 5th St; 6th St; Town Park Dr; Riderwood Dr; Troulon Dr; Jetty Ln; Grandvale Dr; Briar Terrace Dr; Huntington Estates Dr; Gladewell Dr; Hunting Briar Dr; Nobility Dr; Lands End Dr; Caddo Lake Ln; Ketchwood Dr; Villawood Ln; Hunting Brook Dr; Willow Beach Dr; Huntington Venture Dr; Grove Glen Dr; Oakcenter Dr; White Cap Ln; Elmsworth Dr; Ashling Dr; Boone Loop Rd; Aqua Ln; Rowan Ln; Kinney Rd; Collingham St; Covey Ln; Beech Cove Ln; Huntington Park Dr; Harold Square Dr; Misty Glen Ln; Rolke Rd; Milfoil Ln; Westwick Dr; Sands Point Dr; Bellerive Dr; Burlingame Dr; Tenneco Dr; N Course Dr; Bellspring Dr; S Briar Bayou Dr; S Glen Dr; Huntington Wood Dr; Universal Dr; Willwood Dr; Huntington Dale Dr; Hornbrook Dr; Bayou Place Dr; Zarroll Dr; Gaby Virbo Dr; Longvine Dr; Huntington Glen Dr; Huntington View Dr; Neff St; Chesswood Dr; Kalewood Dr; Greenway Chase St; Whittingham Ln; Treewater Dr; Avonshire Dr; Verbena Ln; Agarita Ln; Susanna Ln; Roos Rd (Roos Dr); Windmark Dr; Tennis Dr; Valeview Dr; Rogerdale Rd; Rain Lily Ln; Windjammer St; Village Bend Ln; Windward Passage St; Vinedale Dr; Elmcroft Dr; Lewis Dr; Gladefield Dr; S Sharpbill Dr (Sharpbill Dr); Timberway Ln; Acadian Dr; Carruth Ln; F St; L St; H St; J St; D St; Cedar Gap Ln; Alief Village Dr; Campeachy Ln; Court Glen Dr; B St; Leaders Xing Dr; Chapel Hill Dr; Amir St; Sun Meadow Dr; Alpha; Palm Desert Ln; Robinglen Dr; Tanager St; Longcommon Dr; Shiner Ln; Cape Province Dr; Jaguar Dr; Grand Cross Ln; Swan Glen Dr; Berry Limb Dr; Oxford Glen Ln; del Glen Ln; Kindlewood Dr; Adamsborough Dr; Lands Walk Dr; Brookledge Dr; Tenneta Dr; Bellaire Gardens Dr; Apple Glen Ln; Dairy Brook Dr; Havendale Dr; Continental Dr; Barret Brae Dr; Turtlewood Dr; Sashay Dr; Rodeo Square Dr; S Pinesap Dr; Crownwest St; Wirevine Ln; Garden Trail Ct; Braewood Glen Ln; Boone Loop Dr; Sunnyfield Dr; Basilica St; Sherburne Dr; S Greenpark Dr; Firebird Dr; Trompilla Ln; Cinnamon Ln; Summer Glen Ln; E Park West Dr; Winter Glen Ln; Wilde Glen Ln; Turtlewood Ct; Golden Tee Ln; Meadway Dr; W Park West Dr; Intrepid Dr (Intrepid St); Harpers Glen Ln; Knollwest Dr; Autumn Grove Dr; Baynard Dr; E St; G St; Windmark Pl; Brendam Ln; Saulsworth St; Linnhaven Dr; Cheviot Cir; C St; Indian Blanket Ln; Lamprey St; Ashcott Dr; Beckfield Dr; Holworth Dr; Bayou Place Ln; Colebrook Dr; Somerford Dr; Ashkirk Dr; Zircon Ct; Gambit Dr; Wispwind Dr; Emery Dr; Odyssey Ct; Caesar Dr; Pet Worth Dr; Umber Ct; Imperial Point St (Imperial Point Rd); Kinney; Pender Ln; S Court Dr; W Club Ln; Landsbury Ct; Coventry Square Dr; Peach Grove Dr; Chariot Dr; I St; Farmingham Dr; Ainsworth Dr; Windvine Dr; Braysworth Dr; Hollow Glen Ln; Miller Glen Ln; Knotty Glen Ln; Carvel Cir; Bellfair Dr; Regentview Dr; Weststar Ln; Gondola Dr; Wellington Park (Hazlett Dr); Ruscote Ln (Wellington Park); Wellington Park (Ayre Dr); Wellington Park (Scharlet Ln); Carnelian Dr; Crest Lake Dr; Ridgeside Dr; Springcrest Dr; Fairplum Dr; Leaf Glen Ln; Landsbury Cir; Sutters Field Dr; K St; Manor Ct; Newborough Dr; Seaboard Loop W; Wennington Dr; Huntington Point Dr; Twinkle Ct; Seaboard Loop E; Songbrook Dr; Kenwall Dr; Midhurst Dr; Fair Acres St; Twinridge Ln; Alief Pr One Dr; Park Vista Dr; S Briar Knoll Dr; Craddock Dr; Karlwood Ln; Rolling Ridge Dr; State Loop 8; Cook Wind Dr; Mellow Brook Dr; Pagoda Dr; Autumn Leaf Ln; Peach Limb Dr; Cook Glass Dr; Heatherview Dr; S Bayou Knoll Dr; Alief Place Dr; Pacific Pearl St; Pebblestone; Cooksteel Dr; Canda Ln; Cabrina Ln; Trogon Ln; Cherry Limb Dr; Centre Ct; Seaboard Loop; Carnelian Ct; Golden Glen Dr; Garden Estates St; Dawnridge Ln; Shadow Hill Ln; Wellwood Ct; Huntington Crest Dr; Pear Limb Dr; Huntington Wick Dr; Windrow Ln; Huntington Hill Dr; Meadow Pines Dr; Dunfield Ln; Sceptre Cir; Huntington Valley Dr; Canasta Ln; Llama Ln; Camporee Ln; Sun City Ct; Greenway Chase Ct; Sashay; Longvine Ct; Shelton Ct; Canebrake Ln; Meadow Trail Ln; Cookwood Dr; Grantley Dr; Vinewood Ln; Montbrook Dr; Lands End Cir; Tufa Ct; Cinnabar Dr; Kemerton Dr; Celestite Dr; Montford Dr; Golden Tee Ct; Leader Trl; Lansbury Dr; Pagoda; Black Fin Ln; Julliane Ct; Medell St; Unicorn Ln; Westbranch Ct; Nepau Dr; Meadow Pines Ct; Ram Ct; Bayou Place Ct; Landover Ln; Illiad Ct; Wrenwood Cir; Jody Ct; Kirkwood Rd; Windmark Ln; Danielle Ct; Sam Houston Pkwy (State Loop 8); Benmore Dr; Margate Dr; Brookcrest Cir; Leywood Cir; Brooksure Cir; Brookren Cir; Mayridge Cir; Newdale Dr; Starfish Ln; Wallaby Ct; Covey Ct; Richard Arms Cir; Tennis Ct; Autumn Dawn Ln; Newbrook Cir; Two Worlds Ln; Campeachy Cir; N Kitmore Dr; Heathton Dr; Parkvale Dr; Daleside Dr; Bellaire Gardens Trl; Landcross Dr; Blair Meadow Dr; Leawood Ct; Boca Ct; Crown Point Dr; Berry Glen Ln; Petworth Dr; Leading Cir; Shannon Hill Cir.
Other features: Wennington Byu.
Other features: Brays Byu; Keegans Byu.
Alief neighborhood detailed profile
Allendale neighborhood in Houston statistics: (Find on map)
Area: 6.974 square miles
Population: 24,545
Population density:
Median household income in 2021:
Median rent in in 2021:
Male vs Females
Median age
Housing prices:
Average estimated value of detached houses in 2021 (70.9% of all units):
Average estimated value of townhouses or other attached units in 2021 (2.9% of all units):
Average estimated '21 value of housing units in 5-or-more-unit structures (10.6% of all units):
Most popular occupations of males: construction, extraction, and maintenance occupations (25.3%); production occupations (13.8%); service occupations (13.3%); sales and office occupations (11.8%); material moving occupations (8.3%); transportation occupations (7.7%); management occupations (except farmers) (2.5%)
Most popular occupations of females: sales and office occupations (28.6%); service occupations (24.0%); education, training, and library occupations (8.7%); production occupations (8.0%); business and financial operations occupations (7.7%); healthcare practitioners and technical occupations (6.1%); management occupations (except farmers) (5.6%)
Limited-access highways (interstate or state) in this neighborhood: I- 45 (Gulf Fwy).
Highways in this neighborhood: State Hwy 225 (la Porte Fwy); Monroe Rd (State Hwy 3).
Roads and streets: Allen-Genoa Rd; Howard Dr; Winkler Dr; Lawndale St; Forest Oaks Blvd; Galveston Rd; Allendale Rd; Oriole St; Ahrens St; el Buey Way; Richey St (S Richey Ave, S Richey St); Laurel Creek Way; Flagstone Ter; Berry Creek Dr; Easthaven Blvd; Barkley St; Scarborough Ln; Goodyear Dr; Timbercreek Dr; Garland St; Glenview Dr; Steelman St; Wier Dr; Woodbine St; Lenore St; Maroby St; Meadow Creek Ln; Canniff Rd; Ogilvie St; Turtle Creek Rd; Elrod St; Bonner Dr; Ruell St; Loper St; Christine St; Gober St; Winding Creek Way; Sweetbriar St; Axilda St; Falvey St; Arizona St; Bliss St; Brookglen Dr; Sieber Dr; Cripple Creek Dr; Lucore St; Wynbelts Dr; Queens St; Neal St; Foreman St; Wood Creek Way; Carsondale St; Bendell Dr; Vinett St; Radcliffe St; Starling St; Woodlark St; Alaska St; Primrose St; Straight Creek Dr; la Porte Svc Rd (State Hwy 225); Canniff St; Aubert St; Oak Meadows St; N Bayou Dr; Starmount Blvd; Milredge St; Firefly St; Buxton St; Shamrock St; Juliabora St; Rosa Allen St; W Southmore Ave; Baker Dr; Nightingale Dr; Whispering Creek Way; Michael Dr; Albright Dr; E Villa St; Bobolink; Martinville Dr; Berry Brook Dr; Surrey Square St; Bracknell; Clubhouse Ln; Light Company Rd; Peach Creek Dr; Orchid St; Kolb Rd; Simscrest; Mosley Rd; Evonne St; Branum St; Possum Creek Rd; Fern Creek Ln; Tallyho Rd; Allen St; Willow Creek Way; Cripple Creek Ct; S Crooked Creek Dr; Sleepy Creek Dr; Santa Bernadetta; N Crooked Creek Dr; N Shady Creek Dr; Silver Creek Dr; Meadowbrook Dr; Cherry Creek Dr; Ratama St; Spring Creek Ln; Lamina Ln; San Alberto; S Shady Creek Dr; Choate Cir; Leprechaun St; Linden Creek Ln; Monroe Pr Seven Dr; Coral Creek Dr; Ferndale; Shield St; Santo Domingo; Lantana St; Seagull St; Park Place Blvd; College St; Chalcos Dr; Patio Dr; Mayo Ave; Mosa Creek Ct; Apple Creek Rd; Enfield Dr; Deeda Dr; Bracknell St; Bellnole Dr; Shaw; Genoa Rd; Ford; Dodge; Monroe Pr One; French Creek Dr; Bosworth St; San Bonifacio; Cripple Brook Ct; Monroe Pr One Dr; Berrydale St; Sweetbriar; Turin; Santa Cecilla Ln (Santa Cecilia Ln); Walnut Creek Dr; Bonn Echo St; San Lorenzo; Monroe Pr Four Dr; Park Ln; Lazy Creek Ln; Garland Dr; Toni Ave; Meadowlark; Oak Creek Dr; Trail Creek Dr; Crenshaw St; Lurlene St; Monroe Pr Eight Dr; Monroe Pr Two Dr; Prosperity; N Shady Creek Ct; Webb Dr; Wayman; Pine Creek Ct; Main St; Monroe Pr Six Dr; Chia St; Shadow Creek Dr; State St; Aubert; Oleander Ct; Azalea Ct; Schury Ln; Crepe Myrtle St; Berryhill Ct; San Blas; Quail; Wood Creek Ct; Monroe Pr Five Dr; Berry Creek Ct; Jordan St; Orchid.
Railroad features: Southern Pacific RR; Union Pacific RR.
Other features: Berry Byu; Berry Crk; Sims Byu.
Allendale neighborhood detailed profile
Area: 6.974 square miles
Population: 24,545
Population density:
| Allendale (Meadowbrook): | 3,520 people per square mile |
| Houston: | 3,947 people per square mile |
Median household income in 2021:
| Allendale (Meadowbrook): | $64,684 |
| Houston: | $55,499 |
Median rent in in 2021:
| Allendale (Meadowbrook): | $918 |
| Houston: | $974 |
Male vs Females
| Males: | 12,806 |
| Females: | 11,739 |
Median age
| Males: | 30.8 years |
| Females: | 35.0 years |
Housing prices:
Average estimated value of detached houses in 2021 (70.9% of all units):
| Allendale (Meadowbrook): | $130,851 |
| Houston: | $304,685 |
Average estimated value of townhouses or other attached units in 2021 (2.9% of all units):
| This neighborhood: | $112,318 |
| city: | $305,463 |
Average estimated '21 value of housing units in 5-or-more-unit structures (10.6% of all units):
| Allendale (Meadowbrook): | $40,303 |
| Houston: | $227,414 |
Most popular occupations of males: construction, extraction, and maintenance occupations (25.3%); production occupations (13.8%); service occupations (13.3%); sales and office occupations (11.8%); material moving occupations (8.3%); transportation occupations (7.7%); management occupations (except farmers) (2.5%)
Most popular occupations of females: sales and office occupations (28.6%); service occupations (24.0%); education, training, and library occupations (8.7%); production occupations (8.0%); business and financial operations occupations (7.7%); healthcare practitioners and technical occupations (6.1%); management occupations (except farmers) (5.6%)
Limited-access highways (interstate or state) in this neighborhood: I- 45 (Gulf Fwy).
Highways in this neighborhood: State Hwy 225 (la Porte Fwy); Monroe Rd (State Hwy 3).
Roads and streets: Allen-Genoa Rd; Howard Dr; Winkler Dr; Lawndale St; Forest Oaks Blvd; Galveston Rd; Allendale Rd; Oriole St; Ahrens St; el Buey Way; Richey St (S Richey Ave, S Richey St); Laurel Creek Way; Flagstone Ter; Berry Creek Dr; Easthaven Blvd; Barkley St; Scarborough Ln; Goodyear Dr; Timbercreek Dr; Garland St; Glenview Dr; Steelman St; Wier Dr; Woodbine St; Lenore St; Maroby St; Meadow Creek Ln; Canniff Rd; Ogilvie St; Turtle Creek Rd; Elrod St; Bonner Dr; Ruell St; Loper St; Christine St; Gober St; Winding Creek Way; Sweetbriar St; Axilda St; Falvey St; Arizona St; Bliss St; Brookglen Dr; Sieber Dr; Cripple Creek Dr; Lucore St; Wynbelts Dr; Queens St; Neal St; Foreman St; Wood Creek Way; Carsondale St; Bendell Dr; Vinett St; Radcliffe St; Starling St; Woodlark St; Alaska St; Primrose St; Straight Creek Dr; la Porte Svc Rd (State Hwy 225); Canniff St; Aubert St; Oak Meadows St; N Bayou Dr; Starmount Blvd; Milredge St; Firefly St; Buxton St; Shamrock St; Juliabora St; Rosa Allen St; W Southmore Ave; Baker Dr; Nightingale Dr; Whispering Creek Way; Michael Dr; Albright Dr; E Villa St; Bobolink; Martinville Dr; Berry Brook Dr; Surrey Square St; Bracknell; Clubhouse Ln; Light Company Rd; Peach Creek Dr; Orchid St; Kolb Rd; Simscrest; Mosley Rd; Evonne St; Branum St; Possum Creek Rd; Fern Creek Ln; Tallyho Rd; Allen St; Willow Creek Way; Cripple Creek Ct; S Crooked Creek Dr; Sleepy Creek Dr; Santa Bernadetta; N Crooked Creek Dr; N Shady Creek Dr; Silver Creek Dr; Meadowbrook Dr; Cherry Creek Dr; Ratama St; Spring Creek Ln; Lamina Ln; San Alberto; S Shady Creek Dr; Choate Cir; Leprechaun St; Linden Creek Ln; Monroe Pr Seven Dr; Coral Creek Dr; Ferndale; Shield St; Santo Domingo; Lantana St; Seagull St; Park Place Blvd; College St; Chalcos Dr; Patio Dr; Mayo Ave; Mosa Creek Ct; Apple Creek Rd; Enfield Dr; Deeda Dr; Bracknell St; Bellnole Dr; Shaw; Genoa Rd; Ford; Dodge; Monroe Pr One; French Creek Dr; Bosworth St; San Bonifacio; Cripple Brook Ct; Monroe Pr One Dr; Berrydale St; Sweetbriar; Turin; Santa Cecilla Ln (Santa Cecilia Ln); Walnut Creek Dr; Bonn Echo St; San Lorenzo; Monroe Pr Four Dr; Park Ln; Lazy Creek Ln; Garland Dr; Toni Ave; Meadowlark; Oak Creek Dr; Trail Creek Dr; Crenshaw St; Lurlene St; Monroe Pr Eight Dr; Monroe Pr Two Dr; Prosperity; N Shady Creek Ct; Webb Dr; Wayman; Pine Creek Ct; Main St; Monroe Pr Six Dr; Chia St; Shadow Creek Dr; State St; Aubert; Oleander Ct; Azalea Ct; Schury Ln; Crepe Myrtle St; Berryhill Ct; San Blas; Quail; Wood Creek Ct; Monroe Pr Five Dr; Berry Creek Ct; Jordan St; Orchid.
Railroad features: Southern Pacific RR; Union Pacific RR.
Other features: Berry Byu; Berry Crk; Sims Byu.
Allendale neighborhood detailed profile
Astrodome neighborhood in Houston statistics: (Find on map)
Area: 3.303 square miles
Population: 12,927
Population density:
Median household income in 2021:
Median rent in in 2021:
Male vs Females
Median age
Average estimated value of detached houses in 2021 (60.5% of all units):
Most popular occupations of males: management occupations (except farmers) (19.7%); sales and office occupations (19.4%); service occupations (10.3%); education, training, and library occupations (7.6%); production occupations (7.6%); transportation occupations (6.3%); material moving occupations (5.9%)
Most popular occupations of females: sales and office occupations (33.6%); healthcare practitioners and technical occupations (21.2%); service occupations (19.8%); education, training, and library occupations (8.8%); material moving occupations (7.9%); computer and mathematical occupations (4.5%); management occupations (except farmers) (4.0%)
Limited-access highways (interstate or state) in this neighborhood: I- 610 (S Loop Fwy).
Highways in this neighborhood: Old Spanish Trl (US Hwy 90 Alt); State Hwy 288 (South Fwy).
Roads and streets: Almeda Rd (FM 521); Holly Hall St; Fannin St; Cambridge St; Knight Rd; Ardmore St; Holmes Rd; N Stadium Dr; Naomi St; E Almeda Rd; S Braeswood Blvd; el Paseo St; Corder St; Engelmohr St; Hepburn St; Greenbriar St; Sarah St (Sarah Ave); el Rio St; el Mundo St; Grand Blvd; Alice St; Pawnee; Magnet St; el Camino St; Yellowstone Blvd; la Concha Ln; Mansard St; Brollier St; Enoch; Phoenix Dr; Dupree St; Main St (S Main St); Braewood Park Dr; Cayuga St; Kirby Dr; Myrtle; Fall St; Charline; Holt St; N Braeswood Blvd; Colonnade Dr; Alice; S Freeway Fwy; David St; Virginia St; Northeast Dr; Corder; Lydia St; S David; David.
Railroad features: Houston Belt and Terminal Rlwy; Union Pacific RR; Southern Pacific RR.
Other features: Brays Byu.
Astrodome neighborhood detailed profile
Area: 3.303 square miles
Population: 12,927
Population density:
| Astrodome: | 3,913 people per square mile |
| Houston: | 3,947 people per square mile |
Median household income in 2021:
| Astrodome: | $35,135 |
| Houston: | $55,499 |
Median rent in in 2021:
| Astrodome: | $626 |
| Houston: | $974 |
Male vs Females
| Males: | 6,005 |
| Females: | 6,921 |
Median age
| Males: | 45.7 years |
| Females: | 47.4 years |
Average estimated value of detached houses in 2021 (60.5% of all units):
| Astrodome: | $99,703 |
| Houston: | $304,685 |
Most popular occupations of males: management occupations (except farmers) (19.7%); sales and office occupations (19.4%); service occupations (10.3%); education, training, and library occupations (7.6%); production occupations (7.6%); transportation occupations (6.3%); material moving occupations (5.9%)
Most popular occupations of females: sales and office occupations (33.6%); healthcare practitioners and technical occupations (21.2%); service occupations (19.8%); education, training, and library occupations (8.8%); material moving occupations (7.9%); computer and mathematical occupations (4.5%); management occupations (except farmers) (4.0%)
Limited-access highways (interstate or state) in this neighborhood: I- 610 (S Loop Fwy).
Highways in this neighborhood: Old Spanish Trl (US Hwy 90 Alt); State Hwy 288 (South Fwy).
Roads and streets: Almeda Rd (FM 521); Holly Hall St; Fannin St; Cambridge St; Knight Rd; Ardmore St; Holmes Rd; N Stadium Dr; Naomi St; E Almeda Rd; S Braeswood Blvd; el Paseo St; Corder St; Engelmohr St; Hepburn St; Greenbriar St; Sarah St (Sarah Ave); el Rio St; el Mundo St; Grand Blvd; Alice St; Pawnee; Magnet St; el Camino St; Yellowstone Blvd; la Concha Ln; Mansard St; Brollier St; Enoch; Phoenix Dr; Dupree St; Main St (S Main St); Braewood Park Dr; Cayuga St; Kirby Dr; Myrtle; Fall St; Charline; Holt St; N Braeswood Blvd; Colonnade Dr; Alice; S Freeway Fwy; David St; Virginia St; Northeast Dr; Corder; Lydia St; S David; David.
Railroad features: Houston Belt and Terminal Rlwy; Union Pacific RR; Southern Pacific RR.
Other features: Brays Byu.
Astrodome neighborhood detailed profile
Belle Court neighborhood in Houston statistics: (Find on map)
Area: 0.081 square miles
Population: 460
Population density:
Median household income in 2021:
Median rent in in 2021:
Male vs Females
Median age
Housing prices:
Average estimated value of detached houses in 2021 (94.3% of all units):
Average estimated value of townhouses or other attached units in 2021 (5.2% of all units):
Most popular occupations of males: management occupations (except farmers) (35.3%); architecture and engineering occupations (26.3%); business and financial operations occupations (10.7%); service occupations (10.6%); arts, design, entertainment, sports, and media occupations (10.3%); education, training, and library occupations (8.9%); life, physical, and social science occupations (8.5%)
Most popular occupations of females: healthcare practitioners and technical occupations (35.0%); sales and office occupations (22.4%); education, training, and library occupations (16.1%); legal occupations (15.7%); community and social services occupations (7.2%); management occupations (except farmers) (6.1%); arts, design, entertainment, sports, and media occupations (4.5%)
Roads and streets: Kirby Dr; Annapolis St; Werlein St; Cason St; Arbuckle St; Centenary St; Talbott St.
Belle Court neighborhood detailed profile
Area: 0.081 square miles
Population: 460
Population density:
| Belle Court: | 5,681 people per square mile |
| Houston: | 3,947 people per square mile |
Median household income in 2021:
| Belle Court: | $250,001 |
| Houston: | $55,499 |
Median rent in in 2021:
| Belle Court: | $3,501 |
| Houston: | $974 |
Male vs Females
| Males: | 198 |
| Females: | 262 |
Median age
| Males: | 57.1 years |
| Females: | 38.9 years |
Housing prices:
Average estimated value of detached houses in 2021 (94.3% of all units):
| Belle Court: | $1,528,821 |
| Houston: | $304,685 |
Average estimated value of townhouses or other attached units in 2021 (5.2% of all units):
| This neighborhood: | $418,246 |
| city: | $305,463 |
Most popular occupations of males: management occupations (except farmers) (35.3%); architecture and engineering occupations (26.3%); business and financial operations occupations (10.7%); service occupations (10.6%); arts, design, entertainment, sports, and media occupations (10.3%); education, training, and library occupations (8.9%); life, physical, and social science occupations (8.5%)
Most popular occupations of females: healthcare practitioners and technical occupations (35.0%); sales and office occupations (22.4%); education, training, and library occupations (16.1%); legal occupations (15.7%); community and social services occupations (7.2%); management occupations (except farmers) (6.1%); arts, design, entertainment, sports, and media occupations (4.5%)
Roads and streets: Kirby Dr; Annapolis St; Werlein St; Cason St; Arbuckle St; Centenary St; Talbott St.
Belle Court neighborhood detailed profile
Binz neighborhood in Houston statistics: (Find on map)
Area: 0.675 square miles
Highways in this neighborhood: Southwest Fwy (US Hwy 59); State Hwy 288 (South Fwy).
Roads and streets: Almeda Rd; Ewing St; la Branch St; Binz St; Calumet St; Austin St; Southmore Blvd; Oakdale St; Caroline St; Crawford St; Wichita St; Jackson St; Rosedale St; San Jacinto St; Prospect St; Blodgett St; Fannin St; Chenevert St; Palm St; Wentworth St; Main St; Ruth St; Rosewood St; Wheeler St; Arbor Pl; Chartres St; Arbor St; Barbee St; Wentworth Ave (Wentworth St); Eagle St; Riverside Dr; Hermann Dr; Calumet; Cleburne St; S Freeway Fwy; Crawford; Caroline.
Binz neighborhood detailed profile
Braeburn neighborhood in Houston statistics: (Find on map)
Area: 2.530 square miles
Population: 7,327
Population density:
Median household income in 2021:
Median rent in in 2021:
Male vs Females
Median age
Housing prices:
Average estimated value of detached houses in 2021 (13.7% of all units):
Average estimated value of townhouses or other attached units in 2021 (8.9% of all units):
Average estimated '21 value of housing units in 5-or-more-unit structures (15.0% of all units):
Most popular occupations of males: construction, extraction, and maintenance occupations (34.4%); service occupations (28.8%); transportation occupations (8.2%); sales and office occupations (6.0%); business and financial operations occupations (4.7%); education, training, and library occupations (3.1%); management occupations (except farmers) (3.0%)
Most popular occupations of females: service occupations (46.4%); sales and office occupations (25.6%); production occupations (6.0%); education, training, and library occupations (5.6%); material moving occupations (4.9%); healthcare practitioners and technical occupations (4.0%); computer and mathematical occupations (3.1%)
Highways in this neighborhood: US Hwy 59 (Southwest Fwy); Hov US 59 (US Hwy 59).
Roads and streets: Bissonnet St; Jason St; Birdwood Rd; Ariel St; Grape St; Reamer St; Imogene St; S Gessner Dr; Braeburn Valley Dr; Hillcroft St (Hillcroft Ave); Dunlap St; Braeburn Glen Blvd; Braewick Dr; Carew St; Shadow Crest St; Wateka Dr; Fondren Rd; Beechnut St; Jackwood St; Indigo St; Brae Acres Rd; Bob White Dr; Nairn St; Wanda Ln; Lugary Dr; Valley View Ln; Mc Avoy Dr; Darnell St; Cypress St; Braes Bayou Dr; Cadawac Rd; Sandpiper Dr; N Braeswood Blvd; Braeswood Blvd; Mahoning Dr; Robindell Dr; Bonhomme Rd; Bintliff Dr; Braes River Dr; Kuldell Dr; Maple St; Wednesbury Ln; Mockingbird Cir; Tanager St; Oldhaven St; Altamont Dr; Tybor Dr; Holly St; Kennard Dr; Narin; Troulon Dr; Tree Frog Dr; Sangamon Ln; Wateka Cir; Osage; Cantrell; Rue Cambon St; Pipestone St; Rue Carre St; Imogene; S Braeswood Blvd; Marinette Dr; Carlota Ct; Rue Chablis St; Bonhomme; Albacore Dr; Brae Acres Ct; Albury Dr; Grape Rd; Rue Crillon St; Camargo Ct; Killarney Ct; Ariel; Glenfield Ct; Rue Saint Cyr St; Crillon; Hideway Cir.
Other features: Brays Byu; Keegans Byu.
Braeburn neighborhood detailed profile
Area: 2.530 square miles
Population: 7,327
Population density:
| Braeburn (Braeburn Valley): | 2,896 people per square mile |
| Houston: | 3,947 people per square mile |
Median household income in 2021:
| Braeburn (Braeburn Valley): | $71,093 |
| Houston: | $55,499 |
Median rent in in 2021:
| Braeburn (Braeburn Valley): | $730 |
| Houston: | $974 |
Male vs Females
| Males: | 3,172 |
| Females: | 4,155 |
Median age
| Males: | 38.5 years |
| Females: | 36.3 years |
Housing prices:
Average estimated value of detached houses in 2021 (13.7% of all units):
| Braeburn (Braeburn Valley): | $391,045 |
| Houston: | $304,685 |
Average estimated value of townhouses or other attached units in 2021 (8.9% of all units):
| This neighborhood: | $104,944 |
| city: | $305,463 |
Average estimated '21 value of housing units in 5-or-more-unit structures (15.0% of all units):
| Braeburn (Braeburn Valley): | $52,099 |
| Houston: | $227,414 |
Most popular occupations of males: construction, extraction, and maintenance occupations (34.4%); service occupations (28.8%); transportation occupations (8.2%); sales and office occupations (6.0%); business and financial operations occupations (4.7%); education, training, and library occupations (3.1%); management occupations (except farmers) (3.0%)
Most popular occupations of females: service occupations (46.4%); sales and office occupations (25.6%); production occupations (6.0%); education, training, and library occupations (5.6%); material moving occupations (4.9%); healthcare practitioners and technical occupations (4.0%); computer and mathematical occupations (3.1%)
Highways in this neighborhood: US Hwy 59 (Southwest Fwy); Hov US 59 (US Hwy 59).
Roads and streets: Bissonnet St; Jason St; Birdwood Rd; Ariel St; Grape St; Reamer St; Imogene St; S Gessner Dr; Braeburn Valley Dr; Hillcroft St (Hillcroft Ave); Dunlap St; Braeburn Glen Blvd; Braewick Dr; Carew St; Shadow Crest St; Wateka Dr; Fondren Rd; Beechnut St; Jackwood St; Indigo St; Brae Acres Rd; Bob White Dr; Nairn St; Wanda Ln; Lugary Dr; Valley View Ln; Mc Avoy Dr; Darnell St; Cypress St; Braes Bayou Dr; Cadawac Rd; Sandpiper Dr; N Braeswood Blvd; Braeswood Blvd; Mahoning Dr; Robindell Dr; Bonhomme Rd; Bintliff Dr; Braes River Dr; Kuldell Dr; Maple St; Wednesbury Ln; Mockingbird Cir; Tanager St; Oldhaven St; Altamont Dr; Tybor Dr; Holly St; Kennard Dr; Narin; Troulon Dr; Tree Frog Dr; Sangamon Ln; Wateka Cir; Osage; Cantrell; Rue Cambon St; Pipestone St; Rue Carre St; Imogene; S Braeswood Blvd; Marinette Dr; Carlota Ct; Rue Chablis St; Bonhomme; Albacore Dr; Brae Acres Ct; Albury Dr; Grape Rd; Rue Crillon St; Camargo Ct; Killarney Ct; Ariel; Glenfield Ct; Rue Saint Cyr St; Crillon; Hideway Cir.
Other features: Brays Byu; Keegans Byu.
Braeburn neighborhood detailed profile
Braesview Terrace neighborhood in Houston statistics: (Find on map)
Area: 1.034 square miles
Population: 4,281
Population density:
Median household income in 2021:
Median rent in in 2021:
Male vs Females
Median age
Average estimated value of detached houses in 2021 (99.8% of all units):
Most popular occupations of males: management occupations (except farmers) (20.7%); healthcare practitioners and technical occupations (19.1%); sales and office occupations (17.6%); education, training, and library occupations (7.7%); legal occupations (7.0%); business and financial operations occupations (6.0%); architecture and engineering occupations (6.0%)
Most popular occupations of females: healthcare practitioners and technical occupations (26.6%); management occupations (except farmers) (14.6%); sales and office occupations (13.9%); education, training, and library occupations (13.0%); business and financial operations occupations (7.9%); service occupations (6.9%); legal occupations (6.1%)
Roads and streets: Chimney Rock Rd; S Rice Ave; N Braeswood Blvd; Jason St; Maple St; Braesmont Dr; Indigo St; Ferris Dr; Beechnut St; Jackwood St; Grape St (Grape Rd); Darnell St; Carew St; Birdwood Rd; Braesvalley Dr; Loch Lomond Dr; Imogene St; S Atwell Dr; Mimosa Dr; Prichett Dr; Manhattan Dr; Caversham Dr; Ariel St; Edith St; Moonlight Dr; Burdine St; Wallington Dr; Loch Lomond Ct.
Other features: Brays Byu.
Braesview Terrace neighborhood detailed profile
Area: 1.034 square miles
Population: 4,281
Population density:
| Braesview Terrace (Braesview Terrace/Braesmont Addition): | 4,142 people per square mile |
| Houston: | 3,947 people per square mile |
Median household income in 2021:
| Braesview Terrace (Braesview Terrace/Braesmont Addition): | $201,549 |
| Houston: | $55,499 |
Median rent in in 2021:
| Braesview Terrace (Braesview Terrace/Braesmont Addition): | $3,261 |
| Houston: | $974 |
Male vs Females
| Males: | 2,162 |
| Females: | 2,118 |
Median age
| Males: | 42.7 years |
| Females: | 44.6 years |
Average estimated value of detached houses in 2021 (99.8% of all units):
| Braesview Terrace (Braesview Terrace/Braesmont Addition): | $700,638 |
| Houston: | $304,685 |
Most popular occupations of males: management occupations (except farmers) (20.7%); healthcare practitioners and technical occupations (19.1%); sales and office occupations (17.6%); education, training, and library occupations (7.7%); legal occupations (7.0%); business and financial operations occupations (6.0%); architecture and engineering occupations (6.0%)
Most popular occupations of females: healthcare practitioners and technical occupations (26.6%); management occupations (except farmers) (14.6%); sales and office occupations (13.9%); education, training, and library occupations (13.0%); business and financial operations occupations (7.9%); service occupations (6.9%); legal occupations (6.1%)
Roads and streets: Chimney Rock Rd; S Rice Ave; N Braeswood Blvd; Jason St; Maple St; Braesmont Dr; Indigo St; Ferris Dr; Beechnut St; Jackwood St; Grape St (Grape Rd); Darnell St; Carew St; Birdwood Rd; Braesvalley Dr; Loch Lomond Dr; Imogene St; S Atwell Dr; Mimosa Dr; Prichett Dr; Manhattan Dr; Caversham Dr; Ariel St; Edith St; Moonlight Dr; Burdine St; Wallington Dr; Loch Lomond Ct.
Other features: Brays Byu.
Braesview Terrace neighborhood detailed profile
Braeswood Place neighborhood in Houston statistics: (Find on map)
Area: 3.273 square miles
Population: 14,999
Population density:
Median household income in 2021:
Median rent in in 2021:
Male vs Females
Median age
Housing prices:
Average estimated value of detached houses in 2021 (62.2% of all units):
Average estimated value of townhouses or other attached units in 2021 (17.0% of all units):
Average estimated '21 value of housing units in 5-or-more-unit structures (36.4% of all units):
Most popular occupations of males: management occupations (except farmers) (20.1%); healthcare practitioners and technical occupations (15.8%); business and financial operations occupations (12.9%); sales and office occupations (11.0%); legal occupations (8.5%); life, physical, and social science occupations (7.4%); architecture and engineering occupations (5.9%)
Most popular occupations of females: healthcare practitioners and technical occupations (23.8%); education, training, and library occupations (13.4%); management occupations (except farmers) (10.3%); business and financial operations occupations (9.2%); sales and office occupations (9.1%); legal occupations (8.0%); life, physical, and social science occupations (6.6%)
Highways in this neighborhood: Main St (US Hwy 90 Alt).
Roads and streets: S Braeswood Blvd; N Braeswood Blvd; Buffalo Speedway; Stella Link Rd; Bellefontaine St; Linkwood Dr; Underwood St; Aberdeen Way; Bluebonnet Blvd; Merrick St; Drummond St; Grennoch Ln; Tartan Ln; Durness Way; Glen Haven Blvd; Broadmead Dr; Academy St; Dumbarton St; Gramercy St; Murworth Dr; Edloe St; Timberside Dr; Braes Blvd; Glen Arbor Dr; Woodvalley Dr; Maroneal St; Kirby Dr; Sewanee St; Turnberry Cir (Turnberry Ln); Bevlyn Dr; Elmridge St; Durhill St; Sun Valley Dr; Greenbush St; Brompton St (Brompton Rd); Linkmeadow Ln; Deal St; Latma Dr; Breakwood Dr; Fairhope St; Norris Dr; Ilona Ln; Lorrie Dr; Bellaire Blvd; Westridge; Meyerwood Dr; Prescott St; Cloverdale St; Stanton St; Marlive Ln; Conway St; Leeshire Dr; Mischire Dr; Martinshire Dr; Lanark Ln; Castlewood St; Greenwillow St (Greenwillow Dr); Falkirk Ln; Levonshire Dr; Bassoon Dr; Cliffwood Dr; Glenshire St (Glenshire Dr); Gannett St; Fordshire Dr; Kapri Ln; Bluegate St; Linkview Dr; Hatton St; Lakeland Dr; Timberside Circle Dr; Bradford St; Winslow St; Seuss Dr; Gramercy; Tilden St; Mariposa St; Newshire Dr; Linkpass Ln; Braesmain Dr; Linkterrace Ln; Riddlewood Ln; Rochdale St; Chriswell St; Linklea Dr; Kilmarnock Dr; Prestwick (Prestwick St); Ashwood St; Pemberton Circle Dr; Chatfield St; Bluegate Ct; S Pemberton Circle Dr; N Pemberton Circle Dr; Gairloch Ln; Wakeforest St; Solway Ln; Oakwood; Lookout Ct; Blue Bonnet Blvd; Linkfair Ln; W Glen Haven Blvd; Woodmeadow St; Brompton Square Dr; Fairhope Pl; E Glen Haven Blvd; Denbury Way; Silver Lake; Academy Ave (Academy St); Stonehouse Ln; Silver Spring Ln (Silver Springs Dr); S Glen Haven Blvd; E Pemberton Circle Dr; W Pemberton Circle Dr; Cliffwood Ct; Latma Ct; Greenwillow St (Greenwillow Ct); Center Ave (Sewanee St); Westchester St; Link Ct.
Railroad features: Southern Pacific RR.
Other features: Brays Byu.
Braeswood Place neighborhood detailed profile
Area: 3.273 square miles
Population: 14,999
Population density:
| Braeswood Place: | 4,583 people per square mile |
| Houston: | 3,947 people per square mile |
Median household income in 2021:
| Braeswood Place: | $207,211 |
| Houston: | $55,499 |
Median rent in in 2021:
| Braeswood Place: | $2,012 |
| Houston: | $974 |
Male vs Females
| Males: | 7,345 |
| Females: | 7,654 |
Median age
| Males: | 40.5 years |
| Females: | 44.3 years |
Housing prices:
Average estimated value of detached houses in 2021 (62.2% of all units):
| Braeswood Place: | $981,830 |
| Houston: | $304,685 |
Average estimated value of townhouses or other attached units in 2021 (17.0% of all units):
| This neighborhood: | $456,887 |
| city: | $305,463 |
Average estimated '21 value of housing units in 5-or-more-unit structures (36.4% of all units):
| Braeswood Place: | $320,345 |
| Houston: | $227,414 |
Most popular occupations of males: management occupations (except farmers) (20.1%); healthcare practitioners and technical occupations (15.8%); business and financial operations occupations (12.9%); sales and office occupations (11.0%); legal occupations (8.5%); life, physical, and social science occupations (7.4%); architecture and engineering occupations (5.9%)
Most popular occupations of females: healthcare practitioners and technical occupations (23.8%); education, training, and library occupations (13.4%); management occupations (except farmers) (10.3%); business and financial operations occupations (9.2%); sales and office occupations (9.1%); legal occupations (8.0%); life, physical, and social science occupations (6.6%)
Highways in this neighborhood: Main St (US Hwy 90 Alt).
Roads and streets: S Braeswood Blvd; N Braeswood Blvd; Buffalo Speedway; Stella Link Rd; Bellefontaine St; Linkwood Dr; Underwood St; Aberdeen Way; Bluebonnet Blvd; Merrick St; Drummond St; Grennoch Ln; Tartan Ln; Durness Way; Glen Haven Blvd; Broadmead Dr; Academy St; Dumbarton St; Gramercy St; Murworth Dr; Edloe St; Timberside Dr; Braes Blvd; Glen Arbor Dr; Woodvalley Dr; Maroneal St; Kirby Dr; Sewanee St; Turnberry Cir (Turnberry Ln); Bevlyn Dr; Elmridge St; Durhill St; Sun Valley Dr; Greenbush St; Brompton St (Brompton Rd); Linkmeadow Ln; Deal St; Latma Dr; Breakwood Dr; Fairhope St; Norris Dr; Ilona Ln; Lorrie Dr; Bellaire Blvd; Westridge; Meyerwood Dr; Prescott St; Cloverdale St; Stanton St; Marlive Ln; Conway St; Leeshire Dr; Mischire Dr; Martinshire Dr; Lanark Ln; Castlewood St; Greenwillow St (Greenwillow Dr); Falkirk Ln; Levonshire Dr; Bassoon Dr; Cliffwood Dr; Glenshire St (Glenshire Dr); Gannett St; Fordshire Dr; Kapri Ln; Bluegate St; Linkview Dr; Hatton St; Lakeland Dr; Timberside Circle Dr; Bradford St; Winslow St; Seuss Dr; Gramercy; Tilden St; Mariposa St; Newshire Dr; Linkpass Ln; Braesmain Dr; Linkterrace Ln; Riddlewood Ln; Rochdale St; Chriswell St; Linklea Dr; Kilmarnock Dr; Prestwick (Prestwick St); Ashwood St; Pemberton Circle Dr; Chatfield St; Bluegate Ct; S Pemberton Circle Dr; N Pemberton Circle Dr; Gairloch Ln; Wakeforest St; Solway Ln; Oakwood; Lookout Ct; Blue Bonnet Blvd; Linkfair Ln; W Glen Haven Blvd; Woodmeadow St; Brompton Square Dr; Fairhope Pl; E Glen Haven Blvd; Denbury Way; Silver Lake; Academy Ave (Academy St); Stonehouse Ln; Silver Spring Ln (Silver Springs Dr); S Glen Haven Blvd; E Pemberton Circle Dr; W Pemberton Circle Dr; Cliffwood Ct; Latma Ct; Greenwillow St (Greenwillow Ct); Center Ave (Sewanee St); Westchester St; Link Ct.
Railroad features: Southern Pacific RR.
Other features: Brays Byu.
Braeswood Place neighborhood detailed profile
Briar Forest neighborhood in Houston statistics: (Find on map)
Area: 6.690 square miles
Population: 30,477
Population density:
Median household income in 2021:
Median rent in in 2021:
Male vs Females
Median age
Housing prices:
Average estimated value of detached houses in 2021 (52.8% of all units):
Average estimated value of townhouses or other attached units in 2021 (22.3% of all units):
Average estimated '21 value of housing units in 3-to-4-unit structures (8.5% of all units):
Average estimated '21 value of housing units in 5-or-more-unit structures (12.1% of all units):
Most popular occupations of males: sales and office occupations (20.9%); management occupations (except farmers) (16.8%); service occupations (10.4%); business and financial operations occupations (9.8%); architecture and engineering occupations (8.2%); computer and mathematical occupations (7.6%); arts, design, entertainment, sports, and media occupations (5.9%)
Most popular occupations of females: sales and office occupations (22.9%); education, training, and library occupations (16.7%); management occupations (except farmers) (12.7%); service occupations (12.6%); business and financial operations occupations (8.5%); life, physical, and social science occupations (4.6%); architecture and engineering occupations (4.3%)
Highways in this neighborhood: State Loop 8 (Beltway 8, Sam Houston Pkwy).
Roads and streets: Briar Forest Dr; Olympia Dr; Wilcrest Dr; S Kirkwood Rd; S Dairy Ashford Rd (S Dairy Ashford St); Walnut Bend Ln; Holly Springs Dr; Briarpark Dr; Chevy Chase Dr; Lakeside Estates Dr; Hayes Rd; Piping Rock Ln; Blue Willow Dr; Briarbrook Dr; del Monte Dr; Westmere Dr; Candlewood Dr; Meadow Lake Ln; Overbrook Ln (Overbrook Dr); Cedar Creek Dr; Inwood Dr; Wickersham Ln; Ella Lee Ln; Ashford Pkwy; Waldemar Dr; Burgoyne Rd; Overbrook Ln; Whittington Dr; Seagler Rd; Woodland Park Dr; Riverview Way Dr; Valley Forge Dr; Carriage Hill Dr; Sugar Hill Dr; Ella Lee Dr (Ella Lee Ln); Burgoyne Dr; Rocky Knoll Dr; Honeywood Trl; Southlake Dr; Shannon Valley Dr; Longmont Dr; Woodland Springs St; Briar Rose Dr; Lakeside Place Dr; Round Lake Dr; Ashford Hollow Ln; Meadow Lake Ln (Meadow Lake Dr); Cranbrook Rd; Nova Dr; Riverview Way (Riverview Way Dr, Riverview Dr); Lynbrook Dr; Citywest Blvd; Highgrove Dr; Warwickshire Dr; Piping Rock Dr; Cherry Bend Dr; Bordley Dr; Wedgehill Ln; Briar Dr; Lakeside Forest Ln; Green Tree Rd; Briar Hill Dr; Attlee Dr; Pine Forest Rd; Deerwood Rd; Tupper Lake Dr; Shadowbriar Dr; Westella Dr; Heathwood Dr; Crystal Hills Dr; Shady River Dr; Eagle Falls Dr (Eagle Falls St); Cedar Pass Dr; Riverview Way; Crestbend Dr; Sugar Springs Dr; FM 1093 (Westheimer Rd); Prairie Grove Dr; Willow Lake Dr; Gray Falls Dr; Sandy Spring Rd; E Rivercrest Dr; Wood Lodge Dr; Prairie Mark Ln; Bayou Glen Rd; Bentworth Dr; Maple Rock Dr; Pebble Rock Dr; E Brooklake Dr; Deep Spring Ln; Stoneford Dr; Shepherds Ridge Dr; Village Place Dr; Big Hollow Ln; Mossy Stone Dr; Stafford Springs Dr; Harvest Moon Ln; Hickory Lawn Dr; Westerley Ln; Cherryknoll Dr; Cove Creek Ln; Gladewick Dr; Crescent Park Dr; W Brooklake Dr; Lashbrook Dr; Brandywyne Dr; Rincon Dr; Russett Dr; City Way; Valley Vista Dr; Beaujolais Ln; Chardonnay Dr; Tallulah Ln; Briar Branch Dr; W Rivercrest Dr; Fall Valley Dr; Long Pine Dr; Bayou Island Dr; Doliver Dr; Trailmont Dr; Summerdale Dr (Summerdale St); Bayou Cove Ct; Locke Ln; Cityplace Dr; Francoise Blvd; Lynbrook Hollow St; E Vistawood Dr; Shadybriar Dr; Ashgrove Dr; Glen Knoll Dr; W Vistawood Dr; Oxtail; Boardwalk St; Night Star Ln; Silver Sage Dr; Almond Grove Dr; Berrywood Ln; Drexel Hill Dr; Brecon Hall Dr; Castle Ridge Dr; Lakeside Park Dr; Manor Park Dr; Hazelwood Ln; Crestbend Ct; Cranbrook Dr (Tupper Lake Dr); Blackstone Ct; Holly Point Dr; Kinbrook Dr; Trixie Ln; Lanny Ln; Courtney Lane Dr (Courtney Dr); Briar River Dr; Twin Circle Dr; Rogerdale Rd; Chase Lake Dr; Haven Lock Dr; Cherry Knoll Dr; Forked Bough Dr; Rushbrook Dr; Ravenmoor Dr; Park Haven Dr; Beechbend Dr; Manor Green Dr; Holly Creek Rd; Popular Creek Dr; Shadow View Ln; Lakecliff Dr; Spruce Hill Dr; Aspen Grove Dr; Drexelbrook Dr; Devon Glen Dr; Firehill Dr; Fieldbrook Dr; Clearfork Dr; Rocky Bend Dr; Holly River Dr; Holly Knoll Dr (Holly Knoll St); Bittercreek Dr; Hunters Trce; Berryfield Dr; Field Brook Dr; Chapelle Ct; Mardel Ct; Nova Ct (Nova Dr); Elm Estates Dr; Julie Ln; Spanish Moss Ln; Ashmead Dr; Highland Springs Dr; Ambergate Dr; Drakemill Dr; Kent Oak Dr; Lakeside Oaks Dr; Leclerc Ln; Park Rose Dr; Dodd Ln; Cherry Ridge Dr; Bradmore Dr; Villmont Ln; Wilston Ct; Ivy Glen Dr; Chatburn Dr; Keatley Dr; Valley Glen Dr; Tallulah Ct; Almond Grove Ct; Heathwood Ct; Brook Spring Dr; Triple Oak Ct; Riverview Cir; W Brooklake Ct; Riverview Ct; Village Green Ct; Big Lake Dr; Valley Vista Ct; Ashurst Dr; Lakeside Valley Dr; Warwickshire Ct; Cedar Creek Ct; Eagle Falls Ct; Harbor Oaks Dr; Vistawood Ct; Cedar Pass Ct; Westmere Ct; Pebble Rock Ct; Glen Knoll Ct.
Other features: Buffalo Byu.
Briar Forest neighborhood detailed profile
Area: 6.690 square miles
Population: 30,477
Population density:
| Briar Forest: | 4,556 people per square mile |
| Houston: | 3,947 people per square mile |
Median household income in 2021:
| Briar Forest: | $152,854 |
| Houston: | $55,499 |
Median rent in in 2021:
| Briar Forest: | $1,592 |
| Houston: | $974 |
Male vs Females
| Males: | 14,777 |
| Females: | 15,700 |
Median age
| Males: | 42.6 years |
| Females: | 41.5 years |
Housing prices:
Average estimated value of detached houses in 2021 (52.8% of all units):
| Briar Forest: | $368,552 |
| Houston: | $304,685 |
Average estimated value of townhouses or other attached units in 2021 (22.3% of all units):
| This neighborhood: | $242,290 |
| city: | $305,463 |
Average estimated '21 value of housing units in 3-to-4-unit structures (8.5% of all units):
| Briar Forest: | $230,040 |
| city: | $184,874 |
Average estimated '21 value of housing units in 5-or-more-unit structures (12.1% of all units):
| Briar Forest: | $1,005,224 |
| Houston: | $227,414 |
Most popular occupations of males: sales and office occupations (20.9%); management occupations (except farmers) (16.8%); service occupations (10.4%); business and financial operations occupations (9.8%); architecture and engineering occupations (8.2%); computer and mathematical occupations (7.6%); arts, design, entertainment, sports, and media occupations (5.9%)
Most popular occupations of females: sales and office occupations (22.9%); education, training, and library occupations (16.7%); management occupations (except farmers) (12.7%); service occupations (12.6%); business and financial operations occupations (8.5%); life, physical, and social science occupations (4.6%); architecture and engineering occupations (4.3%)
Highways in this neighborhood: State Loop 8 (Beltway 8, Sam Houston Pkwy).
Roads and streets: Briar Forest Dr; Olympia Dr; Wilcrest Dr; S Kirkwood Rd; S Dairy Ashford Rd (S Dairy Ashford St); Walnut Bend Ln; Holly Springs Dr; Briarpark Dr; Chevy Chase Dr; Lakeside Estates Dr; Hayes Rd; Piping Rock Ln; Blue Willow Dr; Briarbrook Dr; del Monte Dr; Westmere Dr; Candlewood Dr; Meadow Lake Ln; Overbrook Ln (Overbrook Dr); Cedar Creek Dr; Inwood Dr; Wickersham Ln; Ella Lee Ln; Ashford Pkwy; Waldemar Dr; Burgoyne Rd; Overbrook Ln; Whittington Dr; Seagler Rd; Woodland Park Dr; Riverview Way Dr; Valley Forge Dr; Carriage Hill Dr; Sugar Hill Dr; Ella Lee Dr (Ella Lee Ln); Burgoyne Dr; Rocky Knoll Dr; Honeywood Trl; Southlake Dr; Shannon Valley Dr; Longmont Dr; Woodland Springs St; Briar Rose Dr; Lakeside Place Dr; Round Lake Dr; Ashford Hollow Ln; Meadow Lake Ln (Meadow Lake Dr); Cranbrook Rd; Nova Dr; Riverview Way (Riverview Way Dr, Riverview Dr); Lynbrook Dr; Citywest Blvd; Highgrove Dr; Warwickshire Dr; Piping Rock Dr; Cherry Bend Dr; Bordley Dr; Wedgehill Ln; Briar Dr; Lakeside Forest Ln; Green Tree Rd; Briar Hill Dr; Attlee Dr; Pine Forest Rd; Deerwood Rd; Tupper Lake Dr; Shadowbriar Dr; Westella Dr; Heathwood Dr; Crystal Hills Dr; Shady River Dr; Eagle Falls Dr (Eagle Falls St); Cedar Pass Dr; Riverview Way; Crestbend Dr; Sugar Springs Dr; FM 1093 (Westheimer Rd); Prairie Grove Dr; Willow Lake Dr; Gray Falls Dr; Sandy Spring Rd; E Rivercrest Dr; Wood Lodge Dr; Prairie Mark Ln; Bayou Glen Rd; Bentworth Dr; Maple Rock Dr; Pebble Rock Dr; E Brooklake Dr; Deep Spring Ln; Stoneford Dr; Shepherds Ridge Dr; Village Place Dr; Big Hollow Ln; Mossy Stone Dr; Stafford Springs Dr; Harvest Moon Ln; Hickory Lawn Dr; Westerley Ln; Cherryknoll Dr; Cove Creek Ln; Gladewick Dr; Crescent Park Dr; W Brooklake Dr; Lashbrook Dr; Brandywyne Dr; Rincon Dr; Russett Dr; City Way; Valley Vista Dr; Beaujolais Ln; Chardonnay Dr; Tallulah Ln; Briar Branch Dr; W Rivercrest Dr; Fall Valley Dr; Long Pine Dr; Bayou Island Dr; Doliver Dr; Trailmont Dr; Summerdale Dr (Summerdale St); Bayou Cove Ct; Locke Ln; Cityplace Dr; Francoise Blvd; Lynbrook Hollow St; E Vistawood Dr; Shadybriar Dr; Ashgrove Dr; Glen Knoll Dr; W Vistawood Dr; Oxtail; Boardwalk St; Night Star Ln; Silver Sage Dr; Almond Grove Dr; Berrywood Ln; Drexel Hill Dr; Brecon Hall Dr; Castle Ridge Dr; Lakeside Park Dr; Manor Park Dr; Hazelwood Ln; Crestbend Ct; Cranbrook Dr (Tupper Lake Dr); Blackstone Ct; Holly Point Dr; Kinbrook Dr; Trixie Ln; Lanny Ln; Courtney Lane Dr (Courtney Dr); Briar River Dr; Twin Circle Dr; Rogerdale Rd; Chase Lake Dr; Haven Lock Dr; Cherry Knoll Dr; Forked Bough Dr; Rushbrook Dr; Ravenmoor Dr; Park Haven Dr; Beechbend Dr; Manor Green Dr; Holly Creek Rd; Popular Creek Dr; Shadow View Ln; Lakecliff Dr; Spruce Hill Dr; Aspen Grove Dr; Drexelbrook Dr; Devon Glen Dr; Firehill Dr; Fieldbrook Dr; Clearfork Dr; Rocky Bend Dr; Holly River Dr; Holly Knoll Dr (Holly Knoll St); Bittercreek Dr; Hunters Trce; Berryfield Dr; Field Brook Dr; Chapelle Ct; Mardel Ct; Nova Ct (Nova Dr); Elm Estates Dr; Julie Ln; Spanish Moss Ln; Ashmead Dr; Highland Springs Dr; Ambergate Dr; Drakemill Dr; Kent Oak Dr; Lakeside Oaks Dr; Leclerc Ln; Park Rose Dr; Dodd Ln; Cherry Ridge Dr; Bradmore Dr; Villmont Ln; Wilston Ct; Ivy Glen Dr; Chatburn Dr; Keatley Dr; Valley Glen Dr; Tallulah Ct; Almond Grove Ct; Heathwood Ct; Brook Spring Dr; Triple Oak Ct; Riverview Cir; W Brooklake Ct; Riverview Ct; Village Green Ct; Big Lake Dr; Valley Vista Ct; Ashurst Dr; Lakeside Valley Dr; Warwickshire Ct; Cedar Creek Ct; Eagle Falls Ct; Harbor Oaks Dr; Vistawood Ct; Cedar Pass Ct; Westmere Ct; Pebble Rock Ct; Glen Knoll Ct.
Other features: Buffalo Byu.
Briar Forest neighborhood detailed profile
Briar Meadow neighborhood in Houston statistics: (Find on map)
Area: 5.468 square miles
Population: 24,971
Population density:
Median household income in 2021:
Median rent in in 2021:
Male vs Females
Median age
Housing prices:
Average estimated value of detached houses in 2021 (34.8% of all units):
Average estimated value of townhouses or other attached units in 2021 (4.8% of all units):
Average estimated '21 value of housing units in 3-to-4-unit structures (5.3% of all units):
Average estimated '21 value of housing units in 5-or-more-unit structures (39.3% of all units):
Most popular occupations of males: service occupations (20.3%); sales and office occupations (17.9%); management occupations (except farmers) (11.6%); business and financial operations occupations (9.2%); education, training, and library occupations (6.5%); construction, extraction, and maintenance occupations (5.5%); architecture and engineering occupations (4.9%)
Most popular occupations of females: service occupations (22.7%); sales and office occupations (19.7%); healthcare practitioners and technical occupations (17.3%); business and financial operations occupations (14.8%); management occupations (except farmers) (7.3%); education, training, and library occupations (6.5%); arts, design, entertainment, sports, and media occupations (3.3%)
Highways in this neighborhood: US Hwy 59 (Southwest Fwy); US Hwy 59 (59-Hov).
Roads and streets: Westheimer Rd (FM 1093); Richmond Ave; Beverlyhill St; Westpark Dr; Fairdale Ln; Windswept Ln; Pagewood Ln; S Gessner Rd; Skyline Dr; Tanglewilde St; Stoney Brook Dr (Stoneybrook Dr); Winsome Ln; Fondren Rd; Highmeadow Dr; Meadowcroft Dr; Woodway Dr; Schumacher Ln; Meadowglen Ln; Val Verde St; Jeanetta St; Meadowbriar Ln; Crossview Dr; Dunvale Rd; Hillcroft St (Hillcroft Ave); Meadowvale Dr; Westerland Dr; Fountain View Dr; Ann Arbor Dr; Chimney Rock Rd; Daffodil; Lipan Rd; Unity Dr; Freshmeadows Dr; Bering Dr; Westglen Dr; W Shady Ln; Rockyridge Dr; Ocee St; Ella Lee Ln; Amanda Ln; Star Ln; Dolores St; Briar Forest Dr; Clarkcrest St; Greenridge Dr; Judalon Ln; Buttercup St; Longmont; Burgoyne Rd; W Greenridge Dr; E Greenridge Dr; Doliver Dr; Antelope Dr (Antelope St); del Monte Dr; Barrington Rd; Locke Ln; Briargrove Dr; Bellflower St; E Shady Ln; Park West Dr; Old Farm Rd; Ace St; Longmont Dr; Lazy Hollow Dr; Ade St; Jarvis St; Wood Lake Ln; Arc St; Chevy Chase Dr; Rockarbor Dr; Artdale St; Rolido Dr; Waldo St; Bayou Brook St; Briarhurst Dr; Meadowland Dr; Olympia Dr; Rasmus Dr; Meadowlake Ln; Monsey Dr; Chris Dr; Westholme Dr; Armstrong; Lincrest Ln; Stoney Brook Dr; Osage St; Braxton Dr; Hartsdale Dr; Westpark Dr (Drew St); Fulham Ct; Bayou Pointe Dr; Amberly Ct; Hullsmith Dr; Fairhill Dr; Rouge Cir; Briarhurst Park; Inwood Dr; Kingsville St; Topaz St; Gabriel St; Cheer St; Tanglewilde Ave; Avalon Way; Locke Lee Ln; Bayou Brook; Longfield Cir; Pinefield Ln; Blanco St; Richmond - Rosenberg Rd; Overbrook Ln; Kingsville; Piping Rock Ln; Wickersham Ln; Lonzo St; Small Leaf Cir; Avalon Ter.
Other features: Bering Ditch.
Briar Meadow neighborhood detailed profile
Area: 5.468 square miles
Population: 24,971
Population density:
| Briar Meadow (Woodlake): | 4,567 people per square mile |
| Houston: | 3,947 people per square mile |
Median household income in 2021:
| Briar Meadow (Woodlake): | $108,825 |
| Houston: | $55,499 |
Median rent in in 2021:
| Briar Meadow (Woodlake): | $1,153 |
| Houston: | $974 |
Male vs Females
| Males: | 13,461 |
| Females: | 11,510 |
Median age
| Males: | 44.9 years |
| Females: | 39.7 years |
Housing prices:
Average estimated value of detached houses in 2021 (34.8% of all units):
| Briar Meadow (Woodlake): | $530,952 |
| Houston: | $304,685 |
Average estimated value of townhouses or other attached units in 2021 (4.8% of all units):
| This neighborhood: | $497,528 |
| city: | $305,463 |
Average estimated '21 value of housing units in 3-to-4-unit structures (5.3% of all units):
| Briar Meadow (Woodlake): | $202,833 |
| city: | $184,874 |
Average estimated '21 value of housing units in 5-or-more-unit structures (39.3% of all units):
| Briar Meadow (Woodlake): | $233,643 |
| Houston: | $227,414 |
Most popular occupations of males: service occupations (20.3%); sales and office occupations (17.9%); management occupations (except farmers) (11.6%); business and financial operations occupations (9.2%); education, training, and library occupations (6.5%); construction, extraction, and maintenance occupations (5.5%); architecture and engineering occupations (4.9%)
Most popular occupations of females: service occupations (22.7%); sales and office occupations (19.7%); healthcare practitioners and technical occupations (17.3%); business and financial operations occupations (14.8%); management occupations (except farmers) (7.3%); education, training, and library occupations (6.5%); arts, design, entertainment, sports, and media occupations (3.3%)
Highways in this neighborhood: US Hwy 59 (Southwest Fwy); US Hwy 59 (59-Hov).
Roads and streets: Westheimer Rd (FM 1093); Richmond Ave; Beverlyhill St; Westpark Dr; Fairdale Ln; Windswept Ln; Pagewood Ln; S Gessner Rd; Skyline Dr; Tanglewilde St; Stoney Brook Dr (Stoneybrook Dr); Winsome Ln; Fondren Rd; Highmeadow Dr; Meadowcroft Dr; Woodway Dr; Schumacher Ln; Meadowglen Ln; Val Verde St; Jeanetta St; Meadowbriar Ln; Crossview Dr; Dunvale Rd; Hillcroft St (Hillcroft Ave); Meadowvale Dr; Westerland Dr; Fountain View Dr; Ann Arbor Dr; Chimney Rock Rd; Daffodil; Lipan Rd; Unity Dr; Freshmeadows Dr; Bering Dr; Westglen Dr; W Shady Ln; Rockyridge Dr; Ocee St; Ella Lee Ln; Amanda Ln; Star Ln; Dolores St; Briar Forest Dr; Clarkcrest St; Greenridge Dr; Judalon Ln; Buttercup St; Longmont; Burgoyne Rd; W Greenridge Dr; E Greenridge Dr; Doliver Dr; Antelope Dr (Antelope St); del Monte Dr; Barrington Rd; Locke Ln; Briargrove Dr; Bellflower St; E Shady Ln; Park West Dr; Old Farm Rd; Ace St; Longmont Dr; Lazy Hollow Dr; Ade St; Jarvis St; Wood Lake Ln; Arc St; Chevy Chase Dr; Rockarbor Dr; Artdale St; Rolido Dr; Waldo St; Bayou Brook St; Briarhurst Dr; Meadowland Dr; Olympia Dr; Rasmus Dr; Meadowlake Ln; Monsey Dr; Chris Dr; Westholme Dr; Armstrong; Lincrest Ln; Stoney Brook Dr; Osage St; Braxton Dr; Hartsdale Dr; Westpark Dr (Drew St); Fulham Ct; Bayou Pointe Dr; Amberly Ct; Hullsmith Dr; Fairhill Dr; Rouge Cir; Briarhurst Park; Inwood Dr; Kingsville St; Topaz St; Gabriel St; Cheer St; Tanglewilde Ave; Avalon Way; Locke Lee Ln; Bayou Brook; Longfield Cir; Pinefield Ln; Blanco St; Richmond - Rosenberg Rd; Overbrook Ln; Kingsville; Piping Rock Ln; Wickersham Ln; Lonzo St; Small Leaf Cir; Avalon Ter.
Other features: Bering Ditch.
Briar Meadow neighborhood detailed profile
Central Southwest neighborhood in Houston statistics: (Find on map)
Area: 23.828 square miles
Population: 102,252
Population density:
Median household income in 2021:
Median rent in in 2021:
Male vs Females
Median age
Housing prices:
Average estimated value of detached houses in 2021 (81.7% of all units):
Average estimated value of townhouses or other attached units in 2021 (21.4% of all units):
Average estimated value of mobile home in 2021 (35.5% of all units):
Most popular occupations of males: service occupations (20.6%); construction, extraction, and maintenance occupations (15.3%); sales and office occupations (13.2%); material moving occupations (10.5%); production occupations (9.8%); transportation occupations (9.6%); management occupations (except farmers) (7.3%)
Most popular occupations of females: service occupations (29.7%); sales and office occupations (26.0%); healthcare practitioners and technical occupations (14.0%); management occupations (except farmers) (7.1%); business and financial operations occupations (5.9%); production occupations (5.9%); education, training, and library occupations (2.0%)
Highways in this neighborhood: South Fwy (State Hwy 288); Sam Houston Pkwy (State Loop 8, Beltway 8).
Roads and streets: W Orem Dr; Almeda Rd (FM 521); Tidewater Dr; Hiram Clarke Rd; S Post Oak Rd; Holmes Rd; W Fuqua St; Anderson Rd; Brookfield Dr; Simsbrook Dr; Knotty Oaks Trl; Grapevine St; Sam Houston Pkwy (State Loop 8); Tiffany Dr; Heatherbrook Dr; Feldman St (Reed Rd); Fellows Rd; White Heather Dr; Almeda-Genoa Rd; Waterloo Dr; Darlinghurst Dr; Trail Lake Ln (Trail Lake Dr); Brookston St; Wuthering Heights Dr; Danfield Dr; Heatherbloom Dr; Buxley St; W Airport Blvd; Dalmatian Dr; Player St; Main St; Mowery Rd; Dragonwick Dr; E Anderson Rd; Buffalo Speedway; Ingomar Way; Woodmont Dr; Ebbtide Dr; Ambrose St; Bathurst Dr; Prudence Dr; Jorns St; Townwood Dr; Markwood Ln; Allum Rd; Trafalgar Dr; Ripplebrook Dr; Beran Dr; Newquay St; Quention Dr; Kelling St; Bellfort St; Mc Grath Rd; Hooper Rd; Almeda School Rd; del Papa St; Anagnost Rd; Lew Briggs Rd; Croquet Ln (Croquet St); Regg Dr; Airport Blvd; Bridgeport Rd; Stancliff St; Loma Linda St; Oakham St; Gallagher Dr; Candleshade Ln; River Bluff Dr; Karalis Rd; Chiswick Rd; Fannin St; Brownstone Ln; Loma Vista St; Westhampton Dr; Vandalia Way; Gatewood St (Gatewood Ave); Caradine St; Drakestone Blvd; Curly Oaks Dr; Whitton Dr; Brookmeade Dr; Campden Hill Rd; Wickview Ln; Almeda Plaza Dr; Fleetwell Dr; Monarch Rd; High Point Ln; Rosebud Dr; Knottynold Ln; N Holmes Rd; Oakside Dr; Broadhurst Dr; Landmark; Smooth Oak Ln; Sheringham St; Boynton Dr; Regency Dr; Pinacle Pt; Labrador Dr; Nitida St; Goulburn Dr; Clover Ln; Alrover St; Lotus St; Robin Blvd; Lotus Dr (Lotus St); Tadlock Ln; Wrigley St; Overcross Dr; Glenridge Ln; Rockwell Blvd; Sunrose Ln; Summit Ridge Dr; Parcel Three; Foxshire Ln; Rockrill Dr; Warkworth Dr; Monticello Dr; Windy Royal Dr; Park Manor St; Uptown Dr; Bridlington St; Rockby Dr; Polo St; Amelia Dr; Glenwyck Dr (Glenwyck St); Southfield Dr; Mandalay Way; Cloverbrook Dr; Rocky Springs Trl; Burdine St; Sunshadow Dr; Canterwell Rd; Catina Ln; Alkay St; Elaine Rd; Heathercrest Dr (Heathercrest St); Willomine Way; Anderson Oaks St; Insley St; Belgrade Dr; Almeece St; Mc Kinstry Blvd; Northumb Rd; Oban St; Taintor St; Brent Dr; E Almeda Rd; Altair Way; Gatewood Ct; Schurmier Rd; Majesty Ln; Delbury St; Coachcreek Dr (Wood River Dr); Santa Teresa Rd; Lost Thicket Dr; Silver Bell St; Lawnhaven Dr; Carved Rock Dr; Gemini Ave; Wickbriar Dr; Worrell Dr; Bandell Dr; James Pl; Verdant Brook Dr; Norshire St; Caribe Ln; Betty Sue Ln; Edwina Blvd; Paddington St; Abide Dr; Brooklawn Dr; Elmfield St; Chimney Rock Rd; Littleford St; Nuwood Ln; Big Sandy; Cheryl Lynne Ln; Glenn Ricki Dr; Kylewick Dr; Melcher Dr; Castlereagh Dr; Canterville Rd; Vernage Rd; Glen Rio St; Golden Brook Dr; Canterview Dr; Rosecrest Dr; Palmcrest St; Nelson St; Town Plaza Dr; Remus Dr; O Hara Dr; Broken Bridge Dr; Loma Linda St (Loma Linda Ave); Gardengrove Ave; Lightstar Dr; Misty Bluff Dr; Pinebrook Ln; Canterlane Dr; Greenwick Ln; Loma Linda; Jethro St; Carrie St; S Petro Ln; Wickley Dr; Brenford Dr; Dream Ct; Ambrose; Bayswater Dr; Woodkerr St; Janbar Rd; Macridge Blvd; Wickgate Dr; Frosty Brook Dr; Gumas St; Westward Trl; Bayberry Dr; Amble Ln; Kirkgard Dr; Oak Mantle Dr; Mesa Village Dr; Jewel Meadow Dr; Long Look Dr; Monrad Dr; Faraday Dr; Lockway Dr; Canterdale St; Orach Meadow Ln; Summertime Dr; Keely St; India St; N Greenwick Loop; Ohio; Adler Dr; S Greenwick Loop; Nat Turner Dr (Nat Turner Way); Rocky Bluff Dr; Essendine Ln; Draycott Ln; Inkberry Valley Ln; Woodspire Dr; Miracle Ln; Knight Rd; Arai (Ward St); E Greenwick Loop; Little; Kildare Dr; Zenith St; Glenridge Ct; Goldfarb; W Greenwick Loop; Commercial Ln; Titus Pt; Van Meter St; Foxshire St; Thistle St; Woodring Dr; Misty Arbor Dr; Wesley Oaks Dr; Bow Ln; Walksew St; Gerhart Dr; Sherman Oaks Dr (Sherman Oak); Gospel Way; Main-Hiram Clarke Rd; Summit Ridge Ct; Sewalk St; Blue Cromis Ln; Chameleon Ct; Glenwyck St; Elise Dr; Merida Dr; Kennedy Oaks St; Croquet; Grovemill Dr; Jordan Oaks St; Commercial Rd; Jordan Falls Dr; Mc Cadden St; Brookston Cir; Treaty Oaks St; Bligh St; Gowland St; Firerock Dr; Burdine Ct; Fadeway Ln; Rosevale Ave; Boonway Dr; Clearviewrosevale Ln; Hlp Rd; Elmfield; Norway St; Gold Moss Dr; Gold Fire Dr; Sky Haven Ave; Staghorn Coral Ln; Gumas; Family Cir; Pinesage Dr; W Bellfort St; Park Manor Dr; Milan Dr; Cradle St; Bluestem St; Myrtle St; Innshire Ln; Tutson Pl; Dix St; Simsview Dr; Wrigley; Out Dr; Polo; Hiram Clarke Tc Three Dr; Jade Hollow; Hiram Clarke Tc One Dr; Sandbur Valley Way; Woodmount Cir; Imani Ln; Grantmoor Ln; Corsair Rd; Faith Pl; Anderson Oaks Ct; Grapevine; Nia Pl; Hiram Clarke Tc Two Dr; Bethune Way; Poinsettia St; Markwood Ct; Sewalk; Plaza Dale Dr; Southfield; Brookston Ct; Charing Way; Brookston; Hiram Clarke Tc Four Dr; Kilkenny Dr; Avonelle Ln; Bathurst; Riverstone; N Greenwick Loop Ct (N Greenwick Ct); Jethro; Sonoran Blue Way; Pyramid Pl; Glentide Cir.
Railroad features: Union Pacific RR.
Other features: Sims Byu.
Central Southwest neighborhood detailed profile
Area: 23.828 square miles
Population: 102,252
Population density:
| Central Southwest: | 4,291 people per square mile |
| Houston: | 3,947 people per square mile |
Median household income in 2021:
| Central Southwest: | $52,866 |
| Houston: | $55,499 |
Median rent in in 2021:
| Central Southwest: | $950 |
| Houston: | $974 |
Male vs Females
| Males: | 52,314 |
| Females: | 49,937 |
Median age
| Males: | 34.6 years |
| Females: | 37.4 years |
Housing prices:
Average estimated value of detached houses in 2021 (81.7% of all units):
| Central Southwest: | $142,367 |
| Houston: | $304,685 |
Average estimated value of townhouses or other attached units in 2021 (21.4% of all units):
| This neighborhood: | $37,447 |
| city: | $305,463 |
Average estimated value of mobile home in 2021 (35.5% of all units):
| Central Southwest: | $26,693 |
| Houston: | $60,006 |
Most popular occupations of males: service occupations (20.6%); construction, extraction, and maintenance occupations (15.3%); sales and office occupations (13.2%); material moving occupations (10.5%); production occupations (9.8%); transportation occupations (9.6%); management occupations (except farmers) (7.3%)
Most popular occupations of females: service occupations (29.7%); sales and office occupations (26.0%); healthcare practitioners and technical occupations (14.0%); management occupations (except farmers) (7.1%); business and financial operations occupations (5.9%); production occupations (5.9%); education, training, and library occupations (2.0%)
Highways in this neighborhood: South Fwy (State Hwy 288); Sam Houston Pkwy (State Loop 8, Beltway 8).
Roads and streets: W Orem Dr; Almeda Rd (FM 521); Tidewater Dr; Hiram Clarke Rd; S Post Oak Rd; Holmes Rd; W Fuqua St; Anderson Rd; Brookfield Dr; Simsbrook Dr; Knotty Oaks Trl; Grapevine St; Sam Houston Pkwy (State Loop 8); Tiffany Dr; Heatherbrook Dr; Feldman St (Reed Rd); Fellows Rd; White Heather Dr; Almeda-Genoa Rd; Waterloo Dr; Darlinghurst Dr; Trail Lake Ln (Trail Lake Dr); Brookston St; Wuthering Heights Dr; Danfield Dr; Heatherbloom Dr; Buxley St; W Airport Blvd; Dalmatian Dr; Player St; Main St; Mowery Rd; Dragonwick Dr; E Anderson Rd; Buffalo Speedway; Ingomar Way; Woodmont Dr; Ebbtide Dr; Ambrose St; Bathurst Dr; Prudence Dr; Jorns St; Townwood Dr; Markwood Ln; Allum Rd; Trafalgar Dr; Ripplebrook Dr; Beran Dr; Newquay St; Quention Dr; Kelling St; Bellfort St; Mc Grath Rd; Hooper Rd; Almeda School Rd; del Papa St; Anagnost Rd; Lew Briggs Rd; Croquet Ln (Croquet St); Regg Dr; Airport Blvd; Bridgeport Rd; Stancliff St; Loma Linda St; Oakham St; Gallagher Dr; Candleshade Ln; River Bluff Dr; Karalis Rd; Chiswick Rd; Fannin St; Brownstone Ln; Loma Vista St; Westhampton Dr; Vandalia Way; Gatewood St (Gatewood Ave); Caradine St; Drakestone Blvd; Curly Oaks Dr; Whitton Dr; Brookmeade Dr; Campden Hill Rd; Wickview Ln; Almeda Plaza Dr; Fleetwell Dr; Monarch Rd; High Point Ln; Rosebud Dr; Knottynold Ln; N Holmes Rd; Oakside Dr; Broadhurst Dr; Landmark; Smooth Oak Ln; Sheringham St; Boynton Dr; Regency Dr; Pinacle Pt; Labrador Dr; Nitida St; Goulburn Dr; Clover Ln; Alrover St; Lotus St; Robin Blvd; Lotus Dr (Lotus St); Tadlock Ln; Wrigley St; Overcross Dr; Glenridge Ln; Rockwell Blvd; Sunrose Ln; Summit Ridge Dr; Parcel Three; Foxshire Ln; Rockrill Dr; Warkworth Dr; Monticello Dr; Windy Royal Dr; Park Manor St; Uptown Dr; Bridlington St; Rockby Dr; Polo St; Amelia Dr; Glenwyck Dr (Glenwyck St); Southfield Dr; Mandalay Way; Cloverbrook Dr; Rocky Springs Trl; Burdine St; Sunshadow Dr; Canterwell Rd; Catina Ln; Alkay St; Elaine Rd; Heathercrest Dr (Heathercrest St); Willomine Way; Anderson Oaks St; Insley St; Belgrade Dr; Almeece St; Mc Kinstry Blvd; Northumb Rd; Oban St; Taintor St; Brent Dr; E Almeda Rd; Altair Way; Gatewood Ct; Schurmier Rd; Majesty Ln; Delbury St; Coachcreek Dr (Wood River Dr); Santa Teresa Rd; Lost Thicket Dr; Silver Bell St; Lawnhaven Dr; Carved Rock Dr; Gemini Ave; Wickbriar Dr; Worrell Dr; Bandell Dr; James Pl; Verdant Brook Dr; Norshire St; Caribe Ln; Betty Sue Ln; Edwina Blvd; Paddington St; Abide Dr; Brooklawn Dr; Elmfield St; Chimney Rock Rd; Littleford St; Nuwood Ln; Big Sandy; Cheryl Lynne Ln; Glenn Ricki Dr; Kylewick Dr; Melcher Dr; Castlereagh Dr; Canterville Rd; Vernage Rd; Glen Rio St; Golden Brook Dr; Canterview Dr; Rosecrest Dr; Palmcrest St; Nelson St; Town Plaza Dr; Remus Dr; O Hara Dr; Broken Bridge Dr; Loma Linda St (Loma Linda Ave); Gardengrove Ave; Lightstar Dr; Misty Bluff Dr; Pinebrook Ln; Canterlane Dr; Greenwick Ln; Loma Linda; Jethro St; Carrie St; S Petro Ln; Wickley Dr; Brenford Dr; Dream Ct; Ambrose; Bayswater Dr; Woodkerr St; Janbar Rd; Macridge Blvd; Wickgate Dr; Frosty Brook Dr; Gumas St; Westward Trl; Bayberry Dr; Amble Ln; Kirkgard Dr; Oak Mantle Dr; Mesa Village Dr; Jewel Meadow Dr; Long Look Dr; Monrad Dr; Faraday Dr; Lockway Dr; Canterdale St; Orach Meadow Ln; Summertime Dr; Keely St; India St; N Greenwick Loop; Ohio; Adler Dr; S Greenwick Loop; Nat Turner Dr (Nat Turner Way); Rocky Bluff Dr; Essendine Ln; Draycott Ln; Inkberry Valley Ln; Woodspire Dr; Miracle Ln; Knight Rd; Arai (Ward St); E Greenwick Loop; Little; Kildare Dr; Zenith St; Glenridge Ct; Goldfarb; W Greenwick Loop; Commercial Ln; Titus Pt; Van Meter St; Foxshire St; Thistle St; Woodring Dr; Misty Arbor Dr; Wesley Oaks Dr; Bow Ln; Walksew St; Gerhart Dr; Sherman Oaks Dr (Sherman Oak); Gospel Way; Main-Hiram Clarke Rd; Summit Ridge Ct; Sewalk St; Blue Cromis Ln; Chameleon Ct; Glenwyck St; Elise Dr; Merida Dr; Kennedy Oaks St; Croquet; Grovemill Dr; Jordan Oaks St; Commercial Rd; Jordan Falls Dr; Mc Cadden St; Brookston Cir; Treaty Oaks St; Bligh St; Gowland St; Firerock Dr; Burdine Ct; Fadeway Ln; Rosevale Ave; Boonway Dr; Clearviewrosevale Ln; Hlp Rd; Elmfield; Norway St; Gold Moss Dr; Gold Fire Dr; Sky Haven Ave; Staghorn Coral Ln; Gumas; Family Cir; Pinesage Dr; W Bellfort St; Park Manor Dr; Milan Dr; Cradle St; Bluestem St; Myrtle St; Innshire Ln; Tutson Pl; Dix St; Simsview Dr; Wrigley; Out Dr; Polo; Hiram Clarke Tc Three Dr; Jade Hollow; Hiram Clarke Tc One Dr; Sandbur Valley Way; Woodmount Cir; Imani Ln; Grantmoor Ln; Corsair Rd; Faith Pl; Anderson Oaks Ct; Grapevine; Nia Pl; Hiram Clarke Tc Two Dr; Bethune Way; Poinsettia St; Markwood Ct; Sewalk; Plaza Dale Dr; Southfield; Brookston Ct; Charing Way; Brookston; Hiram Clarke Tc Four Dr; Kilkenny Dr; Avonelle Ln; Bathurst; Riverstone; N Greenwick Loop Ct (N Greenwick Ct); Jethro; Sonoran Blue Way; Pyramid Pl; Glentide Cir.
Railroad features: Union Pacific RR.
Other features: Sims Byu.
Central Southwest neighborhood detailed profile
Clear Lake neighborhood in Houston statistics: (Find on map)
Area: 22.376 square miles
Population: 50,378
Population density:
Median household income in 2021:
Median rent in in 2021:
Male vs Females
Median age
Average estimated value of detached houses in 2021 (86.0% of all units):
Most popular occupations of males: architecture and engineering occupations (21.4%); sales and office occupations (16.7%); management occupations (except farmers) (11.5%); service occupations (9.3%); business and financial operations occupations (8.3%); computer and mathematical occupations (5.0%); transportation occupations (4.3%)
Most popular occupations of females: sales and office occupations (45.2%); education, training, and library occupations (15.1%); business and financial operations occupations (10.1%); management occupations (except farmers) (7.3%); healthcare practitioners and technical occupations (6.1%); service occupations (6.1%); transportation occupations (2.0%)
Limited-access highways (interstate or state) in this neighborhood: Gulf Fwy (I- 45).
Highways in this neighborhood: Galveston Rd (State Hwy 3); E Nasa Road 1 (E Nasa Pkwy, State Hwy 1).
Roads and streets: Space Center Blvd; Clear Lake City Blvd; Bay Area Blvd; el Dorado Blvd; el Camino Real; Pineloch Dr; FM 2351 (Hastings Friendswood Rd); Diana Ln; Reseda Dr; Saturn Ln; Ramada Dr; Richvale Ln; 2nd St; Genoa Red Bluff Rd; Gemini Ave; Oak Links Ave; Buccaneer Ln; Buoy Rd; Seahorse Dr; Torry Pines Rd; Cobre Valley Dr; Redway Ln; Almond Creek Dr; Penn Hills Ln; Sun Harbor Dr; Wavecrest Ln; Beachcomber Ln; Mabry Mill Rd; Village Dale Ave; Brook Forest Dr; Craighurst Dr; Bay Oaks Blvd; Woodhorn Dr; Bonanza Rd; Eastcape Dr; Larkfield Dr; W Linkage Rd; Saint Cloud Dr; Pipers View Dr; Sea Lark Rd; Laurelfield Dr; Glenwest Dr; la Avenida Dr; Whitcomb Rd; Diamond Brook Dr; Neptune Ln; Acorn Wood Way; FM 2351 N (FM Hwy 2351); 5th St; Clearcrest Dr; Festival Dr; Seafoam Rd; Crescent Landing Dr; Scenic View Dr; Oak Chase Dr; Redwood Bend Trl; Brookvilla Dr; Silverpines Rd; Plum Hollow Dr; Cavendish Dr; Thunder Bay Dr; Brookford Dr; Oak Harbor Dr; Parksley Dr; E Linkage Rd; Sea Liner Dr; Havenhurst Dr; Mill Point Dr; el Toro Ln; College Green Dr; Fairwind Rd; Lofty Mountain Trl; Mesa Verde Dr; Seagate Ln; Hickory Knoll Dr; Spring Forest Dr; Village Evergreen Trl; Willow Heights Ct; Running Springs Dr; Leafy Glen Dr; Falcon Pass; Manor Square Dr; Orchard Country Ln; Brookgreen Dr; Scenic Elm St; Pebbleshire Dr; McConn St; Dunmoor Dr; Blairmont Ln; Scenic Glade Dr; Indian Autumn Trce; Whitlock Dr; Seacliff Dr; Echo Hill Dr; Bay Brook Mall Dr (Baybrook Mall); W Pine Brook Way; Longvale Dr; Hercules Ave; el Dorado Oaks Dr; la Cabana Dr; Locke Haven Dr; Fair Knoll Way; Emerald Falls Dr; Royalfield Dr; Pleasant Valley Rd; Voyager Dr; Holly Trail Dr; Broadlawn Dr; Cedar Ridge Trl; Tresvant Dr; Windom Dr; Baybrook Dr; Fathom Ln; Seamaster Dr; Hillside Falls Trl; Silverman St; Park Center Way (Park Center Dr); Lochnell Dr; Coastal Oak Dr; Golden Field Dr; E Pine Brook Way; Pear Woods Ct; Willow Shores Dr; Escuela; Redbud Valley Trl; Capehill Dr; Seavale Rd; Noble Pine Dr; Ironbark Dr; New Cedars Dr; Evergreen Ridge Way; Golf View Trl; Flowerwood Dr; Lake Scene Trl; Manorhill Dr; Moon Rock Dr (Moonrock Dr); Greenwood Oaks Dr; Kingstone Dr; Ave A; Pensgate St; Bay Forest Dr; N Pine Brook Way; Pine Blossom Trl; Greenleaf Ln; Park Estates Ln; Kings Park Ln; D; Heathgate Dr; Sylvan Lake Dr; Lost Rock Dr; Shell Lake Dr; Seawolf Dr; Noble Oak Trl; Village Creek Dr; Chapel Park Way (Chapel Park Ct); Ledgestone Dr; Mossy Elm Ct; Heatherdale Dr; Little Willow Walk; Havenpark Dr; Pleasant Cove Ct; Trowbridge Dr; Seakale Ln; Sand Myrtle Dr; Almond Brook Ln; Avenue E; 3rd St; Walnut Green Dr; Gunwale Rd; Sycamore Lake Rd; Rill Ln; Country Ridge Dr; Poplar Springs Ln; York Brook Dr; Woodcombe Dr; Hollydale Dr; Brookpoint Dr; White Star Dr; Pence Rd; Cherry Mill Ct; Bowsprit Ln; Eldervista Dr; Halewood Dr; Circlewood Way; Winter Knoll Way; Chestnut Springs Ln; Pinecrest Trl; Enchanted Isle Dr; Cyberonics Blvd (Skywalker Dr); Radstock Dr; Village Birch St; Aspen Hills Dr; Country Green Ct; Parkwood Way; Heather Green Dr; Heron Field Ct; Roxton Ridge Dr; Lake Lodge Dr; Montour Dr; Bouldercrest Dr; Stonehaven Dr; Hillside Oak Ln; Woodrail Dr; Shadow Falls Ct; Autumn Canyon Trce; Elder Glen Dr; W Bay Area Blvd; Blossom Bay Dr; Robin Hill Ct; Garden Creek Way; Titan Dr; Castorglen Dr; Bratten Ln; Waybridge Dr; Ivy Grove Dr; Woodside Dr; Knotty Elmwood Trl; Pearhaven Dr; Midbrook Dr; Regents Park (Regents Pk Dr); Tadworth Dr; W el Dorado Blvd; Meadow Grove Trl; Bowline Rd; Baymeadow Dr; Park Circle Way; Hillside Hickory Ct; Jade Meadow Ct; Chestnut Oak Ln; Harvest Ridge Rd; Capstan Rd; Peermont St; Crestbrook Dr; Underwood Creek Way; Oak Cloister Way; Harness Ln; Linfield Way; Emerald Lake Ct; Huntress Ln; Canary Grass Ln; Driftwood Oak Ct (Drift Oak Ct); Manor Hill Dr; Graywood Grove Ln; Arborcrest St; Elm Crest Trl; Kelbrook Dr; Pebble Run; Plumbwood Way; Pine Green Trl; Heather Valley Way; Shadwell Dr; Tresch Ln; Park Center Way; Silver Bough Dr; Sullins Way; Timber Briar Cir; Barleton Way; Westlake Rd; Towering Oak Ct; Finewood Way; Shealy St; Danforth Dr; Barringer Ln; Aspen Knoll Ct; Cardinal Creek Ct; Bramble Way; Water Elm Way; Banff St; Walbrook Dr; Fairwind Dr; Prince Pine Trl; Zabolio Dr; Laurel Valley Dr; Central Park Cir; Runswick Dr; Pinenut Bay Ct; Purple Plum Ln; Ivy Bluff Ct; Town Hill Dr; Heathgate Ct (Heathgate Dr); Dogwood Brook Trl; Providence Pine Trl; Island Oak St; Long Bough Ct; Shannon Ridge Rd; Greens Cove Way; Chedworth Dr; Regal Pine Trl; Plum Glen Ct; Dale Oak Way; Timber Briar Ct; Wilderness Cliff Ct; Round Oak Ct; Conifer Bay Ct; Clear Oak Way; Quiet Spring Ln; Cinnamon Fern Ct; Grand Nugget Ln; Ash Arbor; Brooklet View Ct; Cascade Falls Dr; Elk Park Ln; Canyon Bluff Ct; Greenwood Pines Dr; Mulberry Ridge Way; Apple Knoll Ct; Prairie Brook Ct; Kentwood Dr; Gentle Brook Ct; Placid Brook Ct; Meadowside Dr; Field Springs Ln; Cedarshoals Rd; Kentford Dr; Royal Crst; Partridge Berry Ct; Orchard Falls Dr; Marbledale Ct; Inland Spring Ct; Sunrise Knoll Way; Evergreen Elm Way; Majestic Trl; Doverwood Way; Hazel Ridge Ct; Juniper Forest Ln; Maplewood Falls Ct; Wisteria Hollow Ln; Sterling Wood Way; Prairie Knoll Ct; Beechurst Dr; Mermaid Ln; Hillside Elm St; Viewfield Ct; Valley Acres Rd; Tumbling Falls Ct; Loch Glen Ct; Bay Green Ct; Sweet Cicely Ct; Island Meadow Ct; Boulderwoods Dr; Bay Pointe Ct; Noble Springs Rd; Fallen Leaf Way; Cranbourne Dr; Windy Ridge Ln; Evergreen Elm Ct; Brambling Dr; Ridgewell Dr; Blossom Bay Ct; Jasmine Ridge Ct; Rosebranch Ct; Rockhaven Dr; Palm Grass Ct; Ridgewood Lake Ct; Sparkling Bay Ln; Hidden Date Ct; Dawn Vale Dr; Cottonwood Way; Burwood Way; Sandy Plains Ln; Peachford Ln; Crown Ridge Ct; Island Palm Ct; Berkeley Lake Ln; Montwood Dr; Midfield Glen Ct; Shady Elms Dr; Harvest Brook Ct; Aspen River Ln; Olive Oak Ct; Bright Ember Ct; Village Brook Rd; Virginia Fern Way; Diamond Grove Ct; River Birch Way; Bay Cove Ct; Thor Ln; Heather Falls Way; Coral Sands Dr; Mill Garden Ct; Abbeywood Dr; Tallow Point Ct; Garden Gate Way; Stradbrook Dr; Seaside Ln; Park Green Way; Wendy Hill Way; Wooden Oak Ct; Juniper Canyon Ln; Orchard Peak Ct; Linkshire Dr; Prairie Hill Ct; Stonehill Dr; Millsbridge Dr; Dinerstein Dr; Gold Mesa Trl; Fern Springs Ct; Cherrytree Ridge Ln; Bentshire Way; Pepper Hill Way; Ferndale Dr; University Green Blvd; Rocky Oak Ct; Parkchestor Dr; Turtle Oak Ct; Park Grand Rd; Noble Oak Way; Coastal Oak Ct; Winter Harvest Ct; Tangle Pines Ct; Spring Maple Ln; Meadow Gardens Dr; Deer Grass Ct; Laurel Shadows Ct; Sycamore Grove Dr; Echocliff Way; Bradwell Dr; Forest Bay Ct; Timberland Ct; Boulder Falls Ct; Emerald Falls Ct; Cliffrose Ln; Oakmont Club Ct; Lofty Mountain Ct (Lofty Mountain Trl); Fall Grove Ct; Marymount Way; la Casa Ln; Caprock Dr; Bernard Way; Rolling Run Ct; Apollo Ln (Apollo St); Heather Cove Ct; Town Oaks Dr; Tiffany Ct; Galewood Way; Hennessee Ln; Middlebrook; Basswood Springs Ct; High Castle Ct; Thornwood Ln; Neumann Dr; Ardent Oak Cir; Parsley Hawthorne Ct; Cherry Oak Way; Delta Link; Village Elm St; Lonniewood Dr; Quiet Green Ct; Bentfield Way; Peach Brook Ct; N Dawn Cypress Ct; Amber Knoll Ct; Falmouth Dr; Kemberton Dr; Cherrytree Park Cir; Acorn Wood Way Cir; Knob Creek Ct; Bellgreen Ln; Glenmeade Dr; Redwood Bough Ln; Woodbourne Dr; N Water Iris Ct; Harvest Glen Ct; Crimson Oak Ct; Grand Heights Ct; Gamma Link; Diana Ct; Poplar Run Ct; Loch Creek Ct; Stilesboro Ct; Erin Creek Ct; Tallow Forest Ct; Firthridge Ct; Bay Winds Ct; Bay Isle Ct; Oak Blossom Ct; Amble Oak Ct; Southern Pass Ct; Loblolly Bay Ct; Rustic Harbor Ct; Hartwood Way; Merriweather St; Swanley Ct; Ashmoor Ct; Bentfield Ct; Montvale Dr; Coral Oak Ct; Springfield Rd; Carriage Brook Way; Ashmoor Way; River Maple Ln; Sandgate Falls Ct; Amber Bough Ct; Hunting Hill Dr; Lofty Peak Ln; Heath Hollow Way; Lost Rock Ct; Wickmere Dr; Elm Park Way; Lanswick Dr; Reseda Cir; Cherry Grove Ct; Turtle Bay Dr; Blue Jasmine Ct; Brook Park Way; Pear Brook Trl; Long Bay Ct; S Water Iris Ct; Amble Oak Trl; Deep Oak Ct; N Beechwood Ct; Elk Hill Ct; Fern Grove Ln; de Lay Dr; Pinewood Cove Dr; Golden Field Ct (Golden Field Dr); Delta Wood Ct; Palm Vis; Crown Glen Ct; McConn Ct; Sunlight Way; Red Carriage Ct; S Dawn Cypress Ct; Larkfield Ct; Rippling Creek Way; Bronze Bay Ct; Fernwood Way; Park Center Ct; Newcomb Way; Prince Pine Ct; Brook Arbor Ct; Woodland Haven Rd; Redwood Cove Ct; University; S Beechwood Ct; Evergreen Bay Ct; Hollins Way; Windsor Oaks Ln; Spruce Hollow Ct; Ironbark Ct (Ironbark Dr); Prokop Ct; Orchard Farms Ln; Olive Springs Ct; Erin Knoll Ct; Spring Court Dr; Shealy Ct; Walnut Bridge Ct; Chestnut Oak Way; Orchard Glen Ct; Hazel Oak Ln; Amber Dale Ct; Garden Fern Ct; Sugarplum Ln; Beechurst Ct; Rigger Ln; Wedgerock Dr; Cypress Pond Ct; Crescent Forest Ct; Green Court Dr; Arbor Mill Ct; Tresch Ct; Pinemoor Way; Eldervista Cir; Oak Link Ct; Briarmoor Ct; Misty Grove Ct; Red Coral Ct; Dunhaven Ct; Misty Knoll Ct; Green Ivy Ct; Villa Rose Dr; Leafy Elm Ct; Pine Green Way; N Pine Brook Cove; Jade Green Way; Flowerwood Ct; Radwell Ct; S Pine Brook Cove; Colony Glen Ct; Royal Fern Ct; Briar Falls Ct; Cool Ridge Ct; Craighurst Ct; Radford Park Cir; Tall Elm Ct; Woodcote Ct; Montwood Ct; Hazel Glade Ct; Townboro Dr; Enchanted Isle Ct; Brookford Ct; Burwood Ct; Woodhorn Ct; Castordell Dr; Spring Forest Ct; Hidden Dell Ct; Boulder Point Ct; Pine Fork Ct; Tower River Ct; Pine Heather Ct; Briar Hollow Ct; Haven Park Ct; Tadworth Ct; Dalerose Ct; el Toro Ct; Redwood Run Ct; Cobre Valley Cir; Bramble Hill Ct; Cavendish Ct; Teal Glen Ct; Plum Falls Ct; Wisteria Run Ct; Trowbridge Ct; Redbridge Ct; Hillglen Ct; Youpon Wood Ct; Rangewood Ct; Meadow Manor Ct; Coral Glen Ct; Gold Mesa Ct; Ivy Dell Ct; Firetree Way; Red Bay Ct.
Railroad features: Union Pacific RR.
Other features: Horsepen Byu; Hlp Cnl.
Other features: Turkey Crk; Cow Byu.
Other features: Hoursepen Byu.
Clear Lake neighborhood detailed profile
Area: 22.376 square miles
Population: 50,378
Population density:
| Clear Lake: | 2,251 people per square mile |
| Houston: | 3,947 people per square mile |
Median household income in 2021:
| Clear Lake: | $129,245 |
| Houston: | $55,499 |
Median rent in in 2021:
| Clear Lake: | $1,655 |
| Houston: | $974 |
Male vs Females
| Males: | 23,856 |
| Females: | 26,522 |
Median age
| Males: | 41.4 years |
| Females: | 41.6 years |
Average estimated value of detached houses in 2021 (86.0% of all units):
| Clear Lake: | $227,872 |
| Houston: | $304,685 |
Most popular occupations of males: architecture and engineering occupations (21.4%); sales and office occupations (16.7%); management occupations (except farmers) (11.5%); service occupations (9.3%); business and financial operations occupations (8.3%); computer and mathematical occupations (5.0%); transportation occupations (4.3%)
Most popular occupations of females: sales and office occupations (45.2%); education, training, and library occupations (15.1%); business and financial operations occupations (10.1%); management occupations (except farmers) (7.3%); healthcare practitioners and technical occupations (6.1%); service occupations (6.1%); transportation occupations (2.0%)
Limited-access highways (interstate or state) in this neighborhood: Gulf Fwy (I- 45).
Highways in this neighborhood: Galveston Rd (State Hwy 3); E Nasa Road 1 (E Nasa Pkwy, State Hwy 1).
Roads and streets: Space Center Blvd; Clear Lake City Blvd; Bay Area Blvd; el Dorado Blvd; el Camino Real; Pineloch Dr; FM 2351 (Hastings Friendswood Rd); Diana Ln; Reseda Dr; Saturn Ln; Ramada Dr; Richvale Ln; 2nd St; Genoa Red Bluff Rd; Gemini Ave; Oak Links Ave; Buccaneer Ln; Buoy Rd; Seahorse Dr; Torry Pines Rd; Cobre Valley Dr; Redway Ln; Almond Creek Dr; Penn Hills Ln; Sun Harbor Dr; Wavecrest Ln; Beachcomber Ln; Mabry Mill Rd; Village Dale Ave; Brook Forest Dr; Craighurst Dr; Bay Oaks Blvd; Woodhorn Dr; Bonanza Rd; Eastcape Dr; Larkfield Dr; W Linkage Rd; Saint Cloud Dr; Pipers View Dr; Sea Lark Rd; Laurelfield Dr; Glenwest Dr; la Avenida Dr; Whitcomb Rd; Diamond Brook Dr; Neptune Ln; Acorn Wood Way; FM 2351 N (FM Hwy 2351); 5th St; Clearcrest Dr; Festival Dr; Seafoam Rd; Crescent Landing Dr; Scenic View Dr; Oak Chase Dr; Redwood Bend Trl; Brookvilla Dr; Silverpines Rd; Plum Hollow Dr; Cavendish Dr; Thunder Bay Dr; Brookford Dr; Oak Harbor Dr; Parksley Dr; E Linkage Rd; Sea Liner Dr; Havenhurst Dr; Mill Point Dr; el Toro Ln; College Green Dr; Fairwind Rd; Lofty Mountain Trl; Mesa Verde Dr; Seagate Ln; Hickory Knoll Dr; Spring Forest Dr; Village Evergreen Trl; Willow Heights Ct; Running Springs Dr; Leafy Glen Dr; Falcon Pass; Manor Square Dr; Orchard Country Ln; Brookgreen Dr; Scenic Elm St; Pebbleshire Dr; McConn St; Dunmoor Dr; Blairmont Ln; Scenic Glade Dr; Indian Autumn Trce; Whitlock Dr; Seacliff Dr; Echo Hill Dr; Bay Brook Mall Dr (Baybrook Mall); W Pine Brook Way; Longvale Dr; Hercules Ave; el Dorado Oaks Dr; la Cabana Dr; Locke Haven Dr; Fair Knoll Way; Emerald Falls Dr; Royalfield Dr; Pleasant Valley Rd; Voyager Dr; Holly Trail Dr; Broadlawn Dr; Cedar Ridge Trl; Tresvant Dr; Windom Dr; Baybrook Dr; Fathom Ln; Seamaster Dr; Hillside Falls Trl; Silverman St; Park Center Way (Park Center Dr); Lochnell Dr; Coastal Oak Dr; Golden Field Dr; E Pine Brook Way; Pear Woods Ct; Willow Shores Dr; Escuela; Redbud Valley Trl; Capehill Dr; Seavale Rd; Noble Pine Dr; Ironbark Dr; New Cedars Dr; Evergreen Ridge Way; Golf View Trl; Flowerwood Dr; Lake Scene Trl; Manorhill Dr; Moon Rock Dr (Moonrock Dr); Greenwood Oaks Dr; Kingstone Dr; Ave A; Pensgate St; Bay Forest Dr; N Pine Brook Way; Pine Blossom Trl; Greenleaf Ln; Park Estates Ln; Kings Park Ln; D; Heathgate Dr; Sylvan Lake Dr; Lost Rock Dr; Shell Lake Dr; Seawolf Dr; Noble Oak Trl; Village Creek Dr; Chapel Park Way (Chapel Park Ct); Ledgestone Dr; Mossy Elm Ct; Heatherdale Dr; Little Willow Walk; Havenpark Dr; Pleasant Cove Ct; Trowbridge Dr; Seakale Ln; Sand Myrtle Dr; Almond Brook Ln; Avenue E; 3rd St; Walnut Green Dr; Gunwale Rd; Sycamore Lake Rd; Rill Ln; Country Ridge Dr; Poplar Springs Ln; York Brook Dr; Woodcombe Dr; Hollydale Dr; Brookpoint Dr; White Star Dr; Pence Rd; Cherry Mill Ct; Bowsprit Ln; Eldervista Dr; Halewood Dr; Circlewood Way; Winter Knoll Way; Chestnut Springs Ln; Pinecrest Trl; Enchanted Isle Dr; Cyberonics Blvd (Skywalker Dr); Radstock Dr; Village Birch St; Aspen Hills Dr; Country Green Ct; Parkwood Way; Heather Green Dr; Heron Field Ct; Roxton Ridge Dr; Lake Lodge Dr; Montour Dr; Bouldercrest Dr; Stonehaven Dr; Hillside Oak Ln; Woodrail Dr; Shadow Falls Ct; Autumn Canyon Trce; Elder Glen Dr; W Bay Area Blvd; Blossom Bay Dr; Robin Hill Ct; Garden Creek Way; Titan Dr; Castorglen Dr; Bratten Ln; Waybridge Dr; Ivy Grove Dr; Woodside Dr; Knotty Elmwood Trl; Pearhaven Dr; Midbrook Dr; Regents Park (Regents Pk Dr); Tadworth Dr; W el Dorado Blvd; Meadow Grove Trl; Bowline Rd; Baymeadow Dr; Park Circle Way; Hillside Hickory Ct; Jade Meadow Ct; Chestnut Oak Ln; Harvest Ridge Rd; Capstan Rd; Peermont St; Crestbrook Dr; Underwood Creek Way; Oak Cloister Way; Harness Ln; Linfield Way; Emerald Lake Ct; Huntress Ln; Canary Grass Ln; Driftwood Oak Ct (Drift Oak Ct); Manor Hill Dr; Graywood Grove Ln; Arborcrest St; Elm Crest Trl; Kelbrook Dr; Pebble Run; Plumbwood Way; Pine Green Trl; Heather Valley Way; Shadwell Dr; Tresch Ln; Park Center Way; Silver Bough Dr; Sullins Way; Timber Briar Cir; Barleton Way; Westlake Rd; Towering Oak Ct; Finewood Way; Shealy St; Danforth Dr; Barringer Ln; Aspen Knoll Ct; Cardinal Creek Ct; Bramble Way; Water Elm Way; Banff St; Walbrook Dr; Fairwind Dr; Prince Pine Trl; Zabolio Dr; Laurel Valley Dr; Central Park Cir; Runswick Dr; Pinenut Bay Ct; Purple Plum Ln; Ivy Bluff Ct; Town Hill Dr; Heathgate Ct (Heathgate Dr); Dogwood Brook Trl; Providence Pine Trl; Island Oak St; Long Bough Ct; Shannon Ridge Rd; Greens Cove Way; Chedworth Dr; Regal Pine Trl; Plum Glen Ct; Dale Oak Way; Timber Briar Ct; Wilderness Cliff Ct; Round Oak Ct; Conifer Bay Ct; Clear Oak Way; Quiet Spring Ln; Cinnamon Fern Ct; Grand Nugget Ln; Ash Arbor; Brooklet View Ct; Cascade Falls Dr; Elk Park Ln; Canyon Bluff Ct; Greenwood Pines Dr; Mulberry Ridge Way; Apple Knoll Ct; Prairie Brook Ct; Kentwood Dr; Gentle Brook Ct; Placid Brook Ct; Meadowside Dr; Field Springs Ln; Cedarshoals Rd; Kentford Dr; Royal Crst; Partridge Berry Ct; Orchard Falls Dr; Marbledale Ct; Inland Spring Ct; Sunrise Knoll Way; Evergreen Elm Way; Majestic Trl; Doverwood Way; Hazel Ridge Ct; Juniper Forest Ln; Maplewood Falls Ct; Wisteria Hollow Ln; Sterling Wood Way; Prairie Knoll Ct; Beechurst Dr; Mermaid Ln; Hillside Elm St; Viewfield Ct; Valley Acres Rd; Tumbling Falls Ct; Loch Glen Ct; Bay Green Ct; Sweet Cicely Ct; Island Meadow Ct; Boulderwoods Dr; Bay Pointe Ct; Noble Springs Rd; Fallen Leaf Way; Cranbourne Dr; Windy Ridge Ln; Evergreen Elm Ct; Brambling Dr; Ridgewell Dr; Blossom Bay Ct; Jasmine Ridge Ct; Rosebranch Ct; Rockhaven Dr; Palm Grass Ct; Ridgewood Lake Ct; Sparkling Bay Ln; Hidden Date Ct; Dawn Vale Dr; Cottonwood Way; Burwood Way; Sandy Plains Ln; Peachford Ln; Crown Ridge Ct; Island Palm Ct; Berkeley Lake Ln; Montwood Dr; Midfield Glen Ct; Shady Elms Dr; Harvest Brook Ct; Aspen River Ln; Olive Oak Ct; Bright Ember Ct; Village Brook Rd; Virginia Fern Way; Diamond Grove Ct; River Birch Way; Bay Cove Ct; Thor Ln; Heather Falls Way; Coral Sands Dr; Mill Garden Ct; Abbeywood Dr; Tallow Point Ct; Garden Gate Way; Stradbrook Dr; Seaside Ln; Park Green Way; Wendy Hill Way; Wooden Oak Ct; Juniper Canyon Ln; Orchard Peak Ct; Linkshire Dr; Prairie Hill Ct; Stonehill Dr; Millsbridge Dr; Dinerstein Dr; Gold Mesa Trl; Fern Springs Ct; Cherrytree Ridge Ln; Bentshire Way; Pepper Hill Way; Ferndale Dr; University Green Blvd; Rocky Oak Ct; Parkchestor Dr; Turtle Oak Ct; Park Grand Rd; Noble Oak Way; Coastal Oak Ct; Winter Harvest Ct; Tangle Pines Ct; Spring Maple Ln; Meadow Gardens Dr; Deer Grass Ct; Laurel Shadows Ct; Sycamore Grove Dr; Echocliff Way; Bradwell Dr; Forest Bay Ct; Timberland Ct; Boulder Falls Ct; Emerald Falls Ct; Cliffrose Ln; Oakmont Club Ct; Lofty Mountain Ct (Lofty Mountain Trl); Fall Grove Ct; Marymount Way; la Casa Ln; Caprock Dr; Bernard Way; Rolling Run Ct; Apollo Ln (Apollo St); Heather Cove Ct; Town Oaks Dr; Tiffany Ct; Galewood Way; Hennessee Ln; Middlebrook; Basswood Springs Ct; High Castle Ct; Thornwood Ln; Neumann Dr; Ardent Oak Cir; Parsley Hawthorne Ct; Cherry Oak Way; Delta Link; Village Elm St; Lonniewood Dr; Quiet Green Ct; Bentfield Way; Peach Brook Ct; N Dawn Cypress Ct; Amber Knoll Ct; Falmouth Dr; Kemberton Dr; Cherrytree Park Cir; Acorn Wood Way Cir; Knob Creek Ct; Bellgreen Ln; Glenmeade Dr; Redwood Bough Ln; Woodbourne Dr; N Water Iris Ct; Harvest Glen Ct; Crimson Oak Ct; Grand Heights Ct; Gamma Link; Diana Ct; Poplar Run Ct; Loch Creek Ct; Stilesboro Ct; Erin Creek Ct; Tallow Forest Ct; Firthridge Ct; Bay Winds Ct; Bay Isle Ct; Oak Blossom Ct; Amble Oak Ct; Southern Pass Ct; Loblolly Bay Ct; Rustic Harbor Ct; Hartwood Way; Merriweather St; Swanley Ct; Ashmoor Ct; Bentfield Ct; Montvale Dr; Coral Oak Ct; Springfield Rd; Carriage Brook Way; Ashmoor Way; River Maple Ln; Sandgate Falls Ct; Amber Bough Ct; Hunting Hill Dr; Lofty Peak Ln; Heath Hollow Way; Lost Rock Ct; Wickmere Dr; Elm Park Way; Lanswick Dr; Reseda Cir; Cherry Grove Ct; Turtle Bay Dr; Blue Jasmine Ct; Brook Park Way; Pear Brook Trl; Long Bay Ct; S Water Iris Ct; Amble Oak Trl; Deep Oak Ct; N Beechwood Ct; Elk Hill Ct; Fern Grove Ln; de Lay Dr; Pinewood Cove Dr; Golden Field Ct (Golden Field Dr); Delta Wood Ct; Palm Vis; Crown Glen Ct; McConn Ct; Sunlight Way; Red Carriage Ct; S Dawn Cypress Ct; Larkfield Ct; Rippling Creek Way; Bronze Bay Ct; Fernwood Way; Park Center Ct; Newcomb Way; Prince Pine Ct; Brook Arbor Ct; Woodland Haven Rd; Redwood Cove Ct; University; S Beechwood Ct; Evergreen Bay Ct; Hollins Way; Windsor Oaks Ln; Spruce Hollow Ct; Ironbark Ct (Ironbark Dr); Prokop Ct; Orchard Farms Ln; Olive Springs Ct; Erin Knoll Ct; Spring Court Dr; Shealy Ct; Walnut Bridge Ct; Chestnut Oak Way; Orchard Glen Ct; Hazel Oak Ln; Amber Dale Ct; Garden Fern Ct; Sugarplum Ln; Beechurst Ct; Rigger Ln; Wedgerock Dr; Cypress Pond Ct; Crescent Forest Ct; Green Court Dr; Arbor Mill Ct; Tresch Ct; Pinemoor Way; Eldervista Cir; Oak Link Ct; Briarmoor Ct; Misty Grove Ct; Red Coral Ct; Dunhaven Ct; Misty Knoll Ct; Green Ivy Ct; Villa Rose Dr; Leafy Elm Ct; Pine Green Way; N Pine Brook Cove; Jade Green Way; Flowerwood Ct; Radwell Ct; S Pine Brook Cove; Colony Glen Ct; Royal Fern Ct; Briar Falls Ct; Cool Ridge Ct; Craighurst Ct; Radford Park Cir; Tall Elm Ct; Woodcote Ct; Montwood Ct; Hazel Glade Ct; Townboro Dr; Enchanted Isle Ct; Brookford Ct; Burwood Ct; Woodhorn Ct; Castordell Dr; Spring Forest Ct; Hidden Dell Ct; Boulder Point Ct; Pine Fork Ct; Tower River Ct; Pine Heather Ct; Briar Hollow Ct; Haven Park Ct; Tadworth Ct; Dalerose Ct; el Toro Ct; Redwood Run Ct; Cobre Valley Cir; Bramble Hill Ct; Cavendish Ct; Teal Glen Ct; Plum Falls Ct; Wisteria Run Ct; Trowbridge Ct; Redbridge Ct; Hillglen Ct; Youpon Wood Ct; Rangewood Ct; Meadow Manor Ct; Coral Glen Ct; Gold Mesa Ct; Ivy Dell Ct; Firetree Way; Red Bay Ct.
Railroad features: Union Pacific RR.
Other features: Horsepen Byu; Hlp Cnl.
Other features: Turkey Crk; Cow Byu.
Other features: Hoursepen Byu.
Clear Lake neighborhood detailed profile
Clinton Park neighborhood in Houston statistics: (Find on map)
Area: 2.727 square miles
Population: 3,978
Population density:
Median household income in 2021:
Median rent in in 2021:
Male vs Females
Median age
Most popular occupations of males: material moving occupations (18.6%); service occupations (17.5%); construction, extraction, and maintenance occupations (15.4%); transportation occupations (12.6%); production occupations (12.0%); sales and office occupations (5.5%); education, training, and library occupations (5.0%)
Most popular occupations of females: service occupations (42.3%); sales and office occupations (28.8%); production occupations (8.9%); material moving occupations (6.0%); education, training, and library occupations (5.7%); healthcare practitioners and technical occupations (5.5%); management occupations (except farmers) (1.9%)
Limited-access highways (interstate or state) in this neighborhood: I- 610 (E Loop Fwy).
Roads and streets: Fidelity St; Mississippi St; Clinton Dr; Maxine St; Clinton Park St; North Carolina St; Rhode Island St; Owens St; Calloway St; de Haven St; Pennsylvania St; Bolden St; Midway Blvd (Midway St); Turning Basin Dr; Georgia St; Defender St; Tite St; Teal St; Armstrong St; Fillmore St; Cargill St; Stedman St; Borden St; Gans St; Sol St; Lanewell St; Connecticut St; Veyblum St; Signet St; Cartersville St; Turnbow St; Nedwald St; Bucroft St; Pelsey St; Industrial Dr (Industrial Rd); Delaware St; Racine St; Zachary St; Bennett St; Mimbrough St; Kerr St; Tennessee St; Masterson St; Tuffly St; Clearwater St; New Mexico St; Richcroft St; Garcroft St; Plummer St; Yuma St; New Hampshire St; Mascot St; Defender; Massachusetts St; Harcroft St (Harris St); Hunter.
Railroad features: Southern Pacific RR.
Clinton Park neighborhood detailed profile
Area: 2.727 square miles
Population: 3,978
Population density:
| Clinton Park (Fidelity): | 1,459 people per square mile |
| Houston: | 3,947 people per square mile |
Median household income in 2021:
| Clinton Park (Fidelity): | $30,463 |
| Houston: | $55,499 |
Median rent in in 2021:
| Clinton Park (Fidelity): | $697 |
| Houston: | $974 |
Male vs Females
| Males: | 2,098 |
| Females: | 1,880 |
Median age
| Males: | 36.8 years |
| Females: | 40.6 years |
Most popular occupations of males: material moving occupations (18.6%); service occupations (17.5%); construction, extraction, and maintenance occupations (15.4%); transportation occupations (12.6%); production occupations (12.0%); sales and office occupations (5.5%); education, training, and library occupations (5.0%)
Most popular occupations of females: service occupations (42.3%); sales and office occupations (28.8%); production occupations (8.9%); material moving occupations (6.0%); education, training, and library occupations (5.7%); healthcare practitioners and technical occupations (5.5%); management occupations (except farmers) (1.9%)
Limited-access highways (interstate or state) in this neighborhood: I- 610 (E Loop Fwy).
Roads and streets: Fidelity St; Mississippi St; Clinton Dr; Maxine St; Clinton Park St; North Carolina St; Rhode Island St; Owens St; Calloway St; de Haven St; Pennsylvania St; Bolden St; Midway Blvd (Midway St); Turning Basin Dr; Georgia St; Defender St; Tite St; Teal St; Armstrong St; Fillmore St; Cargill St; Stedman St; Borden St; Gans St; Sol St; Lanewell St; Connecticut St; Veyblum St; Signet St; Cartersville St; Turnbow St; Nedwald St; Bucroft St; Pelsey St; Industrial Dr (Industrial Rd); Delaware St; Racine St; Zachary St; Bennett St; Mimbrough St; Kerr St; Tennessee St; Masterson St; Tuffly St; Clearwater St; New Mexico St; Richcroft St; Garcroft St; Plummer St; Yuma St; New Hampshire St; Mascot St; Defender; Massachusetts St; Harcroft St (Harris St); Hunter.
Railroad features: Southern Pacific RR.
Clinton Park neighborhood detailed profile
Cochran's Crossing` neighborhood in Houston statistics: (Find on map)
Area: 7.949 square miles
Population: 21,265
Population density:
Median household income in 2021:
Median rent in in 2021:
Male vs Females
Median age
Housing prices:
Average estimated value of detached houses in 2021 (92.4% of all units):
Average estimated value of townhouses or other attached units in 2021 (5.5% of all units):
Most popular occupations of males: management occupations (except farmers) (30.8%); sales and office occupations (20.8%); business and financial operations occupations (11.7%); service occupations (6.3%); architecture and engineering occupations (5.7%); education, training, and library occupations (4.7%); computer and mathematical occupations (4.5%)
Most popular occupations of females: sales and office occupations (23.0%); education, training, and library occupations (20.7%); business and financial operations occupations (11.5%); management occupations (except farmers) (10.3%); healthcare practitioners and technical occupations (9.7%); service occupations (9.5%); community and social services occupations (3.1%)
Highways in this neighborhood: College Park Dr (State Hwy 242).
Roads and streets: Cochrans Crossing Dr; Gosling Rd; Research Forest Dr; Lake Woodlands Dr; Woodlands Pkwy; Shadow Bend Pl; Flintridge; Golden Shadow Cir; Rush Haven Dr; Sylvan Forest Dr; Falconwing Dr; Golden Sage Dr; Hollymead Dr; Sandpebble Dr; Chancery Pl; Wisteria Walk Cir; Quiet Oak Cir; Alden Woods; Palmer Woods Dr; E Shadowpoint Cir; Flintridge Dr; Waterford Cir (Waterford Bend); Tree Crest Cir; N Cochrans Green Cir; Treescape Cir; E Amberglow Cir; Wind Ridge Cir; W Sterling Pond Cir; Terraglen Dr; Autumn Cres; W Lost Pond Cir; Silvercresent Cir; E Golden Arrow Cir; Palmer Crst; E Capstone Pl; E Rainbow Ridge Cir; Eagle Rock Cir; Driftoak Cir; W Shadowpoint Cir; S Cochrans Green Cir; N Rushwing Cir; Lakeridge Dr; Spotted Deer Dr; S Chandler Creek Cir; Golden Sunset Cir; Stone Springs Cir; S Peaceful Canyon Cir; N Floral Leaf Cir; Heritage Hill Cir; N Pathfinders Cir; E Coldbrook Cir; S Concord Forest Cir; Trinity Oaks Cir; W Trace Creek Dr; N Castlegreen Cir; Meadowridge Pl; N Chandler Creek Cir; W Amberglow Cir; Tanager Trl; W Trillium Cir; Rockridge Dr; Waterford Lake; N Summer Cloud Dr; Indigo Sky Dr; Fallenstone Dr; John Cooper Dr; Breezy Point Pl; N Concord Forest Cir; W Lake Mist Cir; W Coldbrook Cir; S Flagstone Path Cir; Lyric Arbor Cir; N Golden Arrow Cir; Prides Crossing Dr; E Sterling Pond Cir; N Rainbow Ridge Cir; Sky Terrace Pl; N Heritage Hill Cir; Candle Pine Pl; S Placid Hill Cir; N Copperknoll Cir; Shearwater Pl; Windhaven Dr; E Copper Sage Cir; S Meadowmist Cir; N Silvershine Cir; S Copperknoll Cir; Millennium Forest Dr; W Summer Storm Cir; S Frosted Pond Dr; Flagstone Path; Capstone Cir; E Pathfinders Cir; E Mistybreeze Cir; N Flagstone Path Cir; Cascade Springs Pl; W Horizon Ridge Pl; Cornerbrook Pl; N Thundercreek Pl (Thundercreek Pl); S Floral Leaf Cir; Copperleaf Dr; S Hidden View Cir; N Hunters Xing Cir; Mystic Lake Cir; N Sunny Slope Cir; Somerset Pond Pl; Quail Rock Pl; E Wedgemere Cir; N Indigo Cir; W Eden Elm Cir; W Copper Sage Cir; Gannet Hollow Pl; E Sunny Slope Cir; Edgemire Pl; S Summer Cloud Dr; Palmer Green Pl; E Summer Storm Cir; N Meadowmist Cir; N Morning Cloud Cir; S Castlegreen Cir; E Morning Cloud Cir; S Rushwing Cir; S Indigo Cir; E Trillium Dr; Whinter Wheat Pl; Carillion Pines; E Eden Elm Cir; W Wedgemere Cir; N Wilde Yaupon Cir; E Lake Mist Cir; Aberdeen Crossing Pl; Fire Flicker Pl; Quiet Peace Pl; Meadowspring Cir; S Pathfinders Cir; N Rush Haven Cir; Stonecroft Pl; Hornsilver Pl; S Golden Arrow Cir; S Bonneymead Cir; Golden Pl; Dovewood Pl; W Elm Cres; N Frosted Pond Dr; Otter Pond Pl; W Bonneymead Cir; E Placid Hill Cir; Grand Fairway; E Wilde Yaupon Cir; W Placid Hill Cir; Indian Summer Pl; S Trinity Oaks Cir; E Stony End Pl; Gate Hill Dr; S Regent Oak; Barnstable Pl; Mistflower Pl; Rolling Stone Pl; W Night Heron Pl; Candlenut Pl; Cricket Hollow Pl; Thorn Berry Pl; Mistyhaven Pl; Eagle Rock Pl; Sweetdream Pl; Outervale Pl; Thunder Cove Pl; S Village Knoll Cir; Green Bridge Dr; Gallant Oak Pl; S Indian Sage Cir; Bridgeberry Pl; Shiny Pebble Pl; Stardust Pl; Ivory Moon Pl; N Dragonwood Pl; Frosted Pond Pl; Purple Martin Pl; Night Heron Pl; E Indian Sage Cir; Still Corner Pl; S Rush Haven Cir; E Palmer Bend; E Rumple Creek Pl; Pinepath Pl; Alden Bridge Dr; Summer Storm Pl; Shallow Pond Pl; Plum Blossom Pl; Glenleigh Pl; Silverstrand Pl; Firethorn Pl; W Stony End Pl; E Elm Cres; N Duskwood Pl; W Twinberry Pl; Duskymeadow Pl; Lullwater Pl; Magnolia Shadows Pl; Shady Pond Pl; S Silvershine Cir; Snowbird Pl; Cloudleap Pl; Bough Leaf Pl; Feather Fall Pl; Woodelves Pl; Avonlea Dr; Tender Violet Pl; Lavender Haze Pl; Stargazer Pl; W Palmer Bend; N Peaceful Canyon Cir; Lush Meadow Pl; Cinnamon Teal Pl; Silent Brook Pl; Thunder Hollow Pl; Grand Garden Ct; N Hidden View Cir; Hillside View Pl; W Mistybreeze Cir; Morning Arbor Pl; S Piper Trce; W Rainbow Ridge Cir; Purple Slate Pl; Windfern Pl; N Regent Oak; Cedar Chase Pl; Petalcup Pl; Southern Hunters Xing Cir; Bending Branch Pl; E Bonneymead Cir; Capstone Pl; S Stony Bridge Cir; Wingspan Dr; White Bark Pl; Misted Lilac Pl; Storm Mist Pl; Silver Elm Pl; Hunters Xing Dr; Nightfall Pl; Cypress Bayou Ct; Village Knoll Pl; W Stony Bridge Ct; Agate Stream Pl; Townsend Pl; N Village Knoll Cir; Tealbriar Cir; Shining Lakes Pl; Deerfern Pl; E Cobble Hill Cir; Robin Springs Pl; Sparklewood Pl; Dovetail Pl; Lake Leaf Pl; Bentgrass Pl; S Copper Sage Cir; Summithill Pl; E Stony Bridge Ct; Cargate Ln; Dakota Ridge Pl; W Indian Sage Cir; Cape Jasmine Pl; Scented Path Ln; Tranquil Glade Pl; Batesbrook Ct; Trailhead Pl; E Village Knoll Cir; Bayou Springs Ct; Whistlers Walk Pl; Rushwing Pl; Kearny Brook Pl; Lazy Morning Pl; Pale Dawn Pl; Cottage Grove Pl; Scarlet Sage Pl; Woodmere Pl; Tamarind Pl; Thornbush Pl; Cats Cradle Dr; Irish Moss Pl; Green Slope Pl; Cherry Blossom Pl; Quick Stream Pl; Gilded Pond Pl; Amber Sky Pl; Grey Birch Pl; Day Lily Pl; Speckled Egg Pl; Tall Sky Pl; S Dragonwood Pl; Larks Aire Pl; Twisted Birch Place Ct; Elk Crossing Dr; Crowned Oak Ct; Thistlewood Pl; Bayginger Pl; Willow Run Pl; W Village Knoll Cir; Sheep Meadow Pl; Raintree Pl; Ginger Bay Pl; Firewillow Pl; W Rumple Creek Pl; Maple Loft Pl; Bridgeberry Ct; Gentle Wind Pl; Ivy Pond Pl; S Trace Creek Dr; Moonseed Pl; W Stony Bridge Cir; Windledge Pl; Nightwind Pl; Windstar Dr; Journeys End; E Stony Bridge Cir; Hidden Pond Pl; Glen Canyon Pl; S Avonlea Cir; Biscay Pl; Bank Birch Pl; Crestone Pl; Sandpiper Pl; E Horizon Ridge Pl; N Avonlea Cir; W Wilde Yaupon Cir; S Lakeridge Cir; Eden Elm Pl; Lantern Hollow Pl; Thrush Grove Pl; Twilight Pl; Mallard Glen Pl; Heather Wisp Pl; Linnet Chase Pl; Heathstone Pl; White Fawn Dr; Spiral Leaf Ct; Robin Run Dr; Hawkseye Pl; Twin Springs Pl; Twilight Plain Pl; Forge Hill Pl; Greentwig Pl; Shooting Star Pl; W Palmer Pt; Trinity Oaks Ct; Treestar Pl; Willowcrest Pl; Golden Thrush Pl; S Cobble Hill Cir; E Palmer Pt; Songsparrow Pl; Treevine Ct; S Duskwood Pl; Hickory Hollow Pl; Stormwood Pl; Flat Creek Pl; Pineholly Ct; Pecan Path Dr; Shinyrock Pl; Windfellow Pl; Piper Trce; Raintree Crossing Dr; Greenside Pl; Meadowmist Ct; Painted Canyon Pl; Raindream Pl; N Trace Creek Dr; Windmeadows Pl; Brandenberry Ct; Silver Canyon Pl; Smokerise Pl; Sun Shower Ct; Swiftstream Pl; Hampton Lodge; Windflower Pl; P; Palmer Bend Ct; Rosethorn Pl; Windridge Pl; Skyland Pl; E Trace Creek Dr; Cattail Pl; Sentinel Pl; Taper Glow Pl; Ridgecross Pl; Ambrosia Pl; Maize Meadow Pl; Garland Grove Pl; Craggy Rock (Craggy Rock Pl); Eagle Ter; Roundtop Pl; Cape Jasmine Ct; Lakeridge Ct; Idlewood Dr; Hidden View Pl; Reedy Pond St; Poplar Hill Pl; Seders Walk; Rusty Ridge Pl; Sunbeam Pl; Narrow Creek Pl; Steepbank Dr; Underwood Pl; Early Frost Pl; N Lakeridge Cir; Bear Springs Pl; Marbrook; Highbush Ct; Smoke Wood; Warbler Pl; Palmer Bend Dr; Ashlar Pt; Palmer Crest Ct; Larksberry Pl; E Twinberry Pl; Water Elm Pl; Lantana Trl; Minstral Wind Pl; Abbey Brook Pl; W Cobble Hill Cir; E Lyric Arbor Cir; Wedgemere Dr; Swan Song Pl; Fiddlers Cove Pl; Amber Fire Pl; Chandler Creek Ct; Echo Ridge Dr; Snowbell Pl; Longlake Pl; Stellar Pt; Summerwalk Pl; Whisper Wind Pl; Redhaven Pl; Silvershine Ct; Spring Mist Pl; Twin Feather Pl; Dove Trl; Rosewater Pl; Watermark Way; Archbriar Pl; Midsummer Pl; S Crossed Birch Pl; Rose Petal Pl; Cranberry Bend; N Crossed Birch Pl; E Night Heron Pl; Leaf Trace Ct; Whispy Fern Pl; Meadow Canyon; Thistle Wind Ct; Ivory Pond Pl; Hidden View Dr; Waterbrook Pl; Wandflower Pl; S Lakeridge Dr; Fawnmist Pl; Sterling Pond Ct; Highland Green Pl; Morning Cloud Pl; Sandprint Ct; Rocking Pine Pl; Heather Wisp Ct; Humting Path Pl; Silvercresent Ct; Bryberry Ct; Stony Run Pl; Blue Ginger; Lakeridge Cir; Mystic Valley Ct; Shallow Pond Ct; Sage Ct; Gingerwilde Pl; Treadwell Ct; Hunters Crossing Ct; Windsong Ct; Trillium Ct; Mossy Creek Pl; Winding Creek Pl; Quiet Oak Dr; Ash Branch Ct; Misty Cloud St; Chandler Creek Cir; Mellow Wood Pl; Stony End Ct; Summer Ct; Catfeet Ct; Lapwing Ct; Regent Oak Ct; Plumcove Ct; Meadowspring Ct; Cobble Hill Pl; Emery Cliff Pl; Silent Brook Ct; S Horizon Ridge Ct; Rockridge Ct; Windstar Ct; Moon Beam Ct; Coldbrook Ct; Reedy Pond Ct; Elm Willow Ct; Hidden Deer Corner Ct; Pine Song Pl; Leafsage Ct; S Wilde Yaupon Ct; Jadestone Ct; Peaceful Canyon Ct; Natures Harp Ct; Morning Arbor Ct; Lyric Arbor Ct.
Other features: Bear Br; Panther Br.
Cochran's Crossing` neighborhood detailed profile
Area: 7.949 square miles
Population: 21,265
Population density:
| Cochran's Crossing` (Cochran's Crossing Village): | 2,675 people per square mile |
| Houston: | 3,947 people per square mile |
Median household income in 2021:
| Cochran's Crossing` (Cochran's Crossing Village): | $155,864 |
| Houston: | $55,499 |
Median rent in in 2021:
| Cochran's Crossing` (Cochran's Crossing Village): | $2,133 |
| Houston: | $974 |
Male vs Females
| Males: | 10,555 |
| Females: | 10,709 |
Median age
| Males: | 43.3 years |
| Females: | 44.0 years |
Housing prices:
Average estimated value of detached houses in 2021 (92.4% of all units):
| Cochran's Crossing` (Cochran's Crossing Village): | $368,801 |
| Houston: | $304,685 |
Average estimated value of townhouses or other attached units in 2021 (5.5% of all units):
| This neighborhood: | $190,000 |
| city: | $305,463 |
Most popular occupations of males: management occupations (except farmers) (30.8%); sales and office occupations (20.8%); business and financial operations occupations (11.7%); service occupations (6.3%); architecture and engineering occupations (5.7%); education, training, and library occupations (4.7%); computer and mathematical occupations (4.5%)
Most popular occupations of females: sales and office occupations (23.0%); education, training, and library occupations (20.7%); business and financial operations occupations (11.5%); management occupations (except farmers) (10.3%); healthcare practitioners and technical occupations (9.7%); service occupations (9.5%); community and social services occupations (3.1%)
Highways in this neighborhood: College Park Dr (State Hwy 242).
Roads and streets: Cochrans Crossing Dr; Gosling Rd; Research Forest Dr; Lake Woodlands Dr; Woodlands Pkwy; Shadow Bend Pl; Flintridge; Golden Shadow Cir; Rush Haven Dr; Sylvan Forest Dr; Falconwing Dr; Golden Sage Dr; Hollymead Dr; Sandpebble Dr; Chancery Pl; Wisteria Walk Cir; Quiet Oak Cir; Alden Woods; Palmer Woods Dr; E Shadowpoint Cir; Flintridge Dr; Waterford Cir (Waterford Bend); Tree Crest Cir; N Cochrans Green Cir; Treescape Cir; E Amberglow Cir; Wind Ridge Cir; W Sterling Pond Cir; Terraglen Dr; Autumn Cres; W Lost Pond Cir; Silvercresent Cir; E Golden Arrow Cir; Palmer Crst; E Capstone Pl; E Rainbow Ridge Cir; Eagle Rock Cir; Driftoak Cir; W Shadowpoint Cir; S Cochrans Green Cir; N Rushwing Cir; Lakeridge Dr; Spotted Deer Dr; S Chandler Creek Cir; Golden Sunset Cir; Stone Springs Cir; S Peaceful Canyon Cir; N Floral Leaf Cir; Heritage Hill Cir; N Pathfinders Cir; E Coldbrook Cir; S Concord Forest Cir; Trinity Oaks Cir; W Trace Creek Dr; N Castlegreen Cir; Meadowridge Pl; N Chandler Creek Cir; W Amberglow Cir; Tanager Trl; W Trillium Cir; Rockridge Dr; Waterford Lake; N Summer Cloud Dr; Indigo Sky Dr; Fallenstone Dr; John Cooper Dr; Breezy Point Pl; N Concord Forest Cir; W Lake Mist Cir; W Coldbrook Cir; S Flagstone Path Cir; Lyric Arbor Cir; N Golden Arrow Cir; Prides Crossing Dr; E Sterling Pond Cir; N Rainbow Ridge Cir; Sky Terrace Pl; N Heritage Hill Cir; Candle Pine Pl; S Placid Hill Cir; N Copperknoll Cir; Shearwater Pl; Windhaven Dr; E Copper Sage Cir; S Meadowmist Cir; N Silvershine Cir; S Copperknoll Cir; Millennium Forest Dr; W Summer Storm Cir; S Frosted Pond Dr; Flagstone Path; Capstone Cir; E Pathfinders Cir; E Mistybreeze Cir; N Flagstone Path Cir; Cascade Springs Pl; W Horizon Ridge Pl; Cornerbrook Pl; N Thundercreek Pl (Thundercreek Pl); S Floral Leaf Cir; Copperleaf Dr; S Hidden View Cir; N Hunters Xing Cir; Mystic Lake Cir; N Sunny Slope Cir; Somerset Pond Pl; Quail Rock Pl; E Wedgemere Cir; N Indigo Cir; W Eden Elm Cir; W Copper Sage Cir; Gannet Hollow Pl; E Sunny Slope Cir; Edgemire Pl; S Summer Cloud Dr; Palmer Green Pl; E Summer Storm Cir; N Meadowmist Cir; N Morning Cloud Cir; S Castlegreen Cir; E Morning Cloud Cir; S Rushwing Cir; S Indigo Cir; E Trillium Dr; Whinter Wheat Pl; Carillion Pines; E Eden Elm Cir; W Wedgemere Cir; N Wilde Yaupon Cir; E Lake Mist Cir; Aberdeen Crossing Pl; Fire Flicker Pl; Quiet Peace Pl; Meadowspring Cir; S Pathfinders Cir; N Rush Haven Cir; Stonecroft Pl; Hornsilver Pl; S Golden Arrow Cir; S Bonneymead Cir; Golden Pl; Dovewood Pl; W Elm Cres; N Frosted Pond Dr; Otter Pond Pl; W Bonneymead Cir; E Placid Hill Cir; Grand Fairway; E Wilde Yaupon Cir; W Placid Hill Cir; Indian Summer Pl; S Trinity Oaks Cir; E Stony End Pl; Gate Hill Dr; S Regent Oak; Barnstable Pl; Mistflower Pl; Rolling Stone Pl; W Night Heron Pl; Candlenut Pl; Cricket Hollow Pl; Thorn Berry Pl; Mistyhaven Pl; Eagle Rock Pl; Sweetdream Pl; Outervale Pl; Thunder Cove Pl; S Village Knoll Cir; Green Bridge Dr; Gallant Oak Pl; S Indian Sage Cir; Bridgeberry Pl; Shiny Pebble Pl; Stardust Pl; Ivory Moon Pl; N Dragonwood Pl; Frosted Pond Pl; Purple Martin Pl; Night Heron Pl; E Indian Sage Cir; Still Corner Pl; S Rush Haven Cir; E Palmer Bend; E Rumple Creek Pl; Pinepath Pl; Alden Bridge Dr; Summer Storm Pl; Shallow Pond Pl; Plum Blossom Pl; Glenleigh Pl; Silverstrand Pl; Firethorn Pl; W Stony End Pl; E Elm Cres; N Duskwood Pl; W Twinberry Pl; Duskymeadow Pl; Lullwater Pl; Magnolia Shadows Pl; Shady Pond Pl; S Silvershine Cir; Snowbird Pl; Cloudleap Pl; Bough Leaf Pl; Feather Fall Pl; Woodelves Pl; Avonlea Dr; Tender Violet Pl; Lavender Haze Pl; Stargazer Pl; W Palmer Bend; N Peaceful Canyon Cir; Lush Meadow Pl; Cinnamon Teal Pl; Silent Brook Pl; Thunder Hollow Pl; Grand Garden Ct; N Hidden View Cir; Hillside View Pl; W Mistybreeze Cir; Morning Arbor Pl; S Piper Trce; W Rainbow Ridge Cir; Purple Slate Pl; Windfern Pl; N Regent Oak; Cedar Chase Pl; Petalcup Pl; Southern Hunters Xing Cir; Bending Branch Pl; E Bonneymead Cir; Capstone Pl; S Stony Bridge Cir; Wingspan Dr; White Bark Pl; Misted Lilac Pl; Storm Mist Pl; Silver Elm Pl; Hunters Xing Dr; Nightfall Pl; Cypress Bayou Ct; Village Knoll Pl; W Stony Bridge Ct; Agate Stream Pl; Townsend Pl; N Village Knoll Cir; Tealbriar Cir; Shining Lakes Pl; Deerfern Pl; E Cobble Hill Cir; Robin Springs Pl; Sparklewood Pl; Dovetail Pl; Lake Leaf Pl; Bentgrass Pl; S Copper Sage Cir; Summithill Pl; E Stony Bridge Ct; Cargate Ln; Dakota Ridge Pl; W Indian Sage Cir; Cape Jasmine Pl; Scented Path Ln; Tranquil Glade Pl; Batesbrook Ct; Trailhead Pl; E Village Knoll Cir; Bayou Springs Ct; Whistlers Walk Pl; Rushwing Pl; Kearny Brook Pl; Lazy Morning Pl; Pale Dawn Pl; Cottage Grove Pl; Scarlet Sage Pl; Woodmere Pl; Tamarind Pl; Thornbush Pl; Cats Cradle Dr; Irish Moss Pl; Green Slope Pl; Cherry Blossom Pl; Quick Stream Pl; Gilded Pond Pl; Amber Sky Pl; Grey Birch Pl; Day Lily Pl; Speckled Egg Pl; Tall Sky Pl; S Dragonwood Pl; Larks Aire Pl; Twisted Birch Place Ct; Elk Crossing Dr; Crowned Oak Ct; Thistlewood Pl; Bayginger Pl; Willow Run Pl; W Village Knoll Cir; Sheep Meadow Pl; Raintree Pl; Ginger Bay Pl; Firewillow Pl; W Rumple Creek Pl; Maple Loft Pl; Bridgeberry Ct; Gentle Wind Pl; Ivy Pond Pl; S Trace Creek Dr; Moonseed Pl; W Stony Bridge Cir; Windledge Pl; Nightwind Pl; Windstar Dr; Journeys End; E Stony Bridge Cir; Hidden Pond Pl; Glen Canyon Pl; S Avonlea Cir; Biscay Pl; Bank Birch Pl; Crestone Pl; Sandpiper Pl; E Horizon Ridge Pl; N Avonlea Cir; W Wilde Yaupon Cir; S Lakeridge Cir; Eden Elm Pl; Lantern Hollow Pl; Thrush Grove Pl; Twilight Pl; Mallard Glen Pl; Heather Wisp Pl; Linnet Chase Pl; Heathstone Pl; White Fawn Dr; Spiral Leaf Ct; Robin Run Dr; Hawkseye Pl; Twin Springs Pl; Twilight Plain Pl; Forge Hill Pl; Greentwig Pl; Shooting Star Pl; W Palmer Pt; Trinity Oaks Ct; Treestar Pl; Willowcrest Pl; Golden Thrush Pl; S Cobble Hill Cir; E Palmer Pt; Songsparrow Pl; Treevine Ct; S Duskwood Pl; Hickory Hollow Pl; Stormwood Pl; Flat Creek Pl; Pineholly Ct; Pecan Path Dr; Shinyrock Pl; Windfellow Pl; Piper Trce; Raintree Crossing Dr; Greenside Pl; Meadowmist Ct; Painted Canyon Pl; Raindream Pl; N Trace Creek Dr; Windmeadows Pl; Brandenberry Ct; Silver Canyon Pl; Smokerise Pl; Sun Shower Ct; Swiftstream Pl; Hampton Lodge; Windflower Pl; P; Palmer Bend Ct; Rosethorn Pl; Windridge Pl; Skyland Pl; E Trace Creek Dr; Cattail Pl; Sentinel Pl; Taper Glow Pl; Ridgecross Pl; Ambrosia Pl; Maize Meadow Pl; Garland Grove Pl; Craggy Rock (Craggy Rock Pl); Eagle Ter; Roundtop Pl; Cape Jasmine Ct; Lakeridge Ct; Idlewood Dr; Hidden View Pl; Reedy Pond St; Poplar Hill Pl; Seders Walk; Rusty Ridge Pl; Sunbeam Pl; Narrow Creek Pl; Steepbank Dr; Underwood Pl; Early Frost Pl; N Lakeridge Cir; Bear Springs Pl; Marbrook; Highbush Ct; Smoke Wood; Warbler Pl; Palmer Bend Dr; Ashlar Pt; Palmer Crest Ct; Larksberry Pl; E Twinberry Pl; Water Elm Pl; Lantana Trl; Minstral Wind Pl; Abbey Brook Pl; W Cobble Hill Cir; E Lyric Arbor Cir; Wedgemere Dr; Swan Song Pl; Fiddlers Cove Pl; Amber Fire Pl; Chandler Creek Ct; Echo Ridge Dr; Snowbell Pl; Longlake Pl; Stellar Pt; Summerwalk Pl; Whisper Wind Pl; Redhaven Pl; Silvershine Ct; Spring Mist Pl; Twin Feather Pl; Dove Trl; Rosewater Pl; Watermark Way; Archbriar Pl; Midsummer Pl; S Crossed Birch Pl; Rose Petal Pl; Cranberry Bend; N Crossed Birch Pl; E Night Heron Pl; Leaf Trace Ct; Whispy Fern Pl; Meadow Canyon; Thistle Wind Ct; Ivory Pond Pl; Hidden View Dr; Waterbrook Pl; Wandflower Pl; S Lakeridge Dr; Fawnmist Pl; Sterling Pond Ct; Highland Green Pl; Morning Cloud Pl; Sandprint Ct; Rocking Pine Pl; Heather Wisp Ct; Humting Path Pl; Silvercresent Ct; Bryberry Ct; Stony Run Pl; Blue Ginger; Lakeridge Cir; Mystic Valley Ct; Shallow Pond Ct; Sage Ct; Gingerwilde Pl; Treadwell Ct; Hunters Crossing Ct; Windsong Ct; Trillium Ct; Mossy Creek Pl; Winding Creek Pl; Quiet Oak Dr; Ash Branch Ct; Misty Cloud St; Chandler Creek Cir; Mellow Wood Pl; Stony End Ct; Summer Ct; Catfeet Ct; Lapwing Ct; Regent Oak Ct; Plumcove Ct; Meadowspring Ct; Cobble Hill Pl; Emery Cliff Pl; Silent Brook Ct; S Horizon Ridge Ct; Rockridge Ct; Windstar Ct; Moon Beam Ct; Coldbrook Ct; Reedy Pond Ct; Elm Willow Ct; Hidden Deer Corner Ct; Pine Song Pl; Leafsage Ct; S Wilde Yaupon Ct; Jadestone Ct; Peaceful Canyon Ct; Natures Harp Ct; Morning Arbor Ct; Lyric Arbor Ct.
Other features: Bear Br; Panther Br.
Cochran's Crossing` neighborhood detailed profile
College Court Place neighborhood in Houston statistics: (Find on map)
Area: 0.177 square miles
Population: 2,623
Population density:
Median household income in 2021:
Median rent in in 2021:
Male vs Females
Median age
Average estimated value of detached houses in 2021 (100.0% of all units):
Most popular occupations of males: business and financial operations occupations (40.2%); management occupations (except farmers) (22.3%); architecture and engineering occupations (9.8%); education, training, and library occupations (7.0%); healthcare practitioners and technical occupations (6.2%); arts, design, entertainment, sports, and media occupations (3.1%); transportation occupations (3.1%)
Most popular occupations of females: sales and office occupations (24.5%); healthcare practitioners and technical occupations (20.5%); legal occupations (17.7%); management occupations (except farmers) (14.9%); education, training, and library occupations (10.0%); business and financial operations occupations (8.4%); service occupations (4.0%)
Roads and streets: Academy St; Fairmont St; Weslayan St; Community Dr; Dartmouth St; Albans Rd; Judson St; Emory St; Sunset Blvd; Lehigh St; Drake St; Law St; Childress St; Purdue St; S Judson St; Bissonnet St; Simmons St.
College Court Place neighborhood detailed profile
Area: 0.177 square miles
Population: 2,623
Population density:
| College Court Place: | 14,823 people per square mile |
| Houston: | 3,947 people per square mile |
Median household income in 2021:
| College Court Place: | $225,865 |
| Houston: | $55,499 |
Median rent in in 2021:
| College Court Place: | $2,125 |
| Houston: | $974 |
Male vs Females
| Males: | 1,204 |
| Females: | 1,419 |
Median age
| Males: | 40.5 years |
| Females: | 42.5 years |
Average estimated value of detached houses in 2021 (100.0% of all units):
| College Court Place: | $1,130,868 |
| Houston: | $304,685 |
Most popular occupations of males: business and financial operations occupations (40.2%); management occupations (except farmers) (22.3%); architecture and engineering occupations (9.8%); education, training, and library occupations (7.0%); healthcare practitioners and technical occupations (6.2%); arts, design, entertainment, sports, and media occupations (3.1%); transportation occupations (3.1%)
Most popular occupations of females: sales and office occupations (24.5%); healthcare practitioners and technical occupations (20.5%); legal occupations (17.7%); management occupations (except farmers) (14.9%); education, training, and library occupations (10.0%); business and financial operations occupations (8.4%); service occupations (4.0%)
Roads and streets: Academy St; Fairmont St; Weslayan St; Community Dr; Dartmouth St; Albans Rd; Judson St; Emory St; Sunset Blvd; Lehigh St; Drake St; Law St; Childress St; Purdue St; S Judson St; Bissonnet St; Simmons St.
College Court Place neighborhood detailed profile
College Park neighborhood in Houston statistics: (Find on map)
Area: 2.776 square miles
Limited-access highways (interstate or state) in this neighborhood: I- 45.
Highways in this neighborhood: College Park Dr (State Hwy 242).
Roads and streets: College Square Dr; Schoettle Rd; Driveway Dr; Koenig Ln; Lake Windsor Cir; Pine Acres Dr; E Northcastle Cir; Robindale Cir; Windsor Hills Dr; W Northcastle Cir; Pine Acres Rd; Brass Nail Rd; W Lilac Ridge Pl; Johnson-Martin Rd; W Lilac Ridge Ct; Charter Club Dr (Goldenberry Dr); Golden Berry Dr; W Windsor Hills Cir; E Windsor Hills Cir; Victoria Glen Dr; Wilmington Way; E Royal Mews; Veranda View Pl; Surrey Run Pl; Paddington Way; Bendrook Loop; Charter Club Dr; Carriage House Way; S Bendrook Loop; Sovereign Way; Lilac Ridge Pl; Wrenfield Pl; Country Gate Cir; N Bendrook Loop; Arcadia Way; Meadowhawk Pl; Sandingham Way; N Country Gate Cir; London Green; Barkley Park Ct; Bloomsbury Ct; Northcastle Ct; Edinburgh Ct; Claridge Oak Ct; Shannon Green Ct; Windsor Lakes Dr.
Other features: Harpers Horsepen Br.
College Park neighborhood detailed profile
Colonial Terrace neighborhood in Houston statistics: (Find on map)
Area: 0.401 square miles
Population: 4,556
Population density:
Median household income in 2021:
Median rent in in 2021:
Male vs Females
Median age
Housing prices:
Average estimated value of detached houses in 2021 (97.6% of all units):
Average estimated value of townhouses or other attached units in 2021 (6.6% of all units):
Most popular occupations of males: management occupations (except farmers) (20.2%); healthcare practitioners and technical occupations (16.1%); sales and office occupations (13.6%); business and financial operations occupations (12.0%); architecture and engineering occupations (11.7%); legal occupations (9.0%); education, training, and library occupations (5.9%)
Most popular occupations of females: management occupations (except farmers) (25.1%); healthcare practitioners and technical occupations (20.0%); business and financial operations occupations (16.5%); service occupations (10.3%); sales and office occupations (8.1%); architecture and engineering occupations (5.8%); legal occupations (5.5%)
Roads and streets: Academy St; Weslayan St; W Point St; Community Dr; Amherst St; Marquette St; Byron St; Coleridge St; Bellaire Blvd; Swarthmore St; Rice Blvd; Villanova St; Milton St; University Blvd; Southwestern St; Tennyson St; Ruskin St; Case St; Oberlin St; Riley St; Bissonnet St; Fairhaven St; Marlowe St; Cason St; Browning St; Arnold St; Jane Austen St; Spelman St.
Railroad features: Southern Pacific RR.
Colonial Terrace neighborhood detailed profile
Area: 0.401 square miles
Population: 4,556
Population density:
| Colonial Terrace: | 11,354 people per square mile |
| Houston: | 3,947 people per square mile |
Median household income in 2021:
| Colonial Terrace: | $214,749 |
| Houston: | $55,499 |
Median rent in in 2021:
| Colonial Terrace: | $2,181 |
| Houston: | $974 |
Male vs Females
| Males: | 2,132 |
| Females: | 2,423 |
Median age
| Males: | 44.1 years |
| Females: | 43.8 years |
Housing prices:
Average estimated value of detached houses in 2021 (97.6% of all units):
| Colonial Terrace: | $1,042,543 |
| Houston: | $304,685 |
Average estimated value of townhouses or other attached units in 2021 (6.6% of all units):
| This neighborhood: | $333,869 |
| city: | $305,463 |
Most popular occupations of males: management occupations (except farmers) (20.2%); healthcare practitioners and technical occupations (16.1%); sales and office occupations (13.6%); business and financial operations occupations (12.0%); architecture and engineering occupations (11.7%); legal occupations (9.0%); education, training, and library occupations (5.9%)
Most popular occupations of females: management occupations (except farmers) (25.1%); healthcare practitioners and technical occupations (20.0%); business and financial operations occupations (16.5%); service occupations (10.3%); sales and office occupations (8.1%); architecture and engineering occupations (5.8%); legal occupations (5.5%)
Roads and streets: Academy St; Weslayan St; W Point St; Community Dr; Amherst St; Marquette St; Byron St; Coleridge St; Bellaire Blvd; Swarthmore St; Rice Blvd; Villanova St; Milton St; University Blvd; Southwestern St; Tennyson St; Ruskin St; Case St; Oberlin St; Riley St; Bissonnet St; Fairhaven St; Marlowe St; Cason St; Browning St; Arnold St; Jane Austen St; Spelman St.
Railroad features: Southern Pacific RR.
Colonial Terrace neighborhood detailed profile
Creekside Park neighborhood in Houston statistics: (Find on map)
Area: 11.540 square miles
Population: 6,885
Population density:
Median household income in 2021:
Median rent in in 2021:
Male vs Females
Median age
Most popular occupations of males: management occupations (except farmers) (24.7%); sales and office occupations (18.2%); life, physical, and social science occupations (10.2%); production occupations (9.9%); business and financial operations occupations (9.0%); legal occupations (7.7%); healthcare practitioners and technical occupations (7.0%)
Most popular occupations of females: education, training, and library occupations (42.5%); management occupations (except farmers) (15.2%); service occupations (11.2%); business and financial operations occupations (9.3%); healthcare practitioners and technical occupations (7.3%); community and social services occupations (6.4%); sales and office occupations (6.0%)
Roads and streets: Kuykendahl Rd; Gosling Rd; Root Rd; Northcrest Dr; Wagon Rd; Indian Hills Rd; Creek Wood Dr (Creekwood Dr); Creekview Dr; Pine Cone Ranch Rd; Coventry Blvd; Wellington Court Blvd; Lenze Rd; Bayonne Dr; W Rayford Rd; Darby Way; Inway Dr; Willowcreek Stables Rd; Augusta Pines Dr; Pine Knot Rd; Elmgrove Rd; Glenhill Dr; Craigway Rd; Haverford Rd; Hampton Oaks Dr; Dovershire; Allentown Dr; Hickory Crest Dr; London Town Dr; Northampton Forest Dr; Timbercrest Village Dr; Fawnwood Dr; London Town Pl; Larkmount Dr; Woodsong Ln; Northway Dr; Greshams Rd; Butterwick Dr; Black Forest Dr; Levi Rd; Alderley Dr; Giltspur Way; Cinnamon Run; Knollview Dr; Danehill Dr; Ginger Dr; Jadecrest; Northampton Pines Dr; Pinecrest Dr; Rolling Oaks Dr; Trembling Oaks Dr; Augusta Pines Pkwy W; Baywick Dr; Forestcrest Dr; Hideaway Lake Cir; Stonehaven Dr; Metzler Creek Dr; London Way Dr; Barmby Dr; Casa del Sol; Norchester Way; Post Bridge Rd; Bovington Dr; Elmfield Dr; Wooded Way Dr; Sands Terrace Ln; Pampas St; Red Oak Dr; Deer Trail Dr; Oak Castle Dr; Stonesfield Pl; Aughton Dr; Drybrook Rd; Dover House Way; Hampton Forest Ln; Willow Switch Rd; Rolling Oaks Dr S; Meadowtrace Dr; Burgh Castle Dr; Hennessy Ln; Fox Run St; Rolling Oaks Dr N; Painton Ln; Creewood; Standing Oak Dr; Falling Oaks St; Shalford Dr; Nicholforest Ln; Overcup Dr; Brick Hill Dr (Brickhill Dr); Kennington Way; Razorback Dr; Kyren Ln; Course View Ln; Kingscrest Ln; Cow Oak Dr; Collingtree Dr; Dowdell Rd; Twin Oaks Dr; Kingsdown Dr; Sussex Ct; Ward Ln; N Oak Forest Ln (Northoak Forest Ln); Butler Oaks Ct; E Kingscrest Cir; Longstone Rd; Pin Oak Dr; Hampton Way Ct; Sugar Leaf Trl; Jadecrest Ct; W Kingscrest Cir; Squirecrest Dr; Willow Crest Ct; Lakeview; Falling Oak Dr; Hawn Rd; Elberry Rd; Charrington Dr; Elmley Pl; Barronton Dr; Morning Crest Ct; Dowcrest Dr; Etchstone Dr; Kirston Dr; Piney Bend Ct; Amwell Rd; Belle Vernon Dr; Aspen Cir; Elmwood Ct; Beufort Way; Ambercrest Dr; Ammick Ct; Youpon Ln; Amersham Ct; Bridgeway (Bridge Way); Taylor Way; Calumet; Masters Trace Ln; Still Meadow St; Northampton Terrace Dr; Hampton Ct; Berry Ln; Squires Ct; Pine Ln; Rettendon Ct; Inway Oaks Dr; Clara Ct; Inway Trails Dr; Stratmor Ct; Hedgeton Ct; Haughton Ct; Long Iron Ct; Barmby Ct; Pampas St (Pampas Dr); Ashwell Ct; Canston Ct; Briarhorn Dr; Haughton Dr; Reddleston Ct; Aughton Ct; Abbey Ct; Shalford Ct; Arbroath Ct; Dover Way; Langley Rd; Courseview Ct; Ambercrest Ct; Lazy Ln; Crossen Ln; Malac Rd; Fairidge Ct; Hildebrandt Rd; Steeple Canyon Rd; Timber Nook Ct; Brickhill Rd; W Manor Cir; Larmount.
Railroad features: Union Pacific RR.
Other features: Willow Crk; Lazy Strm; Hughes Gully Willow Crk; Cannon Gully Willow Crk; Spring Crk.
Roads and streets: Wagon Rd.
Other features: Spring Crk.
Creekside Park neighborhood detailed profile
Area: 11.540 square miles
Population: 6,885
Population density:
| Creekside Park (Village of Creekside Park): | 597 people per square mile |
| Houston: | 3,947 people per square mile |
Median household income in 2021:
| Creekside Park (Village of Creekside Park): | $117,738 |
| Houston: | $55,499 |
Median rent in in 2021:
| Creekside Park (Village of Creekside Park): | $2,472 |
| Houston: | $974 |
Male vs Females
| Males: | 2,291 |
| Females: | 4,594 |
Median age
| Males: | 35.5 years |
| Females: | 30.6 years |
Most popular occupations of males: management occupations (except farmers) (24.7%); sales and office occupations (18.2%); life, physical, and social science occupations (10.2%); production occupations (9.9%); business and financial operations occupations (9.0%); legal occupations (7.7%); healthcare practitioners and technical occupations (7.0%)
Most popular occupations of females: education, training, and library occupations (42.5%); management occupations (except farmers) (15.2%); service occupations (11.2%); business and financial operations occupations (9.3%); healthcare practitioners and technical occupations (7.3%); community and social services occupations (6.4%); sales and office occupations (6.0%)
Roads and streets: Kuykendahl Rd; Gosling Rd; Root Rd; Northcrest Dr; Wagon Rd; Indian Hills Rd; Creek Wood Dr (Creekwood Dr); Creekview Dr; Pine Cone Ranch Rd; Coventry Blvd; Wellington Court Blvd; Lenze Rd; Bayonne Dr; W Rayford Rd; Darby Way; Inway Dr; Willowcreek Stables Rd; Augusta Pines Dr; Pine Knot Rd; Elmgrove Rd; Glenhill Dr; Craigway Rd; Haverford Rd; Hampton Oaks Dr; Dovershire; Allentown Dr; Hickory Crest Dr; London Town Dr; Northampton Forest Dr; Timbercrest Village Dr; Fawnwood Dr; London Town Pl; Larkmount Dr; Woodsong Ln; Northway Dr; Greshams Rd; Butterwick Dr; Black Forest Dr; Levi Rd; Alderley Dr; Giltspur Way; Cinnamon Run; Knollview Dr; Danehill Dr; Ginger Dr; Jadecrest; Northampton Pines Dr; Pinecrest Dr; Rolling Oaks Dr; Trembling Oaks Dr; Augusta Pines Pkwy W; Baywick Dr; Forestcrest Dr; Hideaway Lake Cir; Stonehaven Dr; Metzler Creek Dr; London Way Dr; Barmby Dr; Casa del Sol; Norchester Way; Post Bridge Rd; Bovington Dr; Elmfield Dr; Wooded Way Dr; Sands Terrace Ln; Pampas St; Red Oak Dr; Deer Trail Dr; Oak Castle Dr; Stonesfield Pl; Aughton Dr; Drybrook Rd; Dover House Way; Hampton Forest Ln; Willow Switch Rd; Rolling Oaks Dr S; Meadowtrace Dr; Burgh Castle Dr; Hennessy Ln; Fox Run St; Rolling Oaks Dr N; Painton Ln; Creewood; Standing Oak Dr; Falling Oaks St; Shalford Dr; Nicholforest Ln; Overcup Dr; Brick Hill Dr (Brickhill Dr); Kennington Way; Razorback Dr; Kyren Ln; Course View Ln; Kingscrest Ln; Cow Oak Dr; Collingtree Dr; Dowdell Rd; Twin Oaks Dr; Kingsdown Dr; Sussex Ct; Ward Ln; N Oak Forest Ln (Northoak Forest Ln); Butler Oaks Ct; E Kingscrest Cir; Longstone Rd; Pin Oak Dr; Hampton Way Ct; Sugar Leaf Trl; Jadecrest Ct; W Kingscrest Cir; Squirecrest Dr; Willow Crest Ct; Lakeview; Falling Oak Dr; Hawn Rd; Elberry Rd; Charrington Dr; Elmley Pl; Barronton Dr; Morning Crest Ct; Dowcrest Dr; Etchstone Dr; Kirston Dr; Piney Bend Ct; Amwell Rd; Belle Vernon Dr; Aspen Cir; Elmwood Ct; Beufort Way; Ambercrest Dr; Ammick Ct; Youpon Ln; Amersham Ct; Bridgeway (Bridge Way); Taylor Way; Calumet; Masters Trace Ln; Still Meadow St; Northampton Terrace Dr; Hampton Ct; Berry Ln; Squires Ct; Pine Ln; Rettendon Ct; Inway Oaks Dr; Clara Ct; Inway Trails Dr; Stratmor Ct; Hedgeton Ct; Haughton Ct; Long Iron Ct; Barmby Ct; Pampas St (Pampas Dr); Ashwell Ct; Canston Ct; Briarhorn Dr; Haughton Dr; Reddleston Ct; Aughton Ct; Abbey Ct; Shalford Ct; Arbroath Ct; Dover Way; Langley Rd; Courseview Ct; Ambercrest Ct; Lazy Ln; Crossen Ln; Malac Rd; Fairidge Ct; Hildebrandt Rd; Steeple Canyon Rd; Timber Nook Ct; Brickhill Rd; W Manor Cir; Larmount.
Railroad features: Union Pacific RR.
Other features: Willow Crk; Lazy Strm; Hughes Gully Willow Crk; Cannon Gully Willow Crk; Spring Crk.
Roads and streets: Wagon Rd.
Other features: Spring Crk.
Creekside Park neighborhood detailed profile
Cunningham Terrace neighborhood in Houston statistics: (Find on map)
Area: 0.031 square miles
Population: 292
Population density:
Median household income in 2021:
Median rent in in 2021:
Male vs Females
Median age
Housing prices:
Average estimated value of detached houses in 2021 (87.3% of all units):
Average estimated value of townhouses or other attached units in 2021 (14.4% of all units):
Most popular occupations of males: management occupations (except farmers) (34.0%); healthcare practitioners and technical occupations (23.2%); sales and office occupations (18.9%); legal occupations (6.6%); material moving occupations (4.9%); business and financial operations occupations (4.7%); service occupations (3.4%)
Most popular occupations of females: management occupations (except farmers) (29.9%); healthcare practitioners and technical occupations (18.7%); service occupations (17.2%); sales and office occupations (13.4%); legal occupations (11.8%); arts, design, entertainment, sports, and media occupations (3.1%); business and financial operations occupations (2.5%)
Roads and streets: Bellaire Blvd; Auden St.
Cunningham Terrace neighborhood detailed profile
Area: 0.031 square miles
Population: 292
Population density:
| Cunningham Terrace: | 9,441 people per square mile |
| Houston: | 3,947 people per square mile |
Median household income in 2021:
| Cunningham Terrace: | $209,613 |
| Houston: | $55,499 |
Median rent in in 2021:
| Cunningham Terrace: | $1,652 |
| Houston: | $974 |
Male vs Females
| Males: | 148 |
| Females: | 144 |
Median age
| Males: | 50.7 years |
| Females: | 51.3 years |
Housing prices:
Average estimated value of detached houses in 2021 (87.3% of all units):
| Cunningham Terrace: | $1,671,969 |
| Houston: | $304,685 |
Average estimated value of townhouses or other attached units in 2021 (14.4% of all units):
| This neighborhood: | $833,654 |
| city: | $305,463 |
Most popular occupations of males: management occupations (except farmers) (34.0%); healthcare practitioners and technical occupations (23.2%); sales and office occupations (18.9%); legal occupations (6.6%); material moving occupations (4.9%); business and financial operations occupations (4.7%); service occupations (3.4%)
Most popular occupations of females: management occupations (except farmers) (29.9%); healthcare practitioners and technical occupations (18.7%); service occupations (17.2%); sales and office occupations (13.4%); legal occupations (11.8%); arts, design, entertainment, sports, and media occupations (3.1%); business and financial operations occupations (2.5%)
Roads and streets: Bellaire Blvd; Auden St.
Cunningham Terrace neighborhood detailed profile
Dorado neighborhood in Houston statistics: (Find on map)
Area: 4.442 square miles
Population: 4,389
Population density:
Median household income in 2021:
Median rent in in 2021:
Male vs Females
Median age
Housing prices:
Average estimated value of detached houses in 2021 (76.9% of all units):
Average estimated value of mobile home in 2021 (11.1% of all units):
Most popular occupations of males: construction, extraction, and maintenance occupations (20.7%); material moving occupations (16.1%); production occupations (11.9%); service occupations (11.0%); sales and office occupations (5.3%); transportation occupations (4.2%); architecture and engineering occupations (3.2%)
Most popular occupations of females: sales and office occupations (37.4%); service occupations (26.4%); healthcare practitioners and technical occupations (11.2%); management occupations (except farmers) (4.2%); construction, extraction, and maintenance occupations (2.9%); transportation occupations (2.8%); education, training, and library occupations (2.3%)
Highways in this neighborhood: US Hwy 90 (McCarty St, US Hwy 90U Bus); US Hwy 90 (US Hwy 90U Bus, Beaumont Hwy).
Roads and streets: Wallisville Rd; Oates Rd; Manitou Dr; E O S T Dr; FM 526 S (Lake Houston Pkwy, Co Rd 526, S Lake Houston Pkwy); Mesa Dr; Trailmobile Dr; Gloria Dr; Clara Rd; Needham St; Banner Dr; Pandora Dr; Aguila St; San Pedro St; W Ost Dr (W O S T Dr); Evangeline Dr; Colvin St; Oak Brook Dr; Shadrack St; Zaballos Ct; Debra Rd; Penelope Dr; Wynnewood St; Guessena St; Santa Cruz St; Coahuila St; Rafael St; San Carlos St; Cibolo St; Saltillo St; la Retama Dr; Circle Dr; Culebra St; Villita St; Tree Path Ln; Cibolo; Coahuila.
Other features: Hunting Byu.
Dorado neighborhood detailed profile
Area: 4.442 square miles
Population: 4,389
Population density:
| Dorado (Oats Prairie): | 988 people per square mile |
| Houston: | 3,947 people per square mile |
Median household income in 2021:
| Dorado (Oats Prairie): | $37,065 |
| Houston: | $55,499 |
Median rent in in 2021:
| Dorado (Oats Prairie): | $813 |
| Houston: | $974 |
Male vs Females
| Males: | 2,861 |
| Females: | 1,527 |
Median age
| Males: | 33.9 years |
| Females: | 39.0 years |
Housing prices:
Average estimated value of detached houses in 2021 (76.9% of all units):
| Dorado (Oats Prairie): | $76,272 |
| Houston: | $304,685 |
Average estimated value of mobile home in 2021 (11.1% of all units):
| Dorado (Oats Prairie): | $214,311 |
| Houston: | $60,006 |
Most popular occupations of males: construction, extraction, and maintenance occupations (20.7%); material moving occupations (16.1%); production occupations (11.9%); service occupations (11.0%); sales and office occupations (5.3%); transportation occupations (4.2%); architecture and engineering occupations (3.2%)
Most popular occupations of females: sales and office occupations (37.4%); service occupations (26.4%); healthcare practitioners and technical occupations (11.2%); management occupations (except farmers) (4.2%); construction, extraction, and maintenance occupations (2.9%); transportation occupations (2.8%); education, training, and library occupations (2.3%)
Highways in this neighborhood: US Hwy 90 (McCarty St, US Hwy 90U Bus); US Hwy 90 (US Hwy 90U Bus, Beaumont Hwy).
Roads and streets: Wallisville Rd; Oates Rd; Manitou Dr; E O S T Dr; FM 526 S (Lake Houston Pkwy, Co Rd 526, S Lake Houston Pkwy); Mesa Dr; Trailmobile Dr; Gloria Dr; Clara Rd; Needham St; Banner Dr; Pandora Dr; Aguila St; San Pedro St; W Ost Dr (W O S T Dr); Evangeline Dr; Colvin St; Oak Brook Dr; Shadrack St; Zaballos Ct; Debra Rd; Penelope Dr; Wynnewood St; Guessena St; Santa Cruz St; Coahuila St; Rafael St; San Carlos St; Cibolo St; Saltillo St; la Retama Dr; Circle Dr; Culebra St; Villita St; Tree Path Ln; Cibolo; Coahuila.
Other features: Hunting Byu.
Dorado neighborhood detailed profile
Downtown neighborhood in Houston statistics: (Find on map)
Area: 2.845 square miles
Population: 4,676
Population density:
Median household income in 2021:
Median rent in in 2021:
Male vs Females
Median age
Most popular occupations of males: architecture and engineering occupations (18.8%); sales and office occupations (14.4%); business and financial operations occupations (13.2%); management occupations (except farmers) (8.4%); life, physical, and social science occupations (7.1%); production occupations (6.4%); material moving occupations (4.5%)
Most popular occupations of females: management occupations (except farmers) (21.6%); healthcare practitioners and technical occupations (15.2%); architecture and engineering occupations (12.3%); business and financial operations occupations (10.6%); legal occupations (7.7%); sales and office occupations (7.5%); education, training, and library occupations (6.9%)
Limited-access highways (interstate or state) in this neighborhood: Gulf Fwy (I- 45, US Hwy 75); East Fwy (I- 10, US Hwy 90).
Highways in this neighborhood: Eastex Fwy (US Hwy 59).
Roads and streets: Walker St; Dallas St; McKinney St; Clay St; Capitol St; Polk St; Rusk St; Leeland St (Leeland Ave); Pease St; Bell St; Texas St (Texas Ave); St Joseph Pkwy; Preston St; Jefferson St (Jefferson Ave); Main St; San Jacinto St; Saint Emanuel St (St Emanuel St); US Hwy 59 (Chartres St); Franklin St; Travis St; Fannin St; la Branch St; Crawford St; Austin St; Congress St (Congress Ave); Hutchins St; Milam St; Caroline St; Louisiana St; Bastrop St; Smith St; US Hwy 59 (Hamilton St); Lamar St (Lamar Ave); Dowling St; Jackson St; Commerce St; Chenevert St; Live Oak St; Nagle St; St Charles St (Saint Charles St); Lamar St; Delano St; Prairie St; Rothwell St; Elysian St; Ennis St; Nance St; Pierce St; Bagby St; McKee St; Paige St; N Main St; Prairie Ave; Palmer St; Ave de Las Americas; Conti St; N San Jacinto St; Ruiz St; East Fwy; Brazos St; Pierce; Prairie; Baker St; Andrews St; Memorial Dr; Vine St; Calhoun; Hardy St; Harrisburg Blvd; Travis-North Fwy; Sterrett; Walnut St; Robin St; Wood St; Sterrett St; Runnels; Hardy St (Hardy Rd); Chapman St; Collins Pl; W Dallas Ave; N Milam St; Girard; Mc Kee St; Naylor St; Shea St; Allen Pkwy; Allen St; Maffitt St; Daly Pl; Semmes St; N Crawford St; Providence St; Ruthven St; N Hamilton St; William St; N Jackson St; Race St; Walker-Mckinney; Fannin; Hamilton; Howe; Canal St; Richey St; Navigation Blvd; Washington Ave; Shaw; Maple St; Charles St; Brazos; Smith; Maury St; Spruce St; N Chenevert St; Clay; Top St; Bramble St; Lyons Ave; Rains St; Steam Mill; Mc Kinney; Lamar; Walker-Sabine; Runnels St; Nettleton St; Hutchins; Girard St; Nagle; Chartres (US Hwy 59, Chartres St).
Railroad features: Southern Pacific RR; Houston Belt and Terminal Rlwy; Union Pacific RR.
Other features: Buffalo Byu; White Oak Byu.
Downtown neighborhood detailed profile
Area: 2.845 square miles
Population: 4,676
Population density:
| Downtown: | 1,643 people per square mile |
| Houston: | 3,947 people per square mile |
Median household income in 2021:
| Downtown: | $85,497 |
| Houston: | $55,499 |
Median rent in in 2021:
| Downtown: | $2,060 |
| Houston: | $974 |
Male vs Females
| Males: | 1,722 |
| Females: | 2,953 |
Median age
| Males: | 38.6 years |
| Females: | 33.0 years |
Most popular occupations of males: architecture and engineering occupations (18.8%); sales and office occupations (14.4%); business and financial operations occupations (13.2%); management occupations (except farmers) (8.4%); life, physical, and social science occupations (7.1%); production occupations (6.4%); material moving occupations (4.5%)
Most popular occupations of females: management occupations (except farmers) (21.6%); healthcare practitioners and technical occupations (15.2%); architecture and engineering occupations (12.3%); business and financial operations occupations (10.6%); legal occupations (7.7%); sales and office occupations (7.5%); education, training, and library occupations (6.9%)
Limited-access highways (interstate or state) in this neighborhood: Gulf Fwy (I- 45, US Hwy 75); East Fwy (I- 10, US Hwy 90).
Highways in this neighborhood: Eastex Fwy (US Hwy 59).
Roads and streets: Walker St; Dallas St; McKinney St; Clay St; Capitol St; Polk St; Rusk St; Leeland St (Leeland Ave); Pease St; Bell St; Texas St (Texas Ave); St Joseph Pkwy; Preston St; Jefferson St (Jefferson Ave); Main St; San Jacinto St; Saint Emanuel St (St Emanuel St); US Hwy 59 (Chartres St); Franklin St; Travis St; Fannin St; la Branch St; Crawford St; Austin St; Congress St (Congress Ave); Hutchins St; Milam St; Caroline St; Louisiana St; Bastrop St; Smith St; US Hwy 59 (Hamilton St); Lamar St (Lamar Ave); Dowling St; Jackson St; Commerce St; Chenevert St; Live Oak St; Nagle St; St Charles St (Saint Charles St); Lamar St; Delano St; Prairie St; Rothwell St; Elysian St; Ennis St; Nance St; Pierce St; Bagby St; McKee St; Paige St; N Main St; Prairie Ave; Palmer St; Ave de Las Americas; Conti St; N San Jacinto St; Ruiz St; East Fwy; Brazos St; Pierce; Prairie; Baker St; Andrews St; Memorial Dr; Vine St; Calhoun; Hardy St; Harrisburg Blvd; Travis-North Fwy; Sterrett; Walnut St; Robin St; Wood St; Sterrett St; Runnels; Hardy St (Hardy Rd); Chapman St; Collins Pl; W Dallas Ave; N Milam St; Girard; Mc Kee St; Naylor St; Shea St; Allen Pkwy; Allen St; Maffitt St; Daly Pl; Semmes St; N Crawford St; Providence St; Ruthven St; N Hamilton St; William St; N Jackson St; Race St; Walker-Mckinney; Fannin; Hamilton; Howe; Canal St; Richey St; Navigation Blvd; Washington Ave; Shaw; Maple St; Charles St; Brazos; Smith; Maury St; Spruce St; N Chenevert St; Clay; Top St; Bramble St; Lyons Ave; Rains St; Steam Mill; Mc Kinney; Lamar; Walker-Sabine; Runnels St; Nettleton St; Hutchins; Girard St; Nagle; Chartres (US Hwy 59, Chartres St).
Railroad features: Southern Pacific RR; Houston Belt and Terminal Rlwy; Union Pacific RR.
Other features: Buffalo Byu; White Oak Byu.
Downtown neighborhood detailed profile
East End neighborhood in Houston statistics: (Find on map)
Area: 21.780 square miles
Population: 100,357
Population density:
Median household income in 2021:
Median rent in in 2021:
Male vs Females
Median age
Housing prices:
Average estimated value of detached houses in 2021 (62.9% of all units):
Average estimated '21 value of housing units in 5-or-more-unit structures (10.1% of all units):
Most popular occupations of males: construction, extraction, and maintenance occupations (25.0%); sales and office occupations (10.9%); service occupations (10.5%); production occupations (10.4%); management occupations (except farmers) (9.8%); transportation occupations (7.6%); material moving occupations (5.0%)
Most popular occupations of females: sales and office occupations (29.9%); service occupations (25.8%); education, training, and library occupations (6.7%); management occupations (except farmers) (6.3%); healthcare practitioners and technical occupations (6.3%); business and financial operations occupations (4.6%); legal occupations (4.4%)
Limited-access highways (interstate or state) in this neighborhood: I- 45 (Gulf Fwy); I- 610 (E Loop Fwy, S Loop Fwy); US Hwy 90 (East Fwy, I- 10).
Highways in this neighborhood: US Hwy 90 Alt (N Wayside Dr); US Hwy 90 Alt (S Wayside Dr); State Hwy 225 (la Porte Fwy); Eastex Fwy (US Hwy 59); State Hwy 35 (Reveille Rd).
Roads and streets: Clinton Dr; Navigation Blvd; Harrisburg Blvd; Canal St; Sherman St; Lawndale St; Polk St; Capitol St; Rusk St; Market St; Walker St; Ave I; Bell St; Clay St; Gellhorn Dr; Ave H; McKinney St; Avenue E; Ave F; Lockwood Dr; Ave C; Ave J; Pease St; Old Clinton Rd; Jefferson St; Commerce St; Dallas St; Telephone Rd; Broadway St; Ave L; Fennell St; Ave K; Avenue N; Tilgham St; Leeland St; Ave B; Lamar St; Keller St; Evergreen Dr; Lower Level Rd; Narcissus St; S Sgt Macario Garcia Dr (69th St); S McCarty St; S Lockwood Dr; Garrow St; Manchester St; Pearl St; Brady St; Kernel St; Market Street Rd; High Level Rd; Leeland St (Leeland Ave); Linden St; S 75th St; Kress St; Wayside Dr; Saint Emanuel St (St Emanuel St); Moss Rose St; Dumble St; Ave O; Texas St; Armour Dr; Maxine St; US Hwy 59 (Chartres St); Dorsett St (Dorsett Ave); Milby St; Hutchins St; Sampson St; Hemlock St; Houston Harbor Blvd (Harbor St); Cowart St; Bastrop St; Myrtle St; Eastwood St; Griggs Rd; Amarillo St; Ledwicke St; N 67th St (67th St, N Cesar Chavez Blvd); Texas St (Texas Ave); Forest Hill Blvd; Gazin St; Sidney St; St Charles St (Saint Charles St); Ave P; Japonica St; 75th St; Nagle St; Ilex St; Lathrop St; Dowling St; Harvey Wilson Dr; Engelke St; Delano St; Pleasantville Dr; Coral St; Park Dr; Cline St; Berkley St; Munger St; E Erath St; Boyles St; Daugherty St; Cullen Blvd; Lyons Ave; Portwall St; Gillespie St; Satsuma St; Redwood Ave; Turning Basin Dr; Live Oak St; Arapahoe St; N Greenwood St; Wiggins St; Roberts St; Preston St; Harris St; Hackney St; Kellogg St; Ave Q; Lawson St; Coyle St; N Everton St; Velasco St; Office City Dr; Ennis St; Melva St; Guinevere St; Port St; Altic St; York St; Lombardy St; Larimer St; Buck St; Ernestine St; Hare St; Garden St; Leslie St; N 76th St; Medina St; Hughes St; Dismuke St; Paige St; Gate 1 Rd; E Magnolia St; Hahlo St; N Milby St; Cargill St; Pasadena St; San Pablo Dr; Coke St; Bowie St; Leander St; John St; Lavaca St; Tipps St; Delmar St; la Porte Rd; Harding St; 74th St (N 74th St); N Hutcheson St; 77th St (N 77th St); Munn St; Woodvale St; Lenox St; Providence St; Edgewood St; Hoffman St; Woodridge Dr; Abilene Ave (Abilene St); Magnolia St; Terminal St; Scott St; Norvic St; Sunnyland St; Channelside St; Palmer St; Fir St; Garland Dr (Garland St); el Paso St; N Mac Gregor Way; Elm St; San Angelo St; Alta Vista St; Baron; Fillmore St; N York St; Demaree Ln; W Hedrick St; Azalea St; Elliott St; Silverdale St; Des Jardines St; Baltimore St; Baer St; Runnels St; Cypress St; Schweikhardt St; Erath St; E Elm St; Henninger St; Nueces St; Berndale St; Hussion St; Scharpe St; N Eastwood St; N Super St; N Drennan St; Avenue S; Mississippi St; Eskridge St; Gonzales St; Laurentide St; Fox St; N Capitol St; Fair Oaks Rd; Harbor Dr (J W Peavy Dr); Ave T; Woodruff St; 66th St (N 66th St); Tuck St; N 78th St (78th St); Ave V; Anzac St; Ave U; Santa Rosa St; Boyce St; Gibbons St; Palmetto St; St Joseph Pkwy; Othello St; E Hedrick St; Glendale St; N Velasco St; Candy St; Woodside St; Frio St; Labco St; Hillman St; Idylwood Dr; Waco St; Tremper St; Crites St; Sharon St; Denison St; Eddington St; S 80th St; Collier St; Latham St; N 71st St; Santiago St; Villa de Matel Rd; Palestine St; Clifton St; Norwood St; Woolworth St; Majestic St; Zoe St; Henke St; Wilmer St; Emile St; Edmundson St; Corsicana St; Lindsay St; Josie St; Richardson St; Baird St; N Sampson St; Hirsch St; Flossie Mae St; Parsons St; Ave R; Engel St; Pillot St; S 79th St; Flaxman St; Flowers St; Stedman St; Lane St; Chadwick St; Jensen Dr; Kerr St; Buchanan St; Richards St; Mendez St; Godwin St; Burman St; Crown St; Bering St; Galveston Rd; Avenue W; S Sgt Macario Garcia Dr; Aleen St; Hutcheson St; Dayton St; Teanaway Ln; Sonora St; Floral St; Brookside Dr; Grove St; S 66th St; Dahlia St; Rainbow Dr; Bayou St; Gunter St; N Sidney St; 79th St (N 79th St); J W Peavy Dr; Stiles St; Pearson St; Saltus St; Vernon St; 70th St (N 70th St); Lovejoy St; Bryan St; Concrete St; Port Houston; ; Sylvan Rd; N Saint Charles St; Margarita St; Japhet St; San Antonio St; Broadmoor St; Woodleigh St; N Bryan St; Masterson St; Garfield St; Mc Cormick St; Signet St; San Juan St; Tuffly St; Vandeman St; Teal St; Supply Row; American Dr; Linwood St; Caylor St; Prairie Ave; Glover St; Zindler St; Claremont St; Adams St; S 72nd St; McCarty St; Adrian St; Scanlock St; N Edgewood St; Elvera St; Brumbley St; S 69th St; Schley St; Denver St; Santa Maria St; Jefferson Ave (Jefferson St); Bringhurst St; Drennan St; Fourcade St; Mc Call; Hunt St; Super St; Barremore St; Wildwood Way; Estelle St; Gregg St; 72nd St (N 72nd St); Miller St; Stonewall St; Middle St; Fairfield Dr (Fairfield St); Elwood St; St Joseph St (Saint Joseph St); N 70th St; N Estelle St; Bucroft St; Country Club Dr; Meadowlawn St; Esperanza St; Press St; Borden St; Pinehurst Dr (Pinehurst St); Capitol; N Live Oak St; Everton St; Meadow St; Esperson St; Dorbrandt St; Quince St; Fannette St; Roosevelt St; Smallwood Ln; N Nagle St; Newport St; Burr St; Bonham St; Calles St; Sydnor St; Maltby St; N Adams St; Bonsrell St; Truett St; N Ennis St; San Saba St; Sol St; N 65th St; Tellepsen St; Cage St; Mable St; Ford St; S 74th St; N 71st St (71st St); Gustav St; Sycamore St; Pattibob St; Park Ln; Merry Ln; Craig St; N 80th St (80th St); Mc Farland St; Fashion St; J W Peavey Dr; Zoltowski St; Shotwell St; S 78th St; Congress Ave (Congress St); S 67th St (S Cesar Chavez Blvd); N Jenkins St; Mulford St; Edmund St; Foster St; Maxwell Ln; N Delano St; Harby St; Oakhurst St; N Palmer St; Goode St; Rustic St (Rustic Ln); Sakowitz St; Reese St; Hagerman St; Hirsch St (Hirsch Rd); S Jensen Dr; Harriet St; Wooding St; N Stiles St; N Burr St; Hebert St; Hatwell St; Sarita St; Wesley St; S Capitol St; Plummer St; Freund St; West Dr; Lansing St; Kolfahl St; Hockley St; Jenkins St; Nolan St; San Jose St; Grayson; Billy St; Marsden St; Greenwood St; 73rd St; Coolidge; Tharp Ave; N Hagerman St; Elliston St; Schroeder; Hudson St; Ann; Calhoun; Stimson St; Hawkins St; N Norwood St; Diez St; Industrial Way; Baldinger St; Rockbridge Ln; Gulf Creek Dr; Jean St; Turkey St (Plastics Ave); Hicksfield; Heitman St; Curtin St; Dick St; Grace St; Tite St; Flagship Dr; Industrial Dr (Industrial Rd); Hotchkiss St; Plum Creek Dr; Rouse St; Monroe St; Bisbee St; Boulder St; Jamail Dr; Waycrest; Mc Kinney St; Quaker St; Karnes St; Wingate St; Williford St; S 77th St; Lindy Ln; Eden St; Arberry St; Junior St; Millet St; Nance St; Calhoun-Pease; Marlo St; Pineview Dr; San Marcos St; Suburban St; Gate 2 Rd; Mack; Merkel St; Solo St; Eastwood Tc One Dr; Patricia Ln; Maplewood Ln; Kendall St; Jocelin St; Pierce St; Brays St; Oakland St; Daisy St; Matamoras St; Jefferson; Ingeborg St; Bobby Lee Ln; Miraglen St; St Augustine; Canton St; Finnigan Dr; Harwell Dr; Oldham St; Mc Cormick; Wyatt St; Tharp St; Ida St; Stonewall Dr; McAlpine St; Franklin St; Basin St; Lanewell St; Holtcamp St; Blackburn; Ira St; Keating St; Clinton-Wayside Dr; Claxton St; Northton St; Rotman St; Richcroft St; Burch St; Clark; Dresden St; Polk Ct; Junius St; N Kendall St; Neuhaus St; Dallas Ave (Dallas St); Phil St; East Dr; Lottman St; Romans St; E Navigation Blvd (81st St); N Lenox St; S 70th St; S 71st St; Blanche St; Eastgate St; Winchester; Kemp St; Williamson St; S 65th St; Napoleon St; Halbert St; Lina St; Delmas St; Hub St; Baywood; Deborah St; Bedford St; Weaver Ave (Weaver St); Pabst St; Shiloh St; Rye St; Cordier Ct; Memphis St; Funston St; Hauser St; Colby St; Sondick Ct; Inman St; Palo Alto St; Dunn St; Live Oak Aly; Bob St; Brutus St; Menard St; Ursa St; Finnigan Park; Bangle St; Middleton St; Tomwood; N Paige St; Taliver St; Glendora St; Basil; Phelps St; Herbert St; Mc Ashan St; Athens Dr; Lawndale Plz; Swope; Schwartz St; Ball St; Beaumont St; Whitmire St; Kenmore St; Garland St; Foley; Marlin St; Mc Alpine St; Bennett St; Metcalf St; Nimrod St; Portwood St; Hanover St; N 69th St (S Sgt Macario Garcia Dr); Christensen St; Dwinnell St; Gulf Frwy Svc Rd (State Hwy 35); Mason Ct; Patricia Manor Pl; McKinney Ave (McKinney St); Winter St; Normandale St; S 74th 1/2 St; Inlane St; Roanoke; Hunter; Flynn St; Kennedy St; N Latham St; Mobile St; N Delmar St; Clay; Silverdale; Finnigan Park Place Ct; Felix; Harbor; Egan St; Sibley St; Jamaica St; Barron; Canal Ct; Magnolia Tc Four Dr; Parsons; Stuebner; Foote St; Barziza St; Sims; Telephone-Gulf Fwy; Cowling St; Frank; Shadyview St; Layton; Junius; Power St; Swiney St; Rosebud St; Kemton St; Joseph; Hoover; Eastwood Tc Two Dr; Felix St; Harris; Fashion; Denby St; S 76th St; Athos St; Amboy St; Magnolia Tc Two Dr; Hughes; Browne; Lemke; Alton St; E Navigation Blvd (E 81st St, Navigation Blvd); Sun Ct; Ranger St; Cary St; Benjamin; Ernestine; Neurath Pl; Clinton-Wayside; Crown; Capron St; Schweikhart St; Arapahoe; Forest St; Tuffly; Ruiz St; Yates St; Eastwood Tc Three Dr; Hollywood Ct; Pollard St; Pierce; Lombardy; S Pedro Infane; Terminal; Magnolia; Sumark Ct; Clark Ct; McLeary St; Sanchez St; P; Boles St; Mikado St; de Koven St; Fox; Acres; Sam Houston Rd; Trinidad St; Ball; Gonzales; Nettleton St; Nix St; S Loop Fwy; Tuck; Lombardy Dr; Upton St; Hutchins; Lyons St; Emite Ct; J; I; Holland Ct; Lamar; Gulf Frwy Svc Rd; Nagle; Daugherty; el Paso; Wesley; Sharon; Magnolia Tc One Dr; Craigmont St; Abilene; Eastwood Tc Five Dr; York; Sam Houston; San Jose; Chartres (US Hwy 59, Chartres St).
Railroad features: Houston Belt and Terminal Rlwy; Southern Pacific RR; Port Terminal RR; Union Pacific RR.
Other features: Brays Byu; Plum Crk; Country Club Byu; Ingraham Gully; Buffalo Byu.
East End neighborhood detailed profile
Area: 21.780 square miles
Population: 100,357
Population density:
| East End: | 4,608 people per square mile |
| Houston: | 3,947 people per square mile |
Median household income in 2021:
| East End: | $46,916 |
| Houston: | $55,499 |
Median rent in in 2021:
| East End: | $816 |
| Houston: | $974 |
Male vs Females
| Males: | 51,222 |
| Females: | 49,134 |
Median age
| Males: | 37.2 years |
| Females: | 36.5 years |
Housing prices:
Average estimated value of detached houses in 2021 (62.9% of all units):
| East End: | $180,858 |
| Houston: | $304,685 |
Average estimated '21 value of housing units in 5-or-more-unit structures (10.1% of all units):
| East End: | $69,237 |
| Houston: | $227,414 |
Most popular occupations of males: construction, extraction, and maintenance occupations (25.0%); sales and office occupations (10.9%); service occupations (10.5%); production occupations (10.4%); management occupations (except farmers) (9.8%); transportation occupations (7.6%); material moving occupations (5.0%)
Most popular occupations of females: sales and office occupations (29.9%); service occupations (25.8%); education, training, and library occupations (6.7%); management occupations (except farmers) (6.3%); healthcare practitioners and technical occupations (6.3%); business and financial operations occupations (4.6%); legal occupations (4.4%)
Limited-access highways (interstate or state) in this neighborhood: I- 45 (Gulf Fwy); I- 610 (E Loop Fwy, S Loop Fwy); US Hwy 90 (East Fwy, I- 10).
Highways in this neighborhood: US Hwy 90 Alt (N Wayside Dr); US Hwy 90 Alt (S Wayside Dr); State Hwy 225 (la Porte Fwy); Eastex Fwy (US Hwy 59); State Hwy 35 (Reveille Rd).
Roads and streets: Clinton Dr; Navigation Blvd; Harrisburg Blvd; Canal St; Sherman St; Lawndale St; Polk St; Capitol St; Rusk St; Market St; Walker St; Ave I; Bell St; Clay St; Gellhorn Dr; Ave H; McKinney St; Avenue E; Ave F; Lockwood Dr; Ave C; Ave J; Pease St; Old Clinton Rd; Jefferson St; Commerce St; Dallas St; Telephone Rd; Broadway St; Ave L; Fennell St; Ave K; Avenue N; Tilgham St; Leeland St; Ave B; Lamar St; Keller St; Evergreen Dr; Lower Level Rd; Narcissus St; S Sgt Macario Garcia Dr (69th St); S McCarty St; S Lockwood Dr; Garrow St; Manchester St; Pearl St; Brady St; Kernel St; Market Street Rd; High Level Rd; Leeland St (Leeland Ave); Linden St; S 75th St; Kress St; Wayside Dr; Saint Emanuel St (St Emanuel St); Moss Rose St; Dumble St; Ave O; Texas St; Armour Dr; Maxine St; US Hwy 59 (Chartres St); Dorsett St (Dorsett Ave); Milby St; Hutchins St; Sampson St; Hemlock St; Houston Harbor Blvd (Harbor St); Cowart St; Bastrop St; Myrtle St; Eastwood St; Griggs Rd; Amarillo St; Ledwicke St; N 67th St (67th St, N Cesar Chavez Blvd); Texas St (Texas Ave); Forest Hill Blvd; Gazin St; Sidney St; St Charles St (Saint Charles St); Ave P; Japonica St; 75th St; Nagle St; Ilex St; Lathrop St; Dowling St; Harvey Wilson Dr; Engelke St; Delano St; Pleasantville Dr; Coral St; Park Dr; Cline St; Berkley St; Munger St; E Erath St; Boyles St; Daugherty St; Cullen Blvd; Lyons Ave; Portwall St; Gillespie St; Satsuma St; Redwood Ave; Turning Basin Dr; Live Oak St; Arapahoe St; N Greenwood St; Wiggins St; Roberts St; Preston St; Harris St; Hackney St; Kellogg St; Ave Q; Lawson St; Coyle St; N Everton St; Velasco St; Office City Dr; Ennis St; Melva St; Guinevere St; Port St; Altic St; York St; Lombardy St; Larimer St; Buck St; Ernestine St; Hare St; Garden St; Leslie St; N 76th St; Medina St; Hughes St; Dismuke St; Paige St; Gate 1 Rd; E Magnolia St; Hahlo St; N Milby St; Cargill St; Pasadena St; San Pablo Dr; Coke St; Bowie St; Leander St; John St; Lavaca St; Tipps St; Delmar St; la Porte Rd; Harding St; 74th St (N 74th St); N Hutcheson St; 77th St (N 77th St); Munn St; Woodvale St; Lenox St; Providence St; Edgewood St; Hoffman St; Woodridge Dr; Abilene Ave (Abilene St); Magnolia St; Terminal St; Scott St; Norvic St; Sunnyland St; Channelside St; Palmer St; Fir St; Garland Dr (Garland St); el Paso St; N Mac Gregor Way; Elm St; San Angelo St; Alta Vista St; Baron; Fillmore St; N York St; Demaree Ln; W Hedrick St; Azalea St; Elliott St; Silverdale St; Des Jardines St; Baltimore St; Baer St; Runnels St; Cypress St; Schweikhardt St; Erath St; E Elm St; Henninger St; Nueces St; Berndale St; Hussion St; Scharpe St; N Eastwood St; N Super St; N Drennan St; Avenue S; Mississippi St; Eskridge St; Gonzales St; Laurentide St; Fox St; N Capitol St; Fair Oaks Rd; Harbor Dr (J W Peavy Dr); Ave T; Woodruff St; 66th St (N 66th St); Tuck St; N 78th St (78th St); Ave V; Anzac St; Ave U; Santa Rosa St; Boyce St; Gibbons St; Palmetto St; St Joseph Pkwy; Othello St; E Hedrick St; Glendale St; N Velasco St; Candy St; Woodside St; Frio St; Labco St; Hillman St; Idylwood Dr; Waco St; Tremper St; Crites St; Sharon St; Denison St; Eddington St; S 80th St; Collier St; Latham St; N 71st St; Santiago St; Villa de Matel Rd; Palestine St; Clifton St; Norwood St; Woolworth St; Majestic St; Zoe St; Henke St; Wilmer St; Emile St; Edmundson St; Corsicana St; Lindsay St; Josie St; Richardson St; Baird St; N Sampson St; Hirsch St; Flossie Mae St; Parsons St; Ave R; Engel St; Pillot St; S 79th St; Flaxman St; Flowers St; Stedman St; Lane St; Chadwick St; Jensen Dr; Kerr St; Buchanan St; Richards St; Mendez St; Godwin St; Burman St; Crown St; Bering St; Galveston Rd; Avenue W; S Sgt Macario Garcia Dr; Aleen St; Hutcheson St; Dayton St; Teanaway Ln; Sonora St; Floral St; Brookside Dr; Grove St; S 66th St; Dahlia St; Rainbow Dr; Bayou St; Gunter St; N Sidney St; 79th St (N 79th St); J W Peavy Dr; Stiles St; Pearson St; Saltus St; Vernon St; 70th St (N 70th St); Lovejoy St; Bryan St; Concrete St; Port Houston; ; Sylvan Rd; N Saint Charles St; Margarita St; Japhet St; San Antonio St; Broadmoor St; Woodleigh St; N Bryan St; Masterson St; Garfield St; Mc Cormick St; Signet St; San Juan St; Tuffly St; Vandeman St; Teal St; Supply Row; American Dr; Linwood St; Caylor St; Prairie Ave; Glover St; Zindler St; Claremont St; Adams St; S 72nd St; McCarty St; Adrian St; Scanlock St; N Edgewood St; Elvera St; Brumbley St; S 69th St; Schley St; Denver St; Santa Maria St; Jefferson Ave (Jefferson St); Bringhurst St; Drennan St; Fourcade St; Mc Call; Hunt St; Super St; Barremore St; Wildwood Way; Estelle St; Gregg St; 72nd St (N 72nd St); Miller St; Stonewall St; Middle St; Fairfield Dr (Fairfield St); Elwood St; St Joseph St (Saint Joseph St); N 70th St; N Estelle St; Bucroft St; Country Club Dr; Meadowlawn St; Esperanza St; Press St; Borden St; Pinehurst Dr (Pinehurst St); Capitol; N Live Oak St; Everton St; Meadow St; Esperson St; Dorbrandt St; Quince St; Fannette St; Roosevelt St; Smallwood Ln; N Nagle St; Newport St; Burr St; Bonham St; Calles St; Sydnor St; Maltby St; N Adams St; Bonsrell St; Truett St; N Ennis St; San Saba St; Sol St; N 65th St; Tellepsen St; Cage St; Mable St; Ford St; S 74th St; N 71st St (71st St); Gustav St; Sycamore St; Pattibob St; Park Ln; Merry Ln; Craig St; N 80th St (80th St); Mc Farland St; Fashion St; J W Peavey Dr; Zoltowski St; Shotwell St; S 78th St; Congress Ave (Congress St); S 67th St (S Cesar Chavez Blvd); N Jenkins St; Mulford St; Edmund St; Foster St; Maxwell Ln; N Delano St; Harby St; Oakhurst St; N Palmer St; Goode St; Rustic St (Rustic Ln); Sakowitz St; Reese St; Hagerman St; Hirsch St (Hirsch Rd); S Jensen Dr; Harriet St; Wooding St; N Stiles St; N Burr St; Hebert St; Hatwell St; Sarita St; Wesley St; S Capitol St; Plummer St; Freund St; West Dr; Lansing St; Kolfahl St; Hockley St; Jenkins St; Nolan St; San Jose St; Grayson; Billy St; Marsden St; Greenwood St; 73rd St; Coolidge; Tharp Ave; N Hagerman St; Elliston St; Schroeder; Hudson St; Ann; Calhoun; Stimson St; Hawkins St; N Norwood St; Diez St; Industrial Way; Baldinger St; Rockbridge Ln; Gulf Creek Dr; Jean St; Turkey St (Plastics Ave); Hicksfield; Heitman St; Curtin St; Dick St; Grace St; Tite St; Flagship Dr; Industrial Dr (Industrial Rd); Hotchkiss St; Plum Creek Dr; Rouse St; Monroe St; Bisbee St; Boulder St; Jamail Dr; Waycrest; Mc Kinney St; Quaker St; Karnes St; Wingate St; Williford St; S 77th St; Lindy Ln; Eden St; Arberry St; Junior St; Millet St; Nance St; Calhoun-Pease; Marlo St; Pineview Dr; San Marcos St; Suburban St; Gate 2 Rd; Mack; Merkel St; Solo St; Eastwood Tc One Dr; Patricia Ln; Maplewood Ln; Kendall St; Jocelin St; Pierce St; Brays St; Oakland St; Daisy St; Matamoras St; Jefferson; Ingeborg St; Bobby Lee Ln; Miraglen St; St Augustine; Canton St; Finnigan Dr; Harwell Dr; Oldham St; Mc Cormick; Wyatt St; Tharp St; Ida St; Stonewall Dr; McAlpine St; Franklin St; Basin St; Lanewell St; Holtcamp St; Blackburn; Ira St; Keating St; Clinton-Wayside Dr; Claxton St; Northton St; Rotman St; Richcroft St; Burch St; Clark; Dresden St; Polk Ct; Junius St; N Kendall St; Neuhaus St; Dallas Ave (Dallas St); Phil St; East Dr; Lottman St; Romans St; E Navigation Blvd (81st St); N Lenox St; S 70th St; S 71st St; Blanche St; Eastgate St; Winchester; Kemp St; Williamson St; S 65th St; Napoleon St; Halbert St; Lina St; Delmas St; Hub St; Baywood; Deborah St; Bedford St; Weaver Ave (Weaver St); Pabst St; Shiloh St; Rye St; Cordier Ct; Memphis St; Funston St; Hauser St; Colby St; Sondick Ct; Inman St; Palo Alto St; Dunn St; Live Oak Aly; Bob St; Brutus St; Menard St; Ursa St; Finnigan Park; Bangle St; Middleton St; Tomwood; N Paige St; Taliver St; Glendora St; Basil; Phelps St; Herbert St; Mc Ashan St; Athens Dr; Lawndale Plz; Swope; Schwartz St; Ball St; Beaumont St; Whitmire St; Kenmore St; Garland St; Foley; Marlin St; Mc Alpine St; Bennett St; Metcalf St; Nimrod St; Portwood St; Hanover St; N 69th St (S Sgt Macario Garcia Dr); Christensen St; Dwinnell St; Gulf Frwy Svc Rd (State Hwy 35); Mason Ct; Patricia Manor Pl; McKinney Ave (McKinney St); Winter St; Normandale St; S 74th 1/2 St; Inlane St; Roanoke; Hunter; Flynn St; Kennedy St; N Latham St; Mobile St; N Delmar St; Clay; Silverdale; Finnigan Park Place Ct; Felix; Harbor; Egan St; Sibley St; Jamaica St; Barron; Canal Ct; Magnolia Tc Four Dr; Parsons; Stuebner; Foote St; Barziza St; Sims; Telephone-Gulf Fwy; Cowling St; Frank; Shadyview St; Layton; Junius; Power St; Swiney St; Rosebud St; Kemton St; Joseph; Hoover; Eastwood Tc Two Dr; Felix St; Harris; Fashion; Denby St; S 76th St; Athos St; Amboy St; Magnolia Tc Two Dr; Hughes; Browne; Lemke; Alton St; E Navigation Blvd (E 81st St, Navigation Blvd); Sun Ct; Ranger St; Cary St; Benjamin; Ernestine; Neurath Pl; Clinton-Wayside; Crown; Capron St; Schweikhart St; Arapahoe; Forest St; Tuffly; Ruiz St; Yates St; Eastwood Tc Three Dr; Hollywood Ct; Pollard St; Pierce; Lombardy; S Pedro Infane; Terminal; Magnolia; Sumark Ct; Clark Ct; McLeary St; Sanchez St; P; Boles St; Mikado St; de Koven St; Fox; Acres; Sam Houston Rd; Trinidad St; Ball; Gonzales; Nettleton St; Nix St; S Loop Fwy; Tuck; Lombardy Dr; Upton St; Hutchins; Lyons St; Emite Ct; J; I; Holland Ct; Lamar; Gulf Frwy Svc Rd; Nagle; Daugherty; el Paso; Wesley; Sharon; Magnolia Tc One Dr; Craigmont St; Abilene; Eastwood Tc Five Dr; York; Sam Houston; San Jose; Chartres (US Hwy 59, Chartres St).
Railroad features: Houston Belt and Terminal Rlwy; Southern Pacific RR; Port Terminal RR; Union Pacific RR.
Other features: Brays Byu; Plum Crk; Country Club Byu; Ingraham Gully; Buffalo Byu.
East End neighborhood detailed profile
East Houston neighborhood in Houston statistics: (Find on map)
Area: 10.848 square miles
Population: 19,546
Population density:
Median household income in 2021:
Median rent in in 2021:
Male vs Females
Median age
Housing prices:
Average estimated value of detached houses in 2021 (79.4% of all units):
Average estimated value of mobile home in 2021 (4.7% of all units):
Most popular occupations of males: sales and office occupations (17.7%); transportation occupations (17.6%); service occupations (16.5%); construction, extraction, and maintenance occupations (15.1%); production occupations (8.1%); material moving occupations (5.6%); education, training, and library occupations (5.5%)
Most popular occupations of females: sales and office occupations (37.1%); service occupations (28.1%); management occupations (except farmers) (8.4%); education, training, and library occupations (7.0%); business and financial operations occupations (4.5%); production occupations (4.5%); material moving occupations (3.0%)
Highways in this neighborhood: Beaumont Hwy (US Hwy 90, US Hwy 90U Bus).
Roads and streets: Mesa Dr; N Wayside Dr (Tidwell Rd); Ley Rd; N Wayside Dr; Talton St; N Green River Dr; Woodlyn Rd; Sterlingshire St; Caddo Rd; Homewood Ln; Laura Koppe Rd; Richland Dr; Crestview Dr; Linda Vista Rd; Oak Knoll Ln; Green River Dr; Madera Rd; Palo Blanco Rd; Parker Rd; Seeker St; Wiloak St; Denton St; Kentshire Dr; E Houston Rd; Flintridge Dr; Carolwood Dr; Nyssa St; Everglade Dr; Darlington Dr; Railwood Dr; Locksley Rd; Cabot St; Spikewood Dr; Haddick St; Claiborne St; Snowden St; Chatwood Dr; Valley Wind Dr; Gallahad St; Tremont St; Parkhurst Dr; Lake Forest Blvd; Way St; Liberty Rd; Rinn St; Sultan Dr; Bigwood St; Count St; Fitzhugh St; Norwich; Leycrest Rd; Greenwich St; Parkette Dr; Balsam Ln; Kellett St; Record St; Hillis St; Trumpet St; Thorn St; Charlesmont St; Roundhouse Ln; Hamlet St; Arvin St; Las Cruces Ave; Lynette St; Sunderland Rd; Las Cruces St; John Ralston Rd; Guest St; Attwater St; Banting St; Strathmore Dr; Ribbonwood St; Valley Club Dr; Mayberry St; Bean St; Norwich St; Feland St; Valley Lake Dr; Valley Park Dr; Dewitt Rd; Furray Rd; Surry St; Forest View St; Rhobell St; Fringewood Dr; Maddox St; Lake Park St; Howton St; Sunbury St; Roane St; Glenwood Forest Dr; Brock Park Blvd; Cockburn St; Valley Flag Dr; Valley Breeze Dr; Nyssa Ave; Knute St; Balfour; Mosswood Dr; League; Las Cruces Cir; Alcanterra Dr; Livings St; Forest Hollow St; Grandriver Dr; Caballero Dr; Lakewood St; Oates Rd; Spode St; Fields St; Linares Dr; Shive Dr; Kerry Glen Ln; Railspur St; Valley Sun Dr; Sparta St; Valley Meadow Dr; Arlen; Lazydale Ln; Denning Dr; Valley Forest Dr; Monterrey St; Stonewood St; Galaxy St; Valley Ledge Dr; Brock Park Dr; Balfour St; Penrod; Matson St (Matson); Southwark St; Penrod St; Valley Side Dr; Burl St; Shagbark Dr; Mestina St; N Wayside Dr (Wayside Dr); Valley Rock Dr; Lum Ln; Gillman St; Valley Mill Ct; Valley Falls Ct; Verde Rd; Mirawood St; Valley Song Dr; Valley Gold Ct; Express Ln; Palo Alto St; Valley West Ct; Valley Hollow Dr; Kellett; Courben Ln; Hamlet; Herschell St; Yoe St; Valley South Dr; Valley Pond Ct; Bella Pine Ct; Courben Cir; Tate; Venida St; Forest Dale St; Meraldo St; Farragut St; Kerry Glen Cir; Hanford St; Ribbon Wood St; Presa St; Bianca Ct; Clove Cir; Alcala; Harmaston Rd; Valley Pt; Glencroft St; Lake Forest Cir.
Railroad features: Southern Pacific RR; Union Pacific RR.
Other features: Halls Byu; Greens Byu.
East Houston neighborhood detailed profile
Area: 10.848 square miles
Population: 19,546
Population density:
| East Houston: | 1,802 people per square mile |
| Houston: | 3,947 people per square mile |
Median household income in 2021:
| East Houston: | $37,026 |
| Houston: | $55,499 |
Median rent in in 2021:
| East Houston: | $841 |
| Houston: | $974 |
Male vs Females
| Males: | 9,340 |
| Females: | 10,205 |
Median age
| Males: | 35.4 years |
| Females: | 40.9 years |
Housing prices:
Average estimated value of detached houses in 2021 (79.4% of all units):
| East Houston: | $98,424 |
| Houston: | $304,685 |
Average estimated value of mobile home in 2021 (4.7% of all units):
| East Houston: | $80,588 |
| Houston: | $60,006 |
Most popular occupations of males: sales and office occupations (17.7%); transportation occupations (17.6%); service occupations (16.5%); construction, extraction, and maintenance occupations (15.1%); production occupations (8.1%); material moving occupations (5.6%); education, training, and library occupations (5.5%)
Most popular occupations of females: sales and office occupations (37.1%); service occupations (28.1%); management occupations (except farmers) (8.4%); education, training, and library occupations (7.0%); business and financial operations occupations (4.5%); production occupations (4.5%); material moving occupations (3.0%)
Highways in this neighborhood: Beaumont Hwy (US Hwy 90, US Hwy 90U Bus).
Roads and streets: Mesa Dr; N Wayside Dr (Tidwell Rd); Ley Rd; N Wayside Dr; Talton St; N Green River Dr; Woodlyn Rd; Sterlingshire St; Caddo Rd; Homewood Ln; Laura Koppe Rd; Richland Dr; Crestview Dr; Linda Vista Rd; Oak Knoll Ln; Green River Dr; Madera Rd; Palo Blanco Rd; Parker Rd; Seeker St; Wiloak St; Denton St; Kentshire Dr; E Houston Rd; Flintridge Dr; Carolwood Dr; Nyssa St; Everglade Dr; Darlington Dr; Railwood Dr; Locksley Rd; Cabot St; Spikewood Dr; Haddick St; Claiborne St; Snowden St; Chatwood Dr; Valley Wind Dr; Gallahad St; Tremont St; Parkhurst Dr; Lake Forest Blvd; Way St; Liberty Rd; Rinn St; Sultan Dr; Bigwood St; Count St; Fitzhugh St; Norwich; Leycrest Rd; Greenwich St; Parkette Dr; Balsam Ln; Kellett St; Record St; Hillis St; Trumpet St; Thorn St; Charlesmont St; Roundhouse Ln; Hamlet St; Arvin St; Las Cruces Ave; Lynette St; Sunderland Rd; Las Cruces St; John Ralston Rd; Guest St; Attwater St; Banting St; Strathmore Dr; Ribbonwood St; Valley Club Dr; Mayberry St; Bean St; Norwich St; Feland St; Valley Lake Dr; Valley Park Dr; Dewitt Rd; Furray Rd; Surry St; Forest View St; Rhobell St; Fringewood Dr; Maddox St; Lake Park St; Howton St; Sunbury St; Roane St; Glenwood Forest Dr; Brock Park Blvd; Cockburn St; Valley Flag Dr; Valley Breeze Dr; Nyssa Ave; Knute St; Balfour; Mosswood Dr; League; Las Cruces Cir; Alcanterra Dr; Livings St; Forest Hollow St; Grandriver Dr; Caballero Dr; Lakewood St; Oates Rd; Spode St; Fields St; Linares Dr; Shive Dr; Kerry Glen Ln; Railspur St; Valley Sun Dr; Sparta St; Valley Meadow Dr; Arlen; Lazydale Ln; Denning Dr; Valley Forest Dr; Monterrey St; Stonewood St; Galaxy St; Valley Ledge Dr; Brock Park Dr; Balfour St; Penrod; Matson St (Matson); Southwark St; Penrod St; Valley Side Dr; Burl St; Shagbark Dr; Mestina St; N Wayside Dr (Wayside Dr); Valley Rock Dr; Lum Ln; Gillman St; Valley Mill Ct; Valley Falls Ct; Verde Rd; Mirawood St; Valley Song Dr; Valley Gold Ct; Express Ln; Palo Alto St; Valley West Ct; Valley Hollow Dr; Kellett; Courben Ln; Hamlet; Herschell St; Yoe St; Valley South Dr; Valley Pond Ct; Bella Pine Ct; Courben Cir; Tate; Venida St; Forest Dale St; Meraldo St; Farragut St; Kerry Glen Cir; Hanford St; Ribbon Wood St; Presa St; Bianca Ct; Clove Cir; Alcala; Harmaston Rd; Valley Pt; Glencroft St; Lake Forest Cir.
Railroad features: Southern Pacific RR; Union Pacific RR.
Other features: Halls Byu; Greens Byu.
East Houston neighborhood detailed profile
East Little York neighborhood in Houston statistics: (Find on map)
Area: 6.978 square miles
Population: 23,980
Population density:
Median household income in 2021:
Median rent in in 2021:
Male vs Females
Median age
Housing prices:
Average estimated value of detached houses in 2021 (82.3% of all units):
Average estimated value of townhouses or other attached units in 2021 (6.7% of all units):
Average estimated value of mobile home in 2021 (8.3% of all units):
Most popular occupations of males: construction, extraction, and maintenance occupations (22.3%); service occupations (21.7%); sales and office occupations (12.7%); transportation occupations (11.8%); production occupations (10.0%); management occupations (except farmers) (6.8%); material moving occupations (6.0%)
Most popular occupations of females: service occupations (33.6%); sales and office occupations (24.7%); healthcare practitioners and technical occupations (6.5%); production occupations (5.4%); management occupations (except farmers) (5.2%); material moving occupations (4.6%); education, training, and library occupations (4.2%)
Roads and streets: Little York Rd; Homestead Rd; Tidwell Rd; Hirsch Rd; Bretshire Dr; Parker Rd; Langley Rd; Cheeves Dr; Hopper Rd; Annunciation St; Tautenhahn; Calgary Ln; Mohawk St; Hartwick St (Hartwick Rd); Guadalupe St; Cobalt St; Leedale St; Maple Leaf St; Heath St; Rebel Rd; Lera St; Van Zandt St; Antha St; Peach Tree St (Peachtree St); Wiley Rd; Woodwick St; River Trail Dr; Wicklowe St; Spottswood Dr; Gleason Rd; Winfield Rd; Lakewood Dr; Caxton St; Yoe St; Boggess Rd; Colton St; Rhobell St; Smith Rd; Royal Oaks Dr; Wolbrook St; Bretton Dr; Bigwood St; Kelburn Dr; Caddo Rd; Castleton St; Camay Dr; Rockaway Dr; Pate Rd; Bainbridge St; Hollyglen Dr; Micollet St; Envoy St; Moss Oaks Dr; Barnham St; Onslow St; Plaza Dr; Bucknell Rd; Standing Oaks Dr; N Wayside Dr; Frazier River Dr; Gaston St; Navasota St; Rietta St; Yorkwood St; Sterlingshire St; Sam Houston St; Allwood St; Knightwood St; Mayle St; Sandy Oaks Dr; Saunders Rd; Cabot St; Lakemont Dr; Seneca St; Gray Oaks Dr; Lucerne St; Haywood St; Deanna; Dalebrook Dr; Bending Oaks St; Hollow Oaks Dr; Polly St; Hanley Ln; Senior St; Rosemary Ln; Sandra St; Danford Ln; Bertwood St; Claiborne St; Marilyn Ln; Mount Houston Rd; Westbrook Rd; Vailview Dr; Briarwick Ln; Hermann Rd; Cedar Hill Ln; Haverton Dr; Lockwood Dr; Harmon St; Wayside Dr; Ribstone Dr; White Thorn St; Tamworth Dr; Thackery Ln; Askins Ln; Mardale Dr; White Pine Ln; Nold Dr; Burning Bush Ln; Piedmont St; Glen Nook Dr; Styling Dr; Tully St (Tully Ave); Great Oaks Dr; Swan River; Blue River Dr; Pinehook Ln; Crofton St; Ferol Rd; Pittswood Ln; Ledford Ln; Shady Dr; Blades St; Charlesmont St; Ashworth St; Collins Rd; Spinet St; Garrett Rd; Gore Dr; San Lucia River Dr; Hedgewood St; Hesta Ln; Harcourt Dr; Ensworth Dr; Shady Timbers Dr; Spaulding St; Clear River Dr; Raincove Dr; Roughlock St; Bluestone Dr; Orlando St; Lemond Dr; J L Reaux St; Grey Oaks Dr; Breland St; Belridge St; Melanie St; Burningbush Ln; Van Archer; Ivy Leaf Rd; Farb Dr; Hartwick St; Ivy Leaf St; Nolridge Dr; Lebra St; Justin St; Lockern St; Hallshire Dr; Nold Rd; Francine Ln; Noldale Dr; Lavender St; Big Oaks Dr; Compton St; Seville; Valeview Dr; Glenn River Dr; Suburban Rd; Trudy St; Degas Ln; Castleton; Glen River Dr; Lundy Rd; River Spring Dr; Linvale Dr; Almont Dr; Okay St; Shadydale Ln; Heath Ct; S Lockwood Dr; Valmount; Knightwood Ct; Bridleway Cir; Bridlepark Cir; Rietta; Ina; Marian Ave; Styling Ct; Sundown Dr; Fala St; Breland; Linvale; Firnat St; Ribstone Cir; Maple Leaf.
Railroad features: Southern Pacific RR; Union Pacific RR; Houston Belt and Terminal Rlwy.
Other features: Halls Byu.
East Little York neighborhood detailed profile
Area: 6.978 square miles
Population: 23,980
Population density:
| East Little York (Homestead): | 3,436 people per square mile |
| Houston: | 3,947 people per square mile |
Median household income in 2021:
| East Little York (Homestead): | $38,311 |
| Houston: | $55,499 |
Median rent in in 2021:
| East Little York (Homestead): | $775 |
| Houston: | $974 |
Male vs Females
| Males: | 11,161 |
| Females: | 12,818 |
Median age
| Males: | 35.0 years |
| Females: | 39.1 years |
Housing prices:
Average estimated value of detached houses in 2021 (82.3% of all units):
| East Little York (Homestead): | $85,370 |
| Houston: | $304,685 |
Average estimated value of townhouses or other attached units in 2021 (6.7% of all units):
| This neighborhood: | $594,235 |
| city: | $305,463 |
Average estimated value of mobile home in 2021 (8.3% of all units):
| East Little York (Homestead): | $22,662 |
| Houston: | $60,006 |
Most popular occupations of males: construction, extraction, and maintenance occupations (22.3%); service occupations (21.7%); sales and office occupations (12.7%); transportation occupations (11.8%); production occupations (10.0%); management occupations (except farmers) (6.8%); material moving occupations (6.0%)
Most popular occupations of females: service occupations (33.6%); sales and office occupations (24.7%); healthcare practitioners and technical occupations (6.5%); production occupations (5.4%); management occupations (except farmers) (5.2%); material moving occupations (4.6%); education, training, and library occupations (4.2%)
Roads and streets: Little York Rd; Homestead Rd; Tidwell Rd; Hirsch Rd; Bretshire Dr; Parker Rd; Langley Rd; Cheeves Dr; Hopper Rd; Annunciation St; Tautenhahn; Calgary Ln; Mohawk St; Hartwick St (Hartwick Rd); Guadalupe St; Cobalt St; Leedale St; Maple Leaf St; Heath St; Rebel Rd; Lera St; Van Zandt St; Antha St; Peach Tree St (Peachtree St); Wiley Rd; Woodwick St; River Trail Dr; Wicklowe St; Spottswood Dr; Gleason Rd; Winfield Rd; Lakewood Dr; Caxton St; Yoe St; Boggess Rd; Colton St; Rhobell St; Smith Rd; Royal Oaks Dr; Wolbrook St; Bretton Dr; Bigwood St; Kelburn Dr; Caddo Rd; Castleton St; Camay Dr; Rockaway Dr; Pate Rd; Bainbridge St; Hollyglen Dr; Micollet St; Envoy St; Moss Oaks Dr; Barnham St; Onslow St; Plaza Dr; Bucknell Rd; Standing Oaks Dr; N Wayside Dr; Frazier River Dr; Gaston St; Navasota St; Rietta St; Yorkwood St; Sterlingshire St; Sam Houston St; Allwood St; Knightwood St; Mayle St; Sandy Oaks Dr; Saunders Rd; Cabot St; Lakemont Dr; Seneca St; Gray Oaks Dr; Lucerne St; Haywood St; Deanna; Dalebrook Dr; Bending Oaks St; Hollow Oaks Dr; Polly St; Hanley Ln; Senior St; Rosemary Ln; Sandra St; Danford Ln; Bertwood St; Claiborne St; Marilyn Ln; Mount Houston Rd; Westbrook Rd; Vailview Dr; Briarwick Ln; Hermann Rd; Cedar Hill Ln; Haverton Dr; Lockwood Dr; Harmon St; Wayside Dr; Ribstone Dr; White Thorn St; Tamworth Dr; Thackery Ln; Askins Ln; Mardale Dr; White Pine Ln; Nold Dr; Burning Bush Ln; Piedmont St; Glen Nook Dr; Styling Dr; Tully St (Tully Ave); Great Oaks Dr; Swan River; Blue River Dr; Pinehook Ln; Crofton St; Ferol Rd; Pittswood Ln; Ledford Ln; Shady Dr; Blades St; Charlesmont St; Ashworth St; Collins Rd; Spinet St; Garrett Rd; Gore Dr; San Lucia River Dr; Hedgewood St; Hesta Ln; Harcourt Dr; Ensworth Dr; Shady Timbers Dr; Spaulding St; Clear River Dr; Raincove Dr; Roughlock St; Bluestone Dr; Orlando St; Lemond Dr; J L Reaux St; Grey Oaks Dr; Breland St; Belridge St; Melanie St; Burningbush Ln; Van Archer; Ivy Leaf Rd; Farb Dr; Hartwick St; Ivy Leaf St; Nolridge Dr; Lebra St; Justin St; Lockern St; Hallshire Dr; Nold Rd; Francine Ln; Noldale Dr; Lavender St; Big Oaks Dr; Compton St; Seville; Valeview Dr; Glenn River Dr; Suburban Rd; Trudy St; Degas Ln; Castleton; Glen River Dr; Lundy Rd; River Spring Dr; Linvale Dr; Almont Dr; Okay St; Shadydale Ln; Heath Ct; S Lockwood Dr; Valmount; Knightwood Ct; Bridleway Cir; Bridlepark Cir; Rietta; Ina; Marian Ave; Styling Ct; Sundown Dr; Fala St; Breland; Linvale; Firnat St; Ribstone Cir; Maple Leaf.
Railroad features: Southern Pacific RR; Union Pacific RR; Houston Belt and Terminal Rlwy.
Other features: Halls Byu.
East Little York neighborhood detailed profile
Eastwood neighborhood in Houston statistics: (Find on map)
Area: 1.989 square miles
Population: 11,493
Population density:
Median household income in 2021:
Median rent in in 2021:
Male vs Females
Median age
Average estimated value of detached houses in 2021 (59.1% of all units):
Most popular occupations of males: construction, extraction, and maintenance occupations (18.7%); sales and office occupations (15.4%); service occupations (12.4%); management occupations (except farmers) (11.4%); transportation occupations (7.6%); computer and mathematical occupations (6.6%); production occupations (4.9%)
Most popular occupations of females: sales and office occupations (22.4%); service occupations (18.1%); legal occupations (12.2%); education, training, and library occupations (10.9%); healthcare practitioners and technical occupations (9.7%); management occupations (except farmers) (7.1%); business and financial operations occupations (6.4%)
Limited-access highways (interstate or state) in this neighborhood: Gulf Fwy (I- 45).
Roads and streets: Polk St; McKinney St; Walker St; Clay St; Rusk St; Bell St; Leeland St; Jefferson St; Pease St; Telephone Rd; Dumble St; S Lockwood Dr; Park Dr; Cullen Blvd; Milby St; Coyle St; Sampson St; Ernestine St; Sidney St; Munger St; Lombardy St; Eastwood St; Scott St; Elliott St; Leeland Ave (Leeland St); Dallas St; Henninger St; Hussion St; Scharpe St; Lamar St; Roberts St; N Capitol St; Lawson St; Woodside St; Capitol St; Eddington St; Edmundson St; Baird St; Godwin St; Velasco St; Pearson St; Collier St; Broadmoor St; Woodleigh St; York St; Denver St; Lindsay St; Fourcade St; Miller St; Altic St; St Joseph St (Saint Joseph St); Claremont St; Mable St; Gustav St; Fashion St; Harby St; Capitol; Wesley St; S Capitol St; Mulford St; Oakhurst St; Tharp Ave; Elliston St; Stimson St; Delmar St; Diez St; Hicksfield; Curtin St; Edgewood St; Lenox St; Monroe St; Calhoun-Pease; Texas St (Texas Ave); Eastwood Tc One Dr; Maplewood Ln; Oakland St; Jefferson; Ingeborg St; St Augustine; Wyatt St; Tharp St; Stonewall Dr; Keating St; Dallas Ave (Dallas St); Winchester; Napoleon St; Weaver Ave (Weaver St); Hauser St; Tomwood; Athens Dr; Marlin St; Lansing St; Lawndale St; Gulf Frwy Svc Rd (State Hwy 35); Mc Cormick St; Elm St; Eastwood Tc Two Dr; Fashion; Mc Kinney St; Ernestine; Eastwood Tc Three Dr; Lombardy; Hillman St; Clay; Trinidad St; Lockwood Dr; Lombardy Dr; Lamar; Hutcheson St; McKinney St (McKinney Ave); Wesley; Eastwood Tc Five Dr.
Railroad features: Houston Belt and Terminal Rlwy; Union Pacific RR; Southern Pacific RR; at and Sf Rlwy.
Eastwood neighborhood detailed profile
Area: 1.989 square miles
Population: 11,493
Population density:
| Eastwood: | 5,777 people per square mile |
| Houston: | 3,947 people per square mile |
Median household income in 2021:
| Eastwood: | $49,884 |
| Houston: | $55,499 |
Median rent in in 2021:
| Eastwood: | $898 |
| Houston: | $974 |
Male vs Females
| Males: | 5,879 |
| Females: | 5,614 |
Median age
| Males: | 38.3 years |
| Females: | 40.2 years |
Average estimated value of detached houses in 2021 (59.1% of all units):
| Eastwood: | $253,673 |
| Houston: | $304,685 |
Most popular occupations of males: construction, extraction, and maintenance occupations (18.7%); sales and office occupations (15.4%); service occupations (12.4%); management occupations (except farmers) (11.4%); transportation occupations (7.6%); computer and mathematical occupations (6.6%); production occupations (4.9%)
Most popular occupations of females: sales and office occupations (22.4%); service occupations (18.1%); legal occupations (12.2%); education, training, and library occupations (10.9%); healthcare practitioners and technical occupations (9.7%); management occupations (except farmers) (7.1%); business and financial operations occupations (6.4%)
Limited-access highways (interstate or state) in this neighborhood: Gulf Fwy (I- 45).
Roads and streets: Polk St; McKinney St; Walker St; Clay St; Rusk St; Bell St; Leeland St; Jefferson St; Pease St; Telephone Rd; Dumble St; S Lockwood Dr; Park Dr; Cullen Blvd; Milby St; Coyle St; Sampson St; Ernestine St; Sidney St; Munger St; Lombardy St; Eastwood St; Scott St; Elliott St; Leeland Ave (Leeland St); Dallas St; Henninger St; Hussion St; Scharpe St; Lamar St; Roberts St; N Capitol St; Lawson St; Woodside St; Capitol St; Eddington St; Edmundson St; Baird St; Godwin St; Velasco St; Pearson St; Collier St; Broadmoor St; Woodleigh St; York St; Denver St; Lindsay St; Fourcade St; Miller St; Altic St; St Joseph St (Saint Joseph St); Claremont St; Mable St; Gustav St; Fashion St; Harby St; Capitol; Wesley St; S Capitol St; Mulford St; Oakhurst St; Tharp Ave; Elliston St; Stimson St; Delmar St; Diez St; Hicksfield; Curtin St; Edgewood St; Lenox St; Monroe St; Calhoun-Pease; Texas St (Texas Ave); Eastwood Tc One Dr; Maplewood Ln; Oakland St; Jefferson; Ingeborg St; St Augustine; Wyatt St; Tharp St; Stonewall Dr; Keating St; Dallas Ave (Dallas St); Winchester; Napoleon St; Weaver Ave (Weaver St); Hauser St; Tomwood; Athens Dr; Marlin St; Lansing St; Lawndale St; Gulf Frwy Svc Rd (State Hwy 35); Mc Cormick St; Elm St; Eastwood Tc Two Dr; Fashion; Mc Kinney St; Ernestine; Eastwood Tc Three Dr; Lombardy; Hillman St; Clay; Trinidad St; Lockwood Dr; Lombardy Dr; Lamar; Hutcheson St; McKinney St (McKinney Ave); Wesley; Eastwood Tc Five Dr.
Railroad features: Houston Belt and Terminal Rlwy; Union Pacific RR; Southern Pacific RR; at and Sf Rlwy.
Eastwood neighborhood detailed profile
Edgebrook neighborhood in Houston statistics: (Find on map)
Area: 2.975 square miles
Population: 20,587
Population density:
Median household income in 2021:
Median rent in in 2021:
Male vs Females
Median age
Most popular occupations of males: construction, extraction, and maintenance occupations (40.1%); transportation occupations (16.5%); service occupations (14.9%); computer and mathematical occupations (8.6%); production occupations (8.2%); architecture and engineering occupations (4.4%); material moving occupations (3.9%)
Most popular occupations of females: service occupations (39.6%); sales and office occupations (38.7%); management occupations (except farmers) (8.0%); business and financial operations occupations (6.5%); production occupations (5.3%); material moving occupations (2.6%); healthcare practitioners and technical occupations (1.9%)
Limited-access highways (interstate or state) in this neighborhood: I- 45 (Gulf Fwy).
Highways in this neighborhood: State Hwy 3 (Galveston Rd).
Roads and streets: Edgebrook Dr; Frey Rd; Globe St; Elton St; Marlene St; Hartsook St; Shawnee St; Roper St; Gilpin Ln (Gilpin St); Eastlake; Sulphur St; Theta St; Bessemer St; Regal St; Rodney St; Aves St; Hinds St; Ney St; Arvana St; Tolman St; Kittrell St; S Shaver St Exd; Bronson St; Avenell Rd; Minnesota St; Princess Dr; Coronation Dr; Vennard Rd; Viceroy Dr; Out Look Dr; Laskey St; Ravenhead Dr; Delwin St (Delwin Rd); N Broadway; Parkcrest Dr; Balcones Dr; Tarbell Rd; Creager St; Barada St; Arrow; Witt Rd; Freeton St; Arlington Square Dr; Mace St; Parliament Dr; Empress Dr; Chambers St; Ambursen St; Redford St; Metz St; Church Ln; Curlee Rd; Freewood St; Susan; Darlene Ln; Almeda-Genoa Rd; Dalby St; Pearl Hall; Vinita St; Nell; Parakeet St; Orean St; Welk St; Loving St; Boykin St; Thurmon St; Belden; Rifle; Easthaven Blvd; 11th St; Lavaun; Redford; Metz; Eastlake Ct; Sulphur.
Railroad features: Union Pacific RR.
Edgebrook neighborhood detailed profile
Area: 2.975 square miles
Population: 20,587
Population density:
| Edgebrook: | 6,920 people per square mile |
| Houston: | 3,947 people per square mile |
Median household income in 2021:
| Edgebrook: | $39,067 |
| Houston: | $55,499 |
Median rent in in 2021:
| Edgebrook: | $1,029 |
| Houston: | $974 |
Male vs Females
| Males: | 9,888 |
| Females: | 10,698 |
Median age
| Males: | 29.1 years |
| Females: | 23.9 years |
Most popular occupations of males: construction, extraction, and maintenance occupations (40.1%); transportation occupations (16.5%); service occupations (14.9%); computer and mathematical occupations (8.6%); production occupations (8.2%); architecture and engineering occupations (4.4%); material moving occupations (3.9%)
Most popular occupations of females: service occupations (39.6%); sales and office occupations (38.7%); management occupations (except farmers) (8.0%); business and financial operations occupations (6.5%); production occupations (5.3%); material moving occupations (2.6%); healthcare practitioners and technical occupations (1.9%)
Limited-access highways (interstate or state) in this neighborhood: I- 45 (Gulf Fwy).
Highways in this neighborhood: State Hwy 3 (Galveston Rd).
Roads and streets: Edgebrook Dr; Frey Rd; Globe St; Elton St; Marlene St; Hartsook St; Shawnee St; Roper St; Gilpin Ln (Gilpin St); Eastlake; Sulphur St; Theta St; Bessemer St; Regal St; Rodney St; Aves St; Hinds St; Ney St; Arvana St; Tolman St; Kittrell St; S Shaver St Exd; Bronson St; Avenell Rd; Minnesota St; Princess Dr; Coronation Dr; Vennard Rd; Viceroy Dr; Out Look Dr; Laskey St; Ravenhead Dr; Delwin St (Delwin Rd); N Broadway; Parkcrest Dr; Balcones Dr; Tarbell Rd; Creager St; Barada St; Arrow; Witt Rd; Freeton St; Arlington Square Dr; Mace St; Parliament Dr; Empress Dr; Chambers St; Ambursen St; Redford St; Metz St; Church Ln; Curlee Rd; Freewood St; Susan; Darlene Ln; Almeda-Genoa Rd; Dalby St; Pearl Hall; Vinita St; Nell; Parakeet St; Orean St; Welk St; Loving St; Boykin St; Thurmon St; Belden; Rifle; Easthaven Blvd; 11th St; Lavaun; Redford; Metz; Eastlake Ct; Sulphur.
Railroad features: Union Pacific RR.
Edgebrook neighborhood detailed profile
Eldridge neighborhood in Houston statistics: (Find on map)
Area: 29.694 square miles
Population: 10,920
Population density:
Median household income in 2021:
Median rent in in 2021:
Male vs Females
Median age
Housing prices:
Average estimated value of detached houses in 2021 (30.5% of all units):
Average estimated value of townhouses or other attached units in 2021 (102.6% of all units):
Most popular occupations of males: sales and office occupations (16.9%); management occupations (except farmers) (15.1%); service occupations (13.6%); business and financial operations occupations (10.9%); computer and mathematical occupations (8.5%); material moving occupations (6.9%); construction, extraction, and maintenance occupations (6.0%)
Most popular occupations of females: sales and office occupations (35.4%); service occupations (28.2%); management occupations (except farmers) (9.0%); healthcare practitioners and technical occupations (6.1%); education, training, and library occupations (4.5%); business and financial operations occupations (4.1%); architecture and engineering occupations (3.6%)
Roads and streets: FM 1093; FM 1093 (Westheimer Rd); Westheimer Pkwy (FM 1093 Rd, FM 1093); Nettlebrook Ln; Cascade Springs Dr; Memorial Pass Dr; Barton Park Ln; Cajon Canyon Ct; O Brian; Montbury Ln; Sage Mountain Ln; Peek Rd; Mason Rd.
Other features: Buffalo Byu.
Other features: Borrow Ditch; Clodine Area Ditch.
Highways in this neighborhood: State Hwy 6 (Addicks Howell Rd).
Roads and streets: FM 1093 (Westheimer Rd); Westheimer Pkwy; O'Brien Rd (Barker-Clodine Rd); Briar Forest Dr; Richmond Ave; Eldridge Pkwy (Eldridge Pkwy S); Ashford Point Dr; Enclave Pkwy; Beeler Rd; Westpark Dr; Synott Rd; Addicks Clodine Rd; S Dairy Ashford St (S Dairy Ashford Rd); Piping Rock Ln; Whittington Dr; Briargreen Dr; Park Bayou Dr; Parkway Plaza Dr; Westella Dr; Westhollow Dr; Shadowbriar Dr; Ashford Park Dr; Oxford Park Dr; Skymeadow Dr; Wickersham Ln; Westleigh Dr; Gentryside Dr; Ashfield Dr; Bay Front Dr; Shooting Center Dr; Briarhills Pkwy; Brant Rock Dr; Meadway Dr; Grisby Rd; Briar Patch Dr; Swiss Hill Dr; Locke Ln; Rolk Rd; Kingsbridge Ln; Westmere Dr; Ashlock Dr; Westwick Dr; Forest Home Dr; Ella Lee Ln; Foreland Dr; Ashton Park Dr; Ashford Meadow Dr; Briar Home Dr; Brimhurst Dr; Medfield Dr; Joel Wheaton Rd; Panagard Dr; Chevy Chase Dr; Parkhollow Dr; Hay Ln; Ashford Creek Dr; Skypark Dr; Westerloch Dr; S Shadow Cove Dr; Briarlee Dr; Caseta Dr; Overbrook Ln; Burgoyne Rd; Westway Ln; Briarwest Blvd; Briar Bayou Dr; Forkland Dr (Forkland Ln); Shadow Cove Dr; Shadowwalk Dr; Ashford Oak Dr; Lakeshore Way; W Oaks Plaza Dr; Westminster Plaza Dr; Holly Lynn Ln; Cottage Landing Ln; Shadow Island Dr; Ashford Knoll Dr; Avenida Vaquero St; Shadow Point Dr; Scholarship; Ashford Trail Dr; Trace Dr; Westhorpe Dr; Westmead Dr; Golders Green Dr; Avenida la Quinta St; Parkway Plaza Dr (Sandbridge St); Barker Oaks Dr; Ashford Chase Dr; Ashburnham Dr; Naomi Hollow Ln; Ashford Brook Dr; Ensley Wood Dr; Olive Hill Dr; Shady Downs Dr; Ashford Hills Dr; Briarbrook Ln; Hazy Park Dr; Jewel Ann Dr (Jewel Ann St); Parkridge Glen Dr; Shadow Vista Dr; Binley Dr; Hollowgreen Dr; Shadowknoll Dr; Sandri Ln; Crest Park Dr; Westhurst Ln; Green Crest Dr; Diamond Springs Dr; Bayou Pkwy; Hollow Creek Dr; Olympic Dr; Crescent Palm Ln; Briarwest Cir; Wellington Arch Ln; Sandfield Dr; Sienna Hill Ln (Sienna Hill Dr); Beaconshire Rd; Waldemere Dr; Rifle & Pistol Ct; Carriage Walk Ln; N Shadow Cove Dr (N Shadow Cove Ln); Misty Park Dr; Lakeside Bend Dr; Swallowfield Dr; Manderly Dr; Woodnook Dr; Shadow Trace Dr; Sheri Hollow Ln; Silverado Dr; Peachwood Bend; Aspen Cove Dr; Brookbluff Ln; Village Gate Dr; Hampton Cove Dr; Highcroft Dr; Enclave Lake Dr; Eagan Mill Dr; Barker Oaks Rd; Westbranch Dr; Briarport Dr; Lakeside Enclave Dr; Briarview Dr; S Briar Knoll Dr; Creekview Park Dr; Shadowchase Dr; Rincon Dr; S Greenpark Dr; Neils Branch Dr; Gerrards Cross Dr; Coachlight Dr; Shadowmist Dr; Ashbury Park Ln (Ashbury Park Dr); Hazel Park Dr; Briarworth Dr; Sunset Dune Dr; Ashford Pine Dr; Arrow Hill Rd; N Tracewood Bend; Blooming Grove Ln; Briar Forest; Ivy Parkway Dr; Goar Rd; Briarplace Dr; Shadowfern Dr; Valedictorian Dr; Briarturn Dr; Hill Branch Dr; Briarcrest Dr; Chapman Glen Dr; Stokesmount Dr; Ascot Glen Ln; Kingston Vale Dr; Lake of Pkwy; Miles Dr; Glasgow Pl; Shadowbark Dr; Rockin Dr; Jamara Ln; Linea del Pino St; Ashley Run; Hollow Brook Dr; Chipman Glen Dr; Finchley Dr; Tapper Hill Dr; Townshire Dr; Knollwest Dr; Stampford Dr; Trapper Hill Dr; Ainsdale Dr; Creekside Park Dr; Winter Creek Ct; Overture Dr; Meadowline Dr; Stone Way Dr; Meadow Briar Dr; Cherry Mound Rd; Orchard Hill St; S Richmond Ave; Northfleet Dr; Shadowmeadows Dr; Skyknoll Ln; Shadow Hollow Dr; Trailville Dr; Kimbleton Ct; Parkhaven Ln; Kennebeck Pl; Langbourne Dr; Heatherhill Pl (Heather Hill Pl); Bradney Dr; Scarborough Fair St; Edinburgh Ct; Senca Park Dr; Ashclift Dr; Honey Hill Dr; Maxfield Dr; Fallsview Ln; Sandpebble Chase; Charlton Dr (Charlton Park Dr, Charlton Park); S Tracewood Bend; Aspen Hollow Ln; Suffolk Chase Ln; Luton Park Dr; Peach Hollow Ln; Cherry Hollow Ln; Walnut Hollow Ln; Beech Hollow Ln; Birch Hollow Ln; Threadall Park Dr; Bywater Dr; Paso Rello Dr; Village Square Dr; Briarsage Ct (Brinesage Ct); Stoney Hill Dr; Darnley Ln; Benfield Dr; Hazyglen Dr; Cedarmoor Ct; Hollowcreek Park Dr; Ashford Bend Dr; Chamberlain Dr; Boulder Springs Ln; Shadowleaf Dr; Gardencrest Ln; Woodville Gardens Dr; Hillvale Dr; Waypark Dr; Brentonwood Ln; Shadow Green Dr; Glacier Hill Dr; Chimes Dr; Chadwell Glen Dr (Chadwell Glen Ln); Withersdale Dr; Shadycrest Dr; Shady Harbor Dr; Lochshire Dr; Bradbridge Ln; Summit Valley Dr; Barnhart Blvd; Sheer Water Dr; Waller Hill Dr (Oak Parkway Dr); Mission Chase Dr; Briarstem Dr; Ivyhurst Ln; Shadow Spring Ct; Cloud Cliff Ln; Cottrell Ct; Harness Oaks Ct; Shadow Bayou Ct; Shadywind Dr; Marble Creek Ct; Hollandale Dr; Sheltons Bend Ct; Orchard Park Dr; Copperas Cove (Coppers Cove); Adams Walk Ct; Shady Breeze Dr; Thatcher Dr; Enclave Sq W; Mews Cir; Keenen Ct; Briar Path Dr; E Stephanshire; Shadow Wick Ln; Shanon Marie Ln; Ashford Arbor Dr; Lapstone Dr; Truckee Dr; Westhollow Park Dr; Jade Cove Dr; Pigeon Ct; Melford Dr; Starlight Harbour Ct; St Johns Woods St; Darby Cove; Tracewood Glen; Lakeshore Way Cove; Shadowvale Dr; Fifle & Pistol Ct; Lakeshore Way Ct; Shadow Place Dr; Denio Dr; Lori Hall W; Poplar Glen Ln; Enclave Round St; Shadowhollow Dr; Briar Heath Dr; Enclave Sq E; Broadmeadow Ln; Watercastle Ct; Wickersham Dr; Bayou Parkway Ct; Leighton Ln (Lexington Ln); Victor Ln; Westhill Ln; Indigo Lake Ct; Stoney Wood Dr; Bonniefield; Layhill Ct; Chaseland Ln; Mica Dr; Lakeside Trl; Tutor Ln; Summit Park Dr; Still Bay Ct; Normans Woods St; Provident Oaks Ln; Marksman Way; Cricket Wood Cir; Ridgecrossing Ln; Shadow Royale Dr; Park Royal Dr; Parkway Ct; Enclave Sq; E Broadbury; Roxton Dr; Paige Manner Dr; Baker Rd; Shadow Side Ct; W Wellesford; Charlton Way Dr; Enclave Sq S; Brandywyne Ct; E Donningham; Crescent Palm Ct; E Wellesford; E Canterbury; Enclave Sq N; Hollowcreek Ct; W Donningham; W Canterbury; W Broadbury; Shadymist Ct (Shadymist Dr); Pine Laurel Ct; Little Ct; Enclave Trl; Shadowbluff Ct; W Stephanshire; Greencrest Dr; Shadow Bluff Ct; N Shadow Cove Ln; Aspen Cove Ct; Ivyside Dr; Pistol Ln; Shadowside Ct; Shadowfern Ct; Shadowchase Ct; Enclave Ln; Rifle Ln; Rika Pt; Ashley Falls; Ivyhurst Ct; Kilmer Way; Havant Cir; Ashbury Park Ct; Emsworth Cir; Briarsage Dr; Meadway Ct; Teal Shore Ct; Shadow Fork Ct; Lakeside Bend Ct; Whittington Ct N; Widley Cir; Binley Ct; Whittington Ct S; Shadow Knoll Ct; Shadow Cove Ct; Walden Hill Ct; Foreland Ct; Farlington Cir; Rich Ct; Palmetto Point Ln; Shadow Dust Ct; Ridgeburg Ct; Rolish; Peachwood Ct; Jamara Cir; Briar Knoll Dr.
Railroad features: Southern Pacific RR.
Other features: Buffalo Byu.
Other features: Clodine Area Ditch; Borrow Ditch; Brays Byu; Barker Area Ditch.
Other features: Barker Reservoir; Mason Crk.
Eldridge neighborhood detailed profile
Area: 29.694 square miles
Population: 10,920
Population density:
| Eldridge (West Oaks): | 368 people per square mile |
| Houston: | 3,947 people per square mile |
Median household income in 2021:
| Eldridge (West Oaks): | $72,500 |
| Houston: | $55,499 |
Median rent in in 2021:
| Eldridge (West Oaks): | $1,100 |
| Houston: | $974 |
Male vs Females
| Males: | 4,929 |
| Females: | 5,990 |
Median age
| Males: | 35.6 years |
| Females: | 40.4 years |
Housing prices:
Average estimated value of detached houses in 2021 (30.5% of all units):
| Eldridge (West Oaks): | $204,935 |
| Houston: | $304,685 |
Average estimated value of townhouses or other attached units in 2021 (102.6% of all units):
| This neighborhood: | $1,714,577 |
| city: | $305,463 |
Most popular occupations of males: sales and office occupations (16.9%); management occupations (except farmers) (15.1%); service occupations (13.6%); business and financial operations occupations (10.9%); computer and mathematical occupations (8.5%); material moving occupations (6.9%); construction, extraction, and maintenance occupations (6.0%)
Most popular occupations of females: sales and office occupations (35.4%); service occupations (28.2%); management occupations (except farmers) (9.0%); healthcare practitioners and technical occupations (6.1%); education, training, and library occupations (4.5%); business and financial operations occupations (4.1%); architecture and engineering occupations (3.6%)
Roads and streets: FM 1093; FM 1093 (Westheimer Rd); Westheimer Pkwy (FM 1093 Rd, FM 1093); Nettlebrook Ln; Cascade Springs Dr; Memorial Pass Dr; Barton Park Ln; Cajon Canyon Ct; O Brian; Montbury Ln; Sage Mountain Ln; Peek Rd; Mason Rd.
Other features: Buffalo Byu.
Other features: Borrow Ditch; Clodine Area Ditch.
Highways in this neighborhood: State Hwy 6 (Addicks Howell Rd).
Roads and streets: FM 1093 (Westheimer Rd); Westheimer Pkwy; O'Brien Rd (Barker-Clodine Rd); Briar Forest Dr; Richmond Ave; Eldridge Pkwy (Eldridge Pkwy S); Ashford Point Dr; Enclave Pkwy; Beeler Rd; Westpark Dr; Synott Rd; Addicks Clodine Rd; S Dairy Ashford St (S Dairy Ashford Rd); Piping Rock Ln; Whittington Dr; Briargreen Dr; Park Bayou Dr; Parkway Plaza Dr; Westella Dr; Westhollow Dr; Shadowbriar Dr; Ashford Park Dr; Oxford Park Dr; Skymeadow Dr; Wickersham Ln; Westleigh Dr; Gentryside Dr; Ashfield Dr; Bay Front Dr; Shooting Center Dr; Briarhills Pkwy; Brant Rock Dr; Meadway Dr; Grisby Rd; Briar Patch Dr; Swiss Hill Dr; Locke Ln; Rolk Rd; Kingsbridge Ln; Westmere Dr; Ashlock Dr; Westwick Dr; Forest Home Dr; Ella Lee Ln; Foreland Dr; Ashton Park Dr; Ashford Meadow Dr; Briar Home Dr; Brimhurst Dr; Medfield Dr; Joel Wheaton Rd; Panagard Dr; Chevy Chase Dr; Parkhollow Dr; Hay Ln; Ashford Creek Dr; Skypark Dr; Westerloch Dr; S Shadow Cove Dr; Briarlee Dr; Caseta Dr; Overbrook Ln; Burgoyne Rd; Westway Ln; Briarwest Blvd; Briar Bayou Dr; Forkland Dr (Forkland Ln); Shadow Cove Dr; Shadowwalk Dr; Ashford Oak Dr; Lakeshore Way; W Oaks Plaza Dr; Westminster Plaza Dr; Holly Lynn Ln; Cottage Landing Ln; Shadow Island Dr; Ashford Knoll Dr; Avenida Vaquero St; Shadow Point Dr; Scholarship; Ashford Trail Dr; Trace Dr; Westhorpe Dr; Westmead Dr; Golders Green Dr; Avenida la Quinta St; Parkway Plaza Dr (Sandbridge St); Barker Oaks Dr; Ashford Chase Dr; Ashburnham Dr; Naomi Hollow Ln; Ashford Brook Dr; Ensley Wood Dr; Olive Hill Dr; Shady Downs Dr; Ashford Hills Dr; Briarbrook Ln; Hazy Park Dr; Jewel Ann Dr (Jewel Ann St); Parkridge Glen Dr; Shadow Vista Dr; Binley Dr; Hollowgreen Dr; Shadowknoll Dr; Sandri Ln; Crest Park Dr; Westhurst Ln; Green Crest Dr; Diamond Springs Dr; Bayou Pkwy; Hollow Creek Dr; Olympic Dr; Crescent Palm Ln; Briarwest Cir; Wellington Arch Ln; Sandfield Dr; Sienna Hill Ln (Sienna Hill Dr); Beaconshire Rd; Waldemere Dr; Rifle & Pistol Ct; Carriage Walk Ln; N Shadow Cove Dr (N Shadow Cove Ln); Misty Park Dr; Lakeside Bend Dr; Swallowfield Dr; Manderly Dr; Woodnook Dr; Shadow Trace Dr; Sheri Hollow Ln; Silverado Dr; Peachwood Bend; Aspen Cove Dr; Brookbluff Ln; Village Gate Dr; Hampton Cove Dr; Highcroft Dr; Enclave Lake Dr; Eagan Mill Dr; Barker Oaks Rd; Westbranch Dr; Briarport Dr; Lakeside Enclave Dr; Briarview Dr; S Briar Knoll Dr; Creekview Park Dr; Shadowchase Dr; Rincon Dr; S Greenpark Dr; Neils Branch Dr; Gerrards Cross Dr; Coachlight Dr; Shadowmist Dr; Ashbury Park Ln (Ashbury Park Dr); Hazel Park Dr; Briarworth Dr; Sunset Dune Dr; Ashford Pine Dr; Arrow Hill Rd; N Tracewood Bend; Blooming Grove Ln; Briar Forest; Ivy Parkway Dr; Goar Rd; Briarplace Dr; Shadowfern Dr; Valedictorian Dr; Briarturn Dr; Hill Branch Dr; Briarcrest Dr; Chapman Glen Dr; Stokesmount Dr; Ascot Glen Ln; Kingston Vale Dr; Lake of Pkwy; Miles Dr; Glasgow Pl; Shadowbark Dr; Rockin Dr; Jamara Ln; Linea del Pino St; Ashley Run; Hollow Brook Dr; Chipman Glen Dr; Finchley Dr; Tapper Hill Dr; Townshire Dr; Knollwest Dr; Stampford Dr; Trapper Hill Dr; Ainsdale Dr; Creekside Park Dr; Winter Creek Ct; Overture Dr; Meadowline Dr; Stone Way Dr; Meadow Briar Dr; Cherry Mound Rd; Orchard Hill St; S Richmond Ave; Northfleet Dr; Shadowmeadows Dr; Skyknoll Ln; Shadow Hollow Dr; Trailville Dr; Kimbleton Ct; Parkhaven Ln; Kennebeck Pl; Langbourne Dr; Heatherhill Pl (Heather Hill Pl); Bradney Dr; Scarborough Fair St; Edinburgh Ct; Senca Park Dr; Ashclift Dr; Honey Hill Dr; Maxfield Dr; Fallsview Ln; Sandpebble Chase; Charlton Dr (Charlton Park Dr, Charlton Park); S Tracewood Bend; Aspen Hollow Ln; Suffolk Chase Ln; Luton Park Dr; Peach Hollow Ln; Cherry Hollow Ln; Walnut Hollow Ln; Beech Hollow Ln; Birch Hollow Ln; Threadall Park Dr; Bywater Dr; Paso Rello Dr; Village Square Dr; Briarsage Ct (Brinesage Ct); Stoney Hill Dr; Darnley Ln; Benfield Dr; Hazyglen Dr; Cedarmoor Ct; Hollowcreek Park Dr; Ashford Bend Dr; Chamberlain Dr; Boulder Springs Ln; Shadowleaf Dr; Gardencrest Ln; Woodville Gardens Dr; Hillvale Dr; Waypark Dr; Brentonwood Ln; Shadow Green Dr; Glacier Hill Dr; Chimes Dr; Chadwell Glen Dr (Chadwell Glen Ln); Withersdale Dr; Shadycrest Dr; Shady Harbor Dr; Lochshire Dr; Bradbridge Ln; Summit Valley Dr; Barnhart Blvd; Sheer Water Dr; Waller Hill Dr (Oak Parkway Dr); Mission Chase Dr; Briarstem Dr; Ivyhurst Ln; Shadow Spring Ct; Cloud Cliff Ln; Cottrell Ct; Harness Oaks Ct; Shadow Bayou Ct; Shadywind Dr; Marble Creek Ct; Hollandale Dr; Sheltons Bend Ct; Orchard Park Dr; Copperas Cove (Coppers Cove); Adams Walk Ct; Shady Breeze Dr; Thatcher Dr; Enclave Sq W; Mews Cir; Keenen Ct; Briar Path Dr; E Stephanshire; Shadow Wick Ln; Shanon Marie Ln; Ashford Arbor Dr; Lapstone Dr; Truckee Dr; Westhollow Park Dr; Jade Cove Dr; Pigeon Ct; Melford Dr; Starlight Harbour Ct; St Johns Woods St; Darby Cove; Tracewood Glen; Lakeshore Way Cove; Shadowvale Dr; Fifle & Pistol Ct; Lakeshore Way Ct; Shadow Place Dr; Denio Dr; Lori Hall W; Poplar Glen Ln; Enclave Round St; Shadowhollow Dr; Briar Heath Dr; Enclave Sq E; Broadmeadow Ln; Watercastle Ct; Wickersham Dr; Bayou Parkway Ct; Leighton Ln (Lexington Ln); Victor Ln; Westhill Ln; Indigo Lake Ct; Stoney Wood Dr; Bonniefield; Layhill Ct; Chaseland Ln; Mica Dr; Lakeside Trl; Tutor Ln; Summit Park Dr; Still Bay Ct; Normans Woods St; Provident Oaks Ln; Marksman Way; Cricket Wood Cir; Ridgecrossing Ln; Shadow Royale Dr; Park Royal Dr; Parkway Ct; Enclave Sq; E Broadbury; Roxton Dr; Paige Manner Dr; Baker Rd; Shadow Side Ct; W Wellesford; Charlton Way Dr; Enclave Sq S; Brandywyne Ct; E Donningham; Crescent Palm Ct; E Wellesford; E Canterbury; Enclave Sq N; Hollowcreek Ct; W Donningham; W Canterbury; W Broadbury; Shadymist Ct (Shadymist Dr); Pine Laurel Ct; Little Ct; Enclave Trl; Shadowbluff Ct; W Stephanshire; Greencrest Dr; Shadow Bluff Ct; N Shadow Cove Ln; Aspen Cove Ct; Ivyside Dr; Pistol Ln; Shadowside Ct; Shadowfern Ct; Shadowchase Ct; Enclave Ln; Rifle Ln; Rika Pt; Ashley Falls; Ivyhurst Ct; Kilmer Way; Havant Cir; Ashbury Park Ct; Emsworth Cir; Briarsage Dr; Meadway Ct; Teal Shore Ct; Shadow Fork Ct; Lakeside Bend Ct; Whittington Ct N; Widley Cir; Binley Ct; Whittington Ct S; Shadow Knoll Ct; Shadow Cove Ct; Walden Hill Ct; Foreland Ct; Farlington Cir; Rich Ct; Palmetto Point Ln; Shadow Dust Ct; Ridgeburg Ct; Rolish; Peachwood Ct; Jamara Cir; Briar Knoll Dr.
Railroad features: Southern Pacific RR.
Other features: Buffalo Byu.
Other features: Clodine Area Ditch; Borrow Ditch; Brays Byu; Barker Area Ditch.
Other features: Barker Reservoir; Mason Crk.
Eldridge neighborhood detailed profile
Fairbanks neighborhood in Houston statistics: (Find on map)
Area: 6.704 square miles
Population: 23,661
Population density:
Median household income in 2021:
Median rent in in 2021:
Male vs Females
Median age
Housing prices:
Average estimated value of detached houses in 2021 (54.0% of all units):
Average estimated value of townhouses or other attached units in 2021 (22.1% of all units):
Average estimated '21 value of housing units in 5-or-more-unit structures (26.2% of all units):
Most popular occupations of males: service occupations (45.1%); transportation occupations (21.5%); construction, extraction, and maintenance occupations (10.8%); business and financial operations occupations (10.2%); management occupations (except farmers) (8.3%); sales and office occupations (6.2%); arts, design, entertainment, sports, and media occupations (4.6%)
Most popular occupations of females: sales and office occupations (52.9%); management occupations (except farmers) (20.8%); legal occupations (18.3%); healthcare practitioners and technical occupations (4.2%); life, physical, and social science occupations (3.7%)
Highways in this neighborhood: US Hwy 290; 290-Hov Fwy (US Hwy 290).
Roads and streets: W Tidwell Rd; Clay Rd; Pinemont Dr; Hempstead Rd (Hempstead Hwy); Northcourt Rd; Hollister St; Langfield Rd; Guhn Rd; Southerland Rd; Blalock Rd; Old Fairbanks-N Houston Rd (Fairbanks N Houston Rd); Hillmont St; Fawndale Ln; Hempstead Rd; Windfern Rd; Flintlock Rd; Dow Rd; Baythorne Dr; Bingle Rd; W 43rd St; Aston St; Pine Grove Dr; Grow Ln; Ellinger Ln; Packard St; Stonington St; Burr Oak St; Frontier Dr; Tilson Ln; Cole Creek Dr; Wilshire Place Dr; S Pinemont Dr; Wyandott Blvd; Lockfield St; Reo St; Drowsy Pine Dr; Belmore St; Jameel Rd; NW Central Dr; Pine Timbers St; Leghorn St; Stagecoach Dr; Langtry St; Kaiser St; Clark Rd (Hollister St); Campbell Rd; Alamo Rd; NW 100 Dr (Northwest Dr); Northfield Ln; Dayco St; Inkberry Dr; Raywood Blvd; W by Northwest Blvd; Outpost Dr; Yorktown Plaza Dr (York Town Plaza Dr); Pine Vista Ln; Blackgum Dr; Ted St; Rothway St; Maxwell Rd; Brookshire St (Brookshire Dr); Casa Loma Dr; Barney Rd; Pecan St (Newbridge St); Spring Valley Rd; Grovehill St; Grovecrest St; Millport St; Langtry Ln; Castleford St; Way Out West Dr; Bamboo Rd; Springbrook Dr; la Vista Dr; Dayco Ave; Lawford Ln; Cotton Dr; Beeman Way; Semmons Rd; Palo Pinto Dr; Rockcrest Dr; Van Wall St; Roy Bean Dr; Gessner Dr; Bellknap Rd; Tavern St; Cranswick Rd; W Wingfoot Rd; Steadmont Dr; Barr Oaks Dr; Hillmont; Rosprim St; Seacat Blvd; Sampley Way; la Grange; Sowden Rd; Rena Ave; Premier St; Highrock Rd; Broom Ave; Bitternut Dr; Chinaberry Dr; Poppy St; Trentway St; Six Flags Rd (Six Flags Dr); Shurmard Dr; Singer; Sequoia Dr; Thornwall St; Sprite St; Celina Ln; Willow Oak Dr; Windfern Rd (Windfern Ln); Thunderbird Rd; Hoover St (Hoover Ave); Rena St; Cherry Tree St; Castlebay Dr; Pinewick Ln; Pinehill Ln; Knotty Wood Dr; Black Oak Dr; Pine Bark Dr; Anaqua Dr; N Linpar Ct; Hawley Ln; Burr Oak Dr; S Linpar Ct; Pecan; Castlebay; Healey; Stanley Ct; Lively Ln; Singer St; Denny St (Denny); Concord Park Dr; Enelo Dr; E Linpar Ct; Gessner Rd; Pine Cove Dr; Tidwell Rd; Overland; Hempstead St; W Linpar Ct; Burlington North Dr; Pinemont Pr Six Dr.
Railroad features: Southern Pacific RR.
Other features: Cole Crk.
Fairbanks neighborhood detailed profile
Area: 6.704 square miles
Population: 23,661
Population density:
| Fairbanks (Northwest Crossing): | 3,529 people per square mile |
| Houston: | 3,947 people per square mile |
Median household income in 2021:
| Fairbanks (Northwest Crossing): | $49,551 |
| Houston: | $55,499 |
Median rent in in 2021:
| Fairbanks (Northwest Crossing): | $896 |
| Houston: | $974 |
Male vs Females
| Males: | 11,130 |
| Females: | 12,531 |
Median age
| Males: | 38.3 years |
| Females: | 38.0 years |
Housing prices:
Average estimated value of detached houses in 2021 (54.0% of all units):
| Fairbanks (Northwest Crossing): | $224,386 |
| Houston: | $304,685 |
Average estimated value of townhouses or other attached units in 2021 (22.1% of all units):
| This neighborhood: | $110,625 |
| city: | $305,463 |
Average estimated '21 value of housing units in 5-or-more-unit structures (26.2% of all units):
| Fairbanks (Northwest Crossing): | $59,816 |
| Houston: | $227,414 |
Most popular occupations of males: service occupations (45.1%); transportation occupations (21.5%); construction, extraction, and maintenance occupations (10.8%); business and financial operations occupations (10.2%); management occupations (except farmers) (8.3%); sales and office occupations (6.2%); arts, design, entertainment, sports, and media occupations (4.6%)
Most popular occupations of females: sales and office occupations (52.9%); management occupations (except farmers) (20.8%); legal occupations (18.3%); healthcare practitioners and technical occupations (4.2%); life, physical, and social science occupations (3.7%)
Highways in this neighborhood: US Hwy 290; 290-Hov Fwy (US Hwy 290).
Roads and streets: W Tidwell Rd; Clay Rd; Pinemont Dr; Hempstead Rd (Hempstead Hwy); Northcourt Rd; Hollister St; Langfield Rd; Guhn Rd; Southerland Rd; Blalock Rd; Old Fairbanks-N Houston Rd (Fairbanks N Houston Rd); Hillmont St; Fawndale Ln; Hempstead Rd; Windfern Rd; Flintlock Rd; Dow Rd; Baythorne Dr; Bingle Rd; W 43rd St; Aston St; Pine Grove Dr; Grow Ln; Ellinger Ln; Packard St; Stonington St; Burr Oak St; Frontier Dr; Tilson Ln; Cole Creek Dr; Wilshire Place Dr; S Pinemont Dr; Wyandott Blvd; Lockfield St; Reo St; Drowsy Pine Dr; Belmore St; Jameel Rd; NW Central Dr; Pine Timbers St; Leghorn St; Stagecoach Dr; Langtry St; Kaiser St; Clark Rd (Hollister St); Campbell Rd; Alamo Rd; NW 100 Dr (Northwest Dr); Northfield Ln; Dayco St; Inkberry Dr; Raywood Blvd; W by Northwest Blvd; Outpost Dr; Yorktown Plaza Dr (York Town Plaza Dr); Pine Vista Ln; Blackgum Dr; Ted St; Rothway St; Maxwell Rd; Brookshire St (Brookshire Dr); Casa Loma Dr; Barney Rd; Pecan St (Newbridge St); Spring Valley Rd; Grovehill St; Grovecrest St; Millport St; Langtry Ln; Castleford St; Way Out West Dr; Bamboo Rd; Springbrook Dr; la Vista Dr; Dayco Ave; Lawford Ln; Cotton Dr; Beeman Way; Semmons Rd; Palo Pinto Dr; Rockcrest Dr; Van Wall St; Roy Bean Dr; Gessner Dr; Bellknap Rd; Tavern St; Cranswick Rd; W Wingfoot Rd; Steadmont Dr; Barr Oaks Dr; Hillmont; Rosprim St; Seacat Blvd; Sampley Way; la Grange; Sowden Rd; Rena Ave; Premier St; Highrock Rd; Broom Ave; Bitternut Dr; Chinaberry Dr; Poppy St; Trentway St; Six Flags Rd (Six Flags Dr); Shurmard Dr; Singer; Sequoia Dr; Thornwall St; Sprite St; Celina Ln; Willow Oak Dr; Windfern Rd (Windfern Ln); Thunderbird Rd; Hoover St (Hoover Ave); Rena St; Cherry Tree St; Castlebay Dr; Pinewick Ln; Pinehill Ln; Knotty Wood Dr; Black Oak Dr; Pine Bark Dr; Anaqua Dr; N Linpar Ct; Hawley Ln; Burr Oak Dr; S Linpar Ct; Pecan; Castlebay; Healey; Stanley Ct; Lively Ln; Singer St; Denny St (Denny); Concord Park Dr; Enelo Dr; E Linpar Ct; Gessner Rd; Pine Cove Dr; Tidwell Rd; Overland; Hempstead St; W Linpar Ct; Burlington North Dr; Pinemont Pr Six Dr.
Railroad features: Southern Pacific RR.
Other features: Cole Crk.
Fairbanks neighborhood detailed profile
Fifth Ward neighborhood in Houston statistics: (Find on map)
Area: 5.102 square miles
Population: 16,404
Population density:
Median household income in 2021:
Median rent in in 2021:
Male vs Females
Median age
Average estimated value of detached houses in 2021 (68.0% of all units):
Most popular occupations of males: construction, extraction, and maintenance occupations (30.2%); service occupations (12.6%); sales and office occupations (10.3%); production occupations (9.2%); management occupations (except farmers) (7.6%); material moving occupations (6.1%); transportation occupations (5.9%)
Most popular occupations of females: sales and office occupations (30.8%); service occupations (27.8%); business and financial operations occupations (8.7%); healthcare practitioners and technical occupations (8.2%); material moving occupations (6.9%); education, training, and library occupations (4.5%); management occupations (except farmers) (3.0%)
Limited-access highways (interstate or state) in this neighborhood: I- 10 (East Fwy, US Hwy 90).
Highways in this neighborhood: Eastex Fwy (US Hwy 59).
Roads and streets: Lockwood Dr; Lyons Ave; Liberty Rd; Jensen Dr; Lee St; Clinton Dr; Campbell St; Gregg St; Market St; Noble St; Bringhurst St; New Orleans St; Sumpter St; Quitman St; Sakowitz St; Providence St; Waco St (Altoona St); Schweikhardt St; Lucille St; Farmer St; Oats St; Des Chaumes St; Lelia St; Jewel St; Buck St; Wylie St; Brewster St; Nichols St; Brackenridge St; Rawley St; Stevens St; Cline St; Hershe St; Solo St; Evella St; Engleford St; Wipprecht St; Gillespie St; US Hwy 59 (Eastex Freeway Svc Rd); West St; Stonewall St; Collingsworth St; Pannell St; Staples St; Russell St; Semmes St; Sudan St; Melva St; Hare St; Orange St; Maffitt St; Erastus St; Salina St; Grove St; Davis St; Sam Wilson St; Sydnor St; Chew St; Octavia St (Collingsworth St); Bayou St; Coke St; Schwartz St; Carr St; Benson St; Amboy St; Wayne St; Yates St; Lorraine St; Harlem St; Zindler St; Baron; Kirk St; Capron St; Dan St; Calles St; Opelousas St; Worms St; Baer St; Vernon St; Hailey St; Mc Call; Cage St; Mills St; Cactus St; Press St; Chase St; Mary St; Kashmere St; Fontinot St; Harrington St; Sharon St; Newhoff St; Brill St; Green St; Courtney St; Emile St; Tyre St; Arkansas St; Richardson St; Granger St; Arapahoe St; Eddie St; Sonora St; Lila St; Gunter St; Retta St; Martha St; Abernathy St; Margarita St; E Lockwood Dr; Japhet St; San Juan St; Clementine St; Bleker St; Brooks St; Adelia St; Florida St; Meadow St; Rupert St; Mulvey St; Ralston St; Altoona St (Broyles St); Hirsch St; Burnett St; Jones St; Kentucky St; Clark; Harriman St; Dabney St; Conti St; Saint Elmo St; Ranch St; Cushing St; Edmund St; Suez St; Perkins; Hirsch St (Hirsch Rd); Josephine St; Hutton St; Lucas St; Schweikhart St; Delia St; San Jose St; Hill; Roland St; Grayson; Billy St; Elysian St; Nance St; Gagne St; Tiffin St; Tremper St; Leffingwell St; Englewood St; Leona St; Love St; Colfax St; Glenarm St; Taylor Ct; Dick St; Maury St; Mystic St; Easy St; Chisum St; Lyons Aly; Stamp St; Linn St; Gregory St; Tunis; Majestic St; Broyles St; Curtis St; Wallisville Rd; Bond St; Granton St; Downing St; Morris St; Finnigan Dr; Ida St; Simpson St; Love Plz; Tralle St; Sarah St; Copeland St; Featherstone St; Moses St; Otis St; Lochwood Dr; Williamson St; Shiloh St; Morgood St; Pine Crest Blvd (Pine Crest St); Sondick Ct; Inman St; Dunn St; Grove Ct; Milbrad St; Ursa St; Finnigan Park; Lavender St; Kabee St; Los Angeles St; Morwood St; Hillsboro St; Nimrod St; Grumbach St; Benson Ct; Odin St; Quitman Ct; Winter St; New Orleans; Ellis Ct; Bryan St; Roanoke; Orange; Kirk Aly; 3rd St; Bergin St; Finnigan Park Place Ct; Egan St; Upton St; Grovey St; Barron; Stevens; Foote St; Sumpter Ct; Hogg St; Massie St; Mills; Zarzana Aly; Mills Ct; Harrington; Pickfair St; Swiney St; Brewster; Wyrick St; Kimball St; Booker St; Arcadia; Sayers St; Guarino Pl; Burnett; Grigsby St; Boone Rd; Noble; Sumpter Aly; Staples; Hollywood Ct; Downing; Pollard St; Sams Pl; Sumark Ct; Clark Ct; McLeary St; Isadore Ct; Acres; Lyons; Dittmans Ct; Solo; Granger; Gould Pl; Nelkins Ct; Providence; Tammy Ct; Rawley; Sharon; Opelousas Ct; Salina; Campbell; San Jose.
Railroad features: Southern Pacific RR; Houston Belt and Terminal Rlwy.
Other features: Ingraham Gully; Buffalo Byu.
Fifth Ward neighborhood detailed profile
Area: 5.102 square miles
Population: 16,404
Population density:
| Fifth Ward: | 3,215 people per square mile |
| Houston: | 3,947 people per square mile |
Median household income in 2021:
| Fifth Ward: | $35,496 |
| Houston: | $55,499 |
Median rent in in 2021:
| Fifth Ward: | $680 |
| Houston: | $974 |
Male vs Females
| Males: | 7,824 |
| Females: | 8,579 |
Median age
| Males: | 37.0 years |
| Females: | 34.1 years |
Average estimated value of detached houses in 2021 (68.0% of all units):
| Fifth Ward: | $145,450 |
| Houston: | $304,685 |
Most popular occupations of males: construction, extraction, and maintenance occupations (30.2%); service occupations (12.6%); sales and office occupations (10.3%); production occupations (9.2%); management occupations (except farmers) (7.6%); material moving occupations (6.1%); transportation occupations (5.9%)
Most popular occupations of females: sales and office occupations (30.8%); service occupations (27.8%); business and financial operations occupations (8.7%); healthcare practitioners and technical occupations (8.2%); material moving occupations (6.9%); education, training, and library occupations (4.5%); management occupations (except farmers) (3.0%)
Limited-access highways (interstate or state) in this neighborhood: I- 10 (East Fwy, US Hwy 90).
Highways in this neighborhood: Eastex Fwy (US Hwy 59).
Roads and streets: Lockwood Dr; Lyons Ave; Liberty Rd; Jensen Dr; Lee St; Clinton Dr; Campbell St; Gregg St; Market St; Noble St; Bringhurst St; New Orleans St; Sumpter St; Quitman St; Sakowitz St; Providence St; Waco St (Altoona St); Schweikhardt St; Lucille St; Farmer St; Oats St; Des Chaumes St; Lelia St; Jewel St; Buck St; Wylie St; Brewster St; Nichols St; Brackenridge St; Rawley St; Stevens St; Cline St; Hershe St; Solo St; Evella St; Engleford St; Wipprecht St; Gillespie St; US Hwy 59 (Eastex Freeway Svc Rd); West St; Stonewall St; Collingsworth St; Pannell St; Staples St; Russell St; Semmes St; Sudan St; Melva St; Hare St; Orange St; Maffitt St; Erastus St; Salina St; Grove St; Davis St; Sam Wilson St; Sydnor St; Chew St; Octavia St (Collingsworth St); Bayou St; Coke St; Schwartz St; Carr St; Benson St; Amboy St; Wayne St; Yates St; Lorraine St; Harlem St; Zindler St; Baron; Kirk St; Capron St; Dan St; Calles St; Opelousas St; Worms St; Baer St; Vernon St; Hailey St; Mc Call; Cage St; Mills St; Cactus St; Press St; Chase St; Mary St; Kashmere St; Fontinot St; Harrington St; Sharon St; Newhoff St; Brill St; Green St; Courtney St; Emile St; Tyre St; Arkansas St; Richardson St; Granger St; Arapahoe St; Eddie St; Sonora St; Lila St; Gunter St; Retta St; Martha St; Abernathy St; Margarita St; E Lockwood Dr; Japhet St; San Juan St; Clementine St; Bleker St; Brooks St; Adelia St; Florida St; Meadow St; Rupert St; Mulvey St; Ralston St; Altoona St (Broyles St); Hirsch St; Burnett St; Jones St; Kentucky St; Clark; Harriman St; Dabney St; Conti St; Saint Elmo St; Ranch St; Cushing St; Edmund St; Suez St; Perkins; Hirsch St (Hirsch Rd); Josephine St; Hutton St; Lucas St; Schweikhart St; Delia St; San Jose St; Hill; Roland St; Grayson; Billy St; Elysian St; Nance St; Gagne St; Tiffin St; Tremper St; Leffingwell St; Englewood St; Leona St; Love St; Colfax St; Glenarm St; Taylor Ct; Dick St; Maury St; Mystic St; Easy St; Chisum St; Lyons Aly; Stamp St; Linn St; Gregory St; Tunis; Majestic St; Broyles St; Curtis St; Wallisville Rd; Bond St; Granton St; Downing St; Morris St; Finnigan Dr; Ida St; Simpson St; Love Plz; Tralle St; Sarah St; Copeland St; Featherstone St; Moses St; Otis St; Lochwood Dr; Williamson St; Shiloh St; Morgood St; Pine Crest Blvd (Pine Crest St); Sondick Ct; Inman St; Dunn St; Grove Ct; Milbrad St; Ursa St; Finnigan Park; Lavender St; Kabee St; Los Angeles St; Morwood St; Hillsboro St; Nimrod St; Grumbach St; Benson Ct; Odin St; Quitman Ct; Winter St; New Orleans; Ellis Ct; Bryan St; Roanoke; Orange; Kirk Aly; 3rd St; Bergin St; Finnigan Park Place Ct; Egan St; Upton St; Grovey St; Barron; Stevens; Foote St; Sumpter Ct; Hogg St; Massie St; Mills; Zarzana Aly; Mills Ct; Harrington; Pickfair St; Swiney St; Brewster; Wyrick St; Kimball St; Booker St; Arcadia; Sayers St; Guarino Pl; Burnett; Grigsby St; Boone Rd; Noble; Sumpter Aly; Staples; Hollywood Ct; Downing; Pollard St; Sams Pl; Sumark Ct; Clark Ct; McLeary St; Isadore Ct; Acres; Lyons; Dittmans Ct; Solo; Granger; Gould Pl; Nelkins Ct; Providence; Tammy Ct; Rawley; Sharon; Opelousas Ct; Salina; Campbell; San Jose.
Railroad features: Southern Pacific RR; Houston Belt and Terminal Rlwy.
Other features: Ingraham Gully; Buffalo Byu.
Fifth Ward neighborhood detailed profile
Fondren Gardens neighborhood in Houston statistics: (Find on map)
Area: 1.377 square miles
Population: 8,533
Population density:
Median household income in 2021:
Median rent in in 2021:
Male vs Females
Median age
Housing prices:
Average estimated value of detached houses in 2021 (85.0% of all units):
Average estimated value of townhouses or other attached units in 2021 (10.0% of all units):
Most popular occupations of males: management occupations (except farmers) (28.8%); construction, extraction, and maintenance occupations (22.3%); arts, design, entertainment, sports, and media occupations (12.7%); transportation occupations (8.9%); sales and office occupations (8.5%); service occupations (6.8%); production occupations (5.9%)
Most popular occupations of females: service occupations (49.2%); sales and office occupations (35.8%); production occupations (8.1%); education, training, and library occupations (4.7%)
Highways in this neighborhood: Sam Houston Pkwy (Beltway 8, State Loop 8); US Hwy 90 Alt (Main St).
Roads and streets: Sam Houston Pkwy (State Loop 8); Hillcroft Ave; Zavalla Rd; Fondren Rd; Carlsbad St; W Orem; Blue Ridge Dr; W Orem Dr; Settemont Rd; W Orem Rd; Terrance St; Arp St; Dunlap St; Ormandy St (Ormandy Dr); Hodges St; Dublin; Blue Ridge Rd; Daisyetta St; Benita St; Nat St; Caridas Rd; Tasia Dr; Cheryl; Baiamonte St; Nicholas St; Markville Ln; Carlsbad Ct; Joan St; Irene; Orem Dr; Missouri City Pr Two Dr; Missouri City Pr Three Dr; Reedcrest St; Missour City Pr One Dr; State Loop 8.
Fondren Gardens neighborhood detailed profile
Area: 1.377 square miles
Population: 8,533
Population density:
| Fondren Gardens: | 6,196 people per square mile |
| Houston: | 3,947 people per square mile |
Median household income in 2021:
| Fondren Gardens: | $58,093 |
| Houston: | $55,499 |
Median rent in in 2021:
| Fondren Gardens: | $1,216 |
| Houston: | $974 |
Male vs Females
| Males: | 3,833 |
| Females: | 4,699 |
Median age
| Males: | 26.6 years |
| Females: | 34.1 years |
Housing prices:
Average estimated value of detached houses in 2021 (85.0% of all units):
| Fondren Gardens: | $295,365 |
| Houston: | $304,685 |
Average estimated value of townhouses or other attached units in 2021 (10.0% of all units):
| This neighborhood: | $37,447 |
| city: | $305,463 |
Most popular occupations of males: management occupations (except farmers) (28.8%); construction, extraction, and maintenance occupations (22.3%); arts, design, entertainment, sports, and media occupations (12.7%); transportation occupations (8.9%); sales and office occupations (8.5%); service occupations (6.8%); production occupations (5.9%)
Most popular occupations of females: service occupations (49.2%); sales and office occupations (35.8%); production occupations (8.1%); education, training, and library occupations (4.7%)
Highways in this neighborhood: Sam Houston Pkwy (Beltway 8, State Loop 8); US Hwy 90 Alt (Main St).
Roads and streets: Sam Houston Pkwy (State Loop 8); Hillcroft Ave; Zavalla Rd; Fondren Rd; Carlsbad St; W Orem; Blue Ridge Dr; W Orem Dr; Settemont Rd; W Orem Rd; Terrance St; Arp St; Dunlap St; Ormandy St (Ormandy Dr); Hodges St; Dublin; Blue Ridge Rd; Daisyetta St; Benita St; Nat St; Caridas Rd; Tasia Dr; Cheryl; Baiamonte St; Nicholas St; Markville Ln; Carlsbad Ct; Joan St; Irene; Orem Dr; Missouri City Pr Two Dr; Missouri City Pr Three Dr; Reedcrest St; Missour City Pr One Dr; State Loop 8.
Fondren Gardens neighborhood detailed profile
Fondren Park neighborhood in Houston statistics: (Find on map)
Area: 0.324 square miles
Population: 1,914
Population density:
Median household income in 2021:
Median rent in in 2021:
Male vs Females
Median age
Most popular occupations of males: management occupations (except farmers) (17.0%); transportation occupations (15.7%); sales and office occupations (13.8%); construction, extraction, and maintenance occupations (12.2%); service occupations (11.8%); education, training, and library occupations (6.4%); arts, design, entertainment, sports, and media occupations (6.3%)
Most popular occupations of females: service occupations (40.4%); sales and office occupations (33.8%); education, training, and library occupations (12.1%); production occupations (5.4%); computer and mathematical occupations (1.7%); arts, design, entertainment, sports, and media occupations (1.6%); management occupations (except farmers) (1.5%)
Roads and streets: Gregory Blvd; Mc Lain Blvd; E Hampton Cir; Oceanview St; Perry Ave; N Evelyn Cir; S Evelyn Cir; E Hutchinson Cir; W Antone Cir; N Michael Cir; E Barbara Cir; W Willowind Cir; N Nottingham Cir; W Westwood Cir; S Marianne Cir; E Fondren Cir; W Fondren Cir; N Little John Cir; W Ritter Cir; S Little John Cir; E Westwood Cir; W Barbara Cir; N Kathy Ave; N Marcia Cir; N Willowdale Cir; E Willowind Cir; S Willowdale Cir; N Ridgewood Cir; N Willow Cir; W Hampton Cir; Kathy Ave; S Marcia Cir; E Antone Cir; S Nottingham Cir; S Ridgewood Cir; S Willow Cir; W Hutchinson Cir; S Michael Cir; Parkview St; N Marianne Cir; Flagler St; E Ritter Cir; Poolview St; Palmway St; Hutchinson Cir; Fondren Cir.
Fondren Park neighborhood detailed profile
Area: 0.324 square miles
Population: 1,914
Population density:
| Fondren Park: | 5,915 people per square mile |
| Houston: | 3,947 people per square mile |
Median household income in 2021:
| Fondren Park: | $76,576 |
| Houston: | $55,499 |
Median rent in in 2021:
| Fondren Park: | $1,223 |
| Houston: | $974 |
Male vs Females
| Males: | 924 |
| Females: | 989 |
Median age
| Males: | 47.6 years |
| Females: | 48.6 years |
Most popular occupations of males: management occupations (except farmers) (17.0%); transportation occupations (15.7%); sales and office occupations (13.8%); construction, extraction, and maintenance occupations (12.2%); service occupations (11.8%); education, training, and library occupations (6.4%); arts, design, entertainment, sports, and media occupations (6.3%)
Most popular occupations of females: service occupations (40.4%); sales and office occupations (33.8%); education, training, and library occupations (12.1%); production occupations (5.4%); computer and mathematical occupations (1.7%); arts, design, entertainment, sports, and media occupations (1.6%); management occupations (except farmers) (1.5%)
Roads and streets: Gregory Blvd; Mc Lain Blvd; E Hampton Cir; Oceanview St; Perry Ave; N Evelyn Cir; S Evelyn Cir; E Hutchinson Cir; W Antone Cir; N Michael Cir; E Barbara Cir; W Willowind Cir; N Nottingham Cir; W Westwood Cir; S Marianne Cir; E Fondren Cir; W Fondren Cir; N Little John Cir; W Ritter Cir; S Little John Cir; E Westwood Cir; W Barbara Cir; N Kathy Ave; N Marcia Cir; N Willowdale Cir; E Willowind Cir; S Willowdale Cir; N Ridgewood Cir; N Willow Cir; W Hampton Cir; Kathy Ave; S Marcia Cir; E Antone Cir; S Nottingham Cir; S Ridgewood Cir; S Willow Cir; W Hutchinson Cir; S Michael Cir; Parkview St; N Marianne Cir; Flagler St; E Ritter Cir; Poolview St; Palmway St; Hutchinson Cir; Fondren Cir.
Fondren Park neighborhood detailed profile
Fondren Southwest neighborhood in Houston statistics: (Find on map)
Area: 7.693 square miles
Population: 27,042
Population density:
Median household income in 2021:
Median rent in in 2021:
Male vs Females
Median age
Average estimated value of detached houses in 2021 (69.4% of all units):
Most popular occupations of males: transportation occupations (16.7%); service occupations (10.2%); management occupations (except farmers) (9.3%); construction, extraction, and maintenance occupations (9.2%); healthcare practitioners and technical occupations (8.8%); production occupations (8.8%); sales and office occupations (8.4%)
Most popular occupations of females: service occupations (31.5%); sales and office occupations (23.9%); education, training, and library occupations (12.3%); management occupations (except farmers) (7.7%); healthcare practitioners and technical occupations (5.2%); transportation occupations (5.2%); arts, design, entertainment, sports, and media occupations (3.4%)
Highways in this neighborhood: Beltway 8 (Sam Houston Pkwy, State Loop 8); US Hwy 59 (Southwest Fwy); US Hwy 90 Alt (Main St); US Hwy 59 (Hov US 59).
Roads and streets: W Bellfort St; W Airport Blvd; Fondren Rd; S Gessner Dr; Sandpiper Dr; S Braeswood Blvd; Braesridge Dr; Bob White Dr; Creekbend Dr; Westbrae Pkwy; Portal Dr; Twin Hills Dr; Bankside Dr; Ludington Dr; Benning Dr; Willow Meadow Dr; Dawnridge Dr; Valley Hills Dr; Vickijohn Dr; Braes Forest Dr; Burning Hills Dr; Kitty Brook Dr; Braesview Ln; Chessington Dr; Ruffino Rd; Braes Meadow Dr; Teal Run Dr; Riceville School Rd; Fawn Terrace Dr; Quail Meadow Dr; Candle Green Ln; Coachwood Dr; Braesdale Ln; Fondren Meadow Dr; Sanford Rd; Gustine Ln; Southmeadow Dr; Bedford; Plainfield St; Villa Lea Ln; Claridge Dr; Deer Meadow Dr; Silkwood Dr; Ormandy St; Ravensworth Dr; Willowbend Blvd; Petersham Dr; Dover St; Larkwood Dr; Millbanks Dr; Roark Rd; Northern St; Dorrance Rd; Chadwell Dr; Wrenthorpe Dr; Westplace Dr; Pembridge Dr; Consuela Dr; Tooley Dr; Fairmont St; Walteria St (Fondmeadow Dr); Apache Plume Dr; Hopewell Ln; Minetta St; Mc Afee Dr; Rentur Dr; Ranier Dr; Gatlinburg Dr; Covent Garden St; Spellman Rd; Fairmeadow Dr; McGee Ln; Wembley Dr; Wickenburg Dr; Sapling Way; Haverstock Dr; Weymouth Dr; Meaux Dr; Lancelot Dr; Furlong Ln; Williamcrest Ln (Williams Ln); Candle Ln; del Rey Ln; Bellfort Chase Dr; Secretariat Ln; Sterlingame Dr; Sandy Glen Ln; Vinkins Rd; Ripple Glen Dr; Dumfries Dr; Moondance Ln; Dryad Dr; Canemont St; Cambridge Glen Ln (Cambridge Glen Dr); Stanwood Dr; Braescreek Dr; Albin Ln; Duffield Ln; Fondren Village Dr; Oakington Dr; Pepperdine Ln; S Breeze St; N Kensington Dr; Manorgate Dr; Rollingbrook Dr; Dellfern Dr; S Circle Dr; Bellfort Village Dr; Braes Bayou Dr; S Kensington Dr; Thurleigh St; Offer Dr; Kristin Dr; Gainsborough Dr; Tavistock Dr; Gallo Dr; Meadow Place Dr; Murphy Rd (Wilcrest Dr, FM 1092); S Hanworth Dr; Ivyknoll Dr; Paulwood Dr; Wolfield Ln; Abbeydale Dr; Misty Ridge Ln; Shawnbrook Dr; Aspen Place Dr; Westwind Ln; Fondren Place Dr; Cobblefield Ln; N Hanworth Dr; Keegans Ridge Rd; Brookvalley Dr; Summit Pl; Hummingbird St (Hummingbird Dr); Woodknoll Ln; Braes Park Dr; Frontenac Dr; Oglethorpe Dr; Willow Trl; Shaftsbury Dr; N Garden St; E Circle Dr; Ashley Circle Dr W; Arrowhead Glen Dr; Triple Crown Dr; N Circle Dr; Ashley Circle Dr E; Sunset Meadow Dr (Sunset Meadow Ln); Southwood Ct S; Split Rail Ln; Murray Brook Dr; Windy Dunes Dr; Westbrae Village Dr; S Garden St; Emerald Ln (Emerald Dr); Bellfort Pr One Dr; Thicket Green Ln; Brook Valley Dr; Braeburn Bend Dr; Villa Lea Dr; E Rylander Cir; Carrswold Dr; Bellfort Pr Five Dr; Weybridge Dr; Renaissance Ln; Shelwick Dr; Coppertree Ln (Copper Tree Pvt Ln); Pecan Meadow Dr; Sage Place Dr; Aspen Meadow Dr; Dandelion Ln; S Petersham Dr; Longstaff Dr; Peacock Hills Dr; Bellbrook Dr; Old Chatham Ln; Seaswept Dr; Braes Bend Dr; Merewood Ln; N Petersham Dr; Candle Green Ln (Candle Green Ct); Westbrae Park Ln; Raydell Dr; Caravan Dr; Riva Ridge Ln; Braesglen Dr; Fondren Bend Dr; Windy Wisp Ln; Kiber Dr; Lemon Ridge Ln; S Rachlin Cir; Gladewood Ln; Sungate Ln; N Rachlin Cir; Pecan Place Dr; Keegans Forest Ln; Birch Meadow Dr; Villa Lee Ln; Southwood Ct N; Keegans Glen Dr; Sandy Shoals Dr; Alex Ln; Ashley Circle Dr N; Lelda Ln; Pine Meadow Dr; Shadow Tree Pvt Dr; Westbrae Meadows Dr; Beversbrook Dr; Chatham Island Ln; Copperfield Dr; N Rylander Cir; Cattails Ln Pvt; Stallion Ln; Elkington Ct; Berry Meadow Dr; Sunrise Place Dr; Allen Ln; Twin Tree Ln; N Deer Meadow Dr; Sunset Place Dr; Chesterbrook Dr; Charing Cross Dr; Silo Ln; Poulson Dr; Harrowgate Dr; Westwind Ct (Westwind Ln); Preakness Way; Braes Park; Devoncroft Dr; Fondren Lake Dr; Welland Dr; Old Brook Dr; Chartwell Dr; Rockampton Dr; Ashley Circle Dr S; Schooley Dr; Verde Glen Ln; FM 1092 N; Vanderheath Dr; Willow Meadow Dr (Hoyte Dr); S Rylander Cir; Meadow Crest St; Southwold Ln; Huff Dr; Bellfort Pr Four Dr; Folklore Way; W Barbara Cir; Westbrae Gardens Ct; Rathbone Dr; Fieldsboro Dr; Settle Dr; Wainfleet Ln; Janabrook Dr; St John Ct; Berry Place Dr; Meadow Place Ct; Lake Edge Ct; Truesdel Dr; Lightcliffe Dr; Garden; Halliford Dr; April Arbor Ct; Braes Xing; Victorian Village Dr; Flax Dr; Chesham Ct; Gustine Ct; Lakeway Ct; Atlaw Dr; Tottenham Dr; Gessport Blvd; Erin Dr; Maranatha Ct; W Hutchinson Cir; Harbor Point Dr; Village of Fondren Dr; Mc Lain Blvd; Caren Ct; Dellfern Ct; Windsor Village Dr; E Rachlin Cir; Appleby Dr; Bedford Dr; Trebeau Ct; Vickijohn Ct; Mc Afee Ct; Twin Hills Ct; Vickijohn Cir; Westbrae Park Ct; Vicdale Dr; Barrister Ct; Braesridge Ct; Sea Biscuit Ln; Lake Ridge Ct; Amberwick Dr; Millbanks Ct; Sam Houston Pkwy (State Loop 8); Gainsborough Ct; Erin Ct.
Railroad features: Southern Pacific RR.
Other features: Keegans Byu.
Other features: Willow Waterhole Byu; Waterhole Byu.
Other features: Brays Byu.
Fondren Southwest neighborhood detailed profile
Area: 7.693 square miles
Population: 27,042
Population density:
| Fondren Southwest: | 3,515 people per square mile |
| Houston: | 3,947 people per square mile |
Median household income in 2021:
| Fondren Southwest: | $66,675 |
| Houston: | $55,499 |
Median rent in in 2021:
| Fondren Southwest: | $866 |
| Houston: | $974 |
Male vs Females
| Males: | 13,594 |
| Females: | 13,447 |
Median age
| Males: | 33.6 years |
| Females: | 36.9 years |
Average estimated value of detached houses in 2021 (69.4% of all units):
| Fondren Southwest: | $133,353 |
| Houston: | $304,685 |
Most popular occupations of males: transportation occupations (16.7%); service occupations (10.2%); management occupations (except farmers) (9.3%); construction, extraction, and maintenance occupations (9.2%); healthcare practitioners and technical occupations (8.8%); production occupations (8.8%); sales and office occupations (8.4%)
Most popular occupations of females: service occupations (31.5%); sales and office occupations (23.9%); education, training, and library occupations (12.3%); management occupations (except farmers) (7.7%); healthcare practitioners and technical occupations (5.2%); transportation occupations (5.2%); arts, design, entertainment, sports, and media occupations (3.4%)
Highways in this neighborhood: Beltway 8 (Sam Houston Pkwy, State Loop 8); US Hwy 59 (Southwest Fwy); US Hwy 90 Alt (Main St); US Hwy 59 (Hov US 59).
Roads and streets: W Bellfort St; W Airport Blvd; Fondren Rd; S Gessner Dr; Sandpiper Dr; S Braeswood Blvd; Braesridge Dr; Bob White Dr; Creekbend Dr; Westbrae Pkwy; Portal Dr; Twin Hills Dr; Bankside Dr; Ludington Dr; Benning Dr; Willow Meadow Dr; Dawnridge Dr; Valley Hills Dr; Vickijohn Dr; Braes Forest Dr; Burning Hills Dr; Kitty Brook Dr; Braesview Ln; Chessington Dr; Ruffino Rd; Braes Meadow Dr; Teal Run Dr; Riceville School Rd; Fawn Terrace Dr; Quail Meadow Dr; Candle Green Ln; Coachwood Dr; Braesdale Ln; Fondren Meadow Dr; Sanford Rd; Gustine Ln; Southmeadow Dr; Bedford; Plainfield St; Villa Lea Ln; Claridge Dr; Deer Meadow Dr; Silkwood Dr; Ormandy St; Ravensworth Dr; Willowbend Blvd; Petersham Dr; Dover St; Larkwood Dr; Millbanks Dr; Roark Rd; Northern St; Dorrance Rd; Chadwell Dr; Wrenthorpe Dr; Westplace Dr; Pembridge Dr; Consuela Dr; Tooley Dr; Fairmont St; Walteria St (Fondmeadow Dr); Apache Plume Dr; Hopewell Ln; Minetta St; Mc Afee Dr; Rentur Dr; Ranier Dr; Gatlinburg Dr; Covent Garden St; Spellman Rd; Fairmeadow Dr; McGee Ln; Wembley Dr; Wickenburg Dr; Sapling Way; Haverstock Dr; Weymouth Dr; Meaux Dr; Lancelot Dr; Furlong Ln; Williamcrest Ln (Williams Ln); Candle Ln; del Rey Ln; Bellfort Chase Dr; Secretariat Ln; Sterlingame Dr; Sandy Glen Ln; Vinkins Rd; Ripple Glen Dr; Dumfries Dr; Moondance Ln; Dryad Dr; Canemont St; Cambridge Glen Ln (Cambridge Glen Dr); Stanwood Dr; Braescreek Dr; Albin Ln; Duffield Ln; Fondren Village Dr; Oakington Dr; Pepperdine Ln; S Breeze St; N Kensington Dr; Manorgate Dr; Rollingbrook Dr; Dellfern Dr; S Circle Dr; Bellfort Village Dr; Braes Bayou Dr; S Kensington Dr; Thurleigh St; Offer Dr; Kristin Dr; Gainsborough Dr; Tavistock Dr; Gallo Dr; Meadow Place Dr; Murphy Rd (Wilcrest Dr, FM 1092); S Hanworth Dr; Ivyknoll Dr; Paulwood Dr; Wolfield Ln; Abbeydale Dr; Misty Ridge Ln; Shawnbrook Dr; Aspen Place Dr; Westwind Ln; Fondren Place Dr; Cobblefield Ln; N Hanworth Dr; Keegans Ridge Rd; Brookvalley Dr; Summit Pl; Hummingbird St (Hummingbird Dr); Woodknoll Ln; Braes Park Dr; Frontenac Dr; Oglethorpe Dr; Willow Trl; Shaftsbury Dr; N Garden St; E Circle Dr; Ashley Circle Dr W; Arrowhead Glen Dr; Triple Crown Dr; N Circle Dr; Ashley Circle Dr E; Sunset Meadow Dr (Sunset Meadow Ln); Southwood Ct S; Split Rail Ln; Murray Brook Dr; Windy Dunes Dr; Westbrae Village Dr; S Garden St; Emerald Ln (Emerald Dr); Bellfort Pr One Dr; Thicket Green Ln; Brook Valley Dr; Braeburn Bend Dr; Villa Lea Dr; E Rylander Cir; Carrswold Dr; Bellfort Pr Five Dr; Weybridge Dr; Renaissance Ln; Shelwick Dr; Coppertree Ln (Copper Tree Pvt Ln); Pecan Meadow Dr; Sage Place Dr; Aspen Meadow Dr; Dandelion Ln; S Petersham Dr; Longstaff Dr; Peacock Hills Dr; Bellbrook Dr; Old Chatham Ln; Seaswept Dr; Braes Bend Dr; Merewood Ln; N Petersham Dr; Candle Green Ln (Candle Green Ct); Westbrae Park Ln; Raydell Dr; Caravan Dr; Riva Ridge Ln; Braesglen Dr; Fondren Bend Dr; Windy Wisp Ln; Kiber Dr; Lemon Ridge Ln; S Rachlin Cir; Gladewood Ln; Sungate Ln; N Rachlin Cir; Pecan Place Dr; Keegans Forest Ln; Birch Meadow Dr; Villa Lee Ln; Southwood Ct N; Keegans Glen Dr; Sandy Shoals Dr; Alex Ln; Ashley Circle Dr N; Lelda Ln; Pine Meadow Dr; Shadow Tree Pvt Dr; Westbrae Meadows Dr; Beversbrook Dr; Chatham Island Ln; Copperfield Dr; N Rylander Cir; Cattails Ln Pvt; Stallion Ln; Elkington Ct; Berry Meadow Dr; Sunrise Place Dr; Allen Ln; Twin Tree Ln; N Deer Meadow Dr; Sunset Place Dr; Chesterbrook Dr; Charing Cross Dr; Silo Ln; Poulson Dr; Harrowgate Dr; Westwind Ct (Westwind Ln); Preakness Way; Braes Park; Devoncroft Dr; Fondren Lake Dr; Welland Dr; Old Brook Dr; Chartwell Dr; Rockampton Dr; Ashley Circle Dr S; Schooley Dr; Verde Glen Ln; FM 1092 N; Vanderheath Dr; Willow Meadow Dr (Hoyte Dr); S Rylander Cir; Meadow Crest St; Southwold Ln; Huff Dr; Bellfort Pr Four Dr; Folklore Way; W Barbara Cir; Westbrae Gardens Ct; Rathbone Dr; Fieldsboro Dr; Settle Dr; Wainfleet Ln; Janabrook Dr; St John Ct; Berry Place Dr; Meadow Place Ct; Lake Edge Ct; Truesdel Dr; Lightcliffe Dr; Garden; Halliford Dr; April Arbor Ct; Braes Xing; Victorian Village Dr; Flax Dr; Chesham Ct; Gustine Ct; Lakeway Ct; Atlaw Dr; Tottenham Dr; Gessport Blvd; Erin Dr; Maranatha Ct; W Hutchinson Cir; Harbor Point Dr; Village of Fondren Dr; Mc Lain Blvd; Caren Ct; Dellfern Ct; Windsor Village Dr; E Rachlin Cir; Appleby Dr; Bedford Dr; Trebeau Ct; Vickijohn Ct; Mc Afee Ct; Twin Hills Ct; Vickijohn Cir; Westbrae Park Ct; Vicdale Dr; Barrister Ct; Braesridge Ct; Sea Biscuit Ln; Lake Ridge Ct; Amberwick Dr; Millbanks Ct; Sam Houston Pkwy (State Loop 8); Gainsborough Ct; Erin Ct.
Railroad features: Southern Pacific RR.
Other features: Keegans Byu.
Other features: Willow Waterhole Byu; Waterhole Byu.
Other features: Brays Byu.
Fondren Southwest neighborhood detailed profile
Fonmeadow neighborhood in Houston statistics: (Find on map)
Area: 0.164 square miles
Population: 149
Population density:
Median household income in 2021:
Median rent in in 2021:
Male vs Females
Median age
Most popular occupations of males: transportation occupations (29.3%); sales and office occupations (20.0%); service occupations (17.9%); material moving occupations (6.5%); education, training, and library occupations (5.7%); healthcare practitioners and technical occupations (4.4%); production occupations (4.0%)
Most popular occupations of females: education, training, and library occupations (29.6%); sales and office occupations (26.7%); service occupations (26.4%); computer and mathematical occupations (5.3%); arts, design, entertainment, sports, and media occupations (5.0%); material moving occupations (3.9%); healthcare practitioners and technical occupations (3.1%)
Roads and streets: Laleu Ln; Kittybrook Ln; Poiters Dr; Riva Ridge Ln; Fonmeadow Dr; Royan Dr; Virty Ln (Vitry Ln); Miriam Ln; Raia Ln; Arbor Ridge St; Chinon Cir; Micheline Cir; Saintes Cir; Redgate Cir; la Rochelle Cir; Patio Glen Dr; Arbor Ridge Dr; Turk Ln; Chancel Dr; Arbor Glen Rd; Arbor Meadow St (Arbor Meadow Dr); Meadowglen Dr; Gironde Dr.
Fonmeadow neighborhood detailed profile
Area: 0.164 square miles
Population: 149
Population density:
| Fonmeadow: | 911 people per square mile |
| Houston: | 3,947 people per square mile |
Median household income in 2021:
| Fonmeadow: | $12,218 |
| Houston: | $55,499 |
Median rent in in 2021:
| Fonmeadow: | $215 |
| Houston: | $974 |
Male vs Females
| Males: | 77 |
| Females: | 71 |
Median age
| Males: | 7.1 years |
| Females: | 7.4 years |
Most popular occupations of males: transportation occupations (29.3%); sales and office occupations (20.0%); service occupations (17.9%); material moving occupations (6.5%); education, training, and library occupations (5.7%); healthcare practitioners and technical occupations (4.4%); production occupations (4.0%)
Most popular occupations of females: education, training, and library occupations (29.6%); sales and office occupations (26.7%); service occupations (26.4%); computer and mathematical occupations (5.3%); arts, design, entertainment, sports, and media occupations (5.0%); material moving occupations (3.9%); healthcare practitioners and technical occupations (3.1%)
Roads and streets: Laleu Ln; Kittybrook Ln; Poiters Dr; Riva Ridge Ln; Fonmeadow Dr; Royan Dr; Virty Ln (Vitry Ln); Miriam Ln; Raia Ln; Arbor Ridge St; Chinon Cir; Micheline Cir; Saintes Cir; Redgate Cir; la Rochelle Cir; Patio Glen Dr; Arbor Ridge Dr; Turk Ln; Chancel Dr; Arbor Glen Rd; Arbor Meadow St (Arbor Meadow Dr); Meadowglen Dr; Gironde Dr.
Fonmeadow neighborhood detailed profile
Forth Ward neighborhood in Houston statistics: (Find on map)
Area: 0.333 square miles
Limited-access highways (interstate or state) in this neighborhood: I- 45 (Gulf Fwy, US Hwy 75).
Roads and streets: Gillette St; W Dallas Ave; Allen Pkwy; Bluebonnet Place Cir; Robin St; Saulnier St; Andrews St; Ruthven St; Bailey St; Cleveland St; Crosby St; Wilson St; Valentine St; W Gray St; O Neil St; Victor St; Cushing St; Heiner St; Blue Place Cir; Matthews St; Park Vista Dr; Arthur St; Buckner St; Valentine Way; Park Trail Vis; Bayou Vista Dr; W Webster St; Webster St; Skyline Vis; Park Trail Way; Park Trail Run; Skyline Trl; Hopson St; Gulf Frwy Svc Rd; Cook St; Golf Link Pl; Heiner; Sabine St; Nash St; Lamb St; Lamb.
Forth Ward neighborhood detailed profile
Garden Oaks neighborhood in Houston statistics: (Find on map)
Area: 8.842 square miles
Population: 35,856
Population density:
Median household income in 2021:
Median rent in in 2021:
Male vs Females
Median age
Housing prices:
Average estimated value of detached houses in 2021 (77.0% of all units):
Average estimated value of townhouses or other attached units in 2021 (5.5% of all units):
Average estimated '21 value of housing units in 5-or-more-unit structures (15.0% of all units):
Average estimated value of mobile home in 2021 (4.4% of all units):
Most popular occupations of males: management occupations (except farmers) (17.2%); sales and office occupations (13.8%); service occupations (9.4%); architecture and engineering occupations (9.2%); business and financial operations occupations (8.6%); transportation occupations (7.7%); computer and mathematical occupations (6.9%)
Most popular occupations of females: sales and office occupations (22.2%); management occupations (except farmers) (14.0%); service occupations (11.0%); business and financial operations occupations (10.9%); education, training, and library occupations (10.0%); healthcare practitioners and technical occupations (7.6%); legal occupations (6.0%)
Limited-access highways (interstate or state) in this neighborhood: I- 610 (N Loop Fwy).
Highways in this neighborhood: US Hwy 290; State Spur 261 (N Shepherd Dr).
Roads and streets: Pinemont Dr; W 43rd St; W 34th St; Lamonte Ln; Chantilly Ln; Wakefield Dr; Cheshire Ln; Viking Dr; Bethlehem St; de Milo Dr; Mangum Rd; Nina Lee Ln; Libbey Dr (Libbey Ln); W T C Jester Blvd; Gardenia Dr; Althea Dr; del Norte St; Ella Blvd; Judiway St; Oak Forest Dr; Saxon Dr; Lehman St; Sue Barnett Dr; Hewitt Dr; W 30th St; Alba Rd; Curtin St; Martin St (Martin Rd); Candlelight Ln; Thornton Rd; W 31st St; Stonecrest Dr; du Barry Ln; Woodcrest Dr; Chippendale Rd; Antoine Dr; Richelieu Ln; Acorn St; Golf Dr; Rosslyn Rd; Chamboard Ln; Golden Forest Dr; Watonga Blvd; Bolivia Blvd; Verdome Ln; Ansbury Dr; Donna Bell Ln; Brinkman St; de Lange Ln; Latexo Dr; Costa Rica Rd; Piney Woods Dr; Ebony Ln; Randon Rd; W 41st St; Hardway St; Birchmont Dr; W 42nd St; Autumn Forest Dr; Spruce Forest Dr; Poinciana Dr; Lido Ln; Fisher Dr (Fisher St); Hialeah Dr; Broom St; Wilde Rock Way; Glebe Rd; Creekmont Dr; W 32nd St; Apollo St; Hoover St; Gardendale Dr; Milwee St; Bethel Blvd; Arbor Vitae Dr; Lumberdale St; W 33rd St; Weeping Willow Rd; Lou Ellen Ln; Dunsmere Rd; Georgi Ln; E T C Jester Blvd; Sanborn Dr; Azaleadell Dr; Marlborough Dr; Yale St; Alabonson Rd; Guese Rd; Overhill Dr (Overhill St); Carleen Rd; Kinley Ln; Greenmont Dr; Lost Forest Dr; Brimberry St; Lawrence St; Bron Holly Dr; April Ln; Reno Dr; Autumn Arbor Dr; Deep Forest Dr; Brian Haven Dr; Park Plaza Dr; Kingswood St (Kingswood Ln); Oak Shadows Dr; Ashland St; Hill Oak Dr; Tulsa Rd; W 34th 1/2 St (W 34 1/2 St); Mall Dr; Broom; Christell Ln; Chrystell Ln; Rena St; Azalea St; Hardway; Northrup Dr; Candlelight Place Dr; Sara Rose St; Blanton Blvd; Brown Bark Dr; Randall St; Oakhaven Ln; Spring Forest Dr; Retton Dr; Blue Water Ln; Sherwood Ln; W 38th St; N Durham Dr; Mountwood St; Bayou Vista Dr; His Glory Ln; Belle Glade Dr; Knobby Knoll Dr; Northmont Plaza Dr; Attridge Rd; Leaf Arbor Dr; Lou Anne Ln; Berendo St; Rosepoint Dr (Rosepoint St); Pinemont Pr Six Dr; Silver Forest Dr; Pinon Dr; Donna Lynn Dr; Costa Rica St; Sleepyvale Ln; Eclipse; Santee St; Fallen Oaks Dr; Gulf Mountain Dr; Mary Lou Dr; Summer Forest Dr; Candletree Dr; Couch St; Dayport; Helberg Rd; W 35th St; Zoch Ln; Bough Ct; Clift Haven Dr; Rosslyn; Manor Creek Ln; Fatima Ln; Aspen View Ct; Balzy Rd; Covington Dr; Summit; Balbo; Treebark Ln; Rosebay Dr; Twin Candle Dr; Arnell Dr; Fallbrook Dr; Lavell Dr; Sumner Dr; Deer Lodge Dr; Lorinda Dr; Grass Valley Dr (Grass Valley St); Oak Trail Ln; Colchester St; Maxroy St; Shady Nook Ct; Hollow Bend Ct; Leafy Hollow Ct; Chantilly Cir; Thornton Cir; Moss Hollow Ct; Bevis St; Forest Nook Ct; Park Gate Ct; Happy Hollow St; Eclipse St; Larknolls Ln; Four Rivers Ct; Balbo St; Burt St; Ubuntu Ct; Jericho Ct; Founders Way Ct; Candlemist Dr; Candleleaf Dr; Donna Lynn Ct; Dominion Estates Dr; Vollmer Rd; Carlford Cir; Moonstone Cir; Topham Cir; Candleglow Dr; Candlecrest Dr; Goettee Cir; Maple Grove Ln.
Railroad features: Chicago Rock Island and Pacific RR.
Other features: White Oak Byu; Brickhouse Gully; Cole Crk.
Garden Oaks neighborhood detailed profile
Area: 8.842 square miles
Population: 35,856
Population density:
| Garden Oaks (Oak Forest): | 4,055 people per square mile |
| Houston: | 3,947 people per square mile |
Median household income in 2021:
| Garden Oaks (Oak Forest): | $100,153 |
| Houston: | $55,499 |
Median rent in in 2021:
| Garden Oaks (Oak Forest): | $1,156 |
| Houston: | $974 |
Male vs Females
| Males: | 18,530 |
| Females: | 17,326 |
Median age
| Males: | 39.3 years |
| Females: | 40.9 years |
Housing prices:
Average estimated value of detached houses in 2021 (77.0% of all units):
| Garden Oaks (Oak Forest): | $484,368 |
| Houston: | $304,685 |
Average estimated value of townhouses or other attached units in 2021 (5.5% of all units):
| This neighborhood: | $126,261 |
| city: | $305,463 |
Average estimated '21 value of housing units in 5-or-more-unit structures (15.0% of all units):
| Garden Oaks (Oak Forest): | $81,563 |
| Houston: | $227,414 |
Average estimated value of mobile home in 2021 (4.4% of all units):
| Garden Oaks (Oak Forest): | $133,517 |
| Houston: | $60,006 |
Most popular occupations of males: management occupations (except farmers) (17.2%); sales and office occupations (13.8%); service occupations (9.4%); architecture and engineering occupations (9.2%); business and financial operations occupations (8.6%); transportation occupations (7.7%); computer and mathematical occupations (6.9%)
Most popular occupations of females: sales and office occupations (22.2%); management occupations (except farmers) (14.0%); service occupations (11.0%); business and financial operations occupations (10.9%); education, training, and library occupations (10.0%); healthcare practitioners and technical occupations (7.6%); legal occupations (6.0%)
Limited-access highways (interstate or state) in this neighborhood: I- 610 (N Loop Fwy).
Highways in this neighborhood: US Hwy 290; State Spur 261 (N Shepherd Dr).
Roads and streets: Pinemont Dr; W 43rd St; W 34th St; Lamonte Ln; Chantilly Ln; Wakefield Dr; Cheshire Ln; Viking Dr; Bethlehem St; de Milo Dr; Mangum Rd; Nina Lee Ln; Libbey Dr (Libbey Ln); W T C Jester Blvd; Gardenia Dr; Althea Dr; del Norte St; Ella Blvd; Judiway St; Oak Forest Dr; Saxon Dr; Lehman St; Sue Barnett Dr; Hewitt Dr; W 30th St; Alba Rd; Curtin St; Martin St (Martin Rd); Candlelight Ln; Thornton Rd; W 31st St; Stonecrest Dr; du Barry Ln; Woodcrest Dr; Chippendale Rd; Antoine Dr; Richelieu Ln; Acorn St; Golf Dr; Rosslyn Rd; Chamboard Ln; Golden Forest Dr; Watonga Blvd; Bolivia Blvd; Verdome Ln; Ansbury Dr; Donna Bell Ln; Brinkman St; de Lange Ln; Latexo Dr; Costa Rica Rd; Piney Woods Dr; Ebony Ln; Randon Rd; W 41st St; Hardway St; Birchmont Dr; W 42nd St; Autumn Forest Dr; Spruce Forest Dr; Poinciana Dr; Lido Ln; Fisher Dr (Fisher St); Hialeah Dr; Broom St; Wilde Rock Way; Glebe Rd; Creekmont Dr; W 32nd St; Apollo St; Hoover St; Gardendale Dr; Milwee St; Bethel Blvd; Arbor Vitae Dr; Lumberdale St; W 33rd St; Weeping Willow Rd; Lou Ellen Ln; Dunsmere Rd; Georgi Ln; E T C Jester Blvd; Sanborn Dr; Azaleadell Dr; Marlborough Dr; Yale St; Alabonson Rd; Guese Rd; Overhill Dr (Overhill St); Carleen Rd; Kinley Ln; Greenmont Dr; Lost Forest Dr; Brimberry St; Lawrence St; Bron Holly Dr; April Ln; Reno Dr; Autumn Arbor Dr; Deep Forest Dr; Brian Haven Dr; Park Plaza Dr; Kingswood St (Kingswood Ln); Oak Shadows Dr; Ashland St; Hill Oak Dr; Tulsa Rd; W 34th 1/2 St (W 34 1/2 St); Mall Dr; Broom; Christell Ln; Chrystell Ln; Rena St; Azalea St; Hardway; Northrup Dr; Candlelight Place Dr; Sara Rose St; Blanton Blvd; Brown Bark Dr; Randall St; Oakhaven Ln; Spring Forest Dr; Retton Dr; Blue Water Ln; Sherwood Ln; W 38th St; N Durham Dr; Mountwood St; Bayou Vista Dr; His Glory Ln; Belle Glade Dr; Knobby Knoll Dr; Northmont Plaza Dr; Attridge Rd; Leaf Arbor Dr; Lou Anne Ln; Berendo St; Rosepoint Dr (Rosepoint St); Pinemont Pr Six Dr; Silver Forest Dr; Pinon Dr; Donna Lynn Dr; Costa Rica St; Sleepyvale Ln; Eclipse; Santee St; Fallen Oaks Dr; Gulf Mountain Dr; Mary Lou Dr; Summer Forest Dr; Candletree Dr; Couch St; Dayport; Helberg Rd; W 35th St; Zoch Ln; Bough Ct; Clift Haven Dr; Rosslyn; Manor Creek Ln; Fatima Ln; Aspen View Ct; Balzy Rd; Covington Dr; Summit; Balbo; Treebark Ln; Rosebay Dr; Twin Candle Dr; Arnell Dr; Fallbrook Dr; Lavell Dr; Sumner Dr; Deer Lodge Dr; Lorinda Dr; Grass Valley Dr (Grass Valley St); Oak Trail Ln; Colchester St; Maxroy St; Shady Nook Ct; Hollow Bend Ct; Leafy Hollow Ct; Chantilly Cir; Thornton Cir; Moss Hollow Ct; Bevis St; Forest Nook Ct; Park Gate Ct; Happy Hollow St; Eclipse St; Larknolls Ln; Four Rivers Ct; Balbo St; Burt St; Ubuntu Ct; Jericho Ct; Founders Way Ct; Candlemist Dr; Candleleaf Dr; Donna Lynn Ct; Dominion Estates Dr; Vollmer Rd; Carlford Cir; Moonstone Cir; Topham Cir; Candleglow Dr; Candlecrest Dr; Goettee Cir; Maple Grove Ln.
Railroad features: Chicago Rock Island and Pacific RR.
Other features: White Oak Byu; Brickhouse Gully; Cole Crk.
Garden Oaks neighborhood detailed profile
George Bush International Airport neighborhood in Houston statistics: (Find on map)
Area: 26.657 square miles
Population: 33,825
Population density:
Median household income in 2021:
Median rent in in 2021:
Male vs Females
Median age
Most popular occupations of males: sales and office occupations (19.7%); construction, extraction, and maintenance occupations (19.2%); production occupations (13.8%); material moving occupations (12.3%); service occupations (9.5%); management occupations (except farmers) (7.0%); architecture and engineering occupations (7.0%)
Most popular occupations of females: sales and office occupations (39.2%); service occupations (38.6%); production occupations (11.1%); business and financial operations occupations (4.4%); legal occupations (2.8%); healthcare practitioners and technical occupations (2.1%); education, training, and library occupations (1.6%)
Highways in this neighborhood: US Hwy 59 (Eastex Fwy); Sam Houston Pkwy (State Loop 8, Beltway 8); US Hwy 59.
Roads and streets: John F Kennedy Blvd; Lee Rd; Will Clayton Pkwy; McKaughan Rd (Jetero Blvd); Greens Rd; Rankin Rd; Richey Rd; Bender Rd; Tug Rd; N Terminal Rd; S Terminal Rd; Aldine Bender Rd (FM 525); Old Humble Rd; Milner Rd; Baltrip Rd (Landfill 2 Rd); State Hwy 59 N Svc Rd (US Hwy 59, Eastex Frwy Svc Rd, Hwy 59 Feeder Rd); Wright Rd; World Houston Pkwy; Farrell Rd; H H Ranch Rd; Edwards Dr; Shirley Ln; Martha Ln; John F Kennedy Service; Morales Rd; FM 1960 Rd W (Humble Westfield Rd, State Spur 184); International Plaza Dr; Pinetex Dr; Townsan Rd; Vickery Dr; Oak Village Dr; Old N Belt Dr; Greenview Dr; Glen Lee Dr; Eddie Dr; Interwood North Pkwy; Kendrick Plz (Kendrick Plaza Dr); Upshaw Dr; Green Manor Dr; Pardoe Dr; Shelburne St; Hawes Rd; Marine Rd; Honeysuckle Ln; Boness Rd; Jetero Blvd (Mecom Rd); Kurt Dr; Roberta Ln; Velma Ln; Roach Rd; Winsted Ln; Security Patrol Rd; Chanute Rd; Albert Dr; Woodview Dr; Aldine Westfield Rd; McKay Blvd; Borderville School Rd; Birnamwood Blvd; Howell St; Kenswick Dr; Storey Dr; Schultz St; Green Rock Rd; Export Plaza Dr; Springhaven Dr; Swan Rd; Luthe Ln; Lakeview Dr; Apgar St; Cargo (Airfreight Rd); E Gate Rd; Hamblen Dr; Sears Dr; Green Mountain Dr; Truxton St; Star Lake Dr; Colonel Fisher Blvd; Willowtex Dr; Diplomatic Plz; Stephenson Rd; Marwood Dr; Green Valley Dr; Saybrook St; Larchwood Dr; Beatty Dr; Landfill 2 Rd; Live Oak Dr; Betty Joyce Ln; Commercial Park Dr; Morningdale St; Cadwalder Ln; Leaftex Dr; Eastex Freeway Fwy; Green Tree Dr; Viscount Rd (Abercrombie); Hickorytex Dr; Manor Way; Ruston; Standifer St; Vickery Rd; Dwyer Dr; Glen Grove St; Buckow Dr; Martin Luther King Jr Dr; Trade Center Dr; Muskegon St; Elmtex Dr; Charpiot Ln; Wild Turkey Bend; Glenvine Dr; Rocky Nook Dr; Plumtex; Mc Knight Ln; Green Hill Dr; Standifer; Green Spur St; Vera Dr; Carver Ave; Keith Dr; Louie Welch Dr; W Charpiot; Highmore Dr; Embassy Plaza Dr; Borders Dr; Mill Rd; Green Island Dr; Consulate Plaza Dr; Crosswinds Blvd (Crosswinds Dr); Stillmeadows; Frost St; Verde Valley Dr; Sweetgum Dr; Stapley Dr; Security Rd; Igloo Rd; Rockbourne Dr; Vandergrift Dr; Phillips Ln; Green Oaks Dr; Cross Continents Dr; Green River Dr (Herngrif St); Bayou Ridge Dr; Hamblen Rd; Sun Rd; N Charpiot Ln; Market Center Dr; Airmail Rd; Duncan Ln; Aeropark Dr; Skytrain Rd (Grace St); Brewer Ln; Pecantex Dr; Rolling Acres Dr; Tradewinds Dr; State Loop 8; Swanmore Dr; Banks St; Heathrow Forrest Pkwy; S Charpiot; Jones St; Hightower Ln; Corley Dr (Lodestar Rd); Pallet Rd (Cutbirth); Airfoil Rd (Gore); Granger; Post Office St; Volta Dr; Farr Ave; Roebuck Dr; Peachtex Dr; Rheba Way; Mosstex Dr; Grand Prarie Dr; Ernest Dr; Ashtex Dr; Delfan Cir; Gorge Way; Willow; Lee Land Dr; Green Manor Ct; Schletty; Schetty St; Winsted Ct; Sunfield Dr; Interwood South Pkwy; Willa Ln; Doubletree Plaza Dr; Springhaven Ct.
Railroad features: Southern Pacific RR.
Other features: Garners Byu; Reinhardt Byu.
Other features: Turkey Crk.
George Bush International Airport neighborhood detailed profile
Area: 26.657 square miles
Population: 33,825
Population density:
| George Bush International Airport (Airport): | 1,269 people per square mile |
| Houston: | 3,947 people per square mile |
Median household income in 2021:
| George Bush International Airport (Airport): | $80,262 |
| Houston: | $55,499 |
Median rent in in 2021:
| George Bush International Airport (Airport): | $929 |
| Houston: | $974 |
Male vs Females
| Males: | 16,482 |
| Females: | 17,343 |
Median age
| Males: | 20.3 years |
| Females: | 17.5 years |
Most popular occupations of males: sales and office occupations (19.7%); construction, extraction, and maintenance occupations (19.2%); production occupations (13.8%); material moving occupations (12.3%); service occupations (9.5%); management occupations (except farmers) (7.0%); architecture and engineering occupations (7.0%)
Most popular occupations of females: sales and office occupations (39.2%); service occupations (38.6%); production occupations (11.1%); business and financial operations occupations (4.4%); legal occupations (2.8%); healthcare practitioners and technical occupations (2.1%); education, training, and library occupations (1.6%)
Highways in this neighborhood: US Hwy 59 (Eastex Fwy); Sam Houston Pkwy (State Loop 8, Beltway 8); US Hwy 59.
Roads and streets: John F Kennedy Blvd; Lee Rd; Will Clayton Pkwy; McKaughan Rd (Jetero Blvd); Greens Rd; Rankin Rd; Richey Rd; Bender Rd; Tug Rd; N Terminal Rd; S Terminal Rd; Aldine Bender Rd (FM 525); Old Humble Rd; Milner Rd; Baltrip Rd (Landfill 2 Rd); State Hwy 59 N Svc Rd (US Hwy 59, Eastex Frwy Svc Rd, Hwy 59 Feeder Rd); Wright Rd; World Houston Pkwy; Farrell Rd; H H Ranch Rd; Edwards Dr; Shirley Ln; Martha Ln; John F Kennedy Service; Morales Rd; FM 1960 Rd W (Humble Westfield Rd, State Spur 184); International Plaza Dr; Pinetex Dr; Townsan Rd; Vickery Dr; Oak Village Dr; Old N Belt Dr; Greenview Dr; Glen Lee Dr; Eddie Dr; Interwood North Pkwy; Kendrick Plz (Kendrick Plaza Dr); Upshaw Dr; Green Manor Dr; Pardoe Dr; Shelburne St; Hawes Rd; Marine Rd; Honeysuckle Ln; Boness Rd; Jetero Blvd (Mecom Rd); Kurt Dr; Roberta Ln; Velma Ln; Roach Rd; Winsted Ln; Security Patrol Rd; Chanute Rd; Albert Dr; Woodview Dr; Aldine Westfield Rd; McKay Blvd; Borderville School Rd; Birnamwood Blvd; Howell St; Kenswick Dr; Storey Dr; Schultz St; Green Rock Rd; Export Plaza Dr; Springhaven Dr; Swan Rd; Luthe Ln; Lakeview Dr; Apgar St; Cargo (Airfreight Rd); E Gate Rd; Hamblen Dr; Sears Dr; Green Mountain Dr; Truxton St; Star Lake Dr; Colonel Fisher Blvd; Willowtex Dr; Diplomatic Plz; Stephenson Rd; Marwood Dr; Green Valley Dr; Saybrook St; Larchwood Dr; Beatty Dr; Landfill 2 Rd; Live Oak Dr; Betty Joyce Ln; Commercial Park Dr; Morningdale St; Cadwalder Ln; Leaftex Dr; Eastex Freeway Fwy; Green Tree Dr; Viscount Rd (Abercrombie); Hickorytex Dr; Manor Way; Ruston; Standifer St; Vickery Rd; Dwyer Dr; Glen Grove St; Buckow Dr; Martin Luther King Jr Dr; Trade Center Dr; Muskegon St; Elmtex Dr; Charpiot Ln; Wild Turkey Bend; Glenvine Dr; Rocky Nook Dr; Plumtex; Mc Knight Ln; Green Hill Dr; Standifer; Green Spur St; Vera Dr; Carver Ave; Keith Dr; Louie Welch Dr; W Charpiot; Highmore Dr; Embassy Plaza Dr; Borders Dr; Mill Rd; Green Island Dr; Consulate Plaza Dr; Crosswinds Blvd (Crosswinds Dr); Stillmeadows; Frost St; Verde Valley Dr; Sweetgum Dr; Stapley Dr; Security Rd; Igloo Rd; Rockbourne Dr; Vandergrift Dr; Phillips Ln; Green Oaks Dr; Cross Continents Dr; Green River Dr (Herngrif St); Bayou Ridge Dr; Hamblen Rd; Sun Rd; N Charpiot Ln; Market Center Dr; Airmail Rd; Duncan Ln; Aeropark Dr; Skytrain Rd (Grace St); Brewer Ln; Pecantex Dr; Rolling Acres Dr; Tradewinds Dr; State Loop 8; Swanmore Dr; Banks St; Heathrow Forrest Pkwy; S Charpiot; Jones St; Hightower Ln; Corley Dr (Lodestar Rd); Pallet Rd (Cutbirth); Airfoil Rd (Gore); Granger; Post Office St; Volta Dr; Farr Ave; Roebuck Dr; Peachtex Dr; Rheba Way; Mosstex Dr; Grand Prarie Dr; Ernest Dr; Ashtex Dr; Delfan Cir; Gorge Way; Willow; Lee Land Dr; Green Manor Ct; Schletty; Schetty St; Winsted Ct; Sunfield Dr; Interwood South Pkwy; Willa Ln; Doubletree Plaza Dr; Springhaven Ct.
Railroad features: Southern Pacific RR.
Other features: Garners Byu; Reinhardt Byu.
Other features: Turkey Crk.
George Bush International Airport neighborhood detailed profile
Golfcrest neighborhood in Houston statistics: (Find on map)
Area: 5.119 square miles
Population: 28,062
Population density:
Median household income in 2021:
Median rent in in 2021:
Male vs Females
Median age
Housing prices:
Average estimated value of detached houses in 2021 (66.0% of all units):
Average estimated '21 value of housing units in 5-or-more-unit structures (26.7% of all units):
Most popular occupations of males: construction, extraction, and maintenance occupations (28.9%); service occupations (12.4%); production occupations (12.0%); material moving occupations (10.6%); transportation occupations (10.1%); sales and office occupations (9.4%); management occupations (except farmers) (5.0%)
Most popular occupations of females: service occupations (38.2%); sales and office occupations (28.5%); management occupations (except farmers) (4.3%); healthcare practitioners and technical occupations (4.1%); community and social services occupations (3.7%); education, training, and library occupations (3.6%); material moving occupations (3.6%)
Limited-access highways (interstate or state) in this neighborhood: Gulf Fwy (I- 45); I- 610 (S Loop Fwy).
Highways in this neighborhood: Reville St (State Hwy 35, Reveille St).
Roads and streets: Moline St; Dixie Dr; Long Dr; Northdale St; Bellfort St; Westover St; Telephone Rd; Fairway Dr; Mc Henry St; Reed Rd; Edna St; Richwood Rd; Waltrip St; Chaffin St; la Paseo St (la Paseo Dr); Hogue St; Park Place Blvd; Ledbetter St; Midvale Ave (Midvale St); Thrush Dr; Heron Dr; Flamingo Dr; S Wayside Dr; Luce St; Joplin St; Lancaster St; Kingsley St; Plainview St; Heffernan St; Rupley Cir; Kingsway Dr; Nunn St; Poplar St; Thurow St; Crosswell St; Ridgeway Dr; Winfree Dr; Lindbergh St; Arnim St; Greenstone St; Glen Rock Dr; Joyner St; Buena Vista St; Eppes St; de Leon St; Roxbury Rd; Oak Vista St; Rook Blvd; Oakhill Dr; Harbrook Dr; Bradford St; Gammage St; Mayfair St; el Rancho St; Hereford St; Stanwick Dr; Colgate St; Culmore Dr; Greendowns St; Kinney St; Southbrook Dr; Dover Ave (Dover St); Gillen St; Weslow St; Broad St; Cedar Crest St (Cedar Crest Blvd); Sloan St; Maudlin St; Willow Dale St (Willow Dale Ave); Lakehurst Dr; Cavalier Ave (Cavalier St); Evergreen Dr; Lyndhurst Dr; Glencoe St (Glencoe Ave); Briefway St (Briefway Ave); Hirondel St; Erie St; Iron Rock Ave (Iron Rock St); McGrew St (McGrew Ave); Meyer St; Brook Lea St (Brook Lea Ave); Cherrydale Dr; Carothers St; Clover Ridge; Brockley Ln; Sunnycrest Ave (Sunnycrest St); Broadway St; Clementshire St; Swallow St; Ridgemont St; Cheswood St; ; Etheridge St; Beldart St; Camwood St; Cherryhill Ave (Cherryhill St); Belk St; Vista Verde St; Golfway St; Southern; Mount Carmel Dr (Mount Carmel St); Southway Dr; Bullfinch St; Nunn St (Nunn Ave); Avery; Fairlawn St; Springer St; Heiser St; Westdale St; Ransom St; Timmen; Belcrest St; Belarbor St; Belmark St; Bois D Arc St; Corl St; Plainview; Joyner; Trendale St; Glenbrook Ct; Tucker St; Eton St; Juniper; Overdale St; Linda St; Aline St; Plum Dr; Tilfer St; Halmart St; Whitefriars Dr; Andwood St; Broadwood; Schevers St; Woodridge Dr; Blue Ridge Dr; Roe Dr; Bernice St; Golfcrest Blvd; Irving Way; Tropical Way; Vena Dr; Simsdale St; Landfall Ln; Meineke St; Reveille; Netherfield St; Winterhaven Dr; Pebble Ln (Pebble Dr); Cottonwood St (Cottonwood Dr); Gulf St; Monsanta Dr (Monsanta St); Honeysuckle Dr; Edinburg St; Pecan St; Berkley St; Delwood St; Agnes St; Reed Ct; Hasbrook St; Greenway Ct; Sunridge Way; Florine St; Dawnview St; Ridgemont.
Other features: Sims Byu; Plum Crk.
Golfcrest neighborhood detailed profile
Area: 5.119 square miles
Population: 28,062
Population density:
| Golfcrest (Reveille): | 5,482 people per square mile |
| Houston: | 3,947 people per square mile |
Median household income in 2021:
| Golfcrest (Reveille): | $50,703 |
| Houston: | $55,499 |
Median rent in in 2021:
| Golfcrest (Reveille): | $766 |
| Houston: | $974 |
Male vs Females
| Males: | 13,846 |
| Females: | 14,216 |
Median age
| Males: | 36.6 years |
| Females: | 35.0 years |
Housing prices:
Average estimated value of detached houses in 2021 (66.0% of all units):
| Golfcrest (Reveille): | $158,907 |
| Houston: | $304,685 |
Average estimated '21 value of housing units in 5-or-more-unit structures (26.7% of all units):
| Golfcrest (Reveille): | $69,237 |
| Houston: | $227,414 |
Most popular occupations of males: construction, extraction, and maintenance occupations (28.9%); service occupations (12.4%); production occupations (12.0%); material moving occupations (10.6%); transportation occupations (10.1%); sales and office occupations (9.4%); management occupations (except farmers) (5.0%)
Most popular occupations of females: service occupations (38.2%); sales and office occupations (28.5%); management occupations (except farmers) (4.3%); healthcare practitioners and technical occupations (4.1%); community and social services occupations (3.7%); education, training, and library occupations (3.6%); material moving occupations (3.6%)
Limited-access highways (interstate or state) in this neighborhood: Gulf Fwy (I- 45); I- 610 (S Loop Fwy).
Highways in this neighborhood: Reville St (State Hwy 35, Reveille St).
Roads and streets: Moline St; Dixie Dr; Long Dr; Northdale St; Bellfort St; Westover St; Telephone Rd; Fairway Dr; Mc Henry St; Reed Rd; Edna St; Richwood Rd; Waltrip St; Chaffin St; la Paseo St (la Paseo Dr); Hogue St; Park Place Blvd; Ledbetter St; Midvale Ave (Midvale St); Thrush Dr; Heron Dr; Flamingo Dr; S Wayside Dr; Luce St; Joplin St; Lancaster St; Kingsley St; Plainview St; Heffernan St; Rupley Cir; Kingsway Dr; Nunn St; Poplar St; Thurow St; Crosswell St; Ridgeway Dr; Winfree Dr; Lindbergh St; Arnim St; Greenstone St; Glen Rock Dr; Joyner St; Buena Vista St; Eppes St; de Leon St; Roxbury Rd; Oak Vista St; Rook Blvd; Oakhill Dr; Harbrook Dr; Bradford St; Gammage St; Mayfair St; el Rancho St; Hereford St; Stanwick Dr; Colgate St; Culmore Dr; Greendowns St; Kinney St; Southbrook Dr; Dover Ave (Dover St); Gillen St; Weslow St; Broad St; Cedar Crest St (Cedar Crest Blvd); Sloan St; Maudlin St; Willow Dale St (Willow Dale Ave); Lakehurst Dr; Cavalier Ave (Cavalier St); Evergreen Dr; Lyndhurst Dr; Glencoe St (Glencoe Ave); Briefway St (Briefway Ave); Hirondel St; Erie St; Iron Rock Ave (Iron Rock St); McGrew St (McGrew Ave); Meyer St; Brook Lea St (Brook Lea Ave); Cherrydale Dr; Carothers St; Clover Ridge; Brockley Ln; Sunnycrest Ave (Sunnycrest St); Broadway St; Clementshire St; Swallow St; Ridgemont St; Cheswood St; ; Etheridge St; Beldart St; Camwood St; Cherryhill Ave (Cherryhill St); Belk St; Vista Verde St; Golfway St; Southern; Mount Carmel Dr (Mount Carmel St); Southway Dr; Bullfinch St; Nunn St (Nunn Ave); Avery; Fairlawn St; Springer St; Heiser St; Westdale St; Ransom St; Timmen; Belcrest St; Belarbor St; Belmark St; Bois D Arc St; Corl St; Plainview; Joyner; Trendale St; Glenbrook Ct; Tucker St; Eton St; Juniper; Overdale St; Linda St; Aline St; Plum Dr; Tilfer St; Halmart St; Whitefriars Dr; Andwood St; Broadwood; Schevers St; Woodridge Dr; Blue Ridge Dr; Roe Dr; Bernice St; Golfcrest Blvd; Irving Way; Tropical Way; Vena Dr; Simsdale St; Landfall Ln; Meineke St; Reveille; Netherfield St; Winterhaven Dr; Pebble Ln (Pebble Dr); Cottonwood St (Cottonwood Dr); Gulf St; Monsanta Dr (Monsanta St); Honeysuckle Dr; Edinburg St; Pecan St; Berkley St; Delwood St; Agnes St; Reed Ct; Hasbrook St; Greenway Ct; Sunridge Way; Florine St; Dawnview St; Ridgemont.
Other features: Sims Byu; Plum Crk.
Golfcrest neighborhood detailed profile
Greater Heights neighborhood in Houston statistics: (Find on map)
Area: 7.468 square miles
Population: 50,745
Population density:
Median household income in 2021:
Median rent in in 2021:
Male vs Females
Median age
Housing prices:
Average estimated value of detached houses in 2021 (65.1% of all units):
Average estimated value of townhouses or other attached units in 2021 (8.1% of all units):
Most popular occupations of males: management occupations (except farmers) (21.1%); sales and office occupations (14.7%); business and financial operations occupations (8.8%); service occupations (8.6%); architecture and engineering occupations (8.5%); construction, extraction, and maintenance occupations (6.1%); computer and mathematical occupations (5.1%)
Most popular occupations of females: management occupations (except farmers) (18.3%); sales and office occupations (17.7%); service occupations (14.0%); education, training, and library occupations (11.1%); business and financial operations occupations (10.9%); healthcare practitioners and technical occupations (8.6%); architecture and engineering occupations (5.8%)
Limited-access highways (interstate or state) in this neighborhood: I- 45 (Ih 45-Hov Fwy); N Loop Fwy (I- 610); I- 10 (10-Hov Fwy).
Roads and streets: Arlington St; Cortlandt St; Yale St; Harvard St; Oxford St; Columbia St; W 25th St; N Main St; W 26th St; W 22nd St; N Shepherd Dr; W 23rd St; W 24th St; White Oak Dr; Rutland St; W 21st St; Nicholson St; Norhill Blvd; Ashland St; W 19th St; Studewood St; W 18th St; Heights Blvd; W 20th St; Lawrence St; Michaux St; W 17th St; W 16th St; Northwood St; Tabor St; W 27th St; N Durham Dr; Waverly St; Allston St; W 15th St; E 28th St; Enid St; E 27th St; E 26th St; Aurora St; W Cavalcade St; Airline Dr; Watson St; Link Rd; E 14th St; Omar St; Julian St; E 23rd St; E 24th St; Walton St; W 14th St; Herkimer St; Tulane St; E 25th St; W 13th St; Bayland Ave; W 28th St; Beverly St; Dorothy St; Bevis St; Beall St; W 12th St; Highland St; Euclid St; W 11th St; Cordell St; E 11th St; Woodland St; E 16th St; Alexander St; E 7th St; W Cottage St; Merrill St; Houston Ave; Pecore St; Reagan St; E 29th St; W 10th St; Byrne St; Redan St; W 8th St; W 9th St; W Patton St; Beauchamp St; Archer St; Louise St; Key St; E 20th St; Algregg St; E 18th St; E 13th St; Teetshorn St; E 10th St; E 12th St; E 9th St; E 8th St; W 6th St; Vincent St; E 22nd St; Nadine St; W Temple Ave; W Melwood St; Ridge St; Usener St; W 15 1/2 St (W 15th 1/2 St); Morrison St; Peddie St; E 6 1/2 St (E 6th 1/2 St); E 7 1/2 St; W Fugate St; Florence St; Sylvester Rd; E 15th St; Adele St; Heslep St; Temple St; Ella Blvd; Fugate St; Melwood St; E 4th St; E 5th St; Nashua St; Le Green St; Mathis St; Robbie St; Walling St; Dunbar St; Couch St; W 14 1/2 St (W 14th 1/2 St); Jewett St; Dian St; Gibbs St; Gostic St; Princeton St; Gardner Ave; Kern St; Prince St; Blair St; Laird St; Pizer St; Winston St; Service St; Pittman St; Coronado St (Coronado Ave); E T C Jester Blvd; Pineridge St; Oakridge St; Tarver St; Kolb St; E 21st St; Helen St; Baylor St; E 19th St; E 17th St; E 13th 1/2 St; E 12 1/2 St (E 12th 1/2 St); E 11 1/2 St (E 11th 1/2 St); E 10 1/2 St (E 10th 1/2 St); E 8th 1/2 St (E 8 1/2 St); Wrightwood St; Idylwild St; Cornell St; Wendel St; Cottage; Moss St; Jerome St; Taylor St; W Gardner St; Munford St; Forester; Studemont St; Singleton St; Eastman St; Hackett Dr; Ralfallen St; Payne St; Pettit St; E 5 1/2 St (E 5th 1/2 St); Conoly St; Edsee St; Brinkman St; Parkview St; Gardner St; W 7th St; Railey St; Cornish St; W 10th 1/2 St (W 10 1/2 St); Patterson St; W 5th St; N Sabine St; Threlkeld St; Sheldon St; Eunice St; Tyler St; Blount St; W Norma St; Shelley St; ; Lula St; Angelina St; North St; Clio St; Grinnell; Gladys St; Yale Ct; Kermit St; Dell Ct; W 7 1/2 St (W 7th 1/2 St); Hall Pl; Mainford St; ; Voight St; de George St; Bonner St; E Woodland St; Wilken St; Sage St; Samuel St; Armstead St; Frasier St; 6th; Granberry St; Leafton Ln; Thelma Dr; Rutland Pl; Sledge St; Reserve St; W 4th St; Citadel Plaza Dr; Posey St; Fulmer St; Quinn St; Pinegate; Cavalcade St; Greenleaf St; Alma St; Rural St; Walling; Robert Lee Rd; Harris Ct; Bradshaw St; North; Pecore; Bruce St; Ohsfeldt St; Lenard St; Bradley St; Vieux Carre Dr; Coronado St; Emir; Coronado; Carter St; Rogers St; Quitman St; Wilder St; Raiff St; Minter; Studewood; Stude St; Beck Ct; E 4 1/2 St (E 4th 1/2 St); Fenwick St; Eichwurzel Ln; Main; Enid; Mossy Cir (Mosby Cir); Bonover St; Opal Ct; Watson; E Norma St; Maufferd St; Walton; Thomas St; Wynn St; Link-Loop; Carl; Norma St; Patton St.
Railroad features: Union Pacific RR; Southern Pacific RR.
Other features: White Oak Byu; Little White Oak Byu; Little Whiteoak Byu.
Greater Heights neighborhood detailed profile
Area: 7.468 square miles
Population: 50,745
Population density:
| Greater Heights: | 6,795 people per square mile |
| Houston: | 3,947 people per square mile |
Median household income in 2021:
| Greater Heights: | $123,415 |
| Houston: | $55,499 |
Median rent in in 2021:
| Greater Heights: | $1,252 |
| Houston: | $974 |
Male vs Females
| Males: | 26,606 |
| Females: | 24,139 |
Median age
| Males: | 36.4 years |
| Females: | 37.8 years |
Housing prices:
Average estimated value of detached houses in 2021 (65.1% of all units):
| Greater Heights: | $575,965 |
| Houston: | $304,685 |
Average estimated value of townhouses or other attached units in 2021 (8.1% of all units):
| This neighborhood: | $364,400 |
| city: | $305,463 |
Most popular occupations of males: management occupations (except farmers) (21.1%); sales and office occupations (14.7%); business and financial operations occupations (8.8%); service occupations (8.6%); architecture and engineering occupations (8.5%); construction, extraction, and maintenance occupations (6.1%); computer and mathematical occupations (5.1%)
Most popular occupations of females: management occupations (except farmers) (18.3%); sales and office occupations (17.7%); service occupations (14.0%); education, training, and library occupations (11.1%); business and financial operations occupations (10.9%); healthcare practitioners and technical occupations (8.6%); architecture and engineering occupations (5.8%)
Limited-access highways (interstate or state) in this neighborhood: I- 45 (Ih 45-Hov Fwy); N Loop Fwy (I- 610); I- 10 (10-Hov Fwy).
Roads and streets: Arlington St; Cortlandt St; Yale St; Harvard St; Oxford St; Columbia St; W 25th St; N Main St; W 26th St; W 22nd St; N Shepherd Dr; W 23rd St; W 24th St; White Oak Dr; Rutland St; W 21st St; Nicholson St; Norhill Blvd; Ashland St; W 19th St; Studewood St; W 18th St; Heights Blvd; W 20th St; Lawrence St; Michaux St; W 17th St; W 16th St; Northwood St; Tabor St; W 27th St; N Durham Dr; Waverly St; Allston St; W 15th St; E 28th St; Enid St; E 27th St; E 26th St; Aurora St; W Cavalcade St; Airline Dr; Watson St; Link Rd; E 14th St; Omar St; Julian St; E 23rd St; E 24th St; Walton St; W 14th St; Herkimer St; Tulane St; E 25th St; W 13th St; Bayland Ave; W 28th St; Beverly St; Dorothy St; Bevis St; Beall St; W 12th St; Highland St; Euclid St; W 11th St; Cordell St; E 11th St; Woodland St; E 16th St; Alexander St; E 7th St; W Cottage St; Merrill St; Houston Ave; Pecore St; Reagan St; E 29th St; W 10th St; Byrne St; Redan St; W 8th St; W 9th St; W Patton St; Beauchamp St; Archer St; Louise St; Key St; E 20th St; Algregg St; E 18th St; E 13th St; Teetshorn St; E 10th St; E 12th St; E 9th St; E 8th St; W 6th St; Vincent St; E 22nd St; Nadine St; W Temple Ave; W Melwood St; Ridge St; Usener St; W 15 1/2 St (W 15th 1/2 St); Morrison St; Peddie St; E 6 1/2 St (E 6th 1/2 St); E 7 1/2 St; W Fugate St; Florence St; Sylvester Rd; E 15th St; Adele St; Heslep St; Temple St; Ella Blvd; Fugate St; Melwood St; E 4th St; E 5th St; Nashua St; Le Green St; Mathis St; Robbie St; Walling St; Dunbar St; Couch St; W 14 1/2 St (W 14th 1/2 St); Jewett St; Dian St; Gibbs St; Gostic St; Princeton St; Gardner Ave; Kern St; Prince St; Blair St; Laird St; Pizer St; Winston St; Service St; Pittman St; Coronado St (Coronado Ave); E T C Jester Blvd; Pineridge St; Oakridge St; Tarver St; Kolb St; E 21st St; Helen St; Baylor St; E 19th St; E 17th St; E 13th 1/2 St; E 12 1/2 St (E 12th 1/2 St); E 11 1/2 St (E 11th 1/2 St); E 10 1/2 St (E 10th 1/2 St); E 8th 1/2 St (E 8 1/2 St); Wrightwood St; Idylwild St; Cornell St; Wendel St; Cottage; Moss St; Jerome St; Taylor St; W Gardner St; Munford St; Forester; Studemont St; Singleton St; Eastman St; Hackett Dr; Ralfallen St; Payne St; Pettit St; E 5 1/2 St (E 5th 1/2 St); Conoly St; Edsee St; Brinkman St; Parkview St; Gardner St; W 7th St; Railey St; Cornish St; W 10th 1/2 St (W 10 1/2 St); Patterson St; W 5th St; N Sabine St; Threlkeld St; Sheldon St; Eunice St; Tyler St; Blount St; W Norma St; Shelley St; ; Lula St; Angelina St; North St; Clio St; Grinnell; Gladys St; Yale Ct; Kermit St; Dell Ct; W 7 1/2 St (W 7th 1/2 St); Hall Pl; Mainford St; ; Voight St; de George St; Bonner St; E Woodland St; Wilken St; Sage St; Samuel St; Armstead St; Frasier St; 6th; Granberry St; Leafton Ln; Thelma Dr; Rutland Pl; Sledge St; Reserve St; W 4th St; Citadel Plaza Dr; Posey St; Fulmer St; Quinn St; Pinegate; Cavalcade St; Greenleaf St; Alma St; Rural St; Walling; Robert Lee Rd; Harris Ct; Bradshaw St; North; Pecore; Bruce St; Ohsfeldt St; Lenard St; Bradley St; Vieux Carre Dr; Coronado St; Emir; Coronado; Carter St; Rogers St; Quitman St; Wilder St; Raiff St; Minter; Studewood; Stude St; Beck Ct; E 4 1/2 St (E 4th 1/2 St); Fenwick St; Eichwurzel Ln; Main; Enid; Mossy Cir (Mosby Cir); Bonover St; Opal Ct; Watson; E Norma St; Maufferd St; Walton; Thomas St; Wynn St; Link-Loop; Carl; Norma St; Patton St.
Railroad features: Union Pacific RR; Southern Pacific RR.
Other features: White Oak Byu; Little White Oak Byu; Little Whiteoak Byu.
Greater Heights neighborhood detailed profile
Greater Hobby neighborhood in Houston statistics: (Find on map)
Area: 16.030 square miles
Population: 28,811
Population density:
Median household income in 2021:
Median rent in in 2021:
Male vs Females
Median age
Housing prices:
Average estimated value of detached houses in 2021 (78.1% of all units):
Average estimated value of townhouses or other attached units in 2021 (3.4% of all units):
Average estimated '21 value of housing units in 5-or-more-unit structures (17.7% of all units):
Most popular occupations of males: construction, extraction, and maintenance occupations (27.3%); sales and office occupations (12.6%); management occupations (except farmers) (9.6%); service occupations (9.4%); production occupations (7.6%); transportation occupations (6.4%); material moving occupations (4.3%)
Most popular occupations of females: sales and office occupations (31.1%); service occupations (25.8%); education, training, and library occupations (9.5%); management occupations (except farmers) (6.9%); healthcare practitioners and technical occupations (6.8%); arts, design, entertainment, sports, and media occupations (6.5%); business and financial operations occupations (4.6%)
Other features: Clear Crk.
Limited-access highways (interstate or state) in this neighborhood: I- 45 (Gulf Fwy).
Highways in this neighborhood: State Hwy 35 (Telephone Rd); State Loop 8 (Beltway 8, Sam Houston Pkwy).
Roads and streets: Airport Blvd; Almeda-Genoa Rd; Monroe Rd; Tavenor Ln; Dillon St; Santa Fe Dr; Cayton St (Cayton Ave); Wingtip Dr; Brace St; Fauna St; Clearwood St; Evans St; Ballantine St; Forbes Rd; Kopman Dr; Randolph St; Bellfort St; W Monroe Rd; Meldrum Ln; Villa Dr; Rockhill St; Morley St; Scranton St; Freeland St; Ledge St; Ashburn St; Broadway St; Braniff St; Neuhaus Ave (Neuhaus St); Intervale St; Swiftwater Ln; Dover St; Hollock St; Easthaven Blvd; Hansen Rd; Glen Valley Dr; Wilmerdean St; Radio Rd; Glenloch Dr; Grannis St; Tewantin Dr; Glenvista St; Fuqua St; Peekskill Ln; Convair Ave; Edgebrook; Conger St; Garden Parks Dr; Larson; Pecan Villas Dr; Leitz Rd (Gulf Meadows Dr); Glenlea St; Nelms St (Nelms Ave); Klondike St; Glenheath St; Catalina Ln; Hickok Ln; Mosley Rd; Arledge St; Wynlea St; Glenbrae St; Prentiss Dr; Hinman St; Dirby St; Constellation Ln; Winthrop St (Winthrop Ln); Tareyton Ln; Botany Ln; Swiss Ln; Gulick Ln; Lanham Ln; Glencrest St; Misty Vale Ln; Sims Dr; Coastway Ln; Wetherby Ln; Ruthby St; A Ave; Haywood Dr; Red Robin Ln; Lettie St; Gulf Spring Ln; Broadview Dr; Meadville St; Saylynn Ln; Jet Pilot St (Jet Pilot Ave); Dexter St (Dexter Blvd); Glenalta St; Holiday Ln; Drouet St; Folkestone Ln; Leonora St; Major St; Wayfarer Ln; Brisbane St; Santa Elena St (Santa Elena Dr); Panair St; Greenswarth Ln; Arrowhead Ln; Tallyho Rd; Hall Rd; Minnesota; Springtime Ln; Travelair St; Glenscot St; Lockheed Ave (Lockheed St); Barton St; Judwin St; Glen Prairie St; Stone St; Tipperary Ln; Rowe Ln; Ipswich Rd; Brisbane Rd; Anacortes St; Glenview Dr; Gulf Tree Ln; Montglen Dr (Montglen St); Gulf Valley; Gulfwood Ln; Glencrest St (Glencrest Ave); Colgate St; Gulfdale Dr; Grahamcrest Dr; Glen Dell Ct; Minnesota St; Manning Ln; Cub Ln; Rowlett Rd; Bryant St; Nathaniel St; Moers Rd; Allsup St; Redford Ave (Redford St); Byram; Fuqua Gardens Dr (Fuqua Garden); Wynbrook St; Sandgate Rd; N Haywood Dr; Alpine Dr (W Alpine Dr); Linden Crest St; Hobby Airport Loop; de Leon St; S Haywood Dr; Jo Edna Rd; Pamela Dr; Mattby St; Skylane Rd; Peach Blossom St; Hollygrove Dr; Holiday Ln (2218 Rd); Covern St; Judwin; Canniff St; Bluejay Ln (Bluejay St); Glenaire St; Arendale St; Papasan; Piccadilly Dr; Glenforest Ct; Old Telephone Rd; Koala Dr; Tweed Dr; Wynmeadow Dr; S Santa Fe Dr; E Alpine Dr; Conlon St; Alanwood St; Canberra; Telean St; Ashburn Spr; Nelms St; Larson St (Larson Ave); Morley; Swallow St; Convair; Fairgate Ln; Braniff; Deckard St; Vesper; Lakewind St (Lakewind Dr); Ledge; Quiet Valley Ln; Wheeden Rd; Glencross St (Glencross Dr); Snipes; Prosperity; Stony Dell Ct; Grove Ridge Dr; Palm Shadows St; Catford St; Ipswick Rd; Stone; Erie St; Genoa Rd; Paul B Koonce St; Hollock; Arletta St; Garner Rd; Edgebrook Dr; Jet Pilot; Biggs Ct; Panair; Montglen Ct; W Alpine Dr; Glenheath; Howard Dr; Brisbane Dr.
Railroad features: at and Sf Rlwy.
Other features: Berry Crk; Clear Crk; Sims Byu.
Greater Hobby neighborhood detailed profile
Area: 16.030 square miles
Population: 28,811
Population density:
| Greater Hobby: | 1,797 people per square mile |
| Houston: | 3,947 people per square mile |
Median household income in 2021:
| Greater Hobby: | $54,898 |
| Houston: | $55,499 |
Median rent in in 2021:
| Greater Hobby: | $819 |
| Houston: | $974 |
Male vs Females
| Males: | 13,886 |
| Females: | 14,925 |
Median age
| Males: | 35.7 years |
| Females: | 33.8 years |
Housing prices:
Average estimated value of detached houses in 2021 (78.1% of all units):
| Greater Hobby: | $189,586 |
| Houston: | $304,685 |
Average estimated value of townhouses or other attached units in 2021 (3.4% of all units):
| This neighborhood: | $103,445 |
| city: | $305,463 |
Average estimated '21 value of housing units in 5-or-more-unit structures (17.7% of all units):
| Greater Hobby: | $33,802 |
| Houston: | $227,414 |
Most popular occupations of males: construction, extraction, and maintenance occupations (27.3%); sales and office occupations (12.6%); management occupations (except farmers) (9.6%); service occupations (9.4%); production occupations (7.6%); transportation occupations (6.4%); material moving occupations (4.3%)
Most popular occupations of females: sales and office occupations (31.1%); service occupations (25.8%); education, training, and library occupations (9.5%); management occupations (except farmers) (6.9%); healthcare practitioners and technical occupations (6.8%); arts, design, entertainment, sports, and media occupations (6.5%); business and financial operations occupations (4.6%)
Other features: Clear Crk.
Limited-access highways (interstate or state) in this neighborhood: I- 45 (Gulf Fwy).
Highways in this neighborhood: State Hwy 35 (Telephone Rd); State Loop 8 (Beltway 8, Sam Houston Pkwy).
Roads and streets: Airport Blvd; Almeda-Genoa Rd; Monroe Rd; Tavenor Ln; Dillon St; Santa Fe Dr; Cayton St (Cayton Ave); Wingtip Dr; Brace St; Fauna St; Clearwood St; Evans St; Ballantine St; Forbes Rd; Kopman Dr; Randolph St; Bellfort St; W Monroe Rd; Meldrum Ln; Villa Dr; Rockhill St; Morley St; Scranton St; Freeland St; Ledge St; Ashburn St; Broadway St; Braniff St; Neuhaus Ave (Neuhaus St); Intervale St; Swiftwater Ln; Dover St; Hollock St; Easthaven Blvd; Hansen Rd; Glen Valley Dr; Wilmerdean St; Radio Rd; Glenloch Dr; Grannis St; Tewantin Dr; Glenvista St; Fuqua St; Peekskill Ln; Convair Ave; Edgebrook; Conger St; Garden Parks Dr; Larson; Pecan Villas Dr; Leitz Rd (Gulf Meadows Dr); Glenlea St; Nelms St (Nelms Ave); Klondike St; Glenheath St; Catalina Ln; Hickok Ln; Mosley Rd; Arledge St; Wynlea St; Glenbrae St; Prentiss Dr; Hinman St; Dirby St; Constellation Ln; Winthrop St (Winthrop Ln); Tareyton Ln; Botany Ln; Swiss Ln; Gulick Ln; Lanham Ln; Glencrest St; Misty Vale Ln; Sims Dr; Coastway Ln; Wetherby Ln; Ruthby St; A Ave; Haywood Dr; Red Robin Ln; Lettie St; Gulf Spring Ln; Broadview Dr; Meadville St; Saylynn Ln; Jet Pilot St (Jet Pilot Ave); Dexter St (Dexter Blvd); Glenalta St; Holiday Ln; Drouet St; Folkestone Ln; Leonora St; Major St; Wayfarer Ln; Brisbane St; Santa Elena St (Santa Elena Dr); Panair St; Greenswarth Ln; Arrowhead Ln; Tallyho Rd; Hall Rd; Minnesota; Springtime Ln; Travelair St; Glenscot St; Lockheed Ave (Lockheed St); Barton St; Judwin St; Glen Prairie St; Stone St; Tipperary Ln; Rowe Ln; Ipswich Rd; Brisbane Rd; Anacortes St; Glenview Dr; Gulf Tree Ln; Montglen Dr (Montglen St); Gulf Valley; Gulfwood Ln; Glencrest St (Glencrest Ave); Colgate St; Gulfdale Dr; Grahamcrest Dr; Glen Dell Ct; Minnesota St; Manning Ln; Cub Ln; Rowlett Rd; Bryant St; Nathaniel St; Moers Rd; Allsup St; Redford Ave (Redford St); Byram; Fuqua Gardens Dr (Fuqua Garden); Wynbrook St; Sandgate Rd; N Haywood Dr; Alpine Dr (W Alpine Dr); Linden Crest St; Hobby Airport Loop; de Leon St; S Haywood Dr; Jo Edna Rd; Pamela Dr; Mattby St; Skylane Rd; Peach Blossom St; Hollygrove Dr; Holiday Ln (2218 Rd); Covern St; Judwin; Canniff St; Bluejay Ln (Bluejay St); Glenaire St; Arendale St; Papasan; Piccadilly Dr; Glenforest Ct; Old Telephone Rd; Koala Dr; Tweed Dr; Wynmeadow Dr; S Santa Fe Dr; E Alpine Dr; Conlon St; Alanwood St; Canberra; Telean St; Ashburn Spr; Nelms St; Larson St (Larson Ave); Morley; Swallow St; Convair; Fairgate Ln; Braniff; Deckard St; Vesper; Lakewind St (Lakewind Dr); Ledge; Quiet Valley Ln; Wheeden Rd; Glencross St (Glencross Dr); Snipes; Prosperity; Stony Dell Ct; Grove Ridge Dr; Palm Shadows St; Catford St; Ipswick Rd; Stone; Erie St; Genoa Rd; Paul B Koonce St; Hollock; Arletta St; Garner Rd; Edgebrook Dr; Jet Pilot; Biggs Ct; Panair; Montglen Ct; W Alpine Dr; Glenheath; Howard Dr; Brisbane Dr.
Railroad features: at and Sf Rlwy.
Other features: Berry Crk; Clear Crk; Sims Byu.
Greater Hobby neighborhood detailed profile
Greater Inwood neighborhood in Houston statistics: (Find on map)
Area: 6.680 square miles
Population: 25,865
Population density:
Median household income in 2021:
Median rent in in 2021:
Male vs Females
Median age
Housing prices:
Average estimated value of detached houses in 2021 (78.6% of all units):
Average estimated value of townhouses or other attached units in 2021 (15.9% of all units):
Average estimated '21 value of housing units in 5-or-more-unit structures (7.7% of all units):
Most popular occupations of males: management occupations (except farmers) (15.0%); sales and office occupations (12.9%); construction, extraction, and maintenance occupations (12.4%); material moving occupations (12.2%); production occupations (10.2%); service occupations (8.5%); transportation occupations (5.9%)
Most popular occupations of females: sales and office occupations (30.7%); service occupations (20.8%); management occupations (except farmers) (9.5%); education, training, and library occupations (7.2%); business and financial operations occupations (6.3%); healthcare practitioners and technical occupations (5.4%); material moving occupations (4.9%)
Roads and streets: N Houston Rosslyn Rd; Antoine Dr; W Little York Rd; W Gulf Bank Rd; W Tidwell Rd; T C Jester Blvd; Victory Dr; Alabonson Rd; Log Hollow Dr; Deihl Rd; Long Creek Ln; Cypress Grove Ln; Maple Tree Dr; Arncliffe Dr; Woodsman Trl; Streamside Dr; Hollister St; Mayfield Oaks Ln (R V Mayfield Dr); Lemon Tree Ln; Railhead Ln; Athlone Dr; Woodfern Dr; Holly View Dr; Holder Forest Dr; Vanwood St; Deep Forest Dr (Thousand Oaks Cir); Bingle Rd; Bent Bough Ln; Chateau Forest Dr; Cherry Forest Dr; Green Lawn Dr; Lumber Jack Dr; Deanwood St; Winding Way Dr; Black Locust Dr; Council Grove Ln; Maple Hill Dr; Trappers Forest Dr; Kindletree Dr; Sawmill Trl; Yellow Pine Dr; Elmcrest Dr; Vogel Rd; de Soto St; Lumberdale Rd; Badger Forest Dr; Shady Arbor Ln; Langfield Rd; Sheraton Oaks Dr; Williams St; Stone Brook Ln; Hannon Dr; Jaywood Dr (Jaywood St); Landwood Dr; Golden Spike Ln; Gum Grove Ln; Burlington North Dr; Tall Pines Dr; Green Falls Dr; Inwood West Dr; Saratoga Dr; Rolling Mill Dr; White Fir Dr; Black Maple Ln; Bayou Forest Dr; Green Terrace Ln; Brush Wood Dr; W Sunforest Dr; Wagonwheel Ln; Wild Basin Dr; French Chateau Dr; Eblen Dr; Lautrec Dr; Mosewood St; Villa Glen Dr; Storm Creek Dr; Darkwood Dr; Scenic Green Dr; Woodland Trails Dr; Guywood St; West Rd; Oaknut Dr; Hibernia Dr; Brookstone Dr; Droddy St; Littleberry Rd; Birchtree Forest Dr; Inwood Shadows St; Deadwood Dr; Breezeway St; Hidden Arbor Ln; Casablanca Dr; Tall Willow Dr; Battlewood Dr; High Mountain Dr; Gage St; Oak Cove Dr; Shady Corners Ln; Arbor Wood Dr; Cold Lake Dr; Lost Forest Dr; Moss Glenn Ln; Salge Dr; Inwood Park Dr; Vernwood St; Milda Dr; Deirdre Anne Dr; Abinger Ln; Acorn Forest Dr; Stone Village Ln; Pine Ridge Ln; Jadewood Dr; Majestic Oaks Dr; Oak Arbor Dr; Shingle Oak Ln; Cherry Oak Ln; Rocktree Dr; Ash Oak Dr; Stonegate Dr; Bent Branch Dr; Oak Bay Dr; Vera Jean Dr; Kellwood Dr; Greenway Ln (Donwhite Ln); Arbor Oak Dr; Par Four Dr; Walkers Forest Dr; Oak Bough Dr; Blackjack Ln; King Post Dr (King Post St); Mc Kinley Ln; Plum Grove Ln; Lawn Ln; Silver Chalice Dr; Twisting Vine Ln; Ridge Oak Dr; Fairwood Dr; Bayou Vista Dr; Birchcroft Dr; Battlecreek Dr; Garsee Dr; Zimmermann Dr; Ellington St; N Haven Dr; Inwood Hollow Ln; Woodcamp Dr; Alejo Dr; Barbados Dr; Chun Ln; Deepcreek Ln; Caris St; Statler Dr; Red Fir Dr; Silver Leaf Ln; Turfwood Ln; Larkmeadow Dr; Abba Wood; Oak Pass Dr; Ashmole Ln; Draco St; Pine Moss Dr; Alperton Dr; Pine Burr Ln; Roaring Point Dr; Breen Dr; Challie Ln; Wild Hollow Ln; Goodale Dr; Shady Grove Ln; Wishing Well Ln; Cherry Oak Cir; Sardis Ln; Francis Marion Dr; Prairie Mist St; Water Leaf Ln; Lonesome Bayou Ln; Getty Rd; Battlepine Dr; Battleoak Dr; Gauguin Dr; Leaning Oak Dr; Menwood Cir; Vega St (Vega Dr); Shady Moss Ln; Hollister Dr; Village Forest Ct; Lost Trl St; N Galayda St; Strawbridge Ln; Almington Ln; Kell Dr; Barbarella Ct; Brook Run Ln; Oak Thicket Dr; Athlone; Bateman Ln; Bolivia Blvd; Long Leaf Dr; Pirtlewood Cir; Alperton; Bayou Oaks Dr; Inwood Forest Dr; Misty Trl; Cedar Top Dr; Hearthwood Dr; Vinewood Dr; Draco; Brabant Ct; Brookfir Ln; Long Creek Ct; Gallant Forest Dr; Wray Ct; Pine Vista Ln; Branchwood Ct; Wenwood Cir; Battlepine Ct; Deep Forest Cir; Kell Cir; Conecrest Ct; S Klein Circle Dr; Lemon Tree Cir; Fairway Ct; Butternut Ct; Woodlong Dr; Stonefir Ct; Shady Arbor Ct; Stoner Ct; Vera Jean Ct; Votaw Ln; Dorsetshire Dr; Lakeworth Dr; Smokerock Ln; Springside Ln; Pardue Ct (Fardue Ct); Holder Forest Cir; Beau Geste Dr; Holder Forest Ct; Council Grove Ct; Cotton Run Ct; Logwood Dr; Loggers Trail Ct; Brushy Ct; Previn Ct; Bayou Woods Dr; Hanus Cir; Coe Ct; Bluestem Dr; Blackjack Ct; Birchcroft Ct; Wagonwheel Cir; Stonehearth Ln; Randon Rd; Holly View Cir; Athlone Ct; Vinewood Cir; Ball Park Ln; Michelle Ct; Langfield Ct; Dolben Ct (Dolben Cir).
Railroad features: Chicago Rock Island and Pacific RR; Burlington Northern RR.
Other features: White Oak Byu.
Other features: Vogel Crk.
Other features: Cole Crk.
Greater Inwood neighborhood detailed profile
Area: 6.680 square miles
Population: 25,865
Population density:
| Greater Inwood: | 3,872 people per square mile |
| Houston: | 3,947 people per square mile |
Median household income in 2021:
| Greater Inwood: | $54,941 |
| Houston: | $55,499 |
Median rent in in 2021:
| Greater Inwood: | $937 |
| Houston: | $974 |
Male vs Females
| Males: | 12,176 |
| Females: | 13,689 |
Median age
| Males: | 34.6 years |
| Females: | 37.8 years |
Housing prices:
Average estimated value of detached houses in 2021 (78.6% of all units):
| Greater Inwood: | $156,987 |
| Houston: | $304,685 |
Average estimated value of townhouses or other attached units in 2021 (15.9% of all units):
| This neighborhood: | $109,656 |
| city: | $305,463 |
Average estimated '21 value of housing units in 5-or-more-unit structures (7.7% of all units):
| Greater Inwood: | $59,816 |
| Houston: | $227,414 |
Most popular occupations of males: management occupations (except farmers) (15.0%); sales and office occupations (12.9%); construction, extraction, and maintenance occupations (12.4%); material moving occupations (12.2%); production occupations (10.2%); service occupations (8.5%); transportation occupations (5.9%)
Most popular occupations of females: sales and office occupations (30.7%); service occupations (20.8%); management occupations (except farmers) (9.5%); education, training, and library occupations (7.2%); business and financial operations occupations (6.3%); healthcare practitioners and technical occupations (5.4%); material moving occupations (4.9%)
Roads and streets: N Houston Rosslyn Rd; Antoine Dr; W Little York Rd; W Gulf Bank Rd; W Tidwell Rd; T C Jester Blvd; Victory Dr; Alabonson Rd; Log Hollow Dr; Deihl Rd; Long Creek Ln; Cypress Grove Ln; Maple Tree Dr; Arncliffe Dr; Woodsman Trl; Streamside Dr; Hollister St; Mayfield Oaks Ln (R V Mayfield Dr); Lemon Tree Ln; Railhead Ln; Athlone Dr; Woodfern Dr; Holly View Dr; Holder Forest Dr; Vanwood St; Deep Forest Dr (Thousand Oaks Cir); Bingle Rd; Bent Bough Ln; Chateau Forest Dr; Cherry Forest Dr; Green Lawn Dr; Lumber Jack Dr; Deanwood St; Winding Way Dr; Black Locust Dr; Council Grove Ln; Maple Hill Dr; Trappers Forest Dr; Kindletree Dr; Sawmill Trl; Yellow Pine Dr; Elmcrest Dr; Vogel Rd; de Soto St; Lumberdale Rd; Badger Forest Dr; Shady Arbor Ln; Langfield Rd; Sheraton Oaks Dr; Williams St; Stone Brook Ln; Hannon Dr; Jaywood Dr (Jaywood St); Landwood Dr; Golden Spike Ln; Gum Grove Ln; Burlington North Dr; Tall Pines Dr; Green Falls Dr; Inwood West Dr; Saratoga Dr; Rolling Mill Dr; White Fir Dr; Black Maple Ln; Bayou Forest Dr; Green Terrace Ln; Brush Wood Dr; W Sunforest Dr; Wagonwheel Ln; Wild Basin Dr; French Chateau Dr; Eblen Dr; Lautrec Dr; Mosewood St; Villa Glen Dr; Storm Creek Dr; Darkwood Dr; Scenic Green Dr; Woodland Trails Dr; Guywood St; West Rd; Oaknut Dr; Hibernia Dr; Brookstone Dr; Droddy St; Littleberry Rd; Birchtree Forest Dr; Inwood Shadows St; Deadwood Dr; Breezeway St; Hidden Arbor Ln; Casablanca Dr; Tall Willow Dr; Battlewood Dr; High Mountain Dr; Gage St; Oak Cove Dr; Shady Corners Ln; Arbor Wood Dr; Cold Lake Dr; Lost Forest Dr; Moss Glenn Ln; Salge Dr; Inwood Park Dr; Vernwood St; Milda Dr; Deirdre Anne Dr; Abinger Ln; Acorn Forest Dr; Stone Village Ln; Pine Ridge Ln; Jadewood Dr; Majestic Oaks Dr; Oak Arbor Dr; Shingle Oak Ln; Cherry Oak Ln; Rocktree Dr; Ash Oak Dr; Stonegate Dr; Bent Branch Dr; Oak Bay Dr; Vera Jean Dr; Kellwood Dr; Greenway Ln (Donwhite Ln); Arbor Oak Dr; Par Four Dr; Walkers Forest Dr; Oak Bough Dr; Blackjack Ln; King Post Dr (King Post St); Mc Kinley Ln; Plum Grove Ln; Lawn Ln; Silver Chalice Dr; Twisting Vine Ln; Ridge Oak Dr; Fairwood Dr; Bayou Vista Dr; Birchcroft Dr; Battlecreek Dr; Garsee Dr; Zimmermann Dr; Ellington St; N Haven Dr; Inwood Hollow Ln; Woodcamp Dr; Alejo Dr; Barbados Dr; Chun Ln; Deepcreek Ln; Caris St; Statler Dr; Red Fir Dr; Silver Leaf Ln; Turfwood Ln; Larkmeadow Dr; Abba Wood; Oak Pass Dr; Ashmole Ln; Draco St; Pine Moss Dr; Alperton Dr; Pine Burr Ln; Roaring Point Dr; Breen Dr; Challie Ln; Wild Hollow Ln; Goodale Dr; Shady Grove Ln; Wishing Well Ln; Cherry Oak Cir; Sardis Ln; Francis Marion Dr; Prairie Mist St; Water Leaf Ln; Lonesome Bayou Ln; Getty Rd; Battlepine Dr; Battleoak Dr; Gauguin Dr; Leaning Oak Dr; Menwood Cir; Vega St (Vega Dr); Shady Moss Ln; Hollister Dr; Village Forest Ct; Lost Trl St; N Galayda St; Strawbridge Ln; Almington Ln; Kell Dr; Barbarella Ct; Brook Run Ln; Oak Thicket Dr; Athlone; Bateman Ln; Bolivia Blvd; Long Leaf Dr; Pirtlewood Cir; Alperton; Bayou Oaks Dr; Inwood Forest Dr; Misty Trl; Cedar Top Dr; Hearthwood Dr; Vinewood Dr; Draco; Brabant Ct; Brookfir Ln; Long Creek Ct; Gallant Forest Dr; Wray Ct; Pine Vista Ln; Branchwood Ct; Wenwood Cir; Battlepine Ct; Deep Forest Cir; Kell Cir; Conecrest Ct; S Klein Circle Dr; Lemon Tree Cir; Fairway Ct; Butternut Ct; Woodlong Dr; Stonefir Ct; Shady Arbor Ct; Stoner Ct; Vera Jean Ct; Votaw Ln; Dorsetshire Dr; Lakeworth Dr; Smokerock Ln; Springside Ln; Pardue Ct (Fardue Ct); Holder Forest Cir; Beau Geste Dr; Holder Forest Ct; Council Grove Ct; Cotton Run Ct; Logwood Dr; Loggers Trail Ct; Brushy Ct; Previn Ct; Bayou Woods Dr; Hanus Cir; Coe Ct; Bluestem Dr; Blackjack Ct; Birchcroft Ct; Wagonwheel Cir; Stonehearth Ln; Randon Rd; Holly View Cir; Athlone Ct; Vinewood Cir; Ball Park Ln; Michelle Ct; Langfield Ct; Dolben Ct (Dolben Cir).
Railroad features: Chicago Rock Island and Pacific RR; Burlington Northern RR.
Other features: White Oak Byu.
Other features: Vogel Crk.
Other features: Cole Crk.
Greater Inwood neighborhood detailed profile
Greenspoint neighborhood in Houston statistics: (Find on map)
Area: 7.086 square miles
Population: 13,376
Population density:
Median household income in 2021:
Median rent in in 2021:
Male vs Females
Median age
Average estimated value of detached houses in 2021 (23.7% of all units):
Most popular occupations of males: service occupations (21.6%); production occupations (17.7%); construction, extraction, and maintenance occupations (16.5%); sales and office occupations (10.2%); transportation occupations (6.9%); material moving occupations (4.9%); management occupations (except farmers) (4.7%)
Most popular occupations of females: service occupations (41.5%); sales and office occupations (32.0%); education, training, and library occupations (6.1%); transportation occupations (5.5%); arts, design, entertainment, sports, and media occupations (5.3%); management occupations (except farmers) (2.8%); healthcare practitioners and technical occupations (2.3%)
Limited-access highways (interstate or state) in this neighborhood: Ih 45-Hov Fwy (I- 45).
Highways in this neighborhood: Sam Houston Pkwy (Beltway 8, State Loop 8); W Mount Houston Rd (State Hwy 249).
Roads and streets: Greens Pkwy; Imperial Valley Dr; FM 525 (Aldine Bender Rd); Kuykendahl Rd; Airline Dr; Benmar Dr; Gears Rd; W Hardy Rd; Greens Rd; Northborough Dr; Ella Blvd; West Rd; Northchase Dr; Old Creek Rd; W Greens Rd (Gears Loop); W Rankin Rd; Coach Lamp Ln; Greenspoint Dr; County Fair Dr; Grand Plaza Dr; Chipman Ln; Cotillion Dr; Seminar Dr; Goodson Dr; Dogwood Tree St; Coach Rd; Rushcreek Dr; Buckboard Dr; la Fonda Dr; Casa Grande Dr; Northpoint Dr; Hardwicke Rd; Greens Crossing Blvd; Sulky Trail St; Wayforest Dr; Greensmark Dr; Atrium Dr; Langwick Dr; Glazebrook Dr; Mill Stream Ln; Hedgecroft Dr; Briarwillow St; Spence Rd; Woodson Rd; San Fernando Dr; San Miguel Ln; W Greens Rd; Demontrond St; Kaler Rd; Fallbrook Dr; la Jolla Ln; Wagon Rd; Plaza Verde Dr; Mc Leod Dr; Kenrick Dr; Dyna Dr; Merritt Ln; W Dyna Dr; Glenborough Dr; Elkins Rd; Wellman Ln; Saddlehorn Dr; Meadowfern Dr; Weil Pl; Ronan Rd; Rankin Rd; Kirkfield Ln; Jove St; Partridge Ln; Whitehall Dr; W Goodson Dr; Estrellita Dr; Bradfield Rd; Sharmon Rd; Green Plaza Dr; Little Fox Ln; Carl Ave; Greenbriar Plaza Dr; Nickerson Ln; Crown Park Dr; Rock House Rd; Mynor Wood Ln; Turney Dr; Eldon St; Buckle Ln; Sunnywood Dr; Ivy Creek Ln; Donna Dr; Oakhurst Green Dr; Greensgate Dr; Flowerfield Ln; Gillispie; Dawn Rd; Dewgrass Dr; Ronan Park Pl; Greenlow Dr; Rose Arbor Ln; Benmar St; Imperial Plaza Dr; Greenbend; Tonya Dr; Lyngrove Dr; Loch Raven Ln; Westbrook Dr; Sunshine Bay Dr; Forest Edge Dr; la Jolla Cir; Imperial Valley Ct; Greenspoint Park Dr; Frazer Ln; Knobcrest Dr; Blue Ash Dr; Sweetwater Ln; Rexford Dr; Kenlea Ln; Ellan Blvd; Fall Lake Rd; Lillja Rd; Helms Rd; Sulky Trail Ct; Coach Lamp Ct; Sunshine Bay Ct.
Railroad features: Union Pacific RR.
Other features: Greens Byu; Halls Byu; North Fork Greens Ba; North Fork Greens Byu.
Greenspoint neighborhood detailed profile
Area: 7.086 square miles
Population: 13,376
Population density:
| Greenspoint: | 1,888 people per square mile |
| Houston: | 3,947 people per square mile |
Median household income in 2021:
| Greenspoint: | $42,353 |
| Houston: | $55,499 |
Median rent in in 2021:
| Greenspoint: | $751 |
| Houston: | $974 |
Male vs Females
| Males: | 6,144 |
| Females: | 7,231 |
Median age
| Males: | 30.4 years |
| Females: | 30.6 years |
Average estimated value of detached houses in 2021 (23.7% of all units):
| Greenspoint: | $128,669 |
| Houston: | $304,685 |
Most popular occupations of males: service occupations (21.6%); production occupations (17.7%); construction, extraction, and maintenance occupations (16.5%); sales and office occupations (10.2%); transportation occupations (6.9%); material moving occupations (4.9%); management occupations (except farmers) (4.7%)
Most popular occupations of females: service occupations (41.5%); sales and office occupations (32.0%); education, training, and library occupations (6.1%); transportation occupations (5.5%); arts, design, entertainment, sports, and media occupations (5.3%); management occupations (except farmers) (2.8%); healthcare practitioners and technical occupations (2.3%)
Limited-access highways (interstate or state) in this neighborhood: Ih 45-Hov Fwy (I- 45).
Highways in this neighborhood: Sam Houston Pkwy (Beltway 8, State Loop 8); W Mount Houston Rd (State Hwy 249).
Roads and streets: Greens Pkwy; Imperial Valley Dr; FM 525 (Aldine Bender Rd); Kuykendahl Rd; Airline Dr; Benmar Dr; Gears Rd; W Hardy Rd; Greens Rd; Northborough Dr; Ella Blvd; West Rd; Northchase Dr; Old Creek Rd; W Greens Rd (Gears Loop); W Rankin Rd; Coach Lamp Ln; Greenspoint Dr; County Fair Dr; Grand Plaza Dr; Chipman Ln; Cotillion Dr; Seminar Dr; Goodson Dr; Dogwood Tree St; Coach Rd; Rushcreek Dr; Buckboard Dr; la Fonda Dr; Casa Grande Dr; Northpoint Dr; Hardwicke Rd; Greens Crossing Blvd; Sulky Trail St; Wayforest Dr; Greensmark Dr; Atrium Dr; Langwick Dr; Glazebrook Dr; Mill Stream Ln; Hedgecroft Dr; Briarwillow St; Spence Rd; Woodson Rd; San Fernando Dr; San Miguel Ln; W Greens Rd; Demontrond St; Kaler Rd; Fallbrook Dr; la Jolla Ln; Wagon Rd; Plaza Verde Dr; Mc Leod Dr; Kenrick Dr; Dyna Dr; Merritt Ln; W Dyna Dr; Glenborough Dr; Elkins Rd; Wellman Ln; Saddlehorn Dr; Meadowfern Dr; Weil Pl; Ronan Rd; Rankin Rd; Kirkfield Ln; Jove St; Partridge Ln; Whitehall Dr; W Goodson Dr; Estrellita Dr; Bradfield Rd; Sharmon Rd; Green Plaza Dr; Little Fox Ln; Carl Ave; Greenbriar Plaza Dr; Nickerson Ln; Crown Park Dr; Rock House Rd; Mynor Wood Ln; Turney Dr; Eldon St; Buckle Ln; Sunnywood Dr; Ivy Creek Ln; Donna Dr; Oakhurst Green Dr; Greensgate Dr; Flowerfield Ln; Gillispie; Dawn Rd; Dewgrass Dr; Ronan Park Pl; Greenlow Dr; Rose Arbor Ln; Benmar St; Imperial Plaza Dr; Greenbend; Tonya Dr; Lyngrove Dr; Loch Raven Ln; Westbrook Dr; Sunshine Bay Dr; Forest Edge Dr; la Jolla Cir; Imperial Valley Ct; Greenspoint Park Dr; Frazer Ln; Knobcrest Dr; Blue Ash Dr; Sweetwater Ln; Rexford Dr; Kenlea Ln; Ellan Blvd; Fall Lake Rd; Lillja Rd; Helms Rd; Sulky Trail Ct; Coach Lamp Ct; Sunshine Bay Ct.
Railroad features: Union Pacific RR.
Other features: Greens Byu; Halls Byu; North Fork Greens Ba; North Fork Greens Byu.
Greenspoint neighborhood detailed profile
Grogan's Mill neighborhood in Houston statistics: (Find on map)
Area: 10.409 square miles
Population: 31,087
Population density:
Median household income in 2021:
Median rent in in 2021:
Male vs Females
Median age
Housing prices:
Average estimated value of detached houses in 2021 (67.6% of all units):
Average estimated value of townhouses or other attached units in 2021 (9.4% of all units):
Average estimated '21 value of housing units in 5-or-more-unit structures (11.2% of all units):
Average estimated value of mobile home in 2021 (4.9% of all units):
Most popular occupations of males: transportation occupations (22.4%); architecture and engineering occupations (17.2%); sales and office occupations (13.4%); computer and mathematical occupations (9.7%); management occupations (except farmers) (9.5%); construction, extraction, and maintenance occupations (5.7%); life, physical, and social science occupations (5.1%)
Most popular occupations of females: sales and office occupations (38.6%); management occupations (except farmers) (17.4%); business and financial operations occupations (13.7%); education, training, and library occupations (6.3%); transportation occupations (6.1%); service occupations (4.9%); life, physical, and social science occupations (4.5%)
Other features: Spring Crk.
Limited-access highways (interstate or state) in this neighborhood: I- 45.
Roads and streets: Sawdust Rd; N Millbend Dr; Grogans Mill Rd; Glen Loch Dr; Grogans Point Rd; S Millbend Dr; Pruitt Rd; Woodlands Pkwy; Nursery Rd; Budde Rd; Spring Creek Dr; Sawmill Rd; S Tranquil Path Dr; Red Sable Dr; McDonald Rd (Mc Donald Rd); Timber Lakes Dr; Oakridge Dr; Dawnwood Dr; N Red Cedar Cir; Wilderness Rd; Valerie Ln; Willie Way; N High Oaks Cir; Crossvine Cir; Spreading Oaks Ln; N Tranquil Path Dr (N Tranquil Path); Kentwood Dr; Fernridge Dr; Acorn Oak St; Hickory Hollow Rd; Northgate Dr; E Red Cedar Cir; Timberwild St; Long Shadows St; Shadowcrest Ln; Borough Park Dr; Nodding Pines St; Maple Branch St; Cokeberry St; Huntsmans Horn Cir; Golden Rd; Gary Ln; Crystal Lake Ln; Cannon Ball Dr; Timberline Dr; S Deerfoot Cir; Wildwood Forest Dr; Autumnwood Way; Broken Bough; S High Oaks Cir; N Timber Top Dr; Harper Ln; N Dreamweaver Cir; Greenhaven Dr; N Longspur Dr; Pine Canyon Dr; Doe Run Dr; Westridge Dr; S Park; Lake Ridge Bend; Blue Fox Rd; Rustling Pines St; Hidden Lake Rd; Woodstead Ct; S Watertree Ln; N Watertree Ln; Royal Oaks Dr; Hillock Woods; Pine Edge Dr; Red Sable Pt; Overlake Dr; Briar Rock Rd; E Settlers Way; S Timber Top Dr; Buckthorne Pl; Lake Lawn Dr; N Autumnwood Way; Marabou Pl; Hickory Hill Rd; N Royal Fern Dr; Hunters Hollow Dr; Firefall Ct; Falling Leaf Ln; Six Pines Rd (Six Pines Dr); Pine Canyon; Southgate Dr; W High Oaks Cir; Roaming Woods Ln; Misty Grove Cir; S Longspur Dr; E Timberwagon Cir; S Dreamweaver Cir; Brooktree Ln; Green Haven Dr; Eagle Ct; Brookflower Rd; Angel Leaf Rd; Dovie Dr; Wishbonebush Rd; Wild Ridge Dr; Woodhaven Wood Dr; Millpark Dr; Timber Mill St; N Brokenfern Dr; Elm Creek Dr; Cottonwood Cove Ln; Cartwright Rd; N Deerfoot Cir; Plumero Pl; Wyndemere Ln; Lazy Ln; Mill Point Pl; Bristlecone Trl; S Royal Fern Dr; Fernglen Dr; Wild Wind Pl; Maple Branch Dr; Ellwood St; W Settler's Way; Valley Wood Dr; S Wildwind Cir; N Wildwind Cir (W Wildwind Cir); S Red Cedar Cir; Champion Lake Dr; Berry Blossom Dr; N Logrun Cir; Dunloggin Ln (S Logrun Cir); Woodloch Forest Dr; Forest Glen St; Winterberry Pl; S Doe Run Dr; Halfmoon Ct; N Tranquil Path Dr; E Wildwind Cir; Berryfrost Ln; S Brokenfern Dr; Laurel Cherry Way; Lacey Oak Cir; Appomattox Dr; Meadow Rue St; Rolling Links Ct; Foxtail Pl; Brushwood Ct; Settler's Way; Shaker Ln E; Starlight Pl; Many Pines Rd; Chestnut Hill Ct; Lyrebird Dr; Wake Robin Ct; Wind Whisper Ct; Laughing Brook Ct; Buttonbush Ct; Gambrel Oak Pl; Cedarwing Ln; Crinkleroot Ct; Green Bough Ct; Coralvine Ct; W Timberwagon Cir; Moonvine Ct; Green Field Pl; Whisper Ln; Coldsprings Ct; W Timberspire Ct; Sawmill Grove Ln; Roaring Creek Dr (Roaring Creek); Wildewoods Way; Kittiwake Ct; Paintedcup Ct; Blackjack Oak Cir N; Scarlet Woods Ct; Wild Meadow Ct; Vinebrook Rd; Camberwell Ct; Pastoral Pond Cir; Watertree Ct; Chaparral Way; Shaker Ct W; Loblolly Ln; Night Hawk Pl; Watertree Cir; Lullaby Ln; S Elm Branch Pl; McDonald Ln; Rye St; Old Field Pl; S Mossrock; Wild Ginger Ct; Wood Way; Berryview Ct; Redbud Ridge Pl; Slashpine Pl; S Rain Forest Ct; Star Fern Pl; Rain Fern Ct; Rockfern Rd; S Summer Star Ct; Dew Fall Ct; S White Pebble Ct; Tulip Hill Ct; Echo St; Yellow Pine Ln; Willowherb Ct; Marsh Millet Ct; Shadow Brook Dr; Box Turtle Ln; Field Flower Ct; Painted Sunset; Rockfern Ct; Memory Ln; Hornbill Ct; Maystar Ct; Saddleleaf Pl; Grogans Park Dr; Starviolet St; Saddle Ridge; Sparkleberry; N Mossrock; Royal Oak Pl; S Drifting Leaf Ct; N Elm Branch Pl; Fawnlily St; Autumnwood Ct; Gun Oak Pl; Wood Scent Ct; Old Lantern Way; Rogue Creek St; Rambling Wood Ct; Timberjack Pl; Cokeberry Ct; Evening Song Ct; Roseling Rd; Auger Pl; W Settlers Way; Colony Wood Pl; Canyon Oak Pl; N Rockfern Ct; Many Oak Dr; Alder Pl; Volunteer Ln; S Brook Pebble Ct; Longstraw Pl; Treeridge Pl; Timberspire Ln; N Bristol Gate Pl; Chestnut Oak Pl; Thimbleberry Ct; Box Oak Pl; N Summer Star Ct; Country Forest Ct; N Rain Forest Ct; Valleywood Rd; Forest Glen Ct; Summersprig Rd; Night Song Ct; N Morningwood Ct; S Greenbud Ct; E Timberspire Ct; Sweetspire Pl; Moontide Cir (Noontide Cir); Birchbrook Ct (Birchwood Ct); Fairway Oaks Pl; Annes Ct; Rosewood Pl; Muskmallow Ct; Pecan Valley Cir; Bristlecone Pl; Tulipa St; Switchbud Pl; Barwood St; Gresak St; Rolling Links Ln; S Morningwood Ct; Bracken Fern Ct; Whisperwillow Pl; Bridal Oak Pl; N Greenbud Ct; Kino Ct; Crested Cloud Ct; N Drifting Leaf Ct; Starrush Ct; Cirrus Ct; Rock Oak Pl; Anne's Ct; Deerberry Ct; Blackjack Oak Cir S; Sawmill Grove Ct; Lilium Ct; Regal Oak; Grey Oak Pl; Dewthread; Wolly Bucket Pl; E Longspur Dr; Macaw St; Plover Ln; Pastoral Pond Ln; Firefall Ln; Misty Pt; Boxberry Ct; Cassowary Ln; Creek Forest Cir; S Bristol Gate Pl; Sandlily Ct; Blackjack Oak; Nutcracker Ln; Sparkleberry St; Raven Ridge Ln; Summersweet Pl; Woodhaven Wood Ct (Bush Oak Ln); Lakeside Creek Ct; Pinyon Pl; Woodhaven Wood Ct; Flowertuft Ct; Champion Lake Ct; N Hornbeam Pl; Crossvine Pl; Leisure Ln; Walnut Grove Cir; Sunbird Ct; Pine Acres Cir; Lacewing Pl; Hedgebell Ct; White Brush; Rolling Mill Ln; Ridgebrook Cir; Beaverhead Ct; Glory Bowce Ct; Fairway Okas Pl; Indian Cedar Ln; S Slash Pine Park; Clover Hills Cir; Sweetbeth Ct; Sparrow Hawk Ct; Breezin Ct; Robin Walk Ln; N Brook Pebble Ct; Roserush Ct; Brimstone Ct; N White Pebble Ct; Chatterbird; Beaverhead Cir; Blazing Star Ct; N Slash Pine Park; Yellowood Ct; Creek Forest Ln; Windgap Ct; Cedarshade Ln; Fawn Lilly Ct; Crested Jay Ln; Bell Bird Ct; Whistler Ct; Penguin Ct; Curwood Dr; Roaming Ln; Ruffin Ln; Blue Fox Ct; Fox Sparrow; Raccoon Ln; Heathcote Ct; Timberwagon Ct; Red Deer Ln; S Hornbeam Pl; Level Oak Pl; Cottonwood Cove; Laurel Oak Pl; Bayleaf Ln; Rain Walk Ct; Grogan Point Ct; Green Blade; Silktassela Dr; Wolfhound Ln; Boxberry; Lake Terrace Ct; Lynx Ln; Morning Glory Ln; Crested Tern Ct; Dunloggin Ln; Trestle Tree; Royal Tern Ln; Red Sable Pl; Woodchuck Ln; Woodlot Ct; Green Bower Ln; Palmer Way; Yellow Pine Cir; Tupila St; Elm Branch Ct; Silktassel Ln; Cannon Ball Cir; Alladdin Ln; Loggers Luck Pl; River Birch Ln; Songful Woods Pl; Deerfoot Ct; Red Sable Ct.
Other features: Panther Br; Spring Crk.
Grogan's Mill neighborhood detailed profile
Area: 10.409 square miles
Population: 31,087
Population density:
| Grogan's Mill (Village of Grogan's Mill): | 2,987 people per square mile |
| Houston: | 3,947 people per square mile |
Median household income in 2021:
| Grogan's Mill (Village of Grogan's Mill): | $105,185 |
| Houston: | $55,499 |
Median rent in in 2021:
| Grogan's Mill (Village of Grogan's Mill): | $1,287 |
| Houston: | $974 |
Male vs Females
| Males: | 16,218 |
| Females: | 14,869 |
Median age
| Males: | 32.2 years |
| Females: | 32.8 years |
Housing prices:
Average estimated value of detached houses in 2021 (67.6% of all units):
| Grogan's Mill (Village of Grogan's Mill): | $312,167 |
| Houston: | $304,685 |
Average estimated value of townhouses or other attached units in 2021 (9.4% of all units):
| This neighborhood: | $667,485 |
| city: | $305,463 |
Average estimated '21 value of housing units in 5-or-more-unit structures (11.2% of all units):
| Grogan's Mill (Village of Grogan's Mill): | $489,076 |
| Houston: | $227,414 |
Average estimated value of mobile home in 2021 (4.9% of all units):
| Grogan's Mill (Village of Grogan's Mill): | $99,950 |
| Houston: | $60,006 |
Most popular occupations of males: transportation occupations (22.4%); architecture and engineering occupations (17.2%); sales and office occupations (13.4%); computer and mathematical occupations (9.7%); management occupations (except farmers) (9.5%); construction, extraction, and maintenance occupations (5.7%); life, physical, and social science occupations (5.1%)
Most popular occupations of females: sales and office occupations (38.6%); management occupations (except farmers) (17.4%); business and financial operations occupations (13.7%); education, training, and library occupations (6.3%); transportation occupations (6.1%); service occupations (4.9%); life, physical, and social science occupations (4.5%)
Other features: Spring Crk.
Limited-access highways (interstate or state) in this neighborhood: I- 45.
Roads and streets: Sawdust Rd; N Millbend Dr; Grogans Mill Rd; Glen Loch Dr; Grogans Point Rd; S Millbend Dr; Pruitt Rd; Woodlands Pkwy; Nursery Rd; Budde Rd; Spring Creek Dr; Sawmill Rd; S Tranquil Path Dr; Red Sable Dr; McDonald Rd (Mc Donald Rd); Timber Lakes Dr; Oakridge Dr; Dawnwood Dr; N Red Cedar Cir; Wilderness Rd; Valerie Ln; Willie Way; N High Oaks Cir; Crossvine Cir; Spreading Oaks Ln; N Tranquil Path Dr (N Tranquil Path); Kentwood Dr; Fernridge Dr; Acorn Oak St; Hickory Hollow Rd; Northgate Dr; E Red Cedar Cir; Timberwild St; Long Shadows St; Shadowcrest Ln; Borough Park Dr; Nodding Pines St; Maple Branch St; Cokeberry St; Huntsmans Horn Cir; Golden Rd; Gary Ln; Crystal Lake Ln; Cannon Ball Dr; Timberline Dr; S Deerfoot Cir; Wildwood Forest Dr; Autumnwood Way; Broken Bough; S High Oaks Cir; N Timber Top Dr; Harper Ln; N Dreamweaver Cir; Greenhaven Dr; N Longspur Dr; Pine Canyon Dr; Doe Run Dr; Westridge Dr; S Park; Lake Ridge Bend; Blue Fox Rd; Rustling Pines St; Hidden Lake Rd; Woodstead Ct; S Watertree Ln; N Watertree Ln; Royal Oaks Dr; Hillock Woods; Pine Edge Dr; Red Sable Pt; Overlake Dr; Briar Rock Rd; E Settlers Way; S Timber Top Dr; Buckthorne Pl; Lake Lawn Dr; N Autumnwood Way; Marabou Pl; Hickory Hill Rd; N Royal Fern Dr; Hunters Hollow Dr; Firefall Ct; Falling Leaf Ln; Six Pines Rd (Six Pines Dr); Pine Canyon; Southgate Dr; W High Oaks Cir; Roaming Woods Ln; Misty Grove Cir; S Longspur Dr; E Timberwagon Cir; S Dreamweaver Cir; Brooktree Ln; Green Haven Dr; Eagle Ct; Brookflower Rd; Angel Leaf Rd; Dovie Dr; Wishbonebush Rd; Wild Ridge Dr; Woodhaven Wood Dr; Millpark Dr; Timber Mill St; N Brokenfern Dr; Elm Creek Dr; Cottonwood Cove Ln; Cartwright Rd; N Deerfoot Cir; Plumero Pl; Wyndemere Ln; Lazy Ln; Mill Point Pl; Bristlecone Trl; S Royal Fern Dr; Fernglen Dr; Wild Wind Pl; Maple Branch Dr; Ellwood St; W Settler's Way; Valley Wood Dr; S Wildwind Cir; N Wildwind Cir (W Wildwind Cir); S Red Cedar Cir; Champion Lake Dr; Berry Blossom Dr; N Logrun Cir; Dunloggin Ln (S Logrun Cir); Woodloch Forest Dr; Forest Glen St; Winterberry Pl; S Doe Run Dr; Halfmoon Ct; N Tranquil Path Dr; E Wildwind Cir; Berryfrost Ln; S Brokenfern Dr; Laurel Cherry Way; Lacey Oak Cir; Appomattox Dr; Meadow Rue St; Rolling Links Ct; Foxtail Pl; Brushwood Ct; Settler's Way; Shaker Ln E; Starlight Pl; Many Pines Rd; Chestnut Hill Ct; Lyrebird Dr; Wake Robin Ct; Wind Whisper Ct; Laughing Brook Ct; Buttonbush Ct; Gambrel Oak Pl; Cedarwing Ln; Crinkleroot Ct; Green Bough Ct; Coralvine Ct; W Timberwagon Cir; Moonvine Ct; Green Field Pl; Whisper Ln; Coldsprings Ct; W Timberspire Ct; Sawmill Grove Ln; Roaring Creek Dr (Roaring Creek); Wildewoods Way; Kittiwake Ct; Paintedcup Ct; Blackjack Oak Cir N; Scarlet Woods Ct; Wild Meadow Ct; Vinebrook Rd; Camberwell Ct; Pastoral Pond Cir; Watertree Ct; Chaparral Way; Shaker Ct W; Loblolly Ln; Night Hawk Pl; Watertree Cir; Lullaby Ln; S Elm Branch Pl; McDonald Ln; Rye St; Old Field Pl; S Mossrock; Wild Ginger Ct; Wood Way; Berryview Ct; Redbud Ridge Pl; Slashpine Pl; S Rain Forest Ct; Star Fern Pl; Rain Fern Ct; Rockfern Rd; S Summer Star Ct; Dew Fall Ct; S White Pebble Ct; Tulip Hill Ct; Echo St; Yellow Pine Ln; Willowherb Ct; Marsh Millet Ct; Shadow Brook Dr; Box Turtle Ln; Field Flower Ct; Painted Sunset; Rockfern Ct; Memory Ln; Hornbill Ct; Maystar Ct; Saddleleaf Pl; Grogans Park Dr; Starviolet St; Saddle Ridge; Sparkleberry; N Mossrock; Royal Oak Pl; S Drifting Leaf Ct; N Elm Branch Pl; Fawnlily St; Autumnwood Ct; Gun Oak Pl; Wood Scent Ct; Old Lantern Way; Rogue Creek St; Rambling Wood Ct; Timberjack Pl; Cokeberry Ct; Evening Song Ct; Roseling Rd; Auger Pl; W Settlers Way; Colony Wood Pl; Canyon Oak Pl; N Rockfern Ct; Many Oak Dr; Alder Pl; Volunteer Ln; S Brook Pebble Ct; Longstraw Pl; Treeridge Pl; Timberspire Ln; N Bristol Gate Pl; Chestnut Oak Pl; Thimbleberry Ct; Box Oak Pl; N Summer Star Ct; Country Forest Ct; N Rain Forest Ct; Valleywood Rd; Forest Glen Ct; Summersprig Rd; Night Song Ct; N Morningwood Ct; S Greenbud Ct; E Timberspire Ct; Sweetspire Pl; Moontide Cir (Noontide Cir); Birchbrook Ct (Birchwood Ct); Fairway Oaks Pl; Annes Ct; Rosewood Pl; Muskmallow Ct; Pecan Valley Cir; Bristlecone Pl; Tulipa St; Switchbud Pl; Barwood St; Gresak St; Rolling Links Ln; S Morningwood Ct; Bracken Fern Ct; Whisperwillow Pl; Bridal Oak Pl; N Greenbud Ct; Kino Ct; Crested Cloud Ct; N Drifting Leaf Ct; Starrush Ct; Cirrus Ct; Rock Oak Pl; Anne's Ct; Deerberry Ct; Blackjack Oak Cir S; Sawmill Grove Ct; Lilium Ct; Regal Oak; Grey Oak Pl; Dewthread; Wolly Bucket Pl; E Longspur Dr; Macaw St; Plover Ln; Pastoral Pond Ln; Firefall Ln; Misty Pt; Boxberry Ct; Cassowary Ln; Creek Forest Cir; S Bristol Gate Pl; Sandlily Ct; Blackjack Oak; Nutcracker Ln; Sparkleberry St; Raven Ridge Ln; Summersweet Pl; Woodhaven Wood Ct (Bush Oak Ln); Lakeside Creek Ct; Pinyon Pl; Woodhaven Wood Ct; Flowertuft Ct; Champion Lake Ct; N Hornbeam Pl; Crossvine Pl; Leisure Ln; Walnut Grove Cir; Sunbird Ct; Pine Acres Cir; Lacewing Pl; Hedgebell Ct; White Brush; Rolling Mill Ln; Ridgebrook Cir; Beaverhead Ct; Glory Bowce Ct; Fairway Okas Pl; Indian Cedar Ln; S Slash Pine Park; Clover Hills Cir; Sweetbeth Ct; Sparrow Hawk Ct; Breezin Ct; Robin Walk Ln; N Brook Pebble Ct; Roserush Ct; Brimstone Ct; N White Pebble Ct; Chatterbird; Beaverhead Cir; Blazing Star Ct; N Slash Pine Park; Yellowood Ct; Creek Forest Ln; Windgap Ct; Cedarshade Ln; Fawn Lilly Ct; Crested Jay Ln; Bell Bird Ct; Whistler Ct; Penguin Ct; Curwood Dr; Roaming Ln; Ruffin Ln; Blue Fox Ct; Fox Sparrow; Raccoon Ln; Heathcote Ct; Timberwagon Ct; Red Deer Ln; S Hornbeam Pl; Level Oak Pl; Cottonwood Cove; Laurel Oak Pl; Bayleaf Ln; Rain Walk Ct; Grogan Point Ct; Green Blade; Silktassela Dr; Wolfhound Ln; Boxberry; Lake Terrace Ct; Lynx Ln; Morning Glory Ln; Crested Tern Ct; Dunloggin Ln; Trestle Tree; Royal Tern Ln; Red Sable Pl; Woodchuck Ln; Woodlot Ct; Green Bower Ln; Palmer Way; Yellow Pine Cir; Tupila St; Elm Branch Ct; Silktassel Ln; Cannon Ball Cir; Alladdin Ln; Loggers Luck Pl; River Birch Ln; Songful Woods Pl; Deerfoot Ct; Red Sable Ct.
Other features: Panther Br; Spring Crk.
Grogan's Mill neighborhood detailed profile
Gulfgate neighborhood in Houston statistics: (Find on map)
Area: 2.765 square miles
Population: 13,861
Population density:
Median household income in 2021:
Median rent in in 2021:
Male vs Females
Median age
Average estimated value of detached houses in 2021 (57.0% of all units):
Most popular occupations of males: construction, extraction, and maintenance occupations (29.0%); production occupations (15.6%); sales and office occupations (14.3%); material moving occupations (11.5%); service occupations (7.4%); transportation occupations (6.6%); computer and mathematical occupations (4.3%)
Most popular occupations of females: sales and office occupations (34.5%); service occupations (24.7%); production occupations (9.7%); management occupations (except farmers) (7.9%); business and financial operations occupations (7.1%); education, training, and library occupations (5.8%); construction, extraction, and maintenance occupations (5.4%)
Limited-access highways (interstate or state) in this neighborhood: I- 45 (Gulf Fwy); I- 610 (S Loop Fwy).
Highways in this neighborhood: US Hwy 90 Alt (Old Spanish Trl); Reveille Rd (State Hwy 35); State Hwy 35 (Reveille St, Reville St).
Roads and streets: Telephone Rd; Griggs Rd; S Wayside Dr; Brock St; Erby Ave (Erby St); Broad St; Carrolton St; Winkler Dr; Wheeler St; Duval St; Produce Row; Lidstone St; Delafield St; Pineway Blvd; Askew St; Jean St; Des Jardines St; Munger St; Pecan St; Golfcrest Blvd; Woodridge Dr; Glenmore Dr; Hansford Ave; Knoblock St; Lazywood Ln; Real St; Antoinette St; Minglewood Blvd; Sue Ellen St; Wynona St; Grimes St; Stillwell St; Huey St; Roe Dr; Juliet St; Oakcliff St (Oak Cliff Ave); Penwood Way; Hasbrook; Schlumberger St; Brookhill Dr; Stratton St; Burgundy Ln; Renshaw St; Wilshire St; Craigmont St; Village Way; Beatty St; Collier St; Plum Creek Ln; Cumberland St; Long Dr; Buford St; Gould St; Gulf Terminal Dr; Slumber Ln; Gulf Frwy Svc Rd; Sterling Center Ln (Dumble St); Canada Dry St; Sanders St; Black St; Pitzlin St; Fay St; Auburndale St; Sutherland St; Songwood St; Landa Ln; Hasbrook St; Burwell; Katherine St; Inez St; Maxwell Ln; Flowers St; Markley St; Buelow St; Graham Ln; Trailwood Dr; Willowood Ln; Vaughn St; Mossford Dr; Groveway Dr; Lapas Dr; Lipscomb St; Tooke St; Hansford; Gwinn; Deepwood Dr; Hicksfield; Gulf Central Dr; Caldwell; Doney St; Sylvania St; Starway St; Hood St; Gulfcrest St; Leonard St; Faucette St; Maxwell; Lull; Gulfcrest; Wayside Dr; Estes St; Hatwell St; Mackinson St; Schlumberger; Wayside.
Railroad features: at and Sf Rlwy; Southern Pacific RR.
Other features: Brays Byu; Plum Crk.
Gulfgate neighborhood detailed profile
Area: 2.765 square miles
Population: 13,861
Population density:
| Gulfgate (Pine Valley): | 5,012 people per square mile |
| Houston: | 3,947 people per square mile |
Median household income in 2021:
| Gulfgate (Pine Valley): | $45,152 |
| Houston: | $55,499 |
Median rent in in 2021:
| Gulfgate (Pine Valley): | $935 |
| Houston: | $974 |
Male vs Females
| Males: | 6,788 |
| Females: | 7,072 |
Median age
| Males: | 37.4 years |
| Females: | 30.8 years |
Average estimated value of detached houses in 2021 (57.0% of all units):
| Gulfgate (Pine Valley): | $116,071 |
| Houston: | $304,685 |
Most popular occupations of males: construction, extraction, and maintenance occupations (29.0%); production occupations (15.6%); sales and office occupations (14.3%); material moving occupations (11.5%); service occupations (7.4%); transportation occupations (6.6%); computer and mathematical occupations (4.3%)
Most popular occupations of females: sales and office occupations (34.5%); service occupations (24.7%); production occupations (9.7%); management occupations (except farmers) (7.9%); business and financial operations occupations (7.1%); education, training, and library occupations (5.8%); construction, extraction, and maintenance occupations (5.4%)
Limited-access highways (interstate or state) in this neighborhood: I- 45 (Gulf Fwy); I- 610 (S Loop Fwy).
Highways in this neighborhood: US Hwy 90 Alt (Old Spanish Trl); Reveille Rd (State Hwy 35); State Hwy 35 (Reveille St, Reville St).
Roads and streets: Telephone Rd; Griggs Rd; S Wayside Dr; Brock St; Erby Ave (Erby St); Broad St; Carrolton St; Winkler Dr; Wheeler St; Duval St; Produce Row; Lidstone St; Delafield St; Pineway Blvd; Askew St; Jean St; Des Jardines St; Munger St; Pecan St; Golfcrest Blvd; Woodridge Dr; Glenmore Dr; Hansford Ave; Knoblock St; Lazywood Ln; Real St; Antoinette St; Minglewood Blvd; Sue Ellen St; Wynona St; Grimes St; Stillwell St; Huey St; Roe Dr; Juliet St; Oakcliff St (Oak Cliff Ave); Penwood Way; Hasbrook; Schlumberger St; Brookhill Dr; Stratton St; Burgundy Ln; Renshaw St; Wilshire St; Craigmont St; Village Way; Beatty St; Collier St; Plum Creek Ln; Cumberland St; Long Dr; Buford St; Gould St; Gulf Terminal Dr; Slumber Ln; Gulf Frwy Svc Rd; Sterling Center Ln (Dumble St); Canada Dry St; Sanders St; Black St; Pitzlin St; Fay St; Auburndale St; Sutherland St; Songwood St; Landa Ln; Hasbrook St; Burwell; Katherine St; Inez St; Maxwell Ln; Flowers St; Markley St; Buelow St; Graham Ln; Trailwood Dr; Willowood Ln; Vaughn St; Mossford Dr; Groveway Dr; Lapas Dr; Lipscomb St; Tooke St; Hansford; Gwinn; Deepwood Dr; Hicksfield; Gulf Central Dr; Caldwell; Doney St; Sylvania St; Starway St; Hood St; Gulfcrest St; Leonard St; Faucette St; Maxwell; Lull; Gulfcrest; Wayside Dr; Estes St; Hatwell St; Mackinson St; Schlumberger; Wayside.
Railroad features: at and Sf Rlwy; Southern Pacific RR.
Other features: Brays Byu; Plum Crk.
Gulfgate neighborhood detailed profile
Gulfton neighborhood in Houston statistics: (Find on map)
Area: 2.790 square miles
Population: 32,050
Population density:
Median household income in 2021:
Median rent in in 2021:
Male vs Females
Median age
Housing prices:
Average estimated value of detached houses in 2021 (18.4% of all units):
Average estimated '21 value of housing units in 5-or-more-unit structures (7.1% of all units):
Most popular occupations of males: construction, extraction, and maintenance occupations (26.1%); transportation occupations (19.0%); sales and office occupations (18.6%); management occupations (except farmers) (10.3%); service occupations (7.8%); production occupations (7.2%); legal occupations (2.4%)
Most popular occupations of females: sales and office occupations (39.3%); service occupations (38.5%); education, training, and library occupations (10.3%); healthcare practitioners and technical occupations (3.4%); computer and mathematical occupations (2.4%); business and financial operations occupations (2.0%); management occupations (except farmers) (1.3%)
Highways in this neighborhood: US Hwy 59 (Southwest Fwy); US Hwy 59 (Hov US 59); US Hwy 59 (59-Hov).
Roads and streets: Glenmont Dr; Gulfton St (Gulfton Dr); Rampart St; Chimney Rock Rd; Renwick Dr; Alder Dr; Westpark Dr; Elm St; Clarewood Dr; Dashwood Dr (Dashwood St); Bissonnet St; Ashcroft Dr; Bellaire Blvd; Mullins Dr; Edgemoor Dr; Jessamine St; S Rice Ave; Royalton St; Atwell Dr (Atwell St); Evergreen St; Westward; Mapleridge St; Ashbrook Dr; Aspen St; Chetwood Dr; Moonmist Dr; de Moss Dr; High Star Dr; Hornwood Dr; Huisache St; Ferris Dr (6th St); Anderson St; S Renwick Dr; el Camino del Rey St; Green Ash Dr; Grand Lake St; Prestwood Dr; Hooton; Pine St; Hillcroft St (Hillcroft Ave); Parwill St; Atwell St; Palmetto St; Williams Court Ln; Chimney Rock Central Blvd; Fountain View Dr; Alethea Ln.
Railroad features: Southern Pacific RR.
Gulfton neighborhood detailed profile
Area: 2.790 square miles
Population: 32,050
Population density:
| Gulfton (Wesrmoreland Farms): | 11,488 people per square mile |
| Houston: | 3,947 people per square mile |
Median household income in 2021:
| Gulfton (Wesrmoreland Farms): | $155,707 |
| Houston: | $55,499 |
Median rent in in 2021:
| Gulfton (Wesrmoreland Farms): | $837 |
| Houston: | $974 |
Male vs Females
| Males: | 16,379 |
| Females: | 15,671 |
Median age
| Males: | 46.8 years |
| Females: | 43.5 years |
Housing prices:
Average estimated value of detached houses in 2021 (18.4% of all units):
| Gulfton (Wesrmoreland Farms): | $783,598 |
| Houston: | $304,685 |
Average estimated '21 value of housing units in 5-or-more-unit structures (7.1% of all units):
| Gulfton (Wesrmoreland Farms): | $87,279 |
| Houston: | $227,414 |
Most popular occupations of males: construction, extraction, and maintenance occupations (26.1%); transportation occupations (19.0%); sales and office occupations (18.6%); management occupations (except farmers) (10.3%); service occupations (7.8%); production occupations (7.2%); legal occupations (2.4%)
Most popular occupations of females: sales and office occupations (39.3%); service occupations (38.5%); education, training, and library occupations (10.3%); healthcare practitioners and technical occupations (3.4%); computer and mathematical occupations (2.4%); business and financial operations occupations (2.0%); management occupations (except farmers) (1.3%)
Highways in this neighborhood: US Hwy 59 (Southwest Fwy); US Hwy 59 (Hov US 59); US Hwy 59 (59-Hov).
Roads and streets: Glenmont Dr; Gulfton St (Gulfton Dr); Rampart St; Chimney Rock Rd; Renwick Dr; Alder Dr; Westpark Dr; Elm St; Clarewood Dr; Dashwood Dr (Dashwood St); Bissonnet St; Ashcroft Dr; Bellaire Blvd; Mullins Dr; Edgemoor Dr; Jessamine St; S Rice Ave; Royalton St; Atwell Dr (Atwell St); Evergreen St; Westward; Mapleridge St; Ashbrook Dr; Aspen St; Chetwood Dr; Moonmist Dr; de Moss Dr; High Star Dr; Hornwood Dr; Huisache St; Ferris Dr (6th St); Anderson St; S Renwick Dr; el Camino del Rey St; Green Ash Dr; Grand Lake St; Prestwood Dr; Hooton; Pine St; Hillcroft St (Hillcroft Ave); Parwill St; Atwell St; Palmetto St; Williams Court Ln; Chimney Rock Central Blvd; Fountain View Dr; Alethea Ln.
Railroad features: Southern Pacific RR.
Gulfton neighborhood detailed profile
Harrisburg neighborhood in Houston statistics: (Find on map)
Area: 2.586 square miles
Population: 5,335
Population density:
Median household income in 2021:
Median rent in in 2021:
Male vs Females
Median age
Average estimated value of detached houses in 2021 (66.4% of all units):
Most popular occupations of males: construction, extraction, and maintenance occupations (38.5%); service occupations (17.6%); transportation occupations (12.7%); sales and office occupations (8.7%); production occupations (4.6%); business and financial operations occupations (1.5%)
Most popular occupations of females: sales and office occupations (39.0%); service occupations (35.7%); production occupations (8.2%); management occupations (except farmers) (5.5%); legal occupations (4.8%); transportation occupations (2.4%); material moving occupations (2.3%)
Limited-access highways (interstate or state) in this neighborhood: E Loop Fwy (I- 610).
Highways in this neighborhood: State Hwy 225 (la Porte Fwy).
Roads and streets: Manchester St; Lawndale St; E Erath St; Broadway St; E Ave O; E Ave N; E Ave L; Medina St; Central St; Fennell St; E Ave K; E Magnolia St; E Ave P; la Porte Rd; Channelside St; Cypress St; E Ave J; E Elm St; Nueces St; John St; Gibbons St; Frio St; Leander St; 95th St; 93rd St; Lavaca St; Waller St; Concrete St; San Antonio St; 96th St; E Ave Q; Endor; 92nd St; E Ave I; Woodruff St; San Saba St; Sycamore St; E Ave H; E Ave R; Hebert St; Port Entrance; Becker St; Hockley St; S Main St; Hotchkiss St; Bisbee St; Boulder St; Reese St; 97th St; E Ave S; B; Roosevelt St; Leander; E St; North St; E Loop S Svc Rd; 2218 Rd; Parsons St; Kellogg St; C St; San Marcos St; Ave F (F St); C; A; Loop Fwy; Holland Ct.
Railroad features: Port Terminal RR; Southern Pacific RR; Union Pacific RR.
Other features: Sims Byu; Plum Crk; Brays Byu.
Harrisburg neighborhood detailed profile
Area: 2.586 square miles
Population: 5,335
Population density:
| Harrisburg (Manchester): | 2,063 people per square mile |
| Houston: | 3,947 people per square mile |
Median household income in 2021:
| Harrisburg (Manchester): | $48,908 |
| Houston: | $55,499 |
Median rent in in 2021:
| Harrisburg (Manchester): | $647 |
| Houston: | $974 |
Male vs Females
| Males: | 2,532 |
| Females: | 2,803 |
Median age
| Males: | 35.8 years |
| Females: | 31.5 years |
Average estimated value of detached houses in 2021 (66.4% of all units):
| Harrisburg (Manchester): | $106,885 |
| Houston: | $304,685 |
Most popular occupations of males: construction, extraction, and maintenance occupations (38.5%); service occupations (17.6%); transportation occupations (12.7%); sales and office occupations (8.7%); production occupations (4.6%); business and financial operations occupations (1.5%)
Most popular occupations of females: sales and office occupations (39.0%); service occupations (35.7%); production occupations (8.2%); management occupations (except farmers) (5.5%); legal occupations (4.8%); transportation occupations (2.4%); material moving occupations (2.3%)
Limited-access highways (interstate or state) in this neighborhood: E Loop Fwy (I- 610).
Highways in this neighborhood: State Hwy 225 (la Porte Fwy).
Roads and streets: Manchester St; Lawndale St; E Erath St; Broadway St; E Ave O; E Ave N; E Ave L; Medina St; Central St; Fennell St; E Ave K; E Magnolia St; E Ave P; la Porte Rd; Channelside St; Cypress St; E Ave J; E Elm St; Nueces St; John St; Gibbons St; Frio St; Leander St; 95th St; 93rd St; Lavaca St; Waller St; Concrete St; San Antonio St; 96th St; E Ave Q; Endor; 92nd St; E Ave I; Woodruff St; San Saba St; Sycamore St; E Ave H; E Ave R; Hebert St; Port Entrance; Becker St; Hockley St; S Main St; Hotchkiss St; Bisbee St; Boulder St; Reese St; 97th St; E Ave S; B; Roosevelt St; Leander; E St; North St; E Loop S Svc Rd; 2218 Rd; Parsons St; Kellogg St; C St; San Marcos St; Ave F (F St); C; A; Loop Fwy; Holland Ct.
Railroad features: Port Terminal RR; Southern Pacific RR; Union Pacific RR.
Other features: Sims Byu; Plum Crk; Brays Byu.
Harrisburg neighborhood detailed profile
Herman Park neighborhood in Houston statistics: (Find on map)
Area: 1.843 square miles
Highways in this neighborhood: US Hwy 90 Alt (Old Spanish Trl).
Roads and streets: Fannin St; FM 521 (Almeda Rd); S Main St (Main St); Holcombe Blvd; Hermann Loop Dr (Hermann Circle Dr); Golf Course Dr; N Macgregor Way; Staffordshire; Mixon Ave; S Macgregor Dr; S Braeswood Blvd; Bates; Outer Belt Dr; Cambridge St; Hermann Lake Dr; Bertner Ave (Bertner St); Hermann Dr; Zoo Cir Dr; Sheenan Ave; N Braeswood Blvd; William C Harvin Blvd; Moursund St; Selma St; Wyndale St; Cecil St; Ringess Ave; Braeswood Blvd; Shamrock Dr; Lamar Fleming St; Cortis; Herman Pressler; Carroll Dr (Carroll St); Taub Loop; St Agnes St; San Jacinto St; Carson Ct; Rosedale St; Concert Dr; Dreyfus St; Lyndon St; Cate Ter; John Freeman St; Richard W Johnson Ave; Lehall St; Taub Rd; Dixie Dr; M D Anderson St; Wilkins St; Swanson St; Canterbury St; Brunson St; Earle St; Caroline St; Hermann Lake Spr; C Frank Webb Plz (W Cullen St); Le Captain Ave; E Cullen St; Zoo Cir; Greenbriar St; Eaton St; Lauderdale St; Bellows Ln; Woodbury St; E Cullen Cir; W Cullen Cir; Princeton St; Old Main St; Devonshire Cres; Dryden Rd; University Blvd; Staffordshire Cres; Mac Gregor-Mac Gregor; Macgregor Way; William C Harvin; Baylor Plz; John Freeman; Payson St.
Other features: Brays Byu.
Herman Park neighborhood detailed profile
Hidden Valley neighborhood in Houston statistics: (Find on map)
Area: 1.053 square miles
Population: 4,528
Population density:
Median household income in 2021:
Median rent in in 2021:
Male vs Females
Median age
Average estimated value of detached houses in 2021 (97.1% of all units):
Most popular occupations of males: construction, extraction, and maintenance occupations (27.5%); production occupations (18.1%); material moving occupations (14.5%); sales and office occupations (12.7%); management occupations (except farmers) (6.4%); service occupations (5.5%); education, training, and library occupations (4.3%)
Most popular occupations of females: sales and office occupations (28.4%); service occupations (26.8%); production occupations (18.1%); education, training, and library occupations (9.9%); material moving occupations (7.2%); business and financial operations occupations (5.5%); arts, design, entertainment, sports, and media occupations (1.8%)
Limited-access highways (interstate or state) in this neighborhood: I- 45 (Ih 45-Hov Fwy).
Roads and streets: Sweetwater Ln; Hidden Valley Dr; Mosher Ln; Beaver Bend Rd; Twinbrooke Dr; Rainy River Dr; Helms Rd; W Gulf Bank Rd; Bunny Run Dr; Peach Spring Dr; Deer Trail Dr; Saddle Rock Dr; Sunnywood Dr; Glen Shadow Dr; Twin Falls Rd; Stuebner Airline Rd (Veterans Memorial Dr); W Nelda Rd; W Mierianne St; W Bertrand St; Glen Echo Dr; Dewalt St; Mitchell Rd (W Mitchell Rd); Rim Rock Dr; Hacker St; Rocky Mountain Dr; Indian River Dr; Lazy River Ln; Winding River Dr; Rocky Mount Dr; Still River Dr; Ver Lee Ct; Pebble Mesa Cir; Rutherford Ln; Valwood Ct; Circle Cove Ct.
Hidden Valley neighborhood detailed profile
Area: 1.053 square miles
Population: 4,528
Population density:
| Hidden Valley: | 4,299 people per square mile |
| Houston: | 3,947 people per square mile |
Median household income in 2021:
| Hidden Valley: | $61,857 |
| Houston: | $55,499 |
Median rent in in 2021:
| Hidden Valley: | $1,336 |
| Houston: | $974 |
Male vs Females
| Males: | 2,336 |
| Females: | 2,192 |
Median age
| Males: | 32.5 years |
| Females: | 33.5 years |
Average estimated value of detached houses in 2021 (97.1% of all units):
| Hidden Valley: | $128,563 |
| Houston: | $304,685 |
Most popular occupations of males: construction, extraction, and maintenance occupations (27.5%); production occupations (18.1%); material moving occupations (14.5%); sales and office occupations (12.7%); management occupations (except farmers) (6.4%); service occupations (5.5%); education, training, and library occupations (4.3%)
Most popular occupations of females: sales and office occupations (28.4%); service occupations (26.8%); production occupations (18.1%); education, training, and library occupations (9.9%); material moving occupations (7.2%); business and financial operations occupations (5.5%); arts, design, entertainment, sports, and media occupations (1.8%)
Limited-access highways (interstate or state) in this neighborhood: I- 45 (Ih 45-Hov Fwy).
Roads and streets: Sweetwater Ln; Hidden Valley Dr; Mosher Ln; Beaver Bend Rd; Twinbrooke Dr; Rainy River Dr; Helms Rd; W Gulf Bank Rd; Bunny Run Dr; Peach Spring Dr; Deer Trail Dr; Saddle Rock Dr; Sunnywood Dr; Glen Shadow Dr; Twin Falls Rd; Stuebner Airline Rd (Veterans Memorial Dr); W Nelda Rd; W Mierianne St; W Bertrand St; Glen Echo Dr; Dewalt St; Mitchell Rd (W Mitchell Rd); Rim Rock Dr; Hacker St; Rocky Mountain Dr; Indian River Dr; Lazy River Ln; Winding River Dr; Rocky Mount Dr; Still River Dr; Ver Lee Ct; Pebble Mesa Cir; Rutherford Ln; Valwood Ct; Circle Cove Ct.
Hidden Valley neighborhood detailed profile
Houston Heights neighborhood in Houston statistics: (Find on map)
Area: 2.698 square miles
Population: 15,994
Population density:
Median household income in 2021:
Median rent in in 2021:
Male vs Females
Median age
Housing prices:
Average estimated value of detached houses in 2021 (59.2% of all units):
Average estimated value of townhouses or other attached units in 2021 (8.2% of all units):
Most popular occupations of males: management occupations (except farmers) (25.4%); sales and office occupations (13.2%); architecture and engineering occupations (11.1%); business and financial operations occupations (10.9%); computer and mathematical occupations (9.0%); legal occupations (6.6%); construction, extraction, and maintenance occupations (4.2%)
Most popular occupations of females: management occupations (except farmers) (18.9%); sales and office occupations (12.5%); healthcare practitioners and technical occupations (11.4%); education, training, and library occupations (10.9%); business and financial operations occupations (10.2%); service occupations (9.9%); architecture and engineering occupations (8.2%)
Roads and streets: Rutland St; Yale St; Harvard St; Cortlandt St; Arlington St; Oxford St; Ashland St; Columbia St; Heights Blvd; Allston St; Nicholson St; N Durham Dr; Lawrence St; N Shepherd Dr; Waverly St; Tulane St; W 16th St; W 15th St; W 25th St; W 26th St; W 14th St; W 17th St; W 18th St; W 19th St; W 20th St; W 28th St; W 27th St; W 23rd St; W 22nd St; W 21st St; W 24th St; W 13th St; E 22nd St; E 14th St; E 13th St; E 10th St; E 8th St; E 9th St; E 12th St; E 7th St; E 20th St; White Oak Dr; E 18th St; E 16th St; E 15th St; W 12th St; W 8th St; W 10th St; W 9th St; W 11th St; E 4th St; E 5th St; E 11th St; Herkimer St; W 6th St; Nashua St; Alexander St; Prince St; Blair St; Dorothy St; Laird St; Singleton St; E 21st St; Brinkman St; W 10th 1/2 St (W 10 1/2 St); W 5th St; Blount St; E 13th 1/2 St; E 8th 1/2 St (E 8 1/2 St); Omar St; E 7 1/2 St; Gostic St; Dian St; Yale Ct; E 19th St; Hall Pl; Beverly St; Frasier St; 6th; E 5 1/2 St (E 5th 1/2 St); Granberry St; Rutland Pl; W 7th St; W 4th St; Algregg St; E 17th St; Bradshaw St; E 4 1/2 St (E 4th 1/2 St); Mossy Cir (Mosby Cir).
Railroad features: Union Pacific RR; Southern Pacific RR.
Houston Heights neighborhood detailed profile
Area: 2.698 square miles
Population: 15,994
Population density:
| Houston Heights (The Heights): | 5,928 people per square mile |
| Houston: | 3,947 people per square mile |
Median household income in 2021:
| Houston Heights (The Heights): | $161,349 |
| Houston: | $55,499 |
Median rent in in 2021:
| Houston Heights (The Heights): | $1,481 |
| Houston: | $974 |
Male vs Females
| Males: | 8,173 |
| Females: | 7,820 |
Median age
| Males: | 38.7 years |
| Females: | 36.8 years |
Housing prices:
Average estimated value of detached houses in 2021 (59.2% of all units):
| Houston Heights (The Heights): | $831,932 |
| Houston: | $304,685 |
Average estimated value of townhouses or other attached units in 2021 (8.2% of all units):
| This neighborhood: | $326,581 |
| city: | $305,463 |
Most popular occupations of males: management occupations (except farmers) (25.4%); sales and office occupations (13.2%); architecture and engineering occupations (11.1%); business and financial operations occupations (10.9%); computer and mathematical occupations (9.0%); legal occupations (6.6%); construction, extraction, and maintenance occupations (4.2%)
Most popular occupations of females: management occupations (except farmers) (18.9%); sales and office occupations (12.5%); healthcare practitioners and technical occupations (11.4%); education, training, and library occupations (10.9%); business and financial operations occupations (10.2%); service occupations (9.9%); architecture and engineering occupations (8.2%)
Roads and streets: Rutland St; Yale St; Harvard St; Cortlandt St; Arlington St; Oxford St; Ashland St; Columbia St; Heights Blvd; Allston St; Nicholson St; N Durham Dr; Lawrence St; N Shepherd Dr; Waverly St; Tulane St; W 16th St; W 15th St; W 25th St; W 26th St; W 14th St; W 17th St; W 18th St; W 19th St; W 20th St; W 28th St; W 27th St; W 23rd St; W 22nd St; W 21st St; W 24th St; W 13th St; E 22nd St; E 14th St; E 13th St; E 10th St; E 8th St; E 9th St; E 12th St; E 7th St; E 20th St; White Oak Dr; E 18th St; E 16th St; E 15th St; W 12th St; W 8th St; W 10th St; W 9th St; W 11th St; E 4th St; E 5th St; E 11th St; Herkimer St; W 6th St; Nashua St; Alexander St; Prince St; Blair St; Dorothy St; Laird St; Singleton St; E 21st St; Brinkman St; W 10th 1/2 St (W 10 1/2 St); W 5th St; Blount St; E 13th 1/2 St; E 8th 1/2 St (E 8 1/2 St); Omar St; E 7 1/2 St; Gostic St; Dian St; Yale Ct; E 19th St; Hall Pl; Beverly St; Frasier St; 6th; E 5 1/2 St (E 5th 1/2 St); Granberry St; Rutland Pl; W 7th St; W 4th St; Algregg St; E 17th St; Bradshaw St; E 4 1/2 St (E 4th 1/2 St); Mossy Cir (Mosby Cir).
Railroad features: Union Pacific RR; Southern Pacific RR.
Houston Heights neighborhood detailed profile
Huntwood neighborhood in Houston statistics: (Find on map)
Area: 1.293 square miles
Population: 1,102
Population density:
Median household income in 2021:
Median rent in in 2021:
Male vs Females
Median age
Most popular occupations of males: construction, extraction, and maintenance occupations (23.1%); material moving occupations (14.8%); production occupations (13.0%); service occupations (12.8%); sales and office occupations (6.3%); management occupations (except farmers) (3.5%); transportation occupations (1.8%)
Most popular occupations of females: sales and office occupations (46.5%); service occupations (19.3%); construction, extraction, and maintenance occupations (9.1%); education, training, and library occupations (7.0%); management occupations (except farmers) (3.7%); healthcare practitioners and technical occupations (3.2%); arts, design, entertainment, sports, and media occupations (2.7%)
Roads and streets: Co Rd 526 (Lake Houston Pkwy, S Lake Houston Pkwy, FM 526 S); Barnesworth Dr; Thrasher St; Foxhunter Rd; Crim Rd; Wileywood Dr; S Lake Houston Pkwy (Co Rd 526); Lodgepole Rd; Danshire Dr; Windhaven St; Teal; Northlake Dr; Perch Creek Dr; Irene Rd; Fernlake Dr; Turtlewood St; Foxfern Cir; Sterling Crest Rd; Hawkeye Ct (Hawkeye St); Foxleigh Rd; Lewiston Ct; Thrasher; Danshire Ct; Lewiston St; Hawkeye St; Foxfern St; Foxleigh Ct; Crim Ct; Rosethorn Dr; White Wing; Pheasant; Javelina.
Other features: Spring Gully.
Huntwood neighborhood detailed profile
Area: 1.293 square miles
Population: 1,102
Population density:
| Huntwood: | 852 people per square mile |
| Houston: | 3,947 people per square mile |
Median household income in 2021:
| Huntwood: | $36,823 |
| Houston: | $55,499 |
Median rent in in 2021:
| Huntwood: | $754 |
| Houston: | $974 |
Male vs Females
| Males: | 583 |
| Females: | 518 |
Median age
| Males: | 34.6 years |
| Females: | 49.1 years |
Most popular occupations of males: construction, extraction, and maintenance occupations (23.1%); material moving occupations (14.8%); production occupations (13.0%); service occupations (12.8%); sales and office occupations (6.3%); management occupations (except farmers) (3.5%); transportation occupations (1.8%)
Most popular occupations of females: sales and office occupations (46.5%); service occupations (19.3%); construction, extraction, and maintenance occupations (9.1%); education, training, and library occupations (7.0%); management occupations (except farmers) (3.7%); healthcare practitioners and technical occupations (3.2%); arts, design, entertainment, sports, and media occupations (2.7%)
Roads and streets: Co Rd 526 (Lake Houston Pkwy, S Lake Houston Pkwy, FM 526 S); Barnesworth Dr; Thrasher St; Foxhunter Rd; Crim Rd; Wileywood Dr; S Lake Houston Pkwy (Co Rd 526); Lodgepole Rd; Danshire Dr; Windhaven St; Teal; Northlake Dr; Perch Creek Dr; Irene Rd; Fernlake Dr; Turtlewood St; Foxfern Cir; Sterling Crest Rd; Hawkeye Ct (Hawkeye St); Foxleigh Rd; Lewiston Ct; Thrasher; Danshire Ct; Lewiston St; Hawkeye St; Foxfern St; Foxleigh Ct; Crim Ct; Rosethorn Dr; White Wing; Pheasant; Javelina.
Other features: Spring Gully.
Huntwood neighborhood detailed profile
Independence Heights neighborhood in Houston statistics: (Find on map)
Area: 3.390 square miles
Population: 12,738
Population density:
Median household income in 2021:
Median rent in in 2021:
Male vs Females
Median age
Housing prices:
Average estimated value of detached houses in 2021 (71.2% of all units):
Average estimated value of townhouses or other attached units in 2021 (3.6% of all units):
Average estimated value of mobile home in 2021 (8.1% of all units):
Most popular occupations of males: construction, extraction, and maintenance occupations (23.4%); service occupations (16.0%); sales and office occupations (11.0%); production occupations (9.0%); transportation occupations (9.0%); management occupations (except farmers) (7.8%); material moving occupations (4.1%)
Most popular occupations of females: sales and office occupations (35.8%); service occupations (27.9%); business and financial operations occupations (6.0%); healthcare practitioners and technical occupations (5.5%); production occupations (4.7%); management occupations (except farmers) (4.2%); education, training, and library occupations (3.5%)
Limited-access highways (interstate or state) in this neighborhood: Ih 45-Hov Fwy (I- 45); N Loop Fwy (I- 610).
Highways in this neighborhood: State Spur 261 (N Shepherd Dr).
Roads and streets: Yale St; Airline Dr; Victoria Dr; E 33rd St; Oxford St; N Main St; Garden Oaks Blvd; E 35th St; Crosstimbers St; E 40th St; E 39th St; E Whitney St; Neyland St; E 40th 1/2 St; E 36th St; E 32nd St; E 34th St; Werner St; E 37th St; E 38th St; Arlington St; Cornell St; E 32nd 1/2 St; Barkley St; Cortlandt St; W Crosstimbers Rd (W Crosstimbers St); Hohldale St; E 43rd St; Castor Dr (Castor St); Rogers St; E 31st St; E Janisch Rd; Glenburnie Dr; E Delz Dr; Spell St; Bizerte St; E 42nd St; E 41st St; Delhi St; W Donovan St; Europa St; Delz St; Thornton Rd; Janisch Rd; Heidrich St (Heidrich Ave); Martin St (Martin Rd); Arrowpoint Dr; Stokes St; E Burress St; Norview Dr; W Tidwell Rd; E Rogers St; Tulane St; Blueberry St; Harvard St; Oriole St; Marcella St; Sikes St; Marathon St; E Thornton Rd; Marable Dr; Westcross St; Mercedes Ln; Old Yale St; Riggs Rd; Weatherly Way; Link Rd; Distribution Blvd; Noras Ln; Gammon Dr; del Norte St; W Whitney St; Haygood St; Walthall Dr; Omega St; Hinton Blvd; Ajax St; Truman St; Betral St; Fenn St; Leago St; Lena Dr; Barkwood; Columbia St; Busiek Ct (Busiek St); el Centro St; Johnston St; E 44th St; W 38th St; Bombay St; Jerry St; E 45th St; Bacchus St; Cockerel St (Marathon St); Fenn; Bayou Dr; Rutland St; W 44th St; Crosstimbers; E Tidwell Rd; Hyta St; Bella Vista St; Herridge St; Heite St; Westfield St; Crosston St; Nest Ln; Feamster Dr; Hohford St; Volley St; Mc Comb St; Wunder Ln; Simsbury St; Blackshear St; Douglas St; Brenner St; Eastman St; Avernus St; Nicholson; Ashland St; Placid St; del Sur St; Fatima Ln; Allston St; Lelay Cir; Pecan Park Cir; Carnation St; Cadmus St; Bluegrass St; Red Haw Ln; Pheasant St; Allensby St; 40th St; Bowman St; Cabell St; E 42nd 1/2 St; Avens; Oriole; Acme Ct.
Railroad features: Houston Belt and Terminal Rlwy.
Other features: White Oak Byu; Little White Oak Byu; Little Whiteoak Byu.
Independence Heights neighborhood detailed profile
Area: 3.390 square miles
Population: 12,738
Population density:
| Independence Heights: | 3,758 people per square mile |
| Houston: | 3,947 people per square mile |
Median household income in 2021:
| Independence Heights: | $68,100 |
| Houston: | $55,499 |
Median rent in in 2021:
| Independence Heights: | $848 |
| Houston: | $974 |
Male vs Females
| Males: | 5,848 |
| Females: | 6,890 |
Median age
| Males: | 41.0 years |
| Females: | 37.1 years |
Housing prices:
Average estimated value of detached houses in 2021 (71.2% of all units):
| Independence Heights: | $237,196 |
| Houston: | $304,685 |
Average estimated value of townhouses or other attached units in 2021 (3.6% of all units):
| This neighborhood: | $253,793 |
| city: | $305,463 |
Average estimated value of mobile home in 2021 (8.1% of all units):
| Independence Heights: | $133,517 |
| Houston: | $60,006 |
Most popular occupations of males: construction, extraction, and maintenance occupations (23.4%); service occupations (16.0%); sales and office occupations (11.0%); production occupations (9.0%); transportation occupations (9.0%); management occupations (except farmers) (7.8%); material moving occupations (4.1%)
Most popular occupations of females: sales and office occupations (35.8%); service occupations (27.9%); business and financial operations occupations (6.0%); healthcare practitioners and technical occupations (5.5%); production occupations (4.7%); management occupations (except farmers) (4.2%); education, training, and library occupations (3.5%)
Limited-access highways (interstate or state) in this neighborhood: Ih 45-Hov Fwy (I- 45); N Loop Fwy (I- 610).
Highways in this neighborhood: State Spur 261 (N Shepherd Dr).
Roads and streets: Yale St; Airline Dr; Victoria Dr; E 33rd St; Oxford St; N Main St; Garden Oaks Blvd; E 35th St; Crosstimbers St; E 40th St; E 39th St; E Whitney St; Neyland St; E 40th 1/2 St; E 36th St; E 32nd St; E 34th St; Werner St; E 37th St; E 38th St; Arlington St; Cornell St; E 32nd 1/2 St; Barkley St; Cortlandt St; W Crosstimbers Rd (W Crosstimbers St); Hohldale St; E 43rd St; Castor Dr (Castor St); Rogers St; E 31st St; E Janisch Rd; Glenburnie Dr; E Delz Dr; Spell St; Bizerte St; E 42nd St; E 41st St; Delhi St; W Donovan St; Europa St; Delz St; Thornton Rd; Janisch Rd; Heidrich St (Heidrich Ave); Martin St (Martin Rd); Arrowpoint Dr; Stokes St; E Burress St; Norview Dr; W Tidwell Rd; E Rogers St; Tulane St; Blueberry St; Harvard St; Oriole St; Marcella St; Sikes St; Marathon St; E Thornton Rd; Marable Dr; Westcross St; Mercedes Ln; Old Yale St; Riggs Rd; Weatherly Way; Link Rd; Distribution Blvd; Noras Ln; Gammon Dr; del Norte St; W Whitney St; Haygood St; Walthall Dr; Omega St; Hinton Blvd; Ajax St; Truman St; Betral St; Fenn St; Leago St; Lena Dr; Barkwood; Columbia St; Busiek Ct (Busiek St); el Centro St; Johnston St; E 44th St; W 38th St; Bombay St; Jerry St; E 45th St; Bacchus St; Cockerel St (Marathon St); Fenn; Bayou Dr; Rutland St; W 44th St; Crosstimbers; E Tidwell Rd; Hyta St; Bella Vista St; Herridge St; Heite St; Westfield St; Crosston St; Nest Ln; Feamster Dr; Hohford St; Volley St; Mc Comb St; Wunder Ln; Simsbury St; Blackshear St; Douglas St; Brenner St; Eastman St; Avernus St; Nicholson; Ashland St; Placid St; del Sur St; Fatima Ln; Allston St; Lelay Cir; Pecan Park Cir; Carnation St; Cadmus St; Bluegrass St; Red Haw Ln; Pheasant St; Allensby St; 40th St; Bowman St; Cabell St; E 42nd 1/2 St; Avens; Oriole; Acme Ct.
Railroad features: Houston Belt and Terminal Rlwy.
Other features: White Oak Byu; Little White Oak Byu; Little Whiteoak Byu.
Independence Heights neighborhood detailed profile
Jensen neighborhood in Houston statistics: (Find on map)
Area: 7.622 square miles
Population: 31,127
Population density:
Median household income in 2021:
Median rent in in 2021:
Male vs Females
Median age
Housing prices:
Average estimated value of detached houses in 2021 (74.4% of all units):
Average estimated value of townhouses or other attached units in 2021 (6.7% of all units):
Average estimated value of mobile home in 2021 (4.5% of all units):
Most popular occupations of males: construction, extraction, and maintenance occupations (36.1%); service occupations (15.8%); production occupations (11.0%); transportation occupations (10.1%); sales and office occupations (6.3%); material moving occupations (4.0%); education, training, and library occupations (1.9%)
Most popular occupations of females: sales and office occupations (38.2%); service occupations (27.2%); production occupations (6.6%); healthcare practitioners and technical occupations (4.9%); transportation occupations (4.7%); education, training, and library occupations (4.6%); management occupations (except farmers) (2.9%)
Highways in this neighborhood: State Spur 548 (Hardy Toll Rd).
Roads and streets: Eastex Fwy; Jensen Dr; Aldine Westfield Rd (Parker Rd); Turner Dr; Tidwell Rd; Aldine Westfield Rd; Kelley St; E Hardy Rd; Exeter St; Friendly Rd; Eastex Frwy Svc Rd; Burden St; Bostic St; Berry Rd; E Crosstimbers St; Dodson St; Trout St; Curry Rd; Bennington St; Sadler St; Schilder Dr; Caplin St; Firnat St; Creston Dr; Saunders Rd; Shady Ln; Priest Dr; Laura Koppe Rd; King St; Wiley Rd; Hitchcock St; Schuller Rd; Mc Daniel St; Topping St; Reid St; Melbourne St; Magna St; Folger St; Little York Rd; Charles St (Charles Rd); Hage St; Linder St; Deutser St; Kinkaid St; Keeland St; Hurley St; Edgeworth St; Bentley St; Pine Tree Dr; West St; Lakewood Dr; Cresline St; Deams St; Skinner Rd; Foy Ln; Eastex Frwy Serv Dr (US Hwy 59); Royal Pine Dr; Lomax St; Heaney Dr; Margaret St; Peach St; Hardwood Ln; Langley Rd; Schneider St; Rothermel Rd; Sparks St; Persimmon St; Vaughn St; W Hardy St; Vance St; Raymondville Rd; Roxella St; Weedy Ln; Mc Clelland St; Arkansas St; Amalie St; Toliver St; Spence St; Lynnfield St; Dodson Rd (Dodson St); Colley St; Tidford St; Harrell St; Wimberly St; Schneider St (Schneider Rd); Luell St; Hollis St; Haywood St; Edell St; Epsom Rd; Eubanks St; Wellington St; Margaret Dr (Margaret St); Batterson St; Terrell St; Knight St; Hohl; Briarwick Ln; Torreon St; Tim St; Willie St; Ramin Dr (Ramin St); Gold St; Hohl St; Downs (Downs Ln); Macha; Tidwell Ln; Penn St; Worthington St; Orlando St; Larry St; Hector St; Shoreham St; Trenton Rd; Manus St; Durwood St; Moreau St; Clarence St; Goodloe St; Pennington St; Presley St; Eugene St; Alcorn St; Fleetwood St; Darden St; West Svc Rd; Marzelle St; Charter Oaks Dr; Gateway Dr; Millicent St; Barnston St; Marilyn Ln; Aldon St; Hurlplan St; Cricket Ln; Chase St; Simmons; Hilton St; Sherwick St; Gager St; Edgewater Dr; Weaver Rd; Plaag St; Kay; Semmes St; Clarence; Oklahoma St; Madeley St; Woodard St; Brannon St; Herben Rd; Leath St; Hendricks St (Hendrix St); Stafford Dr; Barksdale Dr; Strickland St; Hardy St; Yorkwood St; Mann St; Duncan St; Carlington Dr; Somerset Ln; Trippel St; Wyte Ln; Exeter; Seven Mile Ln; Horton St; Allbritton Dr; Penhurst St; Bleker St; Cours St; Etta St; Bantum St; Brazil St; Chapis St; Della St; Tidwell Tc Four Dr; Downs Ln; Yorkshire St; Arkansas; Antha St; Riner St; Peach; Denmark St; Crittenden St; Lowrie St; Otto St; Skippy; Arto St; Lundy Rd; Kandarain St; Lazy Pines St; Winton St; Tidwell Tc Two Dr; Kenco St; York Crst; Avenue of Oaks St; Eastex Frwy Svc Rd (US Hwy 59); Dane St; Berkshire St; Wetherill St; Tatom St; Waverly St; Brackenridge St; Westford St; Knight; Monet St; Coan St; Cherry St; Tala St; Mona St; Park Ln; Adelbert St; Brewster St; Kentfield Dr; Pettibone St; Adelle St; Woody Ln; Doyle St; Ray St; Eva St; Sagebrush Dr; Gwen St; Michulka Ln; Lloydmore St; Valor St; Washington Rd (Aldine Westfield Rd); Lakewood; Mc Clellend; Kinkaid St (Kinkaid Cir); Wages St; Firnat; Neches St; Tidwell Tc Five Dr; Larry; Tidwell Tc One Dr; Sagebrush Cir; Barnston; Melbourne; Shoreham; Winton; Bennington; Tidwell Tc Three Dr.
Railroad features: Houston Belt and Terminal Rlwy; Southern Pacific RR.
Other features: Halls Byu.
Jensen neighborhood detailed profile
Area: 7.622 square miles
Population: 31,127
Population density:
| Jensen: | 4,084 people per square mile |
| Houston: | 3,947 people per square mile |
Median household income in 2021:
| Jensen: | $38,174 |
| Houston: | $55,499 |
Median rent in in 2021:
| Jensen: | $794 |
| Houston: | $974 |
Male vs Females
| Males: | 15,530 |
| Females: | 15,597 |
Median age
| Males: | 31.5 years |
| Females: | 35.2 years |
Housing prices:
Average estimated value of detached houses in 2021 (74.4% of all units):
| Jensen: | $116,647 |
| Houston: | $304,685 |
Average estimated value of townhouses or other attached units in 2021 (6.7% of all units):
| This neighborhood: | $512,658 |
| city: | $305,463 |
Average estimated value of mobile home in 2021 (4.5% of all units):
| Jensen: | $23,697 |
| Houston: | $60,006 |
Most popular occupations of males: construction, extraction, and maintenance occupations (36.1%); service occupations (15.8%); production occupations (11.0%); transportation occupations (10.1%); sales and office occupations (6.3%); material moving occupations (4.0%); education, training, and library occupations (1.9%)
Most popular occupations of females: sales and office occupations (38.2%); service occupations (27.2%); production occupations (6.6%); healthcare practitioners and technical occupations (4.9%); transportation occupations (4.7%); education, training, and library occupations (4.6%); management occupations (except farmers) (2.9%)
Highways in this neighborhood: State Spur 548 (Hardy Toll Rd).
Roads and streets: Eastex Fwy; Jensen Dr; Aldine Westfield Rd (Parker Rd); Turner Dr; Tidwell Rd; Aldine Westfield Rd; Kelley St; E Hardy Rd; Exeter St; Friendly Rd; Eastex Frwy Svc Rd; Burden St; Bostic St; Berry Rd; E Crosstimbers St; Dodson St; Trout St; Curry Rd; Bennington St; Sadler St; Schilder Dr; Caplin St; Firnat St; Creston Dr; Saunders Rd; Shady Ln; Priest Dr; Laura Koppe Rd; King St; Wiley Rd; Hitchcock St; Schuller Rd; Mc Daniel St; Topping St; Reid St; Melbourne St; Magna St; Folger St; Little York Rd; Charles St (Charles Rd); Hage St; Linder St; Deutser St; Kinkaid St; Keeland St; Hurley St; Edgeworth St; Bentley St; Pine Tree Dr; West St; Lakewood Dr; Cresline St; Deams St; Skinner Rd; Foy Ln; Eastex Frwy Serv Dr (US Hwy 59); Royal Pine Dr; Lomax St; Heaney Dr; Margaret St; Peach St; Hardwood Ln; Langley Rd; Schneider St; Rothermel Rd; Sparks St; Persimmon St; Vaughn St; W Hardy St; Vance St; Raymondville Rd; Roxella St; Weedy Ln; Mc Clelland St; Arkansas St; Amalie St; Toliver St; Spence St; Lynnfield St; Dodson Rd (Dodson St); Colley St; Tidford St; Harrell St; Wimberly St; Schneider St (Schneider Rd); Luell St; Hollis St; Haywood St; Edell St; Epsom Rd; Eubanks St; Wellington St; Margaret Dr (Margaret St); Batterson St; Terrell St; Knight St; Hohl; Briarwick Ln; Torreon St; Tim St; Willie St; Ramin Dr (Ramin St); Gold St; Hohl St; Downs (Downs Ln); Macha; Tidwell Ln; Penn St; Worthington St; Orlando St; Larry St; Hector St; Shoreham St; Trenton Rd; Manus St; Durwood St; Moreau St; Clarence St; Goodloe St; Pennington St; Presley St; Eugene St; Alcorn St; Fleetwood St; Darden St; West Svc Rd; Marzelle St; Charter Oaks Dr; Gateway Dr; Millicent St; Barnston St; Marilyn Ln; Aldon St; Hurlplan St; Cricket Ln; Chase St; Simmons; Hilton St; Sherwick St; Gager St; Edgewater Dr; Weaver Rd; Plaag St; Kay; Semmes St; Clarence; Oklahoma St; Madeley St; Woodard St; Brannon St; Herben Rd; Leath St; Hendricks St (Hendrix St); Stafford Dr; Barksdale Dr; Strickland St; Hardy St; Yorkwood St; Mann St; Duncan St; Carlington Dr; Somerset Ln; Trippel St; Wyte Ln; Exeter; Seven Mile Ln; Horton St; Allbritton Dr; Penhurst St; Bleker St; Cours St; Etta St; Bantum St; Brazil St; Chapis St; Della St; Tidwell Tc Four Dr; Downs Ln; Yorkshire St; Arkansas; Antha St; Riner St; Peach; Denmark St; Crittenden St; Lowrie St; Otto St; Skippy; Arto St; Lundy Rd; Kandarain St; Lazy Pines St; Winton St; Tidwell Tc Two Dr; Kenco St; York Crst; Avenue of Oaks St; Eastex Frwy Svc Rd (US Hwy 59); Dane St; Berkshire St; Wetherill St; Tatom St; Waverly St; Brackenridge St; Westford St; Knight; Monet St; Coan St; Cherry St; Tala St; Mona St; Park Ln; Adelbert St; Brewster St; Kentfield Dr; Pettibone St; Adelle St; Woody Ln; Doyle St; Ray St; Eva St; Sagebrush Dr; Gwen St; Michulka Ln; Lloydmore St; Valor St; Washington Rd (Aldine Westfield Rd); Lakewood; Mc Clellend; Kinkaid St (Kinkaid Cir); Wages St; Firnat; Neches St; Tidwell Tc Five Dr; Larry; Tidwell Tc One Dr; Sagebrush Cir; Barnston; Melbourne; Shoreham; Winton; Bennington; Tidwell Tc Three Dr.
Railroad features: Houston Belt and Terminal Rlwy; Southern Pacific RR.
Other features: Halls Byu.
Jensen neighborhood detailed profile
Kashmere Gardens neighborhood in Houston statistics: (Find on map)
Area: 4.089 square miles
Population: 12,539
Population density:
Median household income in 2021:
Median rent in in 2021:
Male vs Females
Median age
Average estimated value of detached houses in 2021 (72.4% of all units):
Most popular occupations of males: construction, extraction, and maintenance occupations (25.6%); service occupations (20.4%); production occupations (9.9%); transportation occupations (8.4%); material moving occupations (8.3%); management occupations (except farmers) (7.4%); sales and office occupations (7.3%)
Most popular occupations of females: service occupations (33.7%); sales and office occupations (32.1%); education, training, and library occupations (9.5%); healthcare practitioners and technical occupations (7.1%); management occupations (except farmers) (3.1%); business and financial operations occupations (3.1%); transportation occupations (2.7%)
Limited-access highways (interstate or state) in this neighborhood: I- 610 (N Loop Fwy).
Highways in this neighborhood: US Hwy 59 (Eastex Fwy).
Roads and streets: Cavalcade St; Crane St; Homestead Rd; Rand St; Kelley St; Lockwood Dr; Pardee St; Kashmere St; Los Angeles St; Wipprecht St; Jensen Dr; Hirsch Rd; Wayne St; Liberty Rd; Collingsworth St; Sayers St; Leffingwell St; Hoffman St; Falls St; Pickfair St; Lavender St; Cherry St; Blaffer; Dabney St; Fairbanks St; Russell St; Bay St; Linn St; Woolworth St; Englewood St; Majestic St; Kress St; Eastex Freeway Svc Rd (US Hwy 59); Des Chaumes St; Schalker Dr; Vintage St; Lebadie St; Legion St; Bain St; Eastpark Dr; W Hunting St; Memel St; Minden St; East Ln; Christie St; Chickering St; Darien St; Makeig St; Milwaukee St; Coal St; Gold St; Ivy St; Crandon St; Porter; Bertha St; Woodard St; Bunte St; Marcus St; Mc Gee St; Troost St; Hardie St; George St; Broyles St; N George St; Glasgow St; Neches St (US Hwy 59); Cherry; Hickman St; Brewster St; Whitty St; Hilary St; Lufkin St; Love St; Jewett St; Des Chaumes Ct; Horace St; Conroy St; Dyche Ct; West Svc Rd; N Wayside Dr; Date St; Pear St; Cordon St; Knodell St; Quannah St; Easy St; Holt Aly; Fogle St; Emmet; Pardee; Howard Aly; Le Badie; Sayers.
Railroad features: Southern Pacific RR; Houston Belt and Terminal Rlwy.
Other features: Hunting Byu.
Kashmere Gardens neighborhood detailed profile
Area: 4.089 square miles
Population: 12,539
Population density:
| Kashmere Gardens: | 3,067 people per square mile |
| Houston: | 3,947 people per square mile |
Median household income in 2021:
| Kashmere Gardens: | $33,516 |
| Houston: | $55,499 |
Median rent in in 2021:
| Kashmere Gardens: | $623 |
| Houston: | $974 |
Male vs Females
| Males: | 6,196 |
| Females: | 6,342 |
Median age
| Males: | 34.8 years |
| Females: | 39.1 years |
Average estimated value of detached houses in 2021 (72.4% of all units):
| Kashmere Gardens: | $118,210 |
| Houston: | $304,685 |
Most popular occupations of males: construction, extraction, and maintenance occupations (25.6%); service occupations (20.4%); production occupations (9.9%); transportation occupations (8.4%); material moving occupations (8.3%); management occupations (except farmers) (7.4%); sales and office occupations (7.3%)
Most popular occupations of females: service occupations (33.7%); sales and office occupations (32.1%); education, training, and library occupations (9.5%); healthcare practitioners and technical occupations (7.1%); management occupations (except farmers) (3.1%); business and financial operations occupations (3.1%); transportation occupations (2.7%)
Limited-access highways (interstate or state) in this neighborhood: I- 610 (N Loop Fwy).
Highways in this neighborhood: US Hwy 59 (Eastex Fwy).
Roads and streets: Cavalcade St; Crane St; Homestead Rd; Rand St; Kelley St; Lockwood Dr; Pardee St; Kashmere St; Los Angeles St; Wipprecht St; Jensen Dr; Hirsch Rd; Wayne St; Liberty Rd; Collingsworth St; Sayers St; Leffingwell St; Hoffman St; Falls St; Pickfair St; Lavender St; Cherry St; Blaffer; Dabney St; Fairbanks St; Russell St; Bay St; Linn St; Woolworth St; Englewood St; Majestic St; Kress St; Eastex Freeway Svc Rd (US Hwy 59); Des Chaumes St; Schalker Dr; Vintage St; Lebadie St; Legion St; Bain St; Eastpark Dr; W Hunting St; Memel St; Minden St; East Ln; Christie St; Chickering St; Darien St; Makeig St; Milwaukee St; Coal St; Gold St; Ivy St; Crandon St; Porter; Bertha St; Woodard St; Bunte St; Marcus St; Mc Gee St; Troost St; Hardie St; George St; Broyles St; N George St; Glasgow St; Neches St (US Hwy 59); Cherry; Hickman St; Brewster St; Whitty St; Hilary St; Lufkin St; Love St; Jewett St; Des Chaumes Ct; Horace St; Conroy St; Dyche Ct; West Svc Rd; N Wayside Dr; Date St; Pear St; Cordon St; Knodell St; Quannah St; Easy St; Holt Aly; Fogle St; Emmet; Pardee; Howard Aly; Le Badie; Sayers.
Railroad features: Southern Pacific RR; Houston Belt and Terminal Rlwy.
Other features: Hunting Byu.
Kashmere Gardens neighborhood detailed profile
Langwood neighborhood in Houston statistics: (Find on map)
Area: 1.416 square miles
Population: 4,693
Population density:
Median household income in 2021:
Median rent in in 2021:
Male vs Females
Median age
Housing prices:
Average estimated value of detached houses in 2021 (80.1% of all units):
Average estimated value of townhouses or other attached units in 2021 (15.4% of all units):
Average estimated '21 value of housing units in 5-or-more-unit structures (23.2% of all units):
Most popular occupations of males: business and financial operations occupations (21.8%); sales and office occupations (14.5%); education, training, and library occupations (11.8%); construction, extraction, and maintenance occupations (11.6%); service occupations (10.6%); management occupations (except farmers) (8.5%); material moving occupations (7.2%)
Most popular occupations of females: sales and office occupations (43.7%); service occupations (14.3%); material moving occupations (9.1%); management occupations (except farmers) (8.7%); business and financial operations occupations (6.7%); computer and mathematical occupations (5.5%); education, training, and library occupations (4.6%)
Highways in this neighborhood: US Hwy 290; US Hwy 290 (290-Hov Fwy).
Roads and streets: Bingle Rd; Underhill St; Lang Rd; Thornwall St; Feldspar St; Rayson Rd; Sonneville Dr; Limestone St; Jim St; Soway St; Granite St; W 43rd St; Bolin Rd; Milwee St; Citadel Ln; Kempwood Dr; Clemson St; Lumberdale Rd; Ojeman Rd; Rannie Rd; Lodge St; Blankenship Dr; Mc Dade; Forest Grove Dr; Friendship Rd; Saxon Dr; Lockfield St; Ryson St; Norton Dr; Alcott Dr; Kempridge St; Underhill; Barney Rd; Sowden Rd; Malibu Dr; Peg St; Midfield Dr; Greiner Dr; Gold Creek Dr; Hempstead Rd; Cotton Dr; Farmington St; Maysel St; Verdome Ln; Roma St; Acorn St; Harland Dr; Thonig Rd; Belmore; Churchville Dr; Wyatt St; Nan; Bascom St; Ojeman; Arsenal; Peavine Cir; Antoine Dr.
Railroad features: Southern Pacific RR.
Other features: Brickhouse Gully; Brickhouse Gully Strm.
Langwood neighborhood detailed profile
Area: 1.416 square miles
Population: 4,693
Population density:
| Langwood: | 3,314 people per square mile |
| Houston: | 3,947 people per square mile |
Median household income in 2021:
| Langwood: | $72,597 |
| Houston: | $55,499 |
Median rent in in 2021:
| Langwood: | $1,047 |
| Houston: | $974 |
Male vs Females
| Males: | 2,539 |
| Females: | 2,153 |
Median age
| Males: | 39.2 years |
| Females: | 50.9 years |
Housing prices:
Average estimated value of detached houses in 2021 (80.1% of all units):
| Langwood: | $277,501 |
| Houston: | $304,685 |
Average estimated value of townhouses or other attached units in 2021 (15.4% of all units):
| This neighborhood: | $363,274 |
| city: | $305,463 |
Average estimated '21 value of housing units in 5-or-more-unit structures (23.2% of all units):
| Langwood: | $81,563 |
| Houston: | $227,414 |
Most popular occupations of males: business and financial operations occupations (21.8%); sales and office occupations (14.5%); education, training, and library occupations (11.8%); construction, extraction, and maintenance occupations (11.6%); service occupations (10.6%); management occupations (except farmers) (8.5%); material moving occupations (7.2%)
Most popular occupations of females: sales and office occupations (43.7%); service occupations (14.3%); material moving occupations (9.1%); management occupations (except farmers) (8.7%); business and financial operations occupations (6.7%); computer and mathematical occupations (5.5%); education, training, and library occupations (4.6%)
Highways in this neighborhood: US Hwy 290; US Hwy 290 (290-Hov Fwy).
Roads and streets: Bingle Rd; Underhill St; Lang Rd; Thornwall St; Feldspar St; Rayson Rd; Sonneville Dr; Limestone St; Jim St; Soway St; Granite St; W 43rd St; Bolin Rd; Milwee St; Citadel Ln; Kempwood Dr; Clemson St; Lumberdale Rd; Ojeman Rd; Rannie Rd; Lodge St; Blankenship Dr; Mc Dade; Forest Grove Dr; Friendship Rd; Saxon Dr; Lockfield St; Ryson St; Norton Dr; Alcott Dr; Kempridge St; Underhill; Barney Rd; Sowden Rd; Malibu Dr; Peg St; Midfield Dr; Greiner Dr; Gold Creek Dr; Hempstead Rd; Cotton Dr; Farmington St; Maysel St; Verdome Ln; Roma St; Acorn St; Harland Dr; Thonig Rd; Belmore; Churchville Dr; Wyatt St; Nan; Bascom St; Ojeman; Arsenal; Peavine Cir; Antoine Dr.
Railroad features: Southern Pacific RR.
Other features: Brickhouse Gully; Brickhouse Gully Strm.
Langwood neighborhood detailed profile
Lazy Brook neighborhood in Houston statistics: (Find on map)
Area: 3.771 square miles
Population: 21,454
Population density:
Median household income in 2021:
Median rent in in 2021:
Male vs Females
Median age
Housing prices:
Average estimated value of detached houses in 2021 (29.8% of all units):
Average estimated value of townhouses or other attached units in 2021 (10.8% of all units):
Most popular occupations of males: service occupations (17.6%); management occupations (except farmers) (14.6%); business and financial operations occupations (14.5%); arts, design, entertainment, sports, and media occupations (13.3%); sales and office occupations (11.1%); education, training, and library occupations (7.9%); architecture and engineering occupations (7.7%)
Most popular occupations of females: sales and office occupations (23.1%); management occupations (except farmers) (19.0%); education, training, and library occupations (16.4%); service occupations (12.4%); business and financial operations occupations (10.8%); healthcare practitioners and technical occupations (6.9%); legal occupations (3.9%)
Limited-access highways (interstate or state) in this neighborhood: I- 610 (W Loop Fwy).
Highways in this neighborhood: US Hwy 290; 290-Hov Fwy (US Hwy 290).
Roads and streets: W T C Jester Blvd; W 18th St; W 11th St; Wynnwood Ln; Hurst St; Tannehill Dr; Grovewood Ln; W 12th St; Droxford Dr; Dacoma St; Cindy Ln; Ella Blvd; Lindyann Ln; Haverhill Dr; Willowby Dr; E T C Jester Blvd; Seamist Dr; Kury Ln; Ascot Ln; Sherwood Ln; T C Jester Blvd; Lazybrook Dr; Brooktree Dr; Shirkmere Rd; Waltway Dr; Directors Row; Mangum Rd; Nashua St; Minimax Dr; Wister Ln; Greengrass Dr; N Durham Dr; Shelterwood Dr; Bay Oaks Rd; Salford Dr; Woodbrook Ln; Seaspray Ct; Pineshade Ln; Millwood Dr; Foxwood Rd; Worthshire St; Brookmere Dr; Brook Woods Dr; Vollmer Rd; E Governors Cir; Katy St; Queenswood Ln; Prince St; W 14th St; Maxroy St; Brookwoods Dr; Hempstead Rd; Helberg Rd; W Governors Cir; Abington Way; Willowmoss Ct; Overmeyer Dr; Eureka Rd; Fawnhope Dr; Widdicomb Ct; Timbergrove Ln; Clovis Rd; Egbert St; Crystal Ct; Gardendale Dr; Seamist Ct; Greengrass Ct; Woodhill Rd; Mill Creek Dr; Turnpike Rd; Manville St; Wynnpark Dr; Locksford St; Bryce; Nauts Ct; Watercrest Dr; Linton Rd; Guese Rd; Tattenhall Dr; Toledo St; Rawls St; Sea King Dr; Letein St; Sea Queen Ct; Valleta Dr; Glen Oaks St; Beall St; Cranston Ct; Windmill Ln; Knightwick Dr; Wister Ct; Egbert; Croydon Ct; Drane Ct; Jeannine Dr; Detering St.
Railroad features: Southern Pacific RR; Union Pacific RR.
Other features: White Oak Byu.
Lazy Brook neighborhood detailed profile
Area: 3.771 square miles
Population: 21,454
Population density:
| Lazy Brook (Timbergrove): | 5,689 people per square mile |
| Houston: | 3,947 people per square mile |
Median household income in 2021:
| Lazy Brook (Timbergrove): | $143,937 |
| Houston: | $55,499 |
Median rent in in 2021:
| Lazy Brook (Timbergrove): | $1,421 |
| Houston: | $974 |
Male vs Females
| Males: | 11,718 |
| Females: | 9,736 |
Median age
| Males: | 29.1 years |
| Females: | 35.0 years |
Housing prices:
Average estimated value of detached houses in 2021 (29.8% of all units):
| Lazy Brook (Timbergrove): | $393,825 |
| Houston: | $304,685 |
Average estimated value of townhouses or other attached units in 2021 (10.8% of all units):
| This neighborhood: | $414,706 |
| city: | $305,463 |
Most popular occupations of males: service occupations (17.6%); management occupations (except farmers) (14.6%); business and financial operations occupations (14.5%); arts, design, entertainment, sports, and media occupations (13.3%); sales and office occupations (11.1%); education, training, and library occupations (7.9%); architecture and engineering occupations (7.7%)
Most popular occupations of females: sales and office occupations (23.1%); management occupations (except farmers) (19.0%); education, training, and library occupations (16.4%); service occupations (12.4%); business and financial operations occupations (10.8%); healthcare practitioners and technical occupations (6.9%); legal occupations (3.9%)
Limited-access highways (interstate or state) in this neighborhood: I- 610 (W Loop Fwy).
Highways in this neighborhood: US Hwy 290; 290-Hov Fwy (US Hwy 290).
Roads and streets: W T C Jester Blvd; W 18th St; W 11th St; Wynnwood Ln; Hurst St; Tannehill Dr; Grovewood Ln; W 12th St; Droxford Dr; Dacoma St; Cindy Ln; Ella Blvd; Lindyann Ln; Haverhill Dr; Willowby Dr; E T C Jester Blvd; Seamist Dr; Kury Ln; Ascot Ln; Sherwood Ln; T C Jester Blvd; Lazybrook Dr; Brooktree Dr; Shirkmere Rd; Waltway Dr; Directors Row; Mangum Rd; Nashua St; Minimax Dr; Wister Ln; Greengrass Dr; N Durham Dr; Shelterwood Dr; Bay Oaks Rd; Salford Dr; Woodbrook Ln; Seaspray Ct; Pineshade Ln; Millwood Dr; Foxwood Rd; Worthshire St; Brookmere Dr; Brook Woods Dr; Vollmer Rd; E Governors Cir; Katy St; Queenswood Ln; Prince St; W 14th St; Maxroy St; Brookwoods Dr; Hempstead Rd; Helberg Rd; W Governors Cir; Abington Way; Willowmoss Ct; Overmeyer Dr; Eureka Rd; Fawnhope Dr; Widdicomb Ct; Timbergrove Ln; Clovis Rd; Egbert St; Crystal Ct; Gardendale Dr; Seamist Ct; Greengrass Ct; Woodhill Rd; Mill Creek Dr; Turnpike Rd; Manville St; Wynnpark Dr; Locksford St; Bryce; Nauts Ct; Watercrest Dr; Linton Rd; Guese Rd; Tattenhall Dr; Toledo St; Rawls St; Sea King Dr; Letein St; Sea Queen Ct; Valleta Dr; Glen Oaks St; Beall St; Cranston Ct; Windmill Ln; Knightwick Dr; Wister Ct; Egbert; Croydon Ct; Drane Ct; Jeannine Dr; Detering St.
Railroad features: Southern Pacific RR; Union Pacific RR.
Other features: White Oak Byu.
Lazy Brook neighborhood detailed profile
Macgregor neighborhood in Houston statistics: (Find on map)
Area: 3.218 square miles
Population: 17,465
Population density:
Median household income in 2021:
Median rent in in 2021:
Male vs Females
Median age
Housing prices:
Average estimated value of detached houses in 2021 (54.4% of all units):
Average estimated value of housing units in 2-unit structures in 2021 (10.8% of all units):
Most popular occupations of males: service occupations (19.7%); management occupations (except farmers) (18.6%); sales and office occupations (14.7%); transportation occupations (8.0%); education, training, and library occupations (7.5%); material moving occupations (6.0%); construction, extraction, and maintenance occupations (5.2%)
Most popular occupations of females: sales and office occupations (28.1%); education, training, and library occupations (20.2%); service occupations (19.0%); business and financial operations occupations (7.2%); healthcare practitioners and technical occupations (6.1%); management occupations (except farmers) (5.2%); life, physical, and social science occupations (4.4%)
Highways in this neighborhood: US Hwy 90 Alt (Old Spanish Trl); South Fwy (State Hwy 288); State Hwy 35.
Roads and streets: S Mac Gregor Way; N Macgregor Way; Charleston St; Rosedale St; Southmore Blvd; Arbor St; Blodgett St; Wentworth St; Wichita St; Scott St; Oakdale St; Dixie Dr; Prospect St; Calumet St; Martin Luther King Jr Blvd; Palm St; Ardmore St; Cullen Blvd; Roseneath Dr; Parkwood Dr; Griggs Rd; Tierwester St; Grand Blvd; Holcombe Blvd; Ozark St; Tampa St; Fernwood Dr; Binz St; Live Oak St; Calhoun Rd (Calhoun St); Ennis St; Burkett St; del Rio St; Mac Gregor Loop Dr; Bowling Green St; Dowling St; Sauer St; Rio Vista St; N Roseneath Dr; Riverside Dr; Burgess St; Sampson St; Rockwood Dr; Blythewood St; S Parkwood Dr; Delano St; N Parkwood Dr; Gertin St; Wentworth Ave (Wentworth St); Varsity Ln; Fiesta Ln; Harvest Ln; Hutchins St; Culberson St; Shenandoah St; H Mark Crosswell Jr St (H M C St); Ruth St; Odin Ct; Glen Cove Dr; Greensboro Dr; Honey Cir; N Mac Gregor Way; la Salette St; Laurel Dr; Allegheny St; Kilgore St; Old Mac Gregor Way; Natchez St; Oakcrest Dr; University Oaks Blvd; Payson St; Swank; Peerless St; Faculty Ln; Milburn St; Ewing St; Palmer St; Bayou Bend Ct; Raleigh St; England St; Kelton St; Scottcrest Dr; Van Etten St; Grantwood St; S Macgregor-South Fwy; Canfield St; Julius Ln; Illinois St; Kuhlman Rd; Oakmont St; Wheeler St; Hermann Lake Dr; Sedalia St; Lockett St; M A S St; Leopold Dr; S Mystic Mdw; Pickwick Dr; Paige St; N Mystic Meadow; W Mystic Meadow; Mystic Bridge Dr; Plaza Dr; E Mystic Meadow; Meriburr Ln; Glen Cove Ct; Alconbury Ln; Dudley St; Dixie-Ardmore; Gehring St; State Hwy 288 (Service Rd); Hancock; Graduate Cir; Allegheny; Mac Gregor Way; St Augustine; Southmore Cir; Rosedale Cir; Charleston; Mac Gregor-South Fwy; Peerless; N Mac Gregor Dr.
Railroad features: Houston Belt and Terminal Rlwy.
Other features: Brays Byu.
Macgregor neighborhood detailed profile
Area: 3.218 square miles
Population: 17,465
Population density:
| Macgregor: | 5,428 people per square mile |
| Houston: | 3,947 people per square mile |
Median household income in 2021:
| Macgregor: | $47,850 |
| Houston: | $55,499 |
Median rent in in 2021:
| Macgregor: | $1,004 |
| Houston: | $974 |
Male vs Females
| Males: | 9,093 |
| Females: | 8,371 |
Median age
| Males: | 32.1 years |
| Females: | 35.3 years |
Housing prices:
Average estimated value of detached houses in 2021 (54.4% of all units):
| Macgregor: | $213,672 |
| Houston: | $304,685 |
Average estimated value of housing units in 2-unit structures in 2021 (10.8% of all units):
| This neighborhood: | $219,600 |
| Houston: | $330,754 |
Most popular occupations of males: service occupations (19.7%); management occupations (except farmers) (18.6%); sales and office occupations (14.7%); transportation occupations (8.0%); education, training, and library occupations (7.5%); material moving occupations (6.0%); construction, extraction, and maintenance occupations (5.2%)
Most popular occupations of females: sales and office occupations (28.1%); education, training, and library occupations (20.2%); service occupations (19.0%); business and financial operations occupations (7.2%); healthcare practitioners and technical occupations (6.1%); management occupations (except farmers) (5.2%); life, physical, and social science occupations (4.4%)
Highways in this neighborhood: US Hwy 90 Alt (Old Spanish Trl); South Fwy (State Hwy 288); State Hwy 35.
Roads and streets: S Mac Gregor Way; N Macgregor Way; Charleston St; Rosedale St; Southmore Blvd; Arbor St; Blodgett St; Wentworth St; Wichita St; Scott St; Oakdale St; Dixie Dr; Prospect St; Calumet St; Martin Luther King Jr Blvd; Palm St; Ardmore St; Cullen Blvd; Roseneath Dr; Parkwood Dr; Griggs Rd; Tierwester St; Grand Blvd; Holcombe Blvd; Ozark St; Tampa St; Fernwood Dr; Binz St; Live Oak St; Calhoun Rd (Calhoun St); Ennis St; Burkett St; del Rio St; Mac Gregor Loop Dr; Bowling Green St; Dowling St; Sauer St; Rio Vista St; N Roseneath Dr; Riverside Dr; Burgess St; Sampson St; Rockwood Dr; Blythewood St; S Parkwood Dr; Delano St; N Parkwood Dr; Gertin St; Wentworth Ave (Wentworth St); Varsity Ln; Fiesta Ln; Harvest Ln; Hutchins St; Culberson St; Shenandoah St; H Mark Crosswell Jr St (H M C St); Ruth St; Odin Ct; Glen Cove Dr; Greensboro Dr; Honey Cir; N Mac Gregor Way; la Salette St; Laurel Dr; Allegheny St; Kilgore St; Old Mac Gregor Way; Natchez St; Oakcrest Dr; University Oaks Blvd; Payson St; Swank; Peerless St; Faculty Ln; Milburn St; Ewing St; Palmer St; Bayou Bend Ct; Raleigh St; England St; Kelton St; Scottcrest Dr; Van Etten St; Grantwood St; S Macgregor-South Fwy; Canfield St; Julius Ln; Illinois St; Kuhlman Rd; Oakmont St; Wheeler St; Hermann Lake Dr; Sedalia St; Lockett St; M A S St; Leopold Dr; S Mystic Mdw; Pickwick Dr; Paige St; N Mystic Meadow; W Mystic Meadow; Mystic Bridge Dr; Plaza Dr; E Mystic Meadow; Meriburr Ln; Glen Cove Ct; Alconbury Ln; Dudley St; Dixie-Ardmore; Gehring St; State Hwy 288 (Service Rd); Hancock; Graduate Cir; Allegheny; Mac Gregor Way; St Augustine; Southmore Cir; Rosedale Cir; Charleston; Mac Gregor-South Fwy; Peerless; N Mac Gregor Dr.
Railroad features: Houston Belt and Terminal Rlwy.
Other features: Brays Byu.
Macgregor neighborhood detailed profile
Magnolia Park neighborhood in Houston statistics: (Find on map)
Area: 2.655 square miles
Population: 17,248
Population density:
Median household income in 2021:
Median rent in in 2021:
Male vs Females
Median age
Average estimated value of detached houses in 2021 (64.3% of all units):
Most popular occupations of males: construction, extraction, and maintenance occupations (31.1%); production occupations (15.6%); service occupations (10.4%); material moving occupations (10.3%); sales and office occupations (9.6%); transportation occupations (7.3%); management occupations (except farmers) (1.6%)
Most popular occupations of females: service occupations (40.7%); sales and office occupations (31.2%); management occupations (except farmers) (3.7%); production occupations (3.6%); material moving occupations (3.3%); business and financial operations occupations (2.9%); life, physical, and social science occupations (2.9%)
Highways in this neighborhood: US Hwy 90 Alt (N Wayside Dr).
Roads and streets: Harrisburg Blvd; Sherman St; Navigation Blvd; Avenue E; Ave F; Canal St; Ave C; Ave H; Ave J; Ave K; Ave I; Avenue N; Ave B; Ave L; Capitol St; Ave O; S Sgt Macario Garcia Dr (69th St); N 67th St (67th St, N Cesar Chavez Blvd); Ave P; 75th St; Ave Q; N 76th St; 74th St (N 74th St); 77th St (N 77th St); Woodvale St; W Hedrick St; Terminal St; Baltimore St; Avenue S; Ave T; 66th St (N 66th St); N 78th St (78th St); Ave V; Ave U; Harbor Dr (J W Peavy Dr); E Hedrick St; Texas St; S 80th St; N 71st St; Glendale St; Ave R; S 79th St; Avenue W; Dayton St; 79th St (N 79th St); J W Peavy Dr; 70th St (N 70th St); 72nd St (N 72nd St); Elwood St; N 70th St; Maltby St; N 65th St; Ford St; N 71st St (71st St); N 80th St (80th St); J W Peavey Dr; S 78th St; Foster St; Goode St; Wooding St; 73rd St; Hudson St; S Sgt Macario Garcia Dr; Waycrest; Wingate St; Pineview Dr; Brays St; Canton St; Basin St; Holtcamp St; Dresden St; E Navigation Blvd (81st St); Eastgate St; S 77th St; Bedford St; S 74th St; Memphis St; Funston St; Glendora St; Phelps St; Beaumont St; S 75th St; Hanover St; N 69th St (S Sgt Macario Garcia Dr); S 69th St; S 70th St; Forest Hill Blvd; S 71st St; S 72nd St; Mason Ct; Inlane St; Mobile St; Jamaica St; Magnolia Tc Four Dr; Frank; Kemton St; Magnolia Tc Two Dr; Hughes St; S 66th St; S 65th St; Alton St; E Navigation Blvd (E 81st St, Navigation Blvd); Brady St; Terminal; P; S 74th 1/2 St; Zoltowski St; J; I; Neuhaus St; Magnolia Tc One Dr.
Railroad features: Houston Belt and Terminal Rlwy; Southern Pacific RR; Port Terminal RR.
Other features: Brays Byu.
Magnolia Park neighborhood detailed profile
Area: 2.655 square miles
Population: 17,248
Population density:
| Magnolia Park: | 6,497 people per square mile |
| Houston: | 3,947 people per square mile |
Median household income in 2021:
| Magnolia Park: | $43,509 |
| Houston: | $55,499 |
Median rent in in 2021:
| Magnolia Park: | $673 |
| Houston: | $974 |
Male vs Females
| Males: | 9,122 |
| Females: | 8,126 |
Median age
| Males: | 39.8 years |
| Females: | 36.4 years |
Average estimated value of detached houses in 2021 (64.3% of all units):
| Magnolia Park: | $107,502 |
| Houston: | $304,685 |
Most popular occupations of males: construction, extraction, and maintenance occupations (31.1%); production occupations (15.6%); service occupations (10.4%); material moving occupations (10.3%); sales and office occupations (9.6%); transportation occupations (7.3%); management occupations (except farmers) (1.6%)
Most popular occupations of females: service occupations (40.7%); sales and office occupations (31.2%); management occupations (except farmers) (3.7%); production occupations (3.6%); material moving occupations (3.3%); business and financial operations occupations (2.9%); life, physical, and social science occupations (2.9%)
Highways in this neighborhood: US Hwy 90 Alt (N Wayside Dr).
Roads and streets: Harrisburg Blvd; Sherman St; Navigation Blvd; Avenue E; Ave F; Canal St; Ave C; Ave H; Ave J; Ave K; Ave I; Avenue N; Ave B; Ave L; Capitol St; Ave O; S Sgt Macario Garcia Dr (69th St); N 67th St (67th St, N Cesar Chavez Blvd); Ave P; 75th St; Ave Q; N 76th St; 74th St (N 74th St); 77th St (N 77th St); Woodvale St; W Hedrick St; Terminal St; Baltimore St; Avenue S; Ave T; 66th St (N 66th St); N 78th St (78th St); Ave V; Ave U; Harbor Dr (J W Peavy Dr); E Hedrick St; Texas St; S 80th St; N 71st St; Glendale St; Ave R; S 79th St; Avenue W; Dayton St; 79th St (N 79th St); J W Peavy Dr; 70th St (N 70th St); 72nd St (N 72nd St); Elwood St; N 70th St; Maltby St; N 65th St; Ford St; N 71st St (71st St); N 80th St (80th St); J W Peavey Dr; S 78th St; Foster St; Goode St; Wooding St; 73rd St; Hudson St; S Sgt Macario Garcia Dr; Waycrest; Wingate St; Pineview Dr; Brays St; Canton St; Basin St; Holtcamp St; Dresden St; E Navigation Blvd (81st St); Eastgate St; S 77th St; Bedford St; S 74th St; Memphis St; Funston St; Glendora St; Phelps St; Beaumont St; S 75th St; Hanover St; N 69th St (S Sgt Macario Garcia Dr); S 69th St; S 70th St; Forest Hill Blvd; S 71st St; S 72nd St; Mason Ct; Inlane St; Mobile St; Jamaica St; Magnolia Tc Four Dr; Frank; Kemton St; Magnolia Tc Two Dr; Hughes St; S 66th St; S 65th St; Alton St; E Navigation Blvd (E 81st St, Navigation Blvd); Brady St; Terminal; P; S 74th 1/2 St; Zoltowski St; J; I; Neuhaus St; Magnolia Tc One Dr.
Railroad features: Houston Belt and Terminal Rlwy; Southern Pacific RR; Port Terminal RR.
Other features: Brays Byu.
Magnolia Park neighborhood detailed profile
Medical Center neighborhood in Houston statistics: (Find on map)
Area: 0.601 square miles
Roads and streets: Fannin St; S Main St (Main St); Holcombe Blvd; Bates; Bertner Ave (Bertner St); Outer Belt Dr; Shamrock Dr; Moursund St; N Macgregor Way; Travis St; Lamar Fleming St; Cortis; Herman Pressler; Taub Loop; S Braeswood Blvd; Braeswood Blvd; W Holcombe Blvd; Rosedale St; John Freeman St; Richard W Johnson Ave; Taub Rd; Dryden Rd; Old Main St; M D Anderson St; Wilkins St; Montclair Dr; C Frank Webb Plz (W Cullen St); E Cullen St; Bellows Ln; E Cullen Cir; W Cullen Cir; Southgate Blvd; University Blvd; S Macgregor Dr; Baylor Plz; John Freeman.
Medical Center neighborhood detailed profile
Memorial neighborhood in Houston statistics: (Find on map)
Area: 8.019 square miles
Population: 77,509
Population density:
Median household income in 2021:
Median rent in in 2021:
Male vs Females
Median age
Housing prices:
Average estimated value of detached houses in 2021 (45.6% of all units):
Average estimated value of townhouses or other attached units in 2021 (7.7% of all units):
Most popular occupations of males: management occupations (except farmers) (18.7%); sales and office occupations (14.6%); business and financial operations occupations (14.2%); architecture and engineering occupations (12.9%); computer and mathematical occupations (8.9%); construction, extraction, and maintenance occupations (5.9%); service occupations (5.2%)
Most popular occupations of females: sales and office occupations (28.4%); healthcare practitioners and technical occupations (20.1%); management occupations (except farmers) (13.0%); business and financial operations occupations (10.6%); education, training, and library occupations (6.2%); service occupations (5.2%); legal occupations (3.7%)
Limited-access highways (interstate or state) in this neighborhood: I- 10 (Katy Fwy, US Hwy 90); US Hwy 75 (I- 45, Gulf Fwy); I- 610 (W Loop Fwy).
Roads and streets: Memorial Dr; Washington Ave; Center St; Allen St; Westcott St; Blossom St; Feagan St; Rose St; Shepherd Dr; Kansas St; Schuler St; Summer St; Floyd St; Detering St; Darling St; W Memorial Loop Dr; Gibson St; Lillian St; Kiam St; Houston Ave; Crockett St; Memorial Loop Dr; Larkin St; Sabine St; Maxie St; Petty St; Reinerman St; Edwards St; Studemont St; Cornish St; Roy St; Birdsall St; Sandman St; S Picnic Ln; Katy Rd; Shearn St; Hempstead Rd; Dickson St; Knox St; Durham Dr; Spring St; Nolda St; Eigel St; Inker St; Malone St; Winter St; Silver St; Lubbock St; E Memorial Loop Dr; T C Jester Blvd; Sawyer St; Cohn St; White St; Crest Wood Dr; Patterson St; Asbury St; Parker St; Woodway Dr; Bingham St; Fowler St; Portwest Dr; Dart St; Colorado St; Arnot St; N Memorial Way; Goliad St; Taylor St; Nett St; Old Katy Rd; State St; Decatur St; Hemphill St; Eli St; Henderson St; Kane St; Johnson St; Hickory St; Holly St; Terrace Dr; Haskell St; Koehler St; Heights Blvd; Katy St; Katy Frwy Svc Rd; Reinecke St; Jackson Hill St; Spencer St; Hicks St; Thompson St; Yale St; Taggart St; Bonner St; Ovid St; Rodrigo St; Oliver St; Waugh Dr; Pickens St; Snover St; Sherwin St; Scotland St; Weber St; Radcliffe St; E Cowan Dr; Harvard St; Barnes St; Lacy St; Alamo St; Utah St; S Heights Blvd; W Cowan Dr; W 12th St; Hamman St; Egbert St; W 11th St; Glenwood Dr; Stillman St; Arabelle St; Durford Dr (Durford St); Elder St; Marina St; Union St; Roy Cir; Leverkuhn St; Wichman St; Venice St; Memorial Hts (Memorial Heights Dr); Prague St; Minola St; Patterson; Lakin St; Lester St; Coppage St; Calder St; Court St; Trinity; Moy St; Wagner St; Studer St; Mc Donald St; Willia St; Preston St; Girard St; O Reilly St; Bethje St; Truro St; Clyde St; Tyne St; Asbury Ave (Asbury St); Givens St; Riesner St; Langston St; Logan Ln; E 2nd St; Glen Cove St; Hartman St; Montrose Blvd; Portway Dr; Crooms St; Henderson; Olive St; E Bend Ln; Comira; Byway St; Penner St; East; Beachton St; Garvin Ct; Augusta St; Chester St; Franklin St; Sellers Rd; Depelchin St; W Terrace Dr; National St; Camelia St; Maxroy St; Wanita Pl; Artesian Pl; Chandler St; Brashear St; Sachs St; Dell St; Pennercrest St; Cortlandt St; Weens; Maud St; Martin Pl; Kessler St; Bayou Meadow Ln; E Terrace Dr; Butler St (Memorial Ct); Diesel; Morin Pl; Home St; Smith Dr; Bismark; Mellus St; Kelley St; Starkey St; Asbury Pl; Ware Ave; Raymond St; Waughford St; Bass Ct; Ash Pl; Hohl St; Epstein Ct; Aloe St; Brown; Capitol St; Sawyer; Birdsall Market Pl; Lakin; S Gate Stone; Mc Millan; Herd; Honsinger St; Bass St; Montana St; Custus St; Ida Bell St; Barber St; High St; Arnold; Colorado Ct; Dewey St; Floyd; Egbert; Wood Brg; W Sawyer St; Westcott; Abbott St; Kuhn; Bace Ct; Riesner.
Railroad features: Southern Pacific RR; Union Pacific RR.
Other features: Buffalo Byu; White Oak Byu.
Memorial neighborhood detailed profile
Area: 8.019 square miles
Population: 77,509
Population density:
| Memorial: | 9,665 people per square mile |
| Houston: | 3,947 people per square mile |
Median household income in 2021:
| Memorial: | $123,852 |
| Houston: | $55,499 |
Median rent in in 2021:
| Memorial: | $1,767 |
| Houston: | $974 |
Male vs Females
| Males: | 45,513 |
| Females: | 31,996 |
Median age
| Males: | 39.0 years |
| Females: | 35.8 years |
Housing prices:
Average estimated value of detached houses in 2021 (45.6% of all units):
| Memorial: | $429,989 |
| Houston: | $304,685 |
Average estimated value of townhouses or other attached units in 2021 (7.7% of all units):
| This neighborhood: | $409,365 |
| city: | $305,463 |
Most popular occupations of males: management occupations (except farmers) (18.7%); sales and office occupations (14.6%); business and financial operations occupations (14.2%); architecture and engineering occupations (12.9%); computer and mathematical occupations (8.9%); construction, extraction, and maintenance occupations (5.9%); service occupations (5.2%)
Most popular occupations of females: sales and office occupations (28.4%); healthcare practitioners and technical occupations (20.1%); management occupations (except farmers) (13.0%); business and financial operations occupations (10.6%); education, training, and library occupations (6.2%); service occupations (5.2%); legal occupations (3.7%)
Limited-access highways (interstate or state) in this neighborhood: I- 10 (Katy Fwy, US Hwy 90); US Hwy 75 (I- 45, Gulf Fwy); I- 610 (W Loop Fwy).
Roads and streets: Memorial Dr; Washington Ave; Center St; Allen St; Westcott St; Blossom St; Feagan St; Rose St; Shepherd Dr; Kansas St; Schuler St; Summer St; Floyd St; Detering St; Darling St; W Memorial Loop Dr; Gibson St; Lillian St; Kiam St; Houston Ave; Crockett St; Memorial Loop Dr; Larkin St; Sabine St; Maxie St; Petty St; Reinerman St; Edwards St; Studemont St; Cornish St; Roy St; Birdsall St; Sandman St; S Picnic Ln; Katy Rd; Shearn St; Hempstead Rd; Dickson St; Knox St; Durham Dr; Spring St; Nolda St; Eigel St; Inker St; Malone St; Winter St; Silver St; Lubbock St; E Memorial Loop Dr; T C Jester Blvd; Sawyer St; Cohn St; White St; Crest Wood Dr; Patterson St; Asbury St; Parker St; Woodway Dr; Bingham St; Fowler St; Portwest Dr; Dart St; Colorado St; Arnot St; N Memorial Way; Goliad St; Taylor St; Nett St; Old Katy Rd; State St; Decatur St; Hemphill St; Eli St; Henderson St; Kane St; Johnson St; Hickory St; Holly St; Terrace Dr; Haskell St; Koehler St; Heights Blvd; Katy St; Katy Frwy Svc Rd; Reinecke St; Jackson Hill St; Spencer St; Hicks St; Thompson St; Yale St; Taggart St; Bonner St; Ovid St; Rodrigo St; Oliver St; Waugh Dr; Pickens St; Snover St; Sherwin St; Scotland St; Weber St; Radcliffe St; E Cowan Dr; Harvard St; Barnes St; Lacy St; Alamo St; Utah St; S Heights Blvd; W Cowan Dr; W 12th St; Hamman St; Egbert St; W 11th St; Glenwood Dr; Stillman St; Arabelle St; Durford Dr (Durford St); Elder St; Marina St; Union St; Roy Cir; Leverkuhn St; Wichman St; Venice St; Memorial Hts (Memorial Heights Dr); Prague St; Minola St; Patterson; Lakin St; Lester St; Coppage St; Calder St; Court St; Trinity; Moy St; Wagner St; Studer St; Mc Donald St; Willia St; Preston St; Girard St; O Reilly St; Bethje St; Truro St; Clyde St; Tyne St; Asbury Ave (Asbury St); Givens St; Riesner St; Langston St; Logan Ln; E 2nd St; Glen Cove St; Hartman St; Montrose Blvd; Portway Dr; Crooms St; Henderson; Olive St; E Bend Ln; Comira; Byway St; Penner St; East; Beachton St; Garvin Ct; Augusta St; Chester St; Franklin St; Sellers Rd; Depelchin St; W Terrace Dr; National St; Camelia St; Maxroy St; Wanita Pl; Artesian Pl; Chandler St; Brashear St; Sachs St; Dell St; Pennercrest St; Cortlandt St; Weens; Maud St; Martin Pl; Kessler St; Bayou Meadow Ln; E Terrace Dr; Butler St (Memorial Ct); Diesel; Morin Pl; Home St; Smith Dr; Bismark; Mellus St; Kelley St; Starkey St; Asbury Pl; Ware Ave; Raymond St; Waughford St; Bass Ct; Ash Pl; Hohl St; Epstein Ct; Aloe St; Brown; Capitol St; Sawyer; Birdsall Market Pl; Lakin; S Gate Stone; Mc Millan; Herd; Honsinger St; Bass St; Montana St; Custus St; Ida Bell St; Barber St; High St; Arnold; Colorado Ct; Dewey St; Floyd; Egbert; Wood Brg; W Sawyer St; Westcott; Abbott St; Kuhn; Bace Ct; Riesner.
Railroad features: Southern Pacific RR; Union Pacific RR.
Other features: Buffalo Byu; White Oak Byu.
Memorial neighborhood detailed profile
Memorial Park neighborhood in Houston statistics: (Find on map)
Area: 10.729 square miles
Population: 46,702
Population density:
Median household income in 2021:
Median rent in in 2021:
Male vs Females
Median age
Housing prices:
Average estimated value of detached houses in 2021 (53.2% of all units):
Average estimated value of townhouses or other attached units in 2021 (20.6% of all units):
Average estimated '21 value of housing units in 3-to-4-unit structures (5.9% of all units):
Average estimated '21 value of housing units in 5-or-more-unit structures (54.6% of all units):
Most popular occupations of males: management occupations (except farmers) (30.5%); sales and office occupations (15.5%); business and financial operations occupations (13.1%); architecture and engineering occupations (8.3%); healthcare practitioners and technical occupations (6.9%); computer and mathematical occupations (4.4%); education, training, and library occupations (4.0%)
Most popular occupations of females: sales and office occupations (21.2%); management occupations (except farmers) (15.4%); business and financial operations occupations (11.7%); education, training, and library occupations (11.6%); healthcare practitioners and technical occupations (10.2%); service occupations (10.1%); arts, design, entertainment, sports, and media occupations (6.9%)
Limited-access highways (interstate or state) in this neighborhood: I- 10 (Katy Fwy, US Hwy 90).
Highways in this neighborhood: Sam Houston Pkwy (State Loop 8, Beltway 8); State Hwy 6 (Addicks Howell Rd); State Hwy 6.
Roads and streets: Memorial Dr; Kimberley Ln; Barryknoll Ln; Perthshire Rd; Old Katy Rd; Queensbury Ln; St Marys Ln; N Kirkwood Rd; Taylorcrest Rd; Kingsride Ln; Pebblebrook Dr; Pinerock Ln; Boheme Dr; Gessner Rd (Gessner Dr); Apple Tree Rd; W Forest Dr; Dairy Ashford St; Cindywood Dr; Carolcrest St; River Forest Dr; Broadgreen Dr; Britoak Ln; Eldridge Pkwy N (N Eldridge Pkwy); Kellywood Ln; Frostwood Dr; Plantation Rd; N Wilcrest Dr; Wycliffe Dr; Benignus Rd; Chadbourne Dr; Broken Bough Dr; Bramblewood Dr; Grisby Rd; Woodthorpe Ln; Yorkchester Dr; Tosca Ln; Wickchester Ln; Old Oaks Dr; Tully Rd; N Dairy Ashford Rd; Butterfly Ln; Electra Dr; Myrtlea Dr; Mossycup Dr; Country Place Dr; Indian Creek Rd; Overcup Dr; Oak Bend Dr; Brittmoore Rd; Hallie Dr; Crossroads Dr; Walkwood Dr; Kickerillo Dr; Hermitage Ln; Patchester Dr; Knipp Rd; Attingham Dr; Rip Van Winkle Dr; Cobblestone Dr; Ivy Wall Dr; Nottingham Oaks Trl; Westlake Park Blvd; Wilchester Blvd; Pinesap Dr; Trail Hollow Dr; Rancho Bauer Dr; Fern Dr; Broken Arrow Dr (Broken Arrow St); Ramblewood Rd; White Wing Ln; Tallowood Rd; Alchester Ln; Daria Dr; Bunker Hill Rd; Thicket Ln; Fleetwood Oaks Dr; Vanderpool Ln; Clear Spring Dr; Longleaf Ln; Town and Country Way; Wink Rd; Bateswood Dr; Conifer Rd; E Gaywood Dr; Threadneedle St; Hibury Dr; Plainwood Dr; Winter Oaks Dr; Glenchester Dr; W Gaywood Dr; Town and Country Blvd; Lasso Ln; Greenpark Dr; Misty Meadow Ln; Wickhollow Ln; Red Haw; Huntingwick Dr; Barkers Landing Rd; (City Rd To Water Plant); Foxgate Rd; Beauregard Dr; Regentview Dr; Hickory Ridge Dr; Memorial Mews St; Cinnamon Oak Ln; Twisted Oak Ln; Carlingford Ln; Still Meadow Dr; Turkey Trl; Hollow Dr; Paul Revere Dr; Briar Forest Dr; Stoney Creek Dr; Langwood Dr; Patti Lynn Ln; Hansel Ln; State Loop 8 (Sam Houston Pkwy); Strey Ln; Memorial Greens Dr; Fleetwood Place Dr; Durrette Dr; Gage Ct; Thistlewood Dr; S Barkers Landing Rd; Isolde Dr; Litchfield Ln; Faust Ln; Sugar Berry Cir; Heatherfield Dr; N Barkers Landing Rd; Sandalwood Dr; Southchester Ln; Black Haw; Tealwood Dr; Amoco Dr; Thornbranch Dr; Turkey Creek Dr; Traviata Dr; Mignon Ln; Westport Ln; Country Place Cir; Glenchester St; Fawnlake Dr; Lost Meadow Dr (Lost Meadow Ln); W Bough Ln; Gershwin Dr; Rummel Creek Rd; Cherrybark Ln; Havershire Ln; Cardinal Ln; Bluebird; Legend Ln; Stoneleigh Dr; Vindon Dr; Rocky Meadow Dr; Pecan Creek Dr; Diamond Leaf Ln; Commodore Way; Leaning Ash Ln; Whitewater Ln; W Fair Harbor Ln; Myrtlea Ln; Bendwood Dr; Hickory Post Ln; Southmayde Creek Dr; Westwick Forest Ln; Ashford Forest Dr; River Roads Dr; Cranberry Hill Dr; Wood Branch Park Dr; Talmadge Dr; Bison Dr; Warrenton Dr; Mayerling Dr; Figaro Dr; Silvergate Dr; Wax Myrtle Ln; Marywood Chase; Katy; Heathwick Ln; Quail Grove Ln; Bayou Knoll Dr; Morris; Naughton St; Woodbend Ln; Hollyridge Dr; S Durrette Dr; Gracie Ln; Hidden Cove; Windbreak Trl; Lasso; Highwood Rd; Bettina Ct (Bettina Ln); Memorial City Way; Shady Forest Dr; Riedel Dr; N Durrette Dr; la Quinta Ln; Greenbelt Dr; Autumn Oaks Dr; Last Arrow Dr; Longworth Ln; Anchorage Ln; la Costa Ln; Westlake Club Dr; Robinlake Ln; Riverlace Dr; Hidden Harbor St; Mooremeadow Ln; Bayou River Dr; Camelback Ct; Gretel Dr; Lookmoor; Memorial Village Dr; Sea Smoke Ln; Westlake Club; St Frances Ln; Flaghoist Ln; Mooreknoll Ln; E Fair Harbor Ln; Moordale Ln; Fairport Ln; Durley Dr; Steamboat Ln; Beechmont Rd; Camara Ln; Hudson Cir; Town & Country; Val Lena Dr; Kimberley Ct; Old Stone Trl; Reddleshire Ln; Perthshire Ln; Briar Knoll Dr; Lornmead Dr; Mackilsee Ln; Thornvine Ln; W Tri Oaks Ln; Bayou Shadows St; Trailville Dr; Cindywood Cir; St George Ln; Soboda Ct; Stafford St; Pepper Ln; Timber Cir; Coachlight Dr; Olney Oak Dr; Carolcrest Cir; Rainwood; Oarman Ct; Hudson Ct; Thornwick Dr; Turkey Trail Ct; Tunbridge Ln; Barkers Cove; Sibelius Ln; Earley Forest Ln; Barkers Point Ln; Woodstone; Duncaster Dr; Sandy Bluff St; Rock Cove; Sandy Port St; Comely Ln; Moorwick Ln; Patriot Ln; Haversham Dr; Island Grove Ct; Herdsman Dr; Radbrook Ln; Grasshopper Ln; Trademark Pl; Renoir Dr; Beaver Tail Pt; E Fair Harbor Cir; Lorrielake Ln; Morris Rd; Rowlock Ln; Valley Star Dr; Memorial Bend; Dairy Ashford Rd; Fortsmith St; Chadbourne Ct; Wickshire Ln; Fortsmith; Kahlden Ct; Cranberry Hill Ct; Matisse Dr; Queensmill Ct; Bayou River Ct; Redwood Place Dr; Foxgate Ct; Center Hill Dr; Verdi Dr; Jackson Ave; Lakemere St; Lee Shore Ln; Wren Ln; Rummel Creek Ct; Rummel Creek Dr; Hunters Den Dr; Claywood St (Claywood Ct); Briar Hill Dr; Briar Path Dr; Hickory Post Ct; Amberton Ln; Kickerillo Ct; Captains Walk; Dolphin Ct; Hibury Ct; Providence Park; Bow String Cove; Barryknoll Ct; Winding Brook Ln; Barracuda Ct; Spear Point Cove; Knipp Ct (Knipp Rd); Levin Ln; Fidelia Ct; Hermitage Ct; Daria Ct; Tanya Cir; River Forest Ct; Carlingford; St Ives Ct; Brenner Creek Ct; Tamerlaine Dr; Barkers Landing Ct; Vanderpool Ct; Butterfly Ct; Elk Run Cir; Walkwood Ct; Boheme Ct; Ivy Wall Ct; Timber; Gershwin Ct.
Other features: Buffalo Byu; Rummel Crk; Turkey Crk; Old South Mayde Crk; South Mayde Crk.
Memorial Park neighborhood detailed profile
Area: 10.729 square miles
Population: 46,702
Population density:
| Memorial Park: | 4,353 people per square mile |
| Houston: | 3,947 people per square mile |
Median household income in 2021:
| Memorial Park: | $163,960 |
| Houston: | $55,499 |
Median rent in in 2021:
| Memorial Park: | $1,632 |
| Houston: | $974 |
Male vs Females
| Males: | 22,995 |
| Females: | 23,706 |
Median age
| Males: | 42.0 years |
| Females: | 40.8 years |
Housing prices:
Average estimated value of detached houses in 2021 (53.2% of all units):
| Memorial Park: | $826,367 |
| Houston: | $304,685 |
Average estimated value of townhouses or other attached units in 2021 (20.6% of all units):
| This neighborhood: | $324,326 |
| city: | $305,463 |
Average estimated '21 value of housing units in 3-to-4-unit structures (5.9% of all units):
| Memorial Park: | $202,833 |
| city: | $184,874 |
Average estimated '21 value of housing units in 5-or-more-unit structures (54.6% of all units):
| Memorial Park: | $198,396 |
| Houston: | $227,414 |
Most popular occupations of males: management occupations (except farmers) (30.5%); sales and office occupations (15.5%); business and financial operations occupations (13.1%); architecture and engineering occupations (8.3%); healthcare practitioners and technical occupations (6.9%); computer and mathematical occupations (4.4%); education, training, and library occupations (4.0%)
Most popular occupations of females: sales and office occupations (21.2%); management occupations (except farmers) (15.4%); business and financial operations occupations (11.7%); education, training, and library occupations (11.6%); healthcare practitioners and technical occupations (10.2%); service occupations (10.1%); arts, design, entertainment, sports, and media occupations (6.9%)
Limited-access highways (interstate or state) in this neighborhood: I- 10 (Katy Fwy, US Hwy 90).
Highways in this neighborhood: Sam Houston Pkwy (State Loop 8, Beltway 8); State Hwy 6 (Addicks Howell Rd); State Hwy 6.
Roads and streets: Memorial Dr; Kimberley Ln; Barryknoll Ln; Perthshire Rd; Old Katy Rd; Queensbury Ln; St Marys Ln; N Kirkwood Rd; Taylorcrest Rd; Kingsride Ln; Pebblebrook Dr; Pinerock Ln; Boheme Dr; Gessner Rd (Gessner Dr); Apple Tree Rd; W Forest Dr; Dairy Ashford St; Cindywood Dr; Carolcrest St; River Forest Dr; Broadgreen Dr; Britoak Ln; Eldridge Pkwy N (N Eldridge Pkwy); Kellywood Ln; Frostwood Dr; Plantation Rd; N Wilcrest Dr; Wycliffe Dr; Benignus Rd; Chadbourne Dr; Broken Bough Dr; Bramblewood Dr; Grisby Rd; Woodthorpe Ln; Yorkchester Dr; Tosca Ln; Wickchester Ln; Old Oaks Dr; Tully Rd; N Dairy Ashford Rd; Butterfly Ln; Electra Dr; Myrtlea Dr; Mossycup Dr; Country Place Dr; Indian Creek Rd; Overcup Dr; Oak Bend Dr; Brittmoore Rd; Hallie Dr; Crossroads Dr; Walkwood Dr; Kickerillo Dr; Hermitage Ln; Patchester Dr; Knipp Rd; Attingham Dr; Rip Van Winkle Dr; Cobblestone Dr; Ivy Wall Dr; Nottingham Oaks Trl; Westlake Park Blvd; Wilchester Blvd; Pinesap Dr; Trail Hollow Dr; Rancho Bauer Dr; Fern Dr; Broken Arrow Dr (Broken Arrow St); Ramblewood Rd; White Wing Ln; Tallowood Rd; Alchester Ln; Daria Dr; Bunker Hill Rd; Thicket Ln; Fleetwood Oaks Dr; Vanderpool Ln; Clear Spring Dr; Longleaf Ln; Town and Country Way; Wink Rd; Bateswood Dr; Conifer Rd; E Gaywood Dr; Threadneedle St; Hibury Dr; Plainwood Dr; Winter Oaks Dr; Glenchester Dr; W Gaywood Dr; Town and Country Blvd; Lasso Ln; Greenpark Dr; Misty Meadow Ln; Wickhollow Ln; Red Haw; Huntingwick Dr; Barkers Landing Rd; (City Rd To Water Plant); Foxgate Rd; Beauregard Dr; Regentview Dr; Hickory Ridge Dr; Memorial Mews St; Cinnamon Oak Ln; Twisted Oak Ln; Carlingford Ln; Still Meadow Dr; Turkey Trl; Hollow Dr; Paul Revere Dr; Briar Forest Dr; Stoney Creek Dr; Langwood Dr; Patti Lynn Ln; Hansel Ln; State Loop 8 (Sam Houston Pkwy); Strey Ln; Memorial Greens Dr; Fleetwood Place Dr; Durrette Dr; Gage Ct; Thistlewood Dr; S Barkers Landing Rd; Isolde Dr; Litchfield Ln; Faust Ln; Sugar Berry Cir; Heatherfield Dr; N Barkers Landing Rd; Sandalwood Dr; Southchester Ln; Black Haw; Tealwood Dr; Amoco Dr; Thornbranch Dr; Turkey Creek Dr; Traviata Dr; Mignon Ln; Westport Ln; Country Place Cir; Glenchester St; Fawnlake Dr; Lost Meadow Dr (Lost Meadow Ln); W Bough Ln; Gershwin Dr; Rummel Creek Rd; Cherrybark Ln; Havershire Ln; Cardinal Ln; Bluebird; Legend Ln; Stoneleigh Dr; Vindon Dr; Rocky Meadow Dr; Pecan Creek Dr; Diamond Leaf Ln; Commodore Way; Leaning Ash Ln; Whitewater Ln; W Fair Harbor Ln; Myrtlea Ln; Bendwood Dr; Hickory Post Ln; Southmayde Creek Dr; Westwick Forest Ln; Ashford Forest Dr; River Roads Dr; Cranberry Hill Dr; Wood Branch Park Dr; Talmadge Dr; Bison Dr; Warrenton Dr; Mayerling Dr; Figaro Dr; Silvergate Dr; Wax Myrtle Ln; Marywood Chase; Katy; Heathwick Ln; Quail Grove Ln; Bayou Knoll Dr; Morris; Naughton St; Woodbend Ln; Hollyridge Dr; S Durrette Dr; Gracie Ln; Hidden Cove; Windbreak Trl; Lasso; Highwood Rd; Bettina Ct (Bettina Ln); Memorial City Way; Shady Forest Dr; Riedel Dr; N Durrette Dr; la Quinta Ln; Greenbelt Dr; Autumn Oaks Dr; Last Arrow Dr; Longworth Ln; Anchorage Ln; la Costa Ln; Westlake Club Dr; Robinlake Ln; Riverlace Dr; Hidden Harbor St; Mooremeadow Ln; Bayou River Dr; Camelback Ct; Gretel Dr; Lookmoor; Memorial Village Dr; Sea Smoke Ln; Westlake Club; St Frances Ln; Flaghoist Ln; Mooreknoll Ln; E Fair Harbor Ln; Moordale Ln; Fairport Ln; Durley Dr; Steamboat Ln; Beechmont Rd; Camara Ln; Hudson Cir; Town & Country; Val Lena Dr; Kimberley Ct; Old Stone Trl; Reddleshire Ln; Perthshire Ln; Briar Knoll Dr; Lornmead Dr; Mackilsee Ln; Thornvine Ln; W Tri Oaks Ln; Bayou Shadows St; Trailville Dr; Cindywood Cir; St George Ln; Soboda Ct; Stafford St; Pepper Ln; Timber Cir; Coachlight Dr; Olney Oak Dr; Carolcrest Cir; Rainwood; Oarman Ct; Hudson Ct; Thornwick Dr; Turkey Trail Ct; Tunbridge Ln; Barkers Cove; Sibelius Ln; Earley Forest Ln; Barkers Point Ln; Woodstone; Duncaster Dr; Sandy Bluff St; Rock Cove; Sandy Port St; Comely Ln; Moorwick Ln; Patriot Ln; Haversham Dr; Island Grove Ct; Herdsman Dr; Radbrook Ln; Grasshopper Ln; Trademark Pl; Renoir Dr; Beaver Tail Pt; E Fair Harbor Cir; Lorrielake Ln; Morris Rd; Rowlock Ln; Valley Star Dr; Memorial Bend; Dairy Ashford Rd; Fortsmith St; Chadbourne Ct; Wickshire Ln; Fortsmith; Kahlden Ct; Cranberry Hill Ct; Matisse Dr; Queensmill Ct; Bayou River Ct; Redwood Place Dr; Foxgate Ct; Center Hill Dr; Verdi Dr; Jackson Ave; Lakemere St; Lee Shore Ln; Wren Ln; Rummel Creek Ct; Rummel Creek Dr; Hunters Den Dr; Claywood St (Claywood Ct); Briar Hill Dr; Briar Path Dr; Hickory Post Ct; Amberton Ln; Kickerillo Ct; Captains Walk; Dolphin Ct; Hibury Ct; Providence Park; Bow String Cove; Barryknoll Ct; Winding Brook Ln; Barracuda Ct; Spear Point Cove; Knipp Ct (Knipp Rd); Levin Ln; Fidelia Ct; Hermitage Ct; Daria Ct; Tanya Cir; River Forest Ct; Carlingford; St Ives Ct; Brenner Creek Ct; Tamerlaine Dr; Barkers Landing Ct; Vanderpool Ct; Butterfly Ct; Elk Run Cir; Walkwood Ct; Boheme Ct; Ivy Wall Ct; Timber; Gershwin Ct.
Other features: Buffalo Byu; Rummel Crk; Turkey Crk; Old South Mayde Crk; South Mayde Crk.
Memorial Park neighborhood detailed profile
Midtown neighborhood in Houston statistics: (Find on map)
Area: 1.219 square miles
Population: 5,134
Population density:
Median household income in 2021:
Median rent in in 2021:
Male vs Females
Median age
Most popular occupations of males: business and financial operations occupations (20.5%); architecture and engineering occupations (12.5%); management occupations (except farmers) (12.1%); healthcare practitioners and technical occupations (11.3%); sales and office occupations (10.0%); transportation occupations (7.1%); computer and mathematical occupations (6.1%)
Most popular occupations of females: service occupations (31.1%); healthcare practitioners and technical occupations (18.4%); business and financial operations occupations (18.0%); sales and office occupations (13.1%); education, training, and library occupations (6.7%); transportation occupations (5.4%); architecture and engineering occupations (4.5%)
Limited-access highways (interstate or state) in this neighborhood: I- 45 (Gulf Fwy).
Highways in this neighborhood: Eastex Fwy (US Hwy 59); State Spur 527; US Hwy 59 (Southwest Fwy).
Roads and streets: Main St; Fannin St; San Jacinto St; McGowen St; Tuam St; Travis St; Austin St; Webster St; Gray St; Dennis St; la Branch St; Caroline St; Hadley St; Drew St; Milam St; Elgin St; Chenevert St; Crawford St; Louisiana St; Anita St; Holman St; Smith St; Jackson St; Stuart St; Francis St; Rosalie St; Brazos St; McIlhenny St; Truxillo St; Bagby St; Alabama St; Winbern St; Baldwin St; Bremond St; Isabella St; Berry St; Cleburne St; Helena St; Pierce St; Eagle St; Almeda Rd; Wheeler St; US Hwy 59 (Hamilton St); Oak Pl; Albany St; Ruth St; Pierce; Day; W Webster St; Sutton St; Rosewood St; Richmond Ave; Cook St; Colquitt St; Heiner St; W Main St; Boston St; W Alabama St; Dennis; Barbee St; Mc Ilhenny St; Calhoun Ave; Brandt St; Mosley Ct; Oak Ct; Gillette St; Truxillo; Holman Ct; Bailey St; Cushing St; Louisiana.
Midtown neighborhood detailed profile
Area: 1.219 square miles
Population: 5,134
Population density:
| Midtown: | 4,213 people per square mile |
| Houston: | 3,947 people per square mile |
Median household income in 2021:
| Midtown: | $96,528 |
| Houston: | $55,499 |
Median rent in in 2021:
| Midtown: | $835 |
| Houston: | $974 |
Male vs Females
| Males: | 2,748 |
| Females: | 2,386 |
Median age
| Males: | 36.8 years |
| Females: | 31.5 years |
Most popular occupations of males: business and financial operations occupations (20.5%); architecture and engineering occupations (12.5%); management occupations (except farmers) (12.1%); healthcare practitioners and technical occupations (11.3%); sales and office occupations (10.0%); transportation occupations (7.1%); computer and mathematical occupations (6.1%)
Most popular occupations of females: service occupations (31.1%); healthcare practitioners and technical occupations (18.4%); business and financial operations occupations (18.0%); sales and office occupations (13.1%); education, training, and library occupations (6.7%); transportation occupations (5.4%); architecture and engineering occupations (4.5%)
Limited-access highways (interstate or state) in this neighborhood: I- 45 (Gulf Fwy).
Highways in this neighborhood: Eastex Fwy (US Hwy 59); State Spur 527; US Hwy 59 (Southwest Fwy).
Roads and streets: Main St; Fannin St; San Jacinto St; McGowen St; Tuam St; Travis St; Austin St; Webster St; Gray St; Dennis St; la Branch St; Caroline St; Hadley St; Drew St; Milam St; Elgin St; Chenevert St; Crawford St; Louisiana St; Anita St; Holman St; Smith St; Jackson St; Stuart St; Francis St; Rosalie St; Brazos St; McIlhenny St; Truxillo St; Bagby St; Alabama St; Winbern St; Baldwin St; Bremond St; Isabella St; Berry St; Cleburne St; Helena St; Pierce St; Eagle St; Almeda Rd; Wheeler St; US Hwy 59 (Hamilton St); Oak Pl; Albany St; Ruth St; Pierce; Day; W Webster St; Sutton St; Rosewood St; Richmond Ave; Cook St; Colquitt St; Heiner St; W Main St; Boston St; W Alabama St; Dennis; Barbee St; Mc Ilhenny St; Calhoun Ave; Brandt St; Mosley Ct; Oak Ct; Gillette St; Truxillo; Holman Ct; Bailey St; Cushing St; Louisiana.
Midtown neighborhood detailed profile
Minnetex neighborhood in Houston statistics: (Find on map)
Area: 8.511 square miles
Population: 17,731
Population density:
Median household income in 2021:
Median rent in in 2021:
Male vs Females
Median age
Housing prices:
Average estimated value of detached houses in 2021 (58.6% of all units):
Average estimated value of townhouses or other attached units in 2021 (2.5% of all units):
Most popular occupations of males: service occupations (21.3%); transportation occupations (15.6%); construction, extraction, and maintenance occupations (9.6%); production occupations (8.8%); sales and office occupations (7.4%); healthcare practitioners and technical occupations (6.3%); material moving occupations (4.8%)
Most popular occupations of females: service occupations (54.4%); education, training, and library occupations (19.2%); sales and office occupations (14.1%); business and financial operations occupations (6.0%); management occupations (except farmers) (5.7%)
Other features: Clear Crk.
Highways in this neighborhood: Beltway 8 (Sam Houston Pkwy, State Loop 8).
Roads and streets: Mykawa Rd; Schurmier Rd; Allison Rd; Fuqua St; Almeda-Genoa Rd; S Wayside Dr; Martindale Rd; Cottingham St; Foxton Rd; Mary Kay Ln; Willardville Rd; Selinsky Rd; Carson Rd; S Acres Dr; Madden Ln; Old Chocolate Bayou Rd; Carter; Dagg Rd; Airport Blvd; Scarlet Dr; Max Rd; Kier Rd; Glengarry Rd; Lincolnshire Rd; Grosbeak Dr; Osprey Dr; Trescon Dr; Sesame; Journey Rd; Border; Station Dr; Cullen Blvd (Co Rd 865); Cottingham Rd; Wenlock Dr; Perth St; Blue Heron Ln; Chickadee Ln; Gallinule Ln; Linnet Ln; Kilnar; Lea St; Hertford St; Burk; Mc Doyle Rd; Stoneham Ave (Stonham St); Hendricksen; Border St; Megginson St; Swansea St; Sesame St; Dunwick St; Pembroke St; Beela Rd; Jamie Ln; Thelma Ann Ln; Bluejay St; Edway; Keenan; Santa Rosa; Thistle; Dillon St; Garner Rd.
Railroad features: at and Sf Rlwy.
Other features: Clear Crk; Sims Byu.
Minnetex neighborhood detailed profile
Area: 8.511 square miles
Population: 17,731
Population density:
| Minnetex: | 2,083 people per square mile |
| Houston: | 3,947 people per square mile |
Median household income in 2021:
| Minnetex: | $48,920 |
| Houston: | $55,499 |
Median rent in in 2021:
| Minnetex: | $669 |
| Houston: | $974 |
Male vs Females
| Males: | 7,563 |
| Females: | 10,168 |
Median age
| Males: | 33.9 years |
| Females: | 34.8 years |
Housing prices:
Average estimated value of detached houses in 2021 (58.6% of all units):
| Minnetex: | $176,882 |
| Houston: | $304,685 |
Average estimated value of townhouses or other attached units in 2021 (2.5% of all units):
| This neighborhood: | $158,850 |
| city: | $305,463 |
Most popular occupations of males: service occupations (21.3%); transportation occupations (15.6%); construction, extraction, and maintenance occupations (9.6%); production occupations (8.8%); sales and office occupations (7.4%); healthcare practitioners and technical occupations (6.3%); material moving occupations (4.8%)
Most popular occupations of females: service occupations (54.4%); education, training, and library occupations (19.2%); sales and office occupations (14.1%); business and financial operations occupations (6.0%); management occupations (except farmers) (5.7%)
Other features: Clear Crk.
Highways in this neighborhood: Beltway 8 (Sam Houston Pkwy, State Loop 8).
Roads and streets: Mykawa Rd; Schurmier Rd; Allison Rd; Fuqua St; Almeda-Genoa Rd; S Wayside Dr; Martindale Rd; Cottingham St; Foxton Rd; Mary Kay Ln; Willardville Rd; Selinsky Rd; Carson Rd; S Acres Dr; Madden Ln; Old Chocolate Bayou Rd; Carter; Dagg Rd; Airport Blvd; Scarlet Dr; Max Rd; Kier Rd; Glengarry Rd; Lincolnshire Rd; Grosbeak Dr; Osprey Dr; Trescon Dr; Sesame; Journey Rd; Border; Station Dr; Cullen Blvd (Co Rd 865); Cottingham Rd; Wenlock Dr; Perth St; Blue Heron Ln; Chickadee Ln; Gallinule Ln; Linnet Ln; Kilnar; Lea St; Hertford St; Burk; Mc Doyle Rd; Stoneham Ave (Stonham St); Hendricksen; Border St; Megginson St; Swansea St; Sesame St; Dunwick St; Pembroke St; Beela Rd; Jamie Ln; Thelma Ann Ln; Bluejay St; Edway; Keenan; Santa Rosa; Thistle; Dillon St; Garner Rd.
Railroad features: at and Sf Rlwy.
Other features: Clear Crk; Sims Byu.
Minnetex neighborhood detailed profile
Monticello neighborhood in Houston statistics: (Find on map)
Area: 0.138 square miles
Population: 1,261
Population density:
Median household income in 2021:
Median rent in in 2021:
Male vs Females
Median age
Housing prices:
Average estimated value of detached houses in 2021 (96.6% of all units):
Average estimated value of townhouses or other attached units in 2021 (3.8% of all units):
Most popular occupations of males: management occupations (except farmers) (33.5%); business and financial operations occupations (13.4%); sales and office occupations (10.7%); healthcare practitioners and technical occupations (10.5%); service occupations (8.7%); education, training, and library occupations (7.8%); legal occupations (7.3%)
Most popular occupations of females: business and financial operations occupations (26.8%); education, training, and library occupations (15.1%); computer and mathematical occupations (12.1%); sales and office occupations (10.8%); legal occupations (9.7%); arts, design, entertainment, sports, and media occupations (9.5%); healthcare practitioners and technical occupations (8.7%)
Roads and streets: Belmont St; Wakeforest St; Nottingham St; Sunset Blvd; Albans Rd; Wroxton Rd; Robinhood St; Quenby St; Tangley St; Plumb St.
Monticello neighborhood detailed profile
Area: 0.138 square miles
Population: 1,261
Population density:
| Monticello: | 9,161 people per square mile |
| Houston: | 3,947 people per square mile |
Median household income in 2021:
| Monticello: | $249,165 |
| Houston: | $55,499 |
Median rent in in 2021:
| Monticello: | $3,501 |
| Houston: | $974 |
Male vs Females
| Males: | 718 |
| Females: | 542 |
Median age
| Males: | 38.9 years |
| Females: | 44.0 years |
Housing prices:
Average estimated value of detached houses in 2021 (96.6% of all units):
| Monticello: | $1,364,967 |
| Houston: | $304,685 |
Average estimated value of townhouses or other attached units in 2021 (3.8% of all units):
| This neighborhood: | $637,424 |
| city: | $305,463 |
Most popular occupations of males: management occupations (except farmers) (33.5%); business and financial operations occupations (13.4%); sales and office occupations (10.7%); healthcare practitioners and technical occupations (10.5%); service occupations (8.7%); education, training, and library occupations (7.8%); legal occupations (7.3%)
Most popular occupations of females: business and financial operations occupations (26.8%); education, training, and library occupations (15.1%); computer and mathematical occupations (12.1%); sales and office occupations (10.8%); legal occupations (9.7%); arts, design, entertainment, sports, and media occupations (9.5%); healthcare practitioners and technical occupations (8.7%)
Roads and streets: Belmont St; Wakeforest St; Nottingham St; Sunset Blvd; Albans Rd; Wroxton Rd; Robinhood St; Quenby St; Tangley St; Plumb St.
Monticello neighborhood detailed profile
Montrose neighborhood in Houston statistics: (Find on map)
Area: 3.112 square miles
Population: 28,053
Population density:
Median household income in 2021:
Median rent in in 2021:
Male vs Females
Median age
Housing prices:
Average estimated value of detached houses in 2021 (17.7% of all units):
Average estimated value of townhouses or other attached units in 2021 (11.1% of all units):
Most popular occupations of males: sales and office occupations (21.3%); management occupations (except farmers) (16.8%); healthcare practitioners and technical occupations (12.3%); education, training, and library occupations (11.7%); business and financial operations occupations (7.4%); architecture and engineering occupations (5.8%); computer and mathematical occupations (5.5%)
Most popular occupations of females: healthcare practitioners and technical occupations (18.4%); sales and office occupations (15.8%); management occupations (except farmers) (15.4%); arts, design, entertainment, sports, and media occupations (13.5%); service occupations (8.1%); education, training, and library occupations (7.8%); life, physical, and social science occupations (5.5%)
Highways in this neighborhood: US Hwy 59 (Southwest Fwy); State Spur 527.
Roads and streets: Montrose Blvd; Stanford St; Dunlavy St; Westheimer Rd; W Alabama St; Fairview St; Marshall St; Allen Pkwy; Woodhead St; Welch St; W Clay St; Hawthorne St; W Gray St; Richmond Ave; Hazard St; Sul Ross St; Harold St; Kipling St; Colquitt St; W Main St; Branard St; Taft St; Peden St; Waugh Dr; W Dallas Ave (W Dallas St); Yupon St; Yoakum Blvd; Driscoll St; Mandell St; Hyde Park Blvd; Willard St; Mount Vernon St; Graustark St; W Drew St; Indiana St; W Bell St; Crocker St; Bomar St; Missouri St; Roseland St; Mason St; Commonwealth St; Vermont St; Haddon St; Elmen St; Park St; Morse St; Whitney St; California St; Van Buren St; Lovett Blvd; Pacific St; W Pierce St; Garrott St; Avondale St; Genesee St; Ridgewood St; Castle Ct; Norfolk St; Windsor St; Greeley St; W Lamar St; D Amico St; Maryland St; Bonnie Brae St; Grant St; Fargo St; Mulberry St; Hopkins St; Jack St; Rochow St; Michigan St; Stratford St; Rosine St; Eberhard St; Morgan St; Oakley St; Mc Duffie St; Jackson Blvd; Hyde Park Cres; Nevada St; Woodrow St; Columbus St; Marconi St; W Dallas St; Converse St; Portsmouth St; Lexington St; Audubon Pl; Flora St; Emerson St; Westmoreland St; W McKinney St; W Saulnier St; W Polk Ave; Cherryhurst St; Haver St; Temple Dr; Marston St; Hazel St; Gross St; Joe Annie St; Bute St; Kenwood Ln; W Mc Kinney St; Lamar St; Kyle St; Ralph St; Missouri Pl (Missouri St); Helena St; Loretto Dr; Leonidas; la Rue St; Peveto St; Metropolitan; Tirrell St; Burlington St; Brandt St; Baldwin St; W Webster St; O Neil St; Andrews St; Entrance 2 Dr; Lincoln St; Rylis St; Buffalo Ter; Rhode Pl; Cleveland St; W Walker Ave; Damon Ct; Wauchcrest; Vick St; Newhouse St; Alpha St; Pierce; Bell; Castle Court Pl; Kueter; Wilkenson St; Miramar St; Robita St; Rylis; Ruthven St; Victor St; Upas; Milam (State Spur 527); Elsbury St; Peveto; W McKinney St (W McKinney Dr); Greenwich Terrace Dr (Sweetwood Dr); Rosine; Buel Ct; Victor Aly; Leonidas St; Pacific.
Railroad features: Southern Pacific RR.
Montrose neighborhood detailed profile
Area: 3.112 square miles
Population: 28,053
Population density:
| Montrose: | 9,014 people per square mile |
| Houston: | 3,947 people per square mile |
Median household income in 2021:
| Montrose: | $143,029 |
| Houston: | $55,499 |
Median rent in in 2021:
| Montrose: | $1,561 |
| Houston: | $974 |
Male vs Females
| Males: | 15,220 |
| Females: | 12,832 |
Median age
| Males: | 39.4 years |
| Females: | 42.3 years |
Housing prices:
Average estimated value of detached houses in 2021 (17.7% of all units):
| Montrose: | $761,243 |
| Houston: | $304,685 |
Average estimated value of townhouses or other attached units in 2021 (11.1% of all units):
| This neighborhood: | $535,915 |
| city: | $305,463 |
Most popular occupations of males: sales and office occupations (21.3%); management occupations (except farmers) (16.8%); healthcare practitioners and technical occupations (12.3%); education, training, and library occupations (11.7%); business and financial operations occupations (7.4%); architecture and engineering occupations (5.8%); computer and mathematical occupations (5.5%)
Most popular occupations of females: healthcare practitioners and technical occupations (18.4%); sales and office occupations (15.8%); management occupations (except farmers) (15.4%); arts, design, entertainment, sports, and media occupations (13.5%); service occupations (8.1%); education, training, and library occupations (7.8%); life, physical, and social science occupations (5.5%)
Highways in this neighborhood: US Hwy 59 (Southwest Fwy); State Spur 527.
Roads and streets: Montrose Blvd; Stanford St; Dunlavy St; Westheimer Rd; W Alabama St; Fairview St; Marshall St; Allen Pkwy; Woodhead St; Welch St; W Clay St; Hawthorne St; W Gray St; Richmond Ave; Hazard St; Sul Ross St; Harold St; Kipling St; Colquitt St; W Main St; Branard St; Taft St; Peden St; Waugh Dr; W Dallas Ave (W Dallas St); Yupon St; Yoakum Blvd; Driscoll St; Mandell St; Hyde Park Blvd; Willard St; Mount Vernon St; Graustark St; W Drew St; Indiana St; W Bell St; Crocker St; Bomar St; Missouri St; Roseland St; Mason St; Commonwealth St; Vermont St; Haddon St; Elmen St; Park St; Morse St; Whitney St; California St; Van Buren St; Lovett Blvd; Pacific St; W Pierce St; Garrott St; Avondale St; Genesee St; Ridgewood St; Castle Ct; Norfolk St; Windsor St; Greeley St; W Lamar St; D Amico St; Maryland St; Bonnie Brae St; Grant St; Fargo St; Mulberry St; Hopkins St; Jack St; Rochow St; Michigan St; Stratford St; Rosine St; Eberhard St; Morgan St; Oakley St; Mc Duffie St; Jackson Blvd; Hyde Park Cres; Nevada St; Woodrow St; Columbus St; Marconi St; W Dallas St; Converse St; Portsmouth St; Lexington St; Audubon Pl; Flora St; Emerson St; Westmoreland St; W McKinney St; W Saulnier St; W Polk Ave; Cherryhurst St; Haver St; Temple Dr; Marston St; Hazel St; Gross St; Joe Annie St; Bute St; Kenwood Ln; W Mc Kinney St; Lamar St; Kyle St; Ralph St; Missouri Pl (Missouri St); Helena St; Loretto Dr; Leonidas; la Rue St; Peveto St; Metropolitan; Tirrell St; Burlington St; Brandt St; Baldwin St; W Webster St; O Neil St; Andrews St; Entrance 2 Dr; Lincoln St; Rylis St; Buffalo Ter; Rhode Pl; Cleveland St; W Walker Ave; Damon Ct; Wauchcrest; Vick St; Newhouse St; Alpha St; Pierce; Bell; Castle Court Pl; Kueter; Wilkenson St; Miramar St; Robita St; Rylis; Ruthven St; Victor St; Upas; Milam (State Spur 527); Elsbury St; Peveto; W McKinney St (W McKinney Dr); Greenwich Terrace Dr (Sweetwood Dr); Rosine; Buel Ct; Victor Aly; Leonidas St; Pacific.
Railroad features: Southern Pacific RR.
Montrose neighborhood detailed profile
Museum District neighborhood in Houston statistics: (Find on map)
Area: 3.823 square miles
Population: 45,742
Population density:
Median household income in 2021:
Median rent in in 2021:
Male vs Females
Median age
Housing prices:
Average estimated value of detached houses in 2021 (36.8% of all units):
Average estimated value of townhouses or other attached units in 2021 (15.1% of all units):
Average estimated '21 value of housing units in 5-or-more-unit structures (39.6% of all units):
Most popular occupations of males: sales and office occupations (19.0%); healthcare practitioners and technical occupations (16.0%); education, training, and library occupations (13.0%); management occupations (except farmers) (12.9%); business and financial operations occupations (10.6%); legal occupations (5.7%); computer and mathematical occupations (5.5%)
Most popular occupations of females: healthcare practitioners and technical occupations (17.8%); management occupations (except farmers) (16.0%); arts, design, entertainment, sports, and media occupations (15.4%); education, training, and library occupations (12.4%); sales and office occupations (11.9%); service occupations (6.0%); life, physical, and social science occupations (5.9%)
Highways in this neighborhood: US Hwy 59 (Southwest Fwy); State Spur 527.
Roads and streets: W Alabama St; Richmond Ave; Colquitt St; W Main St; Marshall St; Sul Ross St; Main St; Branard St; Harold St; Fannin St; San Jacinto St; Kipling St; Hawthorne St; Austin St; la Branch St; Almeda Rd (FM 521); Bissonnet St; Caroline St; Hazard St; Mandell St; Banks St; Milford St; S Shepherd Dr; Montrose Blvd; Mount Vernon St; Sunset Blvd; Yoakum Blvd; Graustark St; Dunlavy St; Woodhead St; Chenevert St; Crawford St; Westheimer Rd; South Blvd; North Blvd; Jackson St; Roseland St; Holman St; Rosedale St; Vassar St; Travis St; Hermann Circle Dr (Hermann Loop Dr); Hermann Dr; Oakdale St; Stuart St; Francis St; Norfolk St; Ewing St; Southmore Blvd; Binz St; Calumet St; Wichita St; Yupon St; Stanford St; Prospect St; Isabella St; Blodgett St; Truxillo St; Alabama St; Cleburne St; Wheeler St; Ruth St; Wentworth St; Lexington St; Albans Rd; Garrott St; Lovett Blvd; Greenbriar St; Winbern St; Rosewood St; Chartres St; Portsmouth St; Greeley St; Palm St; Castle Ct; Berry St; Milam St; Wroxton Rd; Bonnie Brae St; Eagle St; Mulberry St; Jack St; Bartlett St; Mc Duffie St; Remington Ln; Louisiana St; Barkdull St; Oakley St; Wilton St; Kent St; Elgin St; Driscoll St; Berthea St; Woodrow St; Barbee St; Courtlandt Pl; Bayard Ln; Cherokee St; Chelsea Blvd; Brandt St; Ashby St; Emerson St; Autrey St; Portland St; Audubon Pl; Westmoreland St; Flora St; Bolsover St; Shadow Lawn St; Bute St; Rice Blvd; Dora St; Arbor Pl; Arbor St; Burlington St; Parkway Dr; Concert Dr; Kenwood Ln; Farnham St; S Sandman St; Smith St; Kyle St; Longfellow Ln; Huldy St; Loretto Dr; Baldwin St; Peckham St; Brazos St; Pinedale St; Institute Ln; Wroxton Ct; Wentworth Ave (Wentworth St); Day; California St; Dunstan Rd; Hermann Lake Spr; City Club Dr; Hamilton St; Milam (State Spur 527); Waverly Ct; West Blvd; Herman Loop Dr; Castle Court Pl; Taft St; Whitney St; Golf Course Dr; Miramar St; Sculpture Garden One Dr; Mosley Ct; S Freeway Fwy; Crawford; Hermann Lake Dr; St Emanuel St; W 11th St; Windsor St; Mc Duffie; Elsbury St; Bowden St; Truxillo; Holman Ct; Southhampton Ests; Ridgewood St; Main.
Museum District neighborhood detailed profile
Area: 3.823 square miles
Population: 45,742
Population density:
| Museum District: | 11,965 people per square mile |
| Houston: | 3,947 people per square mile |
Median household income in 2021:
| Museum District: | $166,235 |
| Houston: | $55,499 |
Median rent in in 2021:
| Museum District: | $1,463 |
| Houston: | $974 |
Male vs Females
| Males: | 24,025 |
| Females: | 21,716 |
Median age
| Males: | 42.8 years |
| Females: | 41.9 years |
Housing prices:
Average estimated value of detached houses in 2021 (36.8% of all units):
| Museum District: | $965,367 |
| Houston: | $304,685 |
Average estimated value of townhouses or other attached units in 2021 (15.1% of all units):
| This neighborhood: | $536,286 |
| city: | $305,463 |
Average estimated '21 value of housing units in 5-or-more-unit structures (39.6% of all units):
| Museum District: | $650,530 |
| Houston: | $227,414 |
Most popular occupations of males: sales and office occupations (19.0%); healthcare practitioners and technical occupations (16.0%); education, training, and library occupations (13.0%); management occupations (except farmers) (12.9%); business and financial operations occupations (10.6%); legal occupations (5.7%); computer and mathematical occupations (5.5%)
Most popular occupations of females: healthcare practitioners and technical occupations (17.8%); management occupations (except farmers) (16.0%); arts, design, entertainment, sports, and media occupations (15.4%); education, training, and library occupations (12.4%); sales and office occupations (11.9%); service occupations (6.0%); life, physical, and social science occupations (5.9%)
Highways in this neighborhood: US Hwy 59 (Southwest Fwy); State Spur 527.
Roads and streets: W Alabama St; Richmond Ave; Colquitt St; W Main St; Marshall St; Sul Ross St; Main St; Branard St; Harold St; Fannin St; San Jacinto St; Kipling St; Hawthorne St; Austin St; la Branch St; Almeda Rd (FM 521); Bissonnet St; Caroline St; Hazard St; Mandell St; Banks St; Milford St; S Shepherd Dr; Montrose Blvd; Mount Vernon St; Sunset Blvd; Yoakum Blvd; Graustark St; Dunlavy St; Woodhead St; Chenevert St; Crawford St; Westheimer Rd; South Blvd; North Blvd; Jackson St; Roseland St; Holman St; Rosedale St; Vassar St; Travis St; Hermann Circle Dr (Hermann Loop Dr); Hermann Dr; Oakdale St; Stuart St; Francis St; Norfolk St; Ewing St; Southmore Blvd; Binz St; Calumet St; Wichita St; Yupon St; Stanford St; Prospect St; Isabella St; Blodgett St; Truxillo St; Alabama St; Cleburne St; Wheeler St; Ruth St; Wentworth St; Lexington St; Albans Rd; Garrott St; Lovett Blvd; Greenbriar St; Winbern St; Rosewood St; Chartres St; Portsmouth St; Greeley St; Palm St; Castle Ct; Berry St; Milam St; Wroxton Rd; Bonnie Brae St; Eagle St; Mulberry St; Jack St; Bartlett St; Mc Duffie St; Remington Ln; Louisiana St; Barkdull St; Oakley St; Wilton St; Kent St; Elgin St; Driscoll St; Berthea St; Woodrow St; Barbee St; Courtlandt Pl; Bayard Ln; Cherokee St; Chelsea Blvd; Brandt St; Ashby St; Emerson St; Autrey St; Portland St; Audubon Pl; Westmoreland St; Flora St; Bolsover St; Shadow Lawn St; Bute St; Rice Blvd; Dora St; Arbor Pl; Arbor St; Burlington St; Parkway Dr; Concert Dr; Kenwood Ln; Farnham St; S Sandman St; Smith St; Kyle St; Longfellow Ln; Huldy St; Loretto Dr; Baldwin St; Peckham St; Brazos St; Pinedale St; Institute Ln; Wroxton Ct; Wentworth Ave (Wentworth St); Day; California St; Dunstan Rd; Hermann Lake Spr; City Club Dr; Hamilton St; Milam (State Spur 527); Waverly Ct; West Blvd; Herman Loop Dr; Castle Court Pl; Taft St; Whitney St; Golf Course Dr; Miramar St; Sculpture Garden One Dr; Mosley Ct; S Freeway Fwy; Crawford; Hermann Lake Dr; St Emanuel St; W 11th St; Windsor St; Mc Duffie; Elsbury St; Bowden St; Truxillo; Holman Ct; Southhampton Ests; Ridgewood St; Main.
Museum District neighborhood detailed profile
Myerland neighborhood in Houston statistics: (Find on map)
Area: 4.637 square miles
Population: 22,835
Population density:
Median household income in 2021:
Median rent in in 2021:
Male vs Females
Median age
Housing prices:
Average estimated value of detached houses in 2021 (84.6% of all units):
Average estimated '21 value of housing units in 5-or-more-unit structures (16.2% of all units):
Most popular occupations of males: management occupations (except farmers) (20.7%); sales and office occupations (17.3%); business and financial operations occupations (8.1%); computer and mathematical occupations (7.9%); architecture and engineering occupations (7.2%); education, training, and library occupations (6.3%); healthcare practitioners and technical occupations (5.8%)
Most popular occupations of females: sales and office occupations (18.6%); management occupations (except farmers) (13.9%); education, training, and library occupations (12.9%); business and financial operations occupations (12.8%); healthcare practitioners and technical occupations (12.0%); service occupations (10.9%); legal occupations (4.3%)
Limited-access highways (interstate or state) in this neighborhood: W Loop Fwy (I- 610).
Roads and streets: Chimney Rock Rd; S Braeswood Blvd; Yarwell Dr; Beechnut St; N Braeswood Blvd; Dumfries Dr; S Post Oak Rd; Wigton Dr; Rutherglenn Dr; Valkeith Dr; Cheena Dr; Jason St; S Rice Ave; Braesheather Dr; Jackwood St; Braesvalley Dr; Indigo St; Queensloch Dr; Lymbar Dr; Willowbend Blvd; Mullins Dr; Braesmont Dr; Darnell St; Imogene St; Loch Lomond Dr; Paisley Ln (Paisley St); Grape Rd (Grape St); Carew St; W Bellfort St; Renwick Dr; Birdwood Rd; Edith St; Manhattan Dr; Pontiac Dr; Glenmeadow Dr; Hillcroft Ave (Hillcroft St); Willowgrove Dr; Endicott Ln; Ferris Dr; Kuldell Dr; Ariel St; Bob White Dr; Cedarhurst Dr; Braewick Dr; Bayou Bridge Dr; Prichett Dr; Valerie St; Caversham Dr; Atwell Dr; S Atwell Dr; Landsdowne Dr; Heatherglen Dr; Ashcroft Dr; Glenfield Ct; Runnymeade Dr; O Meara Dr (Omeara Dr); Balmforth Ln; Moonlight Dr; Meyer Park Dr; Meyer Forest Dr; Doud Rd; Albury Dr; Frankway Dr; Contour Pl; Willowisp Dr; Cheltenham Dr; Millbury Dr; Mc Dermed Dr; Waycross St; Sylmar Rd; Pine St; Rampart St; Reamer St; Hazelton St; Grape St; Dunlap; Holly St; Flack Dr (Flack St); Waynesboro Dr; Meyer Park Blvd; Burdine St; Nenana Dr; Quebec Dr; Sager Dr; Checkerboard St; Knickerbocker St; Tonawanda Dr; S Renwick Dr; Clematis Ln; Hazen St; Doud St; Picasso Pl; Piermain Dr; Shadow Crest St; Scofield Ln; Brig O Doon Cir; Newcastle Dr; Maple St; Cadman Ct; Brooding Oak Cir; Loop Fwy; Cranleigh Ct; Braeswood Blvd; Kit St; Braesheather Ct; Oasis Dr; Wallington Dr; Brown Leaf Cir; Jackwood; Birdwood Ct; Braesvalley Dr (Braesvalley Cir); Indigo; Loch Lomond Ct; Braesheather Cir; Maple.
Other features: Brays Byu; Willow Waterhole Byu.
Myerland neighborhood detailed profile
Area: 4.637 square miles
Population: 22,835
Population density:
| Myerland: | 4,924 people per square mile |
| Houston: | 3,947 people per square mile |
Median household income in 2021:
| Myerland: | $161,682 |
| Houston: | $55,499 |
Median rent in in 2021:
| Myerland: | $1,721 |
| Houston: | $974 |
Male vs Females
| Males: | 11,039 |
| Females: | 11,795 |
Median age
| Males: | 39.6 years |
| Females: | 41.8 years |
Housing prices:
Average estimated value of detached houses in 2021 (84.6% of all units):
| Myerland: | $471,647 |
| Houston: | $304,685 |
Average estimated '21 value of housing units in 5-or-more-unit structures (16.2% of all units):
| Myerland: | $87,279 |
| Houston: | $227,414 |
Most popular occupations of males: management occupations (except farmers) (20.7%); sales and office occupations (17.3%); business and financial operations occupations (8.1%); computer and mathematical occupations (7.9%); architecture and engineering occupations (7.2%); education, training, and library occupations (6.3%); healthcare practitioners and technical occupations (5.8%)
Most popular occupations of females: sales and office occupations (18.6%); management occupations (except farmers) (13.9%); education, training, and library occupations (12.9%); business and financial operations occupations (12.8%); healthcare practitioners and technical occupations (12.0%); service occupations (10.9%); legal occupations (4.3%)
Limited-access highways (interstate or state) in this neighborhood: W Loop Fwy (I- 610).
Roads and streets: Chimney Rock Rd; S Braeswood Blvd; Yarwell Dr; Beechnut St; N Braeswood Blvd; Dumfries Dr; S Post Oak Rd; Wigton Dr; Rutherglenn Dr; Valkeith Dr; Cheena Dr; Jason St; S Rice Ave; Braesheather Dr; Jackwood St; Braesvalley Dr; Indigo St; Queensloch Dr; Lymbar Dr; Willowbend Blvd; Mullins Dr; Braesmont Dr; Darnell St; Imogene St; Loch Lomond Dr; Paisley Ln (Paisley St); Grape Rd (Grape St); Carew St; W Bellfort St; Renwick Dr; Birdwood Rd; Edith St; Manhattan Dr; Pontiac Dr; Glenmeadow Dr; Hillcroft Ave (Hillcroft St); Willowgrove Dr; Endicott Ln; Ferris Dr; Kuldell Dr; Ariel St; Bob White Dr; Cedarhurst Dr; Braewick Dr; Bayou Bridge Dr; Prichett Dr; Valerie St; Caversham Dr; Atwell Dr; S Atwell Dr; Landsdowne Dr; Heatherglen Dr; Ashcroft Dr; Glenfield Ct; Runnymeade Dr; O Meara Dr (Omeara Dr); Balmforth Ln; Moonlight Dr; Meyer Park Dr; Meyer Forest Dr; Doud Rd; Albury Dr; Frankway Dr; Contour Pl; Willowisp Dr; Cheltenham Dr; Millbury Dr; Mc Dermed Dr; Waycross St; Sylmar Rd; Pine St; Rampart St; Reamer St; Hazelton St; Grape St; Dunlap; Holly St; Flack Dr (Flack St); Waynesboro Dr; Meyer Park Blvd; Burdine St; Nenana Dr; Quebec Dr; Sager Dr; Checkerboard St; Knickerbocker St; Tonawanda Dr; S Renwick Dr; Clematis Ln; Hazen St; Doud St; Picasso Pl; Piermain Dr; Shadow Crest St; Scofield Ln; Brig O Doon Cir; Newcastle Dr; Maple St; Cadman Ct; Brooding Oak Cir; Loop Fwy; Cranleigh Ct; Braeswood Blvd; Kit St; Braesheather Ct; Oasis Dr; Wallington Dr; Brown Leaf Cir; Jackwood; Birdwood Ct; Braesvalley Dr (Braesvalley Cir); Indigo; Loch Lomond Ct; Braesheather Cir; Maple.
Other features: Brays Byu; Willow Waterhole Byu.
Myerland neighborhood detailed profile
Neartown neighborhood in Houston statistics: (Find on map)
Area: 2.947 square miles
Population: 13,782
Population density:
Median household income in 2021:
Median rent in in 2021:
Male vs Females
Median age
Housing prices:
Average estimated value of detached houses in 2021 (36.4% of all units):
Average estimated value of townhouses or other attached units in 2021 (5.1% of all units):
Average estimated '21 value of housing units in 5-or-more-unit structures (67.4% of all units):
Most popular occupations of males: management occupations (except farmers) (27.3%); business and financial operations occupations (14.9%); sales and office occupations (12.0%); legal occupations (9.7%); architecture and engineering occupations (8.4%); computer and mathematical occupations (4.7%); healthcare practitioners and technical occupations (4.6%)
Most popular occupations of females: management occupations (except farmers) (25.8%); sales and office occupations (17.0%); healthcare practitioners and technical occupations (14.9%); business and financial operations occupations (9.6%); service occupations (6.6%); arts, design, entertainment, sports, and media occupations (6.3%); computer and mathematical occupations (4.5%)
Limited-access highways (interstate or state) in this neighborhood: I- 45 (Gulf Fwy, US Hwy 75).
Roads and streets: Westheimer Rd; Allen Pkwy; Welch St; W Gray St; Fairview St; W Dallas Ave (W Dallas St); Kirby Dr; W Clay St; Peden St; S Shepherd Dr; Montrose Blvd; Waugh Dr; Taft St; Stanford St; Dunlavy St; Indiana St; Hyde Park Blvd; Vermont St; Mc Duffie St; Haddon St; Willard St; Chilton Rd; W Drew St; Woodhead St; W Bell St; Crocker St; Bomar St; Driscoll St; Missouri St; Mason St; Troon Rd; Gillette St; Genesee St; Andrews St; Cleveland St; Bagby St; Commonwealth St; Ruthven St; Elmen St; Park St; Morse St; Hazard St; Baldwin St; Brentwood Dr; California St; Van Buren St; Saulnier St; Robin St; Pacific St; Pelham Dr; Inwood Dr; Bailey St; W Pierce St; Avalon Pl (Indiana St); San Felipe Rd (San Felipe St); Bluebonnet Place Cir; del Monte Dr; Huldy St; Avondale St; Brun St; Helena St; Ridgewood St; Windsor St; W Lamar St; O Neil St; D Amico St; Stanmore Dr; Whitney St; W Webster St; Maryland St; Yupon St; Grant St; Crosby St; Fargo St; Wilson St; Heiner St; Hopkins St; Victor St; W Dallas St; Valentine St; Rochow St; Michigan St; Stratford St; Rosine St; Cushing St; Dennis St; Eberhard St; Morgan St; Denman Rd; Webster St; Mimosa Dr; Looscan Ln; Jackson Blvd; Hyde Park Cres; Drew St; Arthur St; Matthews St; Westgate Dr (Westgate St); Dickey Pl; Nevada St; Cook St; Columbus St; Marconi St; Reba Dr; Converse St; Buckner St; Pine Valley Dr; Blue Place Cir; Tuam St; Park Vista Dr; Yoakum Blvd; McGowen St; Persa St; Peckham St; W McKinney St; Albany St; Ella Lee Ln; Locke Ln; W Saulnier St; San Saba St; W Polk Ave; Cherryhurst St; Haver St; Temple Dr; Valentine Way; Argonne St; Pierce St; Marston St; Mandell St; Pine Valley Ct (Pine Valley Dr); Hazel St; Gross St; Joe Annie St; Sutton St; W Mc Kinney St; Oak Pl; Lamar St; Gray St; Revere St; Ralph St; Missouri Pl (Missouri St); Kingston St (Kingston Dr); Newhouse St; Kingston St; Leonidas; la Rue St; Peveto St; Bremond St; Metropolitan; Tirrell St; Park Trail Vis; Sharp Pl; Bayou Vista Dr; Entrance 2 Dr; Mellmeade Ct; Lincoln St; Rylis St; Buffalo Ter; Boston St; Rhode Pl; Skyline Vis; W Walker Ave; Park Trail Way; Park Trail Run; Spann St; Skyline Trl; St Basil Dr; Hopson St; Damon Ct; Wauchcrest; Vick St; Hadley St; Salisbury St (Salisbury Ln); Dunraven Ln; Alpha St; Brazoria St; Pierce; Devonshire St; Bell; Kueter; Wilkenson St; Calhoun Ave; Robita St; St Anne Dr; Rylis; Golf Link Pl; McIlhenny St; Upas; Peveto; W McKinney St (W McKinney Dr); Oak Ct; Greenwich Terrace Dr (Sweetwood Dr); Rosine; Buel Ct; Victor Aly; Leonidas St; Heiner; Anita St; Nash St; Pacific; Lamb St.
Railroad features: Southern Pacific RR.
Neartown neighborhood detailed profile
Area: 2.947 square miles
Population: 13,782
Population density:
| Neartown: | 4,676 people per square mile |
| Houston: | 3,947 people per square mile |
Median household income in 2021:
| Neartown: | $189,527 |
| Houston: | $55,499 |
Median rent in in 2021:
| Neartown: | $1,474 |
| Houston: | $974 |
Male vs Females
| Males: | 7,022 |
| Females: | 6,759 |
Median age
| Males: | 44.9 years |
| Females: | 45.0 years |
Housing prices:
Average estimated value of detached houses in 2021 (36.4% of all units):
| Neartown: | $2,098,365 |
| Houston: | $304,685 |
Average estimated value of townhouses or other attached units in 2021 (5.1% of all units):
| This neighborhood: | $1,068,421 |
| city: | $305,463 |
Average estimated '21 value of housing units in 5-or-more-unit structures (67.4% of all units):
| Neartown: | $650,530 |
| Houston: | $227,414 |
Most popular occupations of males: management occupations (except farmers) (27.3%); business and financial operations occupations (14.9%); sales and office occupations (12.0%); legal occupations (9.7%); architecture and engineering occupations (8.4%); computer and mathematical occupations (4.7%); healthcare practitioners and technical occupations (4.6%)
Most popular occupations of females: management occupations (except farmers) (25.8%); sales and office occupations (17.0%); healthcare practitioners and technical occupations (14.9%); business and financial operations occupations (9.6%); service occupations (6.6%); arts, design, entertainment, sports, and media occupations (6.3%); computer and mathematical occupations (4.5%)
Limited-access highways (interstate or state) in this neighborhood: I- 45 (Gulf Fwy, US Hwy 75).
Roads and streets: Westheimer Rd; Allen Pkwy; Welch St; W Gray St; Fairview St; W Dallas Ave (W Dallas St); Kirby Dr; W Clay St; Peden St; S Shepherd Dr; Montrose Blvd; Waugh Dr; Taft St; Stanford St; Dunlavy St; Indiana St; Hyde Park Blvd; Vermont St; Mc Duffie St; Haddon St; Willard St; Chilton Rd; W Drew St; Woodhead St; W Bell St; Crocker St; Bomar St; Driscoll St; Missouri St; Mason St; Troon Rd; Gillette St; Genesee St; Andrews St; Cleveland St; Bagby St; Commonwealth St; Ruthven St; Elmen St; Park St; Morse St; Hazard St; Baldwin St; Brentwood Dr; California St; Van Buren St; Saulnier St; Robin St; Pacific St; Pelham Dr; Inwood Dr; Bailey St; W Pierce St; Avalon Pl (Indiana St); San Felipe Rd (San Felipe St); Bluebonnet Place Cir; del Monte Dr; Huldy St; Avondale St; Brun St; Helena St; Ridgewood St; Windsor St; W Lamar St; O Neil St; D Amico St; Stanmore Dr; Whitney St; W Webster St; Maryland St; Yupon St; Grant St; Crosby St; Fargo St; Wilson St; Heiner St; Hopkins St; Victor St; W Dallas St; Valentine St; Rochow St; Michigan St; Stratford St; Rosine St; Cushing St; Dennis St; Eberhard St; Morgan St; Denman Rd; Webster St; Mimosa Dr; Looscan Ln; Jackson Blvd; Hyde Park Cres; Drew St; Arthur St; Matthews St; Westgate Dr (Westgate St); Dickey Pl; Nevada St; Cook St; Columbus St; Marconi St; Reba Dr; Converse St; Buckner St; Pine Valley Dr; Blue Place Cir; Tuam St; Park Vista Dr; Yoakum Blvd; McGowen St; Persa St; Peckham St; W McKinney St; Albany St; Ella Lee Ln; Locke Ln; W Saulnier St; San Saba St; W Polk Ave; Cherryhurst St; Haver St; Temple Dr; Valentine Way; Argonne St; Pierce St; Marston St; Mandell St; Pine Valley Ct (Pine Valley Dr); Hazel St; Gross St; Joe Annie St; Sutton St; W Mc Kinney St; Oak Pl; Lamar St; Gray St; Revere St; Ralph St; Missouri Pl (Missouri St); Kingston St (Kingston Dr); Newhouse St; Kingston St; Leonidas; la Rue St; Peveto St; Bremond St; Metropolitan; Tirrell St; Park Trail Vis; Sharp Pl; Bayou Vista Dr; Entrance 2 Dr; Mellmeade Ct; Lincoln St; Rylis St; Buffalo Ter; Boston St; Rhode Pl; Skyline Vis; W Walker Ave; Park Trail Way; Park Trail Run; Spann St; Skyline Trl; St Basil Dr; Hopson St; Damon Ct; Wauchcrest; Vick St; Hadley St; Salisbury St (Salisbury Ln); Dunraven Ln; Alpha St; Brazoria St; Pierce; Devonshire St; Bell; Kueter; Wilkenson St; Calhoun Ave; Robita St; St Anne Dr; Rylis; Golf Link Pl; McIlhenny St; Upas; Peveto; W McKinney St (W McKinney Dr); Oak Ct; Greenwich Terrace Dr (Sweetwood Dr); Rosine; Buel Ct; Victor Aly; Leonidas St; Heiner; Anita St; Nash St; Pacific; Lamb St.
Railroad features: Southern Pacific RR.
Neartown neighborhood detailed profile
North Shore neighborhood in Houston statistics: (Find on map)
Area: 9.360 square miles
Population: 33,241
Population density:
Median household income in 2021:
Median rent in in 2021:
Male vs Females
Median age
Housing prices:
Average estimated value of detached houses in 2021 (85.4% of all units):
Average estimated value of mobile home in 2021 (2.1% of all units):
Most popular occupations of males: construction, extraction, and maintenance occupations (23.8%); transportation occupations (15.2%); production occupations (13.2%); sales and office occupations (12.3%); material moving occupations (12.0%); service occupations (10.3%); management occupations (except farmers) (3.3%)
Most popular occupations of females: sales and office occupations (37.3%); service occupations (24.5%); education, training, and library occupations (6.8%); material moving occupations (5.9%); architecture and engineering occupations (5.6%); production occupations (4.8%); healthcare practitioners and technical occupations (4.5%)
Limited-access highways (interstate or state) in this neighborhood: I- 10 (East Fwy); N Loop Fwy (I- 610, US Hwy 90).
Roads and streets: Market St (Market Street Rd); Maxey Rd; Industrial Rd; Fleming Dr; Federal Rd; Wood Forest Dr; Sheffield Blvd; Greens Bayou St; Orleans St; Corpus Christi St; Iron Wood Blvd; Uvalde Rd; Evanston St; Dunvegan Way; Coulson St; Joliet St; Gellhorn Dr; Cimarron St; Eastbrook Dr; Mc Nair St; Westmont Dr; Emporia St; Halifax St; Lafferty Oaks St; Grand Oaks Dr; N Shore Dr; Peoria St; Oates Rd; Indianapolis St; Louisville St; Dorwayne Ct; Tammarack Dr; Nimitz St; Force St; Vicksburg St; Knollcrest St; Valencia Dr; Sarahs Ln; Crystalwood Dr; Miles St; Granada St; Coolgreen; Beresford St; Isidoro Meza Dr; John Ralston Rd; Falcon St; Redondo Dr; Mercury Dr; Yancy Dr; Church Rd; Texaco Rd; Coolwood Dr; Green Dolphin (Green Dolphin St); Normandy St; Duncum St; Centerwood Dr; Myrtle Ln; Wood Shadows Dr; Westshire Dr; Baca St; Kathryn St; Mobile St; Lear St; Mae Dr; Dawnwood Dr; Utica St; Filey Ln; Duluth St; Fawn Dr; Keyport Ln; Lila Ln; Cool Mist Dr; Coulson Cir; Wood Mist Dr; Ellen Ln; Dwight St; Blythe St; Garber Ln; Wild Plum St; Berwick St; Wood Bayou Dr; Dividend St; Bandera St; Celia Dr; Wood Forest Blvd (Woodforest Blvd); Halsey St; Falloon Ln; Kokomo St; Mylla St; Nola Ct; Samuel Ln; Autumn Wood Dr; Kenwood Ln; Royce Ln; Woodsmoke Dr; Slumberwood Dr; Chelton St; Laguna St; Berthas Ln; Maple Way; Powell Ln; Rosewick St; Topeka St; Boise; Dr John E Codwell Dr; Alice Ln; Woodhurst St; Maryknoll Dr; Broadstairs St; Peggys Ln; Maricopa Ln; Rockglen St; Janey St; Currency St; Garrick Ln; Candlewick St; Harvey Ln; Kilroy St; Community College Dr; Dove St; Glenstone St; Greatwood Dr; Rainy Meadow Ln; Wild Wind Ln; Woodbuck Trl; Watkin Way; Autumn Wood Dr (Autumnwood Dr); Oakstone St; High Ridge St; Shirley; Catherwood Pl; Hiller St; Woodcliff Dr; Sacramento St; Barcus Ln; Oates Ln; Elsie Ln; Woodshaver Dr; Wood Spring Ln; Borderwood Dr; White Water Trl; Market-East Fwy; Soft Shadows Ln; Wood Vista Dr; Pecan Grove St; Badgerwood Dr; Glenalbyn St; Dattner Rd; Rochester St; Donnacorey Dr; Dewey St; Switzer St; Keystone St; Summerwood Ln; Pecan Ct; Blank; Filey Ct; Roundtree St; Vickie Ln; Rita Ln; Meris Ln; Dunaway St; Bowhead Dr; Pecan Dr; Peppertree Ln; Lear; Cheatham Ln; Capistrano St; Oldcastle St; Cappamore St; Heysham St; Brockhampton St; Adelia Ct; S Nola Ct; Peggys Ct (Peggy's Ln); Century Dr (Century Ln); Peggy's Ct; Appian Way; Holland; Cheam Cir; Old Industrial Rd (Cain Cir); Nimitz; Market St (Market Street Rd, 360 St); Ironwood; Market; Judy Ct; Spaniel St; Winterwood Way; Garrick Ct; Fawn Ct; Akron St; Luther St; Baca Dr; Wood Leaf Ct; Fleming Ct; Lafferty Oaks; Wild Plum.
Railroad features: Union Pacific RR; Port Terminal RR.
Other features: Hunting Byu.
Other features: West Cnl.
Other features: Greens Byu; Goodyear Crk; Jordon Gully.
North Shore neighborhood detailed profile
Area: 9.360 square miles
Population: 33,241
Population density:
| North Shore: | 3,552 people per square mile |
| Houston: | 3,947 people per square mile |
Median household income in 2021:
| North Shore: | $52,917 |
| Houston: | $55,499 |
Median rent in in 2021:
| North Shore: | $867 |
| Houston: | $974 |
Male vs Females
| Males: | 16,732 |
| Females: | 16,509 |
Median age
| Males: | 36.0 years |
| Females: | 31.7 years |
Housing prices:
Average estimated value of detached houses in 2021 (85.4% of all units):
| North Shore: | $110,023 |
| Houston: | $304,685 |
Average estimated value of mobile home in 2021 (2.1% of all units):
| North Shore: | $1,743,358 |
| Houston: | $60,006 |
Most popular occupations of males: construction, extraction, and maintenance occupations (23.8%); transportation occupations (15.2%); production occupations (13.2%); sales and office occupations (12.3%); material moving occupations (12.0%); service occupations (10.3%); management occupations (except farmers) (3.3%)
Most popular occupations of females: sales and office occupations (37.3%); service occupations (24.5%); education, training, and library occupations (6.8%); material moving occupations (5.9%); architecture and engineering occupations (5.6%); production occupations (4.8%); healthcare practitioners and technical occupations (4.5%)
Limited-access highways (interstate or state) in this neighborhood: I- 10 (East Fwy); N Loop Fwy (I- 610, US Hwy 90).
Roads and streets: Market St (Market Street Rd); Maxey Rd; Industrial Rd; Fleming Dr; Federal Rd; Wood Forest Dr; Sheffield Blvd; Greens Bayou St; Orleans St; Corpus Christi St; Iron Wood Blvd; Uvalde Rd; Evanston St; Dunvegan Way; Coulson St; Joliet St; Gellhorn Dr; Cimarron St; Eastbrook Dr; Mc Nair St; Westmont Dr; Emporia St; Halifax St; Lafferty Oaks St; Grand Oaks Dr; N Shore Dr; Peoria St; Oates Rd; Indianapolis St; Louisville St; Dorwayne Ct; Tammarack Dr; Nimitz St; Force St; Vicksburg St; Knollcrest St; Valencia Dr; Sarahs Ln; Crystalwood Dr; Miles St; Granada St; Coolgreen; Beresford St; Isidoro Meza Dr; John Ralston Rd; Falcon St; Redondo Dr; Mercury Dr; Yancy Dr; Church Rd; Texaco Rd; Coolwood Dr; Green Dolphin (Green Dolphin St); Normandy St; Duncum St; Centerwood Dr; Myrtle Ln; Wood Shadows Dr; Westshire Dr; Baca St; Kathryn St; Mobile St; Lear St; Mae Dr; Dawnwood Dr; Utica St; Filey Ln; Duluth St; Fawn Dr; Keyport Ln; Lila Ln; Cool Mist Dr; Coulson Cir; Wood Mist Dr; Ellen Ln; Dwight St; Blythe St; Garber Ln; Wild Plum St; Berwick St; Wood Bayou Dr; Dividend St; Bandera St; Celia Dr; Wood Forest Blvd (Woodforest Blvd); Halsey St; Falloon Ln; Kokomo St; Mylla St; Nola Ct; Samuel Ln; Autumn Wood Dr; Kenwood Ln; Royce Ln; Woodsmoke Dr; Slumberwood Dr; Chelton St; Laguna St; Berthas Ln; Maple Way; Powell Ln; Rosewick St; Topeka St; Boise; Dr John E Codwell Dr; Alice Ln; Woodhurst St; Maryknoll Dr; Broadstairs St; Peggys Ln; Maricopa Ln; Rockglen St; Janey St; Currency St; Garrick Ln; Candlewick St; Harvey Ln; Kilroy St; Community College Dr; Dove St; Glenstone St; Greatwood Dr; Rainy Meadow Ln; Wild Wind Ln; Woodbuck Trl; Watkin Way; Autumn Wood Dr (Autumnwood Dr); Oakstone St; High Ridge St; Shirley; Catherwood Pl; Hiller St; Woodcliff Dr; Sacramento St; Barcus Ln; Oates Ln; Elsie Ln; Woodshaver Dr; Wood Spring Ln; Borderwood Dr; White Water Trl; Market-East Fwy; Soft Shadows Ln; Wood Vista Dr; Pecan Grove St; Badgerwood Dr; Glenalbyn St; Dattner Rd; Rochester St; Donnacorey Dr; Dewey St; Switzer St; Keystone St; Summerwood Ln; Pecan Ct; Blank; Filey Ct; Roundtree St; Vickie Ln; Rita Ln; Meris Ln; Dunaway St; Bowhead Dr; Pecan Dr; Peppertree Ln; Lear; Cheatham Ln; Capistrano St; Oldcastle St; Cappamore St; Heysham St; Brockhampton St; Adelia Ct; S Nola Ct; Peggys Ct (Peggy's Ln); Century Dr (Century Ln); Peggy's Ct; Appian Way; Holland; Cheam Cir; Old Industrial Rd (Cain Cir); Nimitz; Market St (Market Street Rd, 360 St); Ironwood; Market; Judy Ct; Spaniel St; Winterwood Way; Garrick Ct; Fawn Ct; Akron St; Luther St; Baca Dr; Wood Leaf Ct; Fleming Ct; Lafferty Oaks; Wild Plum.
Railroad features: Union Pacific RR; Port Terminal RR.
Other features: Hunting Byu.
Other features: West Cnl.
Other features: Greens Byu; Goodyear Crk; Jordon Gully.
North Shore neighborhood detailed profile
Northside neighborhood in Houston statistics: (Find on map)
Area: 10.081 square miles
Population: 40,363
Population density:
Median household income in 2021:
Median rent in in 2021:
Male vs Females
Median age
Housing prices:
Average estimated value of detached houses in 2021 (70.8% of all units):
Average estimated value of mobile home in 2021 (6.7% of all units):
Most popular occupations of males: construction, extraction, and maintenance occupations (28.9%); sales and office occupations (11.3%); service occupations (10.5%); management occupations (except farmers) (9.6%); production occupations (9.3%); transportation occupations (7.7%); material moving occupations (6.1%)
Most popular occupations of females: sales and office occupations (38.3%); service occupations (35.7%); education, training, and library occupations (6.9%); production occupations (4.3%); healthcare practitioners and technical occupations (3.7%); management occupations (except farmers) (2.4%); community and social services occupations (1.9%)
Limited-access highways (interstate or state) in this neighborhood: North Fwy (I- 45).
Highways in this neighborhood: Hardy Toll Rd (State Spur 548); State Spur 261 (N Shepherd Dr).
Roads and streets: Airline Dr; Irvington Blvd; Bauman Rd; Fulton St; Mc Gallion Rd; E Hardy Rd; W Hardy Rd; E Crosstimbers St; Berry Rd; Nordling Rd; Stuebner Airline Rd; Werner St; Tidwell Rd; Helmers St; Canino Rd; de Boll St; Parker Rd; Turner Dr; E Sunnyside St; Wellington St; Rittenhouse St; Little York Rd; Dipping Ln; Benbrook Dr; Soren Ln; Sweetwater Ln; Clark Rd; Northline Dr; John Alber Rd; Bennington St; Appleton St; E Witcher Ln; Yale St; Roswell St; Dorchester St; W Hardy St; O Donnell Dr; E Little York Rd; Eubanks St; Harkness St; Cooper Rd; Sunnyside St; E Parker Rd; Burress St; Yorkshire St; Post St; Luna St; Robmore St; W Parker Rd; E Tidwell Rd; E Wellington St; W Little York Rd; Cardiff Rd; Tallant St; Silvercrest St; Apache St; Westford St; Wainwright St; Luther St; Julia St; Van Molan St; Red Ripple Rd; Gracia St; Burbank St; Mitchell Rd (W Mitchell Rd); E Spreading Oak Dr; E Rittenhouse Rd (E Rittenhouse St); Duff Ln; Keel St; Ellena Rd; W Troy Rd; Goldcrest St; Brenda St; Melrose St; Twin Oaks St; Fichter Ave (Fichter St); Cochran St; Ishmeal St; Cresline St; W Obion Rd; Firnat St; Caperton St; Mc Daniel St; Mayford St; Lyerly St; Mc Cabe St; Charles St (Charles Rd); Biscayne Way; Meta St; Treasure Dr; E Rosamond St (Rosamond St); W Sunnyside St; Innsdale Dr; Briarcliff Dr; Dunkley Dr; Frail Ln (Frels Ln); Luetta St; Normeadow Ln; Veenstra St; W Rittenhouse St; Meadow Lea Dr; Carby Rd; Knight St; Farnsworth St; Wellford St; Courtshire Rd (Courtshire Dr); Grenfell Ln; Bucan St; New Haven Dr; Madie Dr; Basswood St; E John Alber Rd; Pickering St; Farrell St; Dunham Dr; E Rogers St; Heatherwood Dr; Cliffside Dr; Cather St; Cravens St; Annette Ln; Plymouth St; Brea Crst; Palmyra St; Roxella St; Chamberlain; Catamore St; E Twickenham Trl; Cromwell St; Bannister Ln; Surratt Dr; E Roselane St (E Rose Ln); Hopper Rd; West Virginia Ave (West Virginia St); Garrotsville St; Art St; Downey St; Alfano St; W Riverwood Dr; E Burress St; Fostoria Ln; Colony Ln; Sunny Dr; Highlawn St; Mooney Rd; W Rocky Creek Rd; Norham St; Neyland St; Wardmont St; Weisenberger Dr; Dunwoody Dr; Charnwood St; Patrick St; Barrett St; E Riverwood Dr; Millerview Dr; Tassell St; W Rittenhouse Rd; Vista Norte Ct; Bolling Ln; Deerfield St; Hurley St; Wallace St; W Hamilton St; Stabler Ln; Rebecca St; Beckman St; Corwin St; Foxridge Dr; Majorca Dr; Trenwood Ln; Hankla St; Meadowview Dr; Meadowshire St; E Hamilton St; W Spreading Oak Dr; W Twickenham Trl; Langdale Rd; Grothe Ln; Meadowyork St; Theron St; Foxglove Ln; W Brenda St; Feuhs Ln; Merriwood Ln; Connie St; Penway St; Dewville Ln; Pennington St; Sadler St; W Tidwell Rd (Stuebner Airline Rd); W Gulf Bank Rd; W Rosamond St; Meadowlink St; Oak Glen Dr; Hardy Rd; Parkstone Dr; Anabel Ln; E Rittenhouse St; Castledale Dr; Warner St; Peach Spring Dr; Cortlandt St; W Echo Glen Dr; W Montgomery Rd; Zola Rd; E Rocky Creek Rd; E Echo Glen Dr; Amber St; Hohl St; Meadowfair St; Meadowgreen St; Anchick St; Meadowpass St; Rittenhouse Village Ct (Rittenhouse Village Rd); Walk Dr; Wilkie Ln; Salerno Ln; Roth Dr; Carla St; Glaser Dr; Marnie Ln; Saginaw Dr; Roselane St (Rose Ln); Malcolm Dr; Winfrey Ln; Kearny Dr; Donald Dr; Marjorie St; Havner St (Havner Ln); Aggie Ln; Domino Ln; Hartwick Rd; Floradora Ln; W Wellington St; Woodcourt St; Rubenstein St; Ward; Northew St; Melrose Park Rd; Guse St; W Grenfell Ln; Dogwood St; Gurney Ln; W Nelda Rd; Clayton St; Obion Rd; Hacker St; Arnett Ln; Arlington St; Ben Dr; Tomlin Rd; Heaney Dr; Chamberlain Rd; Fieldworth Dr; Gammill Dr; Meadowgrove Dr; W Canino Rd; Fosbak St; Riggs Rd; Zelma Dr; Dorothy Ann Dr; Una St; Beatrice St; Mano St; Westfield St; Bangs Rd; Nellie St; Saddle Rock Dr; Twinbrooke Dr; Rainy River Dr; Rittenhouse Village Rd; Beaver Bend Rd; Hidden Valley Dr; Littleton St; Rocky Mountain Dr; Dowber Rd; May St; Burnley St; Marydel St; Doverside St; Maack Ln; Anderson St; E Troy St; Mosher Ln; E Kowis St; Schade Ln; Karen St; Havens St; Wynell St (Wynell Ter); Patrick Ct; Muckleroy St; Stabner Airline; Vandell St; Santone Ln; Befaye Rd; Iroquois St; Atwood Ln; Harvard St; Petre Dr; Bloom Dr; Boyd; Gulf Bank Rd; Echo Brook Dr; Finn St; Duan St; Eubanks; Bennie St; Charles; Tebo St; Keswick; Beatrice Rd (Beatrice St); Bethy Dr; Clairy Ct; Meadowlink; Ver Lee Ct; Luna; Mazzola Ln; Foyce St; Carrick St; Fairday Ln; Jade Ct; Mabel; Sedgwick Dr; Treadway; Meadowmoor Dr; Overmann St; Corwin; Hopper Cir; Peggy; Acoma Dr; Faircrest Ln; Lazy Nook St; Victory; Denslow Cir; Nowlin Dr; Meta; Doverside; Meadowridge Dr; Talisman Ct; Dionne Dr; West Virginia St; Sunnynook St; Cliff Ct; Montgomery Rd; Basswood.
Railroad features: Houston Belt and Terminal Rlwy; Union Pacific RR.
Other features: Little White Oak Byu.
Northside neighborhood detailed profile
Area: 10.081 square miles
Population: 40,363
Population density:
| Northside (Northline): | 4,004 people per square mile |
| Houston: | 3,947 people per square mile |
Median household income in 2021:
| Northside (Northline): | $49,261 |
| Houston: | $55,499 |
Median rent in in 2021:
| Northside (Northline): | $827 |
| Houston: | $974 |
Male vs Females
| Males: | 20,039 |
| Females: | 20,324 |
Median age
| Males: | 33.7 years |
| Females: | 31.9 years |
Housing prices:
Average estimated value of detached houses in 2021 (70.8% of all units):
| Northside (Northline): | $146,777 |
| Houston: | $304,685 |
Average estimated value of mobile home in 2021 (6.7% of all units):
| Northside (Northline): | $24,099 |
| Houston: | $60,006 |
Most popular occupations of males: construction, extraction, and maintenance occupations (28.9%); sales and office occupations (11.3%); service occupations (10.5%); management occupations (except farmers) (9.6%); production occupations (9.3%); transportation occupations (7.7%); material moving occupations (6.1%)
Most popular occupations of females: sales and office occupations (38.3%); service occupations (35.7%); education, training, and library occupations (6.9%); production occupations (4.3%); healthcare practitioners and technical occupations (3.7%); management occupations (except farmers) (2.4%); community and social services occupations (1.9%)
Limited-access highways (interstate or state) in this neighborhood: North Fwy (I- 45).
Highways in this neighborhood: Hardy Toll Rd (State Spur 548); State Spur 261 (N Shepherd Dr).
Roads and streets: Airline Dr; Irvington Blvd; Bauman Rd; Fulton St; Mc Gallion Rd; E Hardy Rd; W Hardy Rd; E Crosstimbers St; Berry Rd; Nordling Rd; Stuebner Airline Rd; Werner St; Tidwell Rd; Helmers St; Canino Rd; de Boll St; Parker Rd; Turner Dr; E Sunnyside St; Wellington St; Rittenhouse St; Little York Rd; Dipping Ln; Benbrook Dr; Soren Ln; Sweetwater Ln; Clark Rd; Northline Dr; John Alber Rd; Bennington St; Appleton St; E Witcher Ln; Yale St; Roswell St; Dorchester St; W Hardy St; O Donnell Dr; E Little York Rd; Eubanks St; Harkness St; Cooper Rd; Sunnyside St; E Parker Rd; Burress St; Yorkshire St; Post St; Luna St; Robmore St; W Parker Rd; E Tidwell Rd; E Wellington St; W Little York Rd; Cardiff Rd; Tallant St; Silvercrest St; Apache St; Westford St; Wainwright St; Luther St; Julia St; Van Molan St; Red Ripple Rd; Gracia St; Burbank St; Mitchell Rd (W Mitchell Rd); E Spreading Oak Dr; E Rittenhouse Rd (E Rittenhouse St); Duff Ln; Keel St; Ellena Rd; W Troy Rd; Goldcrest St; Brenda St; Melrose St; Twin Oaks St; Fichter Ave (Fichter St); Cochran St; Ishmeal St; Cresline St; W Obion Rd; Firnat St; Caperton St; Mc Daniel St; Mayford St; Lyerly St; Mc Cabe St; Charles St (Charles Rd); Biscayne Way; Meta St; Treasure Dr; E Rosamond St (Rosamond St); W Sunnyside St; Innsdale Dr; Briarcliff Dr; Dunkley Dr; Frail Ln (Frels Ln); Luetta St; Normeadow Ln; Veenstra St; W Rittenhouse St; Meadow Lea Dr; Carby Rd; Knight St; Farnsworth St; Wellford St; Courtshire Rd (Courtshire Dr); Grenfell Ln; Bucan St; New Haven Dr; Madie Dr; Basswood St; E John Alber Rd; Pickering St; Farrell St; Dunham Dr; E Rogers St; Heatherwood Dr; Cliffside Dr; Cather St; Cravens St; Annette Ln; Plymouth St; Brea Crst; Palmyra St; Roxella St; Chamberlain; Catamore St; E Twickenham Trl; Cromwell St; Bannister Ln; Surratt Dr; E Roselane St (E Rose Ln); Hopper Rd; West Virginia Ave (West Virginia St); Garrotsville St; Art St; Downey St; Alfano St; W Riverwood Dr; E Burress St; Fostoria Ln; Colony Ln; Sunny Dr; Highlawn St; Mooney Rd; W Rocky Creek Rd; Norham St; Neyland St; Wardmont St; Weisenberger Dr; Dunwoody Dr; Charnwood St; Patrick St; Barrett St; E Riverwood Dr; Millerview Dr; Tassell St; W Rittenhouse Rd; Vista Norte Ct; Bolling Ln; Deerfield St; Hurley St; Wallace St; W Hamilton St; Stabler Ln; Rebecca St; Beckman St; Corwin St; Foxridge Dr; Majorca Dr; Trenwood Ln; Hankla St; Meadowview Dr; Meadowshire St; E Hamilton St; W Spreading Oak Dr; W Twickenham Trl; Langdale Rd; Grothe Ln; Meadowyork St; Theron St; Foxglove Ln; W Brenda St; Feuhs Ln; Merriwood Ln; Connie St; Penway St; Dewville Ln; Pennington St; Sadler St; W Tidwell Rd (Stuebner Airline Rd); W Gulf Bank Rd; W Rosamond St; Meadowlink St; Oak Glen Dr; Hardy Rd; Parkstone Dr; Anabel Ln; E Rittenhouse St; Castledale Dr; Warner St; Peach Spring Dr; Cortlandt St; W Echo Glen Dr; W Montgomery Rd; Zola Rd; E Rocky Creek Rd; E Echo Glen Dr; Amber St; Hohl St; Meadowfair St; Meadowgreen St; Anchick St; Meadowpass St; Rittenhouse Village Ct (Rittenhouse Village Rd); Walk Dr; Wilkie Ln; Salerno Ln; Roth Dr; Carla St; Glaser Dr; Marnie Ln; Saginaw Dr; Roselane St (Rose Ln); Malcolm Dr; Winfrey Ln; Kearny Dr; Donald Dr; Marjorie St; Havner St (Havner Ln); Aggie Ln; Domino Ln; Hartwick Rd; Floradora Ln; W Wellington St; Woodcourt St; Rubenstein St; Ward; Northew St; Melrose Park Rd; Guse St; W Grenfell Ln; Dogwood St; Gurney Ln; W Nelda Rd; Clayton St; Obion Rd; Hacker St; Arnett Ln; Arlington St; Ben Dr; Tomlin Rd; Heaney Dr; Chamberlain Rd; Fieldworth Dr; Gammill Dr; Meadowgrove Dr; W Canino Rd; Fosbak St; Riggs Rd; Zelma Dr; Dorothy Ann Dr; Una St; Beatrice St; Mano St; Westfield St; Bangs Rd; Nellie St; Saddle Rock Dr; Twinbrooke Dr; Rainy River Dr; Rittenhouse Village Rd; Beaver Bend Rd; Hidden Valley Dr; Littleton St; Rocky Mountain Dr; Dowber Rd; May St; Burnley St; Marydel St; Doverside St; Maack Ln; Anderson St; E Troy St; Mosher Ln; E Kowis St; Schade Ln; Karen St; Havens St; Wynell St (Wynell Ter); Patrick Ct; Muckleroy St; Stabner Airline; Vandell St; Santone Ln; Befaye Rd; Iroquois St; Atwood Ln; Harvard St; Petre Dr; Bloom Dr; Boyd; Gulf Bank Rd; Echo Brook Dr; Finn St; Duan St; Eubanks; Bennie St; Charles; Tebo St; Keswick; Beatrice Rd (Beatrice St); Bethy Dr; Clairy Ct; Meadowlink; Ver Lee Ct; Luna; Mazzola Ln; Foyce St; Carrick St; Fairday Ln; Jade Ct; Mabel; Sedgwick Dr; Treadway; Meadowmoor Dr; Overmann St; Corwin; Hopper Cir; Peggy; Acoma Dr; Faircrest Ln; Lazy Nook St; Victory; Denslow Cir; Nowlin Dr; Meta; Doverside; Meadowridge Dr; Talisman Ct; Dionne Dr; West Virginia St; Sunnynook St; Cliff Ct; Montgomery Rd; Basswood.
Railroad features: Houston Belt and Terminal Rlwy; Union Pacific RR.
Other features: Little White Oak Byu.
Northside neighborhood detailed profile
Northside Village neighborhood in Houston statistics: (Find on map)
Area: 4.155 square miles
Population: 50,206
Population density:
Median household income in 2021:
Median rent in in 2021:
Male vs Females
Median age
Housing prices:
Average estimated value of detached houses in 2021 (77.0% of all units):
Average estimated value of townhouses or other attached units in 2021 (2.7% of all units):
Most popular occupations of males: construction, extraction, and maintenance occupations (25.0%); service occupations (14.1%); sales and office occupations (13.4%); production occupations (10.8%); material moving occupations (8.3%); transportation occupations (4.5%); management occupations (except farmers) (4.0%)
Most popular occupations of females: sales and office occupations (30.8%); service occupations (28.8%); healthcare practitioners and technical occupations (8.7%); education, training, and library occupations (7.5%); business and financial operations occupations (5.8%); management occupations (except farmers) (4.1%); community and social services occupations (2.9%)
Limited-access highways (interstate or state) in this neighborhood: I- 610 (N Loop Fwy); I- 45 (North Fwy).
Highways in this neighborhood: Hardy Toll Rd (State Spur 548).
Roads and streets: Irvington Blvd; Fulton St; Cavalcade St; Chapman St; Cochran St; Hardy St; Gano St; Terry St; Elysian St; Maury St; Robertson St; Frawley St; Melbourne St; Frisco St; N Main St; Fairbanks St; Woodard St; Quitman St; Caplin St; Moody St; Reid St; English St; Weiss St; Gale St; Morris St; Erin St; King St; Lindale St; Helmers St; Gentry St; Moore St; Harrington St; Everett St; Alber St; Cetti St; Collingsworth St; Graceland St; Hogan St; Keene St; Patton St; Eleanor St; Avenue of Oaks St; Kelley St; Milwaukee St; Freeman St; Brooks St; Hays St; Sue St; Joyce St; Amundsen St; James St; Canadian St; Edison St; Elser St; Bigelow St; Pinckney St; Billingsley St; Burnett St; Halpern St; Mc Kee St; Henry St; Chestnut St; Hain St; Common St; Averill St; Paschall St; Luzon St; Beggs St; Bunton St; Evelyn St; Fletcher St; Shelby St; Noble St; Tarley St; Siegel St; Finch St; Griffin St; Egypt St; Euel St; Malvern St; Boswell St; Bardwell St; Lee St; Campbell St; Sharman St; Boundary St; Hamblen St; Gaines St; Marion St; Orr St; Ryon St; Panama St; Mc Neill St; Booth St; Lorraine St; Genova St; Gargan St; Carl St; South St; Marie St; Bragg St; Styers St; Thomas St (Thomas Ave); Cody St; Tackaberry St; Mc Intosh St; Kennon St; Coronado St; Reynolds St; Cosmos St; Goldenrod St; Weems St; Lloyd St; Winchell St; Lazaras St; Trumbull St; Irvington Ct; Line St; Karcher St; Fairbanks St (Fisk St); Calendar St; Delaney St; Stokes St; ; Churchill St; Winnie St; Atlantic St; Searle Dr; Bishop St; Enid St; Mc Ewen St; Comile St; Baden St; Glen Park St; Bristol St; Hammock St; Temple Ave; Royder St; Lilac St; Robert Lee Rd; Marigold St; Wilkes St; Catherine St; Dunlop St; Ideal; Embry St; Cottage; Gay St; Hyacinth; Glaser Dr; Donlen St; Wynn St; Thomas St; Myrtle St; Sylvester Rd; Freemont St; Mop; Link Rd; Moore; Cetti; Common Park; Kirkwood St; Amasa St; Paine St; Custer St; Trimble St; Trentham Pl; Glen Park; Ideal St; Hensley St; Danna Ln; Lewis St; Norland St; Cotswold St; Karnes St; Rein St; Dell Ct; Maverick St; Linder St; Euel; Short St; Elroy St; Leon St; Mills St; Sumpter St; Nelwyn St; Salem Dr; Irene St; Jessamine St; Jonquil; Frisco Blvd; Hardy St (Hardy Rd); Royall St; Myrtle; Nancy Ann St; Denver St; Emerald Ct; Amber St; Anita St; Norland-Loop; Appleton St.
Railroad features: Houston Belt and Terminal Rlwy; Southern Pacific RR; Union Pacific RR.
Other features: Little White Oak Byu; White Oak Byu; Buffalo Byu.
Northside Village neighborhood detailed profile
Area: 4.155 square miles
Population: 50,206
Population density:
| Northside Village: | 12,082 people per square mile |
| Houston: | 3,947 people per square mile |
Median household income in 2021:
| Northside Village: | $52,422 |
| Houston: | $55,499 |
Median rent in in 2021:
| Northside Village: | $797 |
| Houston: | $974 |
Male vs Females
| Males: | 26,629 |
| Females: | 23,576 |
Median age
| Males: | 37.5 years |
| Females: | 38.4 years |
Housing prices:
Average estimated value of detached houses in 2021 (77.0% of all units):
| Northside Village: | $211,919 |
| Houston: | $304,685 |
Average estimated value of townhouses or other attached units in 2021 (2.7% of all units):
| This neighborhood: | $419,821 |
| city: | $305,463 |
Most popular occupations of males: construction, extraction, and maintenance occupations (25.0%); service occupations (14.1%); sales and office occupations (13.4%); production occupations (10.8%); material moving occupations (8.3%); transportation occupations (4.5%); management occupations (except farmers) (4.0%)
Most popular occupations of females: sales and office occupations (30.8%); service occupations (28.8%); healthcare practitioners and technical occupations (8.7%); education, training, and library occupations (7.5%); business and financial operations occupations (5.8%); management occupations (except farmers) (4.1%); community and social services occupations (2.9%)
Limited-access highways (interstate or state) in this neighborhood: I- 610 (N Loop Fwy); I- 45 (North Fwy).
Highways in this neighborhood: Hardy Toll Rd (State Spur 548).
Roads and streets: Irvington Blvd; Fulton St; Cavalcade St; Chapman St; Cochran St; Hardy St; Gano St; Terry St; Elysian St; Maury St; Robertson St; Frawley St; Melbourne St; Frisco St; N Main St; Fairbanks St; Woodard St; Quitman St; Caplin St; Moody St; Reid St; English St; Weiss St; Gale St; Morris St; Erin St; King St; Lindale St; Helmers St; Gentry St; Moore St; Harrington St; Everett St; Alber St; Cetti St; Collingsworth St; Graceland St; Hogan St; Keene St; Patton St; Eleanor St; Avenue of Oaks St; Kelley St; Milwaukee St; Freeman St; Brooks St; Hays St; Sue St; Joyce St; Amundsen St; James St; Canadian St; Edison St; Elser St; Bigelow St; Pinckney St; Billingsley St; Burnett St; Halpern St; Mc Kee St; Henry St; Chestnut St; Hain St; Common St; Averill St; Paschall St; Luzon St; Beggs St; Bunton St; Evelyn St; Fletcher St; Shelby St; Noble St; Tarley St; Siegel St; Finch St; Griffin St; Egypt St; Euel St; Malvern St; Boswell St; Bardwell St; Lee St; Campbell St; Sharman St; Boundary St; Hamblen St; Gaines St; Marion St; Orr St; Ryon St; Panama St; Mc Neill St; Booth St; Lorraine St; Genova St; Gargan St; Carl St; South St; Marie St; Bragg St; Styers St; Thomas St (Thomas Ave); Cody St; Tackaberry St; Mc Intosh St; Kennon St; Coronado St; Reynolds St; Cosmos St; Goldenrod St; Weems St; Lloyd St; Winchell St; Lazaras St; Trumbull St; Irvington Ct; Line St; Karcher St; Fairbanks St (Fisk St); Calendar St; Delaney St; Stokes St; ; Churchill St; Winnie St; Atlantic St; Searle Dr; Bishop St; Enid St; Mc Ewen St; Comile St; Baden St; Glen Park St; Bristol St; Hammock St; Temple Ave; Royder St; Lilac St; Robert Lee Rd; Marigold St; Wilkes St; Catherine St; Dunlop St; Ideal; Embry St; Cottage; Gay St; Hyacinth; Glaser Dr; Donlen St; Wynn St; Thomas St; Myrtle St; Sylvester Rd; Freemont St; Mop; Link Rd; Moore; Cetti; Common Park; Kirkwood St; Amasa St; Paine St; Custer St; Trimble St; Trentham Pl; Glen Park; Ideal St; Hensley St; Danna Ln; Lewis St; Norland St; Cotswold St; Karnes St; Rein St; Dell Ct; Maverick St; Linder St; Euel; Short St; Elroy St; Leon St; Mills St; Sumpter St; Nelwyn St; Salem Dr; Irene St; Jessamine St; Jonquil; Frisco Blvd; Hardy St (Hardy Rd); Royall St; Myrtle; Nancy Ann St; Denver St; Emerald Ct; Amber St; Anita St; Norland-Loop; Appleton St.
Railroad features: Houston Belt and Terminal Rlwy; Southern Pacific RR; Union Pacific RR.
Other features: Little White Oak Byu; White Oak Byu; Buffalo Byu.
Northside Village neighborhood detailed profile
Panther Creek neighborhood in Houston statistics: (Find on map)
Area: 3.612 square miles
Population: 15,195
Population density:
Median household income in 2021:
Median rent in in 2021:
Male vs Females
Median age
Housing prices:
Average estimated value of detached houses in 2021 (90.3% of all units):
Average estimated value of townhouses or other attached units in 2021 (7.2% of all units):
Average estimated '21 value of housing units in 5-or-more-unit structures (16.3% of all units):
Most popular occupations of males: management occupations (except farmers) (27.3%); sales and office occupations (26.4%); business and financial operations occupations (13.5%); architecture and engineering occupations (7.2%); service occupations (4.8%); education, training, and library occupations (4.5%); computer and mathematical occupations (3.1%)
Most popular occupations of females: sales and office occupations (25.7%); education, training, and library occupations (19.5%); business and financial operations occupations (16.8%); management occupations (except farmers) (8.6%); service occupations (8.3%); healthcare practitioners and technical occupations (7.5%); life, physical, and social science occupations (5.0%)
Roads and streets: Gosling Rd; S Panther Creek Dr; Tangle Brush Dr; Split Rock Rd; W Panther Creek Dr; Woodlands Pkwy; N Panther Creek Dr; E Panther Creek Dr; Woodrush Dr; N Berryline Cir; Wedgewood Forest Dr; Glen Loch Dr; Windward Cove; Technology Forest Blvd; Yewleaf Rd; New Trails Dr; N Crescent Ridge Dr; Towering Pines Dr; Leeward Cove Dr; Hickory Oak Dr; S Woodstock Circle Dr; Smokestone Dr; Fallshire Dr; N Mill Trace Dr; Coralberry Rd; Dunlin Meadow Dr; W Isle Pl; S Mill Trace Dr; Indian Clover Dr; S Berryline Cir; Vista Cove Dr; Pebble Cove Dr; Pinyon Pine Dr; W Woodstock Circle Dr; N Windsail Pl; S Windsail Pl; W Misty Morning Trce; Research Forest Dr; Bitterwood Cir; Sunlit Forest Dr; W Tallowberry Dr; E Torch Pine Cir; Summer Crest Cir; Highland Cir; Fairmeade Bend Dr; Skyflower Dr; Forest Crossing Dr; N Shoreline Point Dr; W Windward Cove; N Havenridge Dr; Shadow Bend Pl; Falling Star Rd; N Woodstock Circle Dr; Harbor Cove Dr; Greenridge Forest Dr; S Cypress Pine Dr; W Southfork Pines Cir; Pleasure Cove Dr; E Wandering Oak Dr; Hickorybark Dr; S Havenridge Dr; N Magnolia Pond Pl (S Magnolia Pond Pl); S Wavy Oak Cir; S Circlewood Glen; Willowwood Cir; Acorn Cluster Ct; Shoreline Point Dr; W Isle Blvd; E White Willow Cir; Pebble Hollow Ct; W Wedgewood Glen; Summer Morning Ct; Sweetleaf Ct; W White Willow Cir; N Wavy Oak Cir; Lucky Leaf Ct; Rustic View Ct; W Racing Cloud Ct; Summer Port; Hasting Oak Ct; Twelve Pines Ct; Mayfair Grove Ct; Dellforest Ct; S Waxberry Rd; S Tallowberry Dr; Wood Cove Dr; Postvine Ct; S Buck Ridge; Riverbank Dr; Carriage Pines Ct; Pinewood Forest Ct; N Waxberry Rd; E Wedgewood Glen; Ripple Rush Ct; Dashwood Forest St; N Circlewood Glen; Terravale Ct; Meadowfair Ct; Birchcane Dr; Turtle Rock Ct; S Crimson Clover Cir; Crescent View Ct; Rosedale Brook Ct; Wild Deer Dr; Destiny Cove; N Buck Ridge; E Wavy Oak Cir; Sweet Flag Dr; Brookline Ct; W Torch Pine Cir; Knoll Pines Ct; Trummel Ct; Edgewood Forest Ct; Flintridge Dr; Old Stream Ct; E Lance Leaf Rd; Amara Ct; Grey Finch Ct; Treasure Cove Dr; S Spiral Vine Cir; Spurwood Ct; N Crimson Clover Cir; Yewleaf Dr; W Rock Wing Pl; N Misty Morning Trce; Holly Creek Ct; E Sunlit Forest Dr; Diamond Oak Ct; Wind Trace Ct; Capewood Ct; Feather Branch Ct; E Bigelow Oak Ct; Thornhedge Ct; Green Haven Dr; W Lance Leaf Rd; E Racing Cloud Ct; Windward Ct; Spotted Fawn Ct; Thorncreek Ct; Cape Chestnut Dr; Early Dawn Ct; W Bigelow Oak Ct; E Woodtimber Ct; Pineash Ct; Morning Forest Ct; Mellow Leaf Ct; N Turtle Rock Ct; E Broken Oak Ct; Split Rock Ct; Amber Leaf Ct; Lehigh Springs Dr; W Woodtimber Ct; Greenridge Forest Ct; W Broken Oak Ct; Falling Star Ct; Meadow Star Ct; Night Rain Ct; Fawnchase Ct; N Skyflower Ct; Rock Pine Ct; Crescent Falls Ct; Crownberry Ct; Ridgeline Ct; Split Rock Cove; Russet Wood Ct; N Lakemist Harbour Pl; Swallow Tail Ct; Shadow Stone St; Maywind Ct; N Cypress Pine Dr; Graceful Elm Ct; S Lakemist Harbour Pl; Dappled Sun Pl; Still Glen Ct; Bellweather Ct; Brentwood Oaks Ct; Torch Pine Ct; Flat Stone; Scullers Cove Ct; Heartleaf Ct; Braemar Forest St; N Spiral Vine Cir; Vista Cove Cir; Reflection Pt; Atrium Woods Ct; Hopvine Ct; E Brookberry Ct; Emory Oak Ct; Longshadows Dr; Meadow Cove Dr; Twilight Glen Ct; Bitterwood Circle Rd; Redberry Ct; N Highland Ct; Deer Lake Ct; E Rock Wing Pl; Herald Oak Ct; S Brookberry Ct; Brantdale Rd; Spicebush Ct; Greeningdon St; Briervine Ct; Fiddle Leaf Ct; Southfork Pines Ct; Spindrift Pl; Wedgewood Pt; Ground Brier Ct; Dorset Sq; Sweet Walnut Ct; Cedar Brake Rd; Leverwood Ct; Regent Sq; Snapdragon Ct; Prism Cove Pl; W Willowwood Ct; Basal Briar Ct; Goldthread Ct; Fairtide Ct; S Highland Ct; Lakemist Harbour Dr; Mill Trace Dr; W Wavy Oak Cir; Anchor Point Pl; Purpletop Ct; Southfork Pines Dr; Rain Print; Crested Pines Ct; Lea Oak Ct; Scatterwood Ct; China Rose Ct; Gentry Oak Ct; Gilcrest Forest Ct; E Willowwood Ct; Bitterwood Ct; Star Pine Ct; S Pine Plank Ct; Blanketflower Ct; S Crimson Clover Ct; Hampton Pl; Wind Poppy Ct; Waxberry Dr; Pebble Cove Ct; English Glade Ct; W Willowood Ct; Cross Oak Rd; Smokey Oaks Rd; Dunlin Meadow Ct; Smokey Oak Rd; Black Cherry Ct; Elwood Hills Ct; Great Laurel Ct; Greenglade Ct; Skyflower Pl; E Willowood Ct; Meadow Beauty Ct; Fairmeade Ct.
Other features: Lake Woodlands Dr.
Panther Creek neighborhood detailed profile
Area: 3.612 square miles
Population: 15,195
Population density:
| Panther Creek (Village of Panther Creek): | 4,207 people per square mile |
| Houston: | 3,947 people per square mile |
Median household income in 2021:
| Panther Creek (Village of Panther Creek): | $127,045 |
| Houston: | $55,499 |
Median rent in in 2021:
| Panther Creek (Village of Panther Creek): | $1,759 |
| Houston: | $974 |
Male vs Females
| Males: | 7,823 |
| Females: | 7,371 |
Median age
| Males: | 41.3 years |
| Females: | 42.0 years |
Housing prices:
Average estimated value of detached houses in 2021 (90.3% of all units):
| Panther Creek (Village of Panther Creek): | $414,863 |
| Houston: | $304,685 |
Average estimated value of townhouses or other attached units in 2021 (7.2% of all units):
| This neighborhood: | $667,485 |
| city: | $305,463 |
Average estimated '21 value of housing units in 5-or-more-unit structures (16.3% of all units):
| Panther Creek (Village of Panther Creek): | $355,990 |
| Houston: | $227,414 |
Most popular occupations of males: management occupations (except farmers) (27.3%); sales and office occupations (26.4%); business and financial operations occupations (13.5%); architecture and engineering occupations (7.2%); service occupations (4.8%); education, training, and library occupations (4.5%); computer and mathematical occupations (3.1%)
Most popular occupations of females: sales and office occupations (25.7%); education, training, and library occupations (19.5%); business and financial operations occupations (16.8%); management occupations (except farmers) (8.6%); service occupations (8.3%); healthcare practitioners and technical occupations (7.5%); life, physical, and social science occupations (5.0%)
Roads and streets: Gosling Rd; S Panther Creek Dr; Tangle Brush Dr; Split Rock Rd; W Panther Creek Dr; Woodlands Pkwy; N Panther Creek Dr; E Panther Creek Dr; Woodrush Dr; N Berryline Cir; Wedgewood Forest Dr; Glen Loch Dr; Windward Cove; Technology Forest Blvd; Yewleaf Rd; New Trails Dr; N Crescent Ridge Dr; Towering Pines Dr; Leeward Cove Dr; Hickory Oak Dr; S Woodstock Circle Dr; Smokestone Dr; Fallshire Dr; N Mill Trace Dr; Coralberry Rd; Dunlin Meadow Dr; W Isle Pl; S Mill Trace Dr; Indian Clover Dr; S Berryline Cir; Vista Cove Dr; Pebble Cove Dr; Pinyon Pine Dr; W Woodstock Circle Dr; N Windsail Pl; S Windsail Pl; W Misty Morning Trce; Research Forest Dr; Bitterwood Cir; Sunlit Forest Dr; W Tallowberry Dr; E Torch Pine Cir; Summer Crest Cir; Highland Cir; Fairmeade Bend Dr; Skyflower Dr; Forest Crossing Dr; N Shoreline Point Dr; W Windward Cove; N Havenridge Dr; Shadow Bend Pl; Falling Star Rd; N Woodstock Circle Dr; Harbor Cove Dr; Greenridge Forest Dr; S Cypress Pine Dr; W Southfork Pines Cir; Pleasure Cove Dr; E Wandering Oak Dr; Hickorybark Dr; S Havenridge Dr; N Magnolia Pond Pl (S Magnolia Pond Pl); S Wavy Oak Cir; S Circlewood Glen; Willowwood Cir; Acorn Cluster Ct; Shoreline Point Dr; W Isle Blvd; E White Willow Cir; Pebble Hollow Ct; W Wedgewood Glen; Summer Morning Ct; Sweetleaf Ct; W White Willow Cir; N Wavy Oak Cir; Lucky Leaf Ct; Rustic View Ct; W Racing Cloud Ct; Summer Port; Hasting Oak Ct; Twelve Pines Ct; Mayfair Grove Ct; Dellforest Ct; S Waxberry Rd; S Tallowberry Dr; Wood Cove Dr; Postvine Ct; S Buck Ridge; Riverbank Dr; Carriage Pines Ct; Pinewood Forest Ct; N Waxberry Rd; E Wedgewood Glen; Ripple Rush Ct; Dashwood Forest St; N Circlewood Glen; Terravale Ct; Meadowfair Ct; Birchcane Dr; Turtle Rock Ct; S Crimson Clover Cir; Crescent View Ct; Rosedale Brook Ct; Wild Deer Dr; Destiny Cove; N Buck Ridge; E Wavy Oak Cir; Sweet Flag Dr; Brookline Ct; W Torch Pine Cir; Knoll Pines Ct; Trummel Ct; Edgewood Forest Ct; Flintridge Dr; Old Stream Ct; E Lance Leaf Rd; Amara Ct; Grey Finch Ct; Treasure Cove Dr; S Spiral Vine Cir; Spurwood Ct; N Crimson Clover Cir; Yewleaf Dr; W Rock Wing Pl; N Misty Morning Trce; Holly Creek Ct; E Sunlit Forest Dr; Diamond Oak Ct; Wind Trace Ct; Capewood Ct; Feather Branch Ct; E Bigelow Oak Ct; Thornhedge Ct; Green Haven Dr; W Lance Leaf Rd; E Racing Cloud Ct; Windward Ct; Spotted Fawn Ct; Thorncreek Ct; Cape Chestnut Dr; Early Dawn Ct; W Bigelow Oak Ct; E Woodtimber Ct; Pineash Ct; Morning Forest Ct; Mellow Leaf Ct; N Turtle Rock Ct; E Broken Oak Ct; Split Rock Ct; Amber Leaf Ct; Lehigh Springs Dr; W Woodtimber Ct; Greenridge Forest Ct; W Broken Oak Ct; Falling Star Ct; Meadow Star Ct; Night Rain Ct; Fawnchase Ct; N Skyflower Ct; Rock Pine Ct; Crescent Falls Ct; Crownberry Ct; Ridgeline Ct; Split Rock Cove; Russet Wood Ct; N Lakemist Harbour Pl; Swallow Tail Ct; Shadow Stone St; Maywind Ct; N Cypress Pine Dr; Graceful Elm Ct; S Lakemist Harbour Pl; Dappled Sun Pl; Still Glen Ct; Bellweather Ct; Brentwood Oaks Ct; Torch Pine Ct; Flat Stone; Scullers Cove Ct; Heartleaf Ct; Braemar Forest St; N Spiral Vine Cir; Vista Cove Cir; Reflection Pt; Atrium Woods Ct; Hopvine Ct; E Brookberry Ct; Emory Oak Ct; Longshadows Dr; Meadow Cove Dr; Twilight Glen Ct; Bitterwood Circle Rd; Redberry Ct; N Highland Ct; Deer Lake Ct; E Rock Wing Pl; Herald Oak Ct; S Brookberry Ct; Brantdale Rd; Spicebush Ct; Greeningdon St; Briervine Ct; Fiddle Leaf Ct; Southfork Pines Ct; Spindrift Pl; Wedgewood Pt; Ground Brier Ct; Dorset Sq; Sweet Walnut Ct; Cedar Brake Rd; Leverwood Ct; Regent Sq; Snapdragon Ct; Prism Cove Pl; W Willowwood Ct; Basal Briar Ct; Goldthread Ct; Fairtide Ct; S Highland Ct; Lakemist Harbour Dr; Mill Trace Dr; W Wavy Oak Cir; Anchor Point Pl; Purpletop Ct; Southfork Pines Dr; Rain Print; Crested Pines Ct; Lea Oak Ct; Scatterwood Ct; China Rose Ct; Gentry Oak Ct; Gilcrest Forest Ct; E Willowwood Ct; Bitterwood Ct; Star Pine Ct; S Pine Plank Ct; Blanketflower Ct; S Crimson Clover Ct; Hampton Pl; Wind Poppy Ct; Waxberry Dr; Pebble Cove Ct; English Glade Ct; W Willowood Ct; Cross Oak Rd; Smokey Oaks Rd; Dunlin Meadow Ct; Smokey Oak Rd; Black Cherry Ct; Elwood Hills Ct; Great Laurel Ct; Greenglade Ct; Skyflower Pl; E Willowood Ct; Meadow Beauty Ct; Fairmeade Ct.
Other features: Lake Woodlands Dr.
Panther Creek neighborhood detailed profile
Park Place neighborhood in Houston statistics: (Find on map)
Area: 1.821 square miles
Population: 11,607
Population density:
Median household income in 2021:
Median rent in in 2021:
Male vs Females
Median age
Housing prices:
Average estimated value of detached houses in 2021 (34.0% of all units):
Average estimated '21 value of housing units in 5-or-more-unit structures (11.7% of all units):
Most popular occupations of males: construction, extraction, and maintenance occupations (36.9%); sales and office occupations (13.4%); service occupations (11.5%); production occupations (6.3%); material moving occupations (5.9%); transportation occupations (5.7%); management occupations (except farmers) (4.0%)
Most popular occupations of females: sales and office occupations (47.8%); service occupations (20.9%); healthcare practitioners and technical occupations (18.4%); computer and mathematical occupations (3.8%); business and financial operations occupations (3.6%); management occupations (except farmers) (3.2%); production occupations (1.9%)
Limited-access highways (interstate or state) in this neighborhood: I- 610 (S Loop Fwy, E Loop Fwy); I- 45 (Gulf Fwy).
Roads and streets: Findlay St; Park Place Blvd; Detroit St; Galveston Rd; Broadway St; Easton St; Hartford St; River Dr; Grafton St; Dover St; Brockton St; Central St; Concord St; Joplin St; Hastings St; Park Ter; Ithaca St; Berkley St; Pine Gully Blvd; Meridian Dr (Meridian St); Shady Park Dr; Kimble St; Wyne St; Iola St; Jennings St; Rockleigh Pl; Ashley St; Dalton St; Ogden St; Bellevue St; Glenbrook Dr; Kingsley St; Niles St; Chicago St; Lynn St; Schaff Pl; Bisbee St; Duller Ln; Bayless Dr; Gulf St; Carlisle St; W Court Dr; Auburn St; Erie St; Brower St; Alaska St; Metcalf St; Park Oaks Dr; Coleto St; Biloxi St; Bisbee; N Memorial Way; Barnett St; Findlay Ave; Dover; Berkley; Wyne.
Railroad features: Union Pacific RR.
Other features: Sims Byu.
Park Place neighborhood detailed profile
Area: 1.821 square miles
Population: 11,607
Population density:
| Park Place: | 6,373 people per square mile |
| Houston: | 3,947 people per square mile |
Median household income in 2021:
| Park Place: | $53,836 |
| Houston: | $55,499 |
Median rent in in 2021:
| Park Place: | $876 |
| Houston: | $974 |
Male vs Females
| Males: | 6,468 |
| Females: | 5,138 |
Median age
| Males: | 36.3 years |
| Females: | 35.9 years |
Housing prices:
Average estimated value of detached houses in 2021 (34.0% of all units):
| Park Place: | $135,969 |
| Houston: | $304,685 |
Average estimated '21 value of housing units in 5-or-more-unit structures (11.7% of all units):
| Park Place: | $69,237 |
| Houston: | $227,414 |
Most popular occupations of males: construction, extraction, and maintenance occupations (36.9%); sales and office occupations (13.4%); service occupations (11.5%); production occupations (6.3%); material moving occupations (5.9%); transportation occupations (5.7%); management occupations (except farmers) (4.0%)
Most popular occupations of females: sales and office occupations (47.8%); service occupations (20.9%); healthcare practitioners and technical occupations (18.4%); computer and mathematical occupations (3.8%); business and financial operations occupations (3.6%); management occupations (except farmers) (3.2%); production occupations (1.9%)
Limited-access highways (interstate or state) in this neighborhood: I- 610 (S Loop Fwy, E Loop Fwy); I- 45 (Gulf Fwy).
Roads and streets: Findlay St; Park Place Blvd; Detroit St; Galveston Rd; Broadway St; Easton St; Hartford St; River Dr; Grafton St; Dover St; Brockton St; Central St; Concord St; Joplin St; Hastings St; Park Ter; Ithaca St; Berkley St; Pine Gully Blvd; Meridian Dr (Meridian St); Shady Park Dr; Kimble St; Wyne St; Iola St; Jennings St; Rockleigh Pl; Ashley St; Dalton St; Ogden St; Bellevue St; Glenbrook Dr; Kingsley St; Niles St; Chicago St; Lynn St; Schaff Pl; Bisbee St; Duller Ln; Bayless Dr; Gulf St; Carlisle St; W Court Dr; Auburn St; Erie St; Brower St; Alaska St; Metcalf St; Park Oaks Dr; Coleto St; Biloxi St; Bisbee; N Memorial Way; Barnett St; Findlay Ave; Dover; Berkley; Wyne.
Railroad features: Union Pacific RR.
Other features: Sims Byu.
Park Place neighborhood detailed profile
Park Ten neighborhood in Houston statistics: (Find on map)
Area: 23.407 square miles
Population: 25,130
Population density:
Median household income in 2021:
Median rent in in 2021:
Male vs Females
Median age
Housing prices:
Average estimated value of detached houses in 2021 (89.9% of all units):
Average estimated value of townhouses or other attached units in 2021 (9.2% of all units):
Average estimated '21 value of housing units in 3-to-4-unit structures (27.6% of all units):
Average estimated '21 value of housing units in 5-or-more-unit structures (11.4% of all units):
Most popular occupations of males: transportation occupations (15.2%); sales and office occupations (14.4%); architecture and engineering occupations (12.9%); life, physical, and social science occupations (12.6%); service occupations (12.4%); management occupations (except farmers) (9.1%); computer and mathematical occupations (8.5%)
Most popular occupations of females: sales and office occupations (39.5%); healthcare practitioners and technical occupations (32.9%); service occupations (17.2%); education, training, and library occupations (8.5%)
Limited-access highways (interstate or state) in this neighborhood: Katy Fwy (I- 10, US Hwy 90).
Highways in this neighborhood: Addicks Satsuma Rd (State Hwy 6).
Roads and streets: Clay Rd; N Eldridge Pkwy (Eldridge Pkwy N); Addicks Dam Rd; Park Row; Barker Cypress Rd; Groeschke Rd; Patterson Rd; Old Katy Rd; War Memorial Dr; Saums Rd; Pine Forest Ln; Park Ten Pl; W Parkview Dr; S Parkview Dr (S Park View Dr); Abercrombie St; Barker Springs Rd; Park Ten Blvd; Park Harbor Estates Dr; Parkline; Sundrop Ln; Langham Creek; Broadfield Blvd; S Creek; Hollyoak Dr; Houston Chronicle Blvd; Summer Snow Dr; Mayde Creek Farms Ln; Jorden Rd; Chicory Dr; Pelican Way Rd; Greenhouse Rd; Cypress Run; Park Harbor Dr; Addicks Levee Dr; Fernspray Ln; Rainlily Dr; Marlberry Ln; Mapletrail Dr; Addicks Pr Three Dr; Meadowbend; Pepperwood Ln; Wingleaf Dr; Fern Trail Ct; Mossy Log Ct (Little Fawn); Mayde Park Ln; Waterelm Dr; Deer Key Cir; Park Key Cir; Harbor Key Cir; Lake Harbor Way; Lakeview Cir; Sundowner Dr; Chesapeake Bay Ct; Climber Ct; Lake Geneva Ct; Maple Creek Dr; Park Harbor Ct; Lake Harbor Way Cir; Meadowbend Dr; Park View Ct.
Railroad features: Union Pacific RR.
Other features: South Mayde Crk; Bear Crk; Langham Crk; Turkey Crk; Horsepen Crk.
Park Ten neighborhood detailed profile
Area: 23.407 square miles
Population: 25,130
Population density:
| Park Ten (Addicks): | 1,074 people per square mile |
| Houston: | 3,947 people per square mile |
Median household income in 2021:
| Park Ten (Addicks): | $79,109 |
| Houston: | $55,499 |
Median rent in in 2021:
| Park Ten (Addicks): | $1,006 |
| Houston: | $974 |
Male vs Females
| Males: | 13,209 |
| Females: | 11,921 |
Median age
| Males: | 35.9 years |
| Females: | 39.9 years |
Housing prices:
Average estimated value of detached houses in 2021 (89.9% of all units):
| Park Ten (Addicks): | $383,858 |
| Houston: | $304,685 |
Average estimated value of townhouses or other attached units in 2021 (9.2% of all units):
| This neighborhood: | $198,137 |
| city: | $305,463 |
Average estimated '21 value of housing units in 3-to-4-unit structures (27.6% of all units):
| Park Ten (Addicks): | $80,833 |
| city: | $184,874 |
Average estimated '21 value of housing units in 5-or-more-unit structures (11.4% of all units):
| Park Ten (Addicks): | $101,875 |
| Houston: | $227,414 |
Most popular occupations of males: transportation occupations (15.2%); sales and office occupations (14.4%); architecture and engineering occupations (12.9%); life, physical, and social science occupations (12.6%); service occupations (12.4%); management occupations (except farmers) (9.1%); computer and mathematical occupations (8.5%)
Most popular occupations of females: sales and office occupations (39.5%); healthcare practitioners and technical occupations (32.9%); service occupations (17.2%); education, training, and library occupations (8.5%)
Limited-access highways (interstate or state) in this neighborhood: Katy Fwy (I- 10, US Hwy 90).
Highways in this neighborhood: Addicks Satsuma Rd (State Hwy 6).
Roads and streets: Clay Rd; N Eldridge Pkwy (Eldridge Pkwy N); Addicks Dam Rd; Park Row; Barker Cypress Rd; Groeschke Rd; Patterson Rd; Old Katy Rd; War Memorial Dr; Saums Rd; Pine Forest Ln; Park Ten Pl; W Parkview Dr; S Parkview Dr (S Park View Dr); Abercrombie St; Barker Springs Rd; Park Ten Blvd; Park Harbor Estates Dr; Parkline; Sundrop Ln; Langham Creek; Broadfield Blvd; S Creek; Hollyoak Dr; Houston Chronicle Blvd; Summer Snow Dr; Mayde Creek Farms Ln; Jorden Rd; Chicory Dr; Pelican Way Rd; Greenhouse Rd; Cypress Run; Park Harbor Dr; Addicks Levee Dr; Fernspray Ln; Rainlily Dr; Marlberry Ln; Mapletrail Dr; Addicks Pr Three Dr; Meadowbend; Pepperwood Ln; Wingleaf Dr; Fern Trail Ct; Mossy Log Ct (Little Fawn); Mayde Park Ln; Waterelm Dr; Deer Key Cir; Park Key Cir; Harbor Key Cir; Lake Harbor Way; Lakeview Cir; Sundowner Dr; Chesapeake Bay Ct; Climber Ct; Lake Geneva Ct; Maple Creek Dr; Park Harbor Ct; Lake Harbor Way Cir; Meadowbend Dr; Park View Ct.
Railroad features: Union Pacific RR.
Other features: South Mayde Crk; Bear Crk; Langham Crk; Turkey Crk; Horsepen Crk.
Park Ten neighborhood detailed profile
Pecan Park neighborhood in Houston statistics: (Find on map)
Area: 1.647 square miles
Population: 15,396
Population density:
Median household income in 2021:
Median rent in in 2021:
Male vs Females
Median age
Housing prices:
Average estimated value of detached houses in 2021 (107.4% of all units):
Average estimated '21 value of housing units in 5-or-more-unit structures (15.8% of all units):
Most popular occupations of males: construction, extraction, and maintenance occupations (27.3%); management occupations (except farmers) (16.2%); transportation occupations (14.9%); production occupations (9.9%); service occupations (8.9%); education, training, and library occupations (6.5%); sales and office occupations (4.6%)
Most popular occupations of females: sales and office occupations (37.3%); service occupations (25.1%); life, physical, and social science occupations (14.7%); education, training, and library occupations (6.6%); production occupations (5.5%); management occupations (except farmers) (4.7%); material moving occupations (2.2%)
Limited-access highways (interstate or state) in this neighborhood: Gulf Fwy (I- 45); I- 610 (E Loop Fwy, S Loop Fwy).
Highways in this neighborhood: State Hwy 35 (Reveille Rd).
Roads and streets: Keller St; Narcissus St; Kernel St; Linden St; Moss Rose St; Hemlock St; Japonica St; Ilex St; Evergreen Dr; Berkley St; Myrtle St; Fennell St; Office City Dr; Garden St; Broadway St; Coral St; Bowie St; Harding St; Woodridge Dr; Fir St; Kellogg St; Garland Dr (Garland St); Redwood Ave; Palmetto St; Flowers St; Galveston Rd; Floral St; Dahlia St; Vandeman St; Glover St; Adrian St; Scanlock St; Elvera St; Brumbley St; Schley St; Quince St; Rustic St (Rustic Ln); Sarita St; Parsons St; Lavaca St; Coolidge; Leander St; Gulf Creek Dr; Plum Creek Dr; Woodruff St; Williford St; John St; Eden St; Arberry St; Junior St; Millet St; Roosevelt St; Patricia Ln; Blackburn; Junius St; Phil St; Romans St; Halbert St; Lina St; Delmas St; Deborah St; Pabst St; Brutus St; Bangle St; Bobby Lee Ln; San Marcos St; Whitmire St; Garland St; Metcalf St; Patricia Manor Pl; Reese St; Daisy St; Parsons; Sims; Junius; Power St; Joseph; Hoover; Denby St; Athos St; Browne; Sanchez St; S Loop Fwy.
Railroad features: Union Pacific RR.
Other features: Plum Crk.
Pecan Park neighborhood detailed profile
Area: 1.647 square miles
Population: 15,396
Population density:
| Pecan Park: | 9,348 people per square mile |
| Houston: | 3,947 people per square mile |
Median household income in 2021:
| Pecan Park: | $49,220 |
| Houston: | $55,499 |
Median rent in in 2021:
| Pecan Park: | $709 |
| Houston: | $974 |
Male vs Females
| Males: | 8,568 |
| Females: | 6,828 |
Median age
| Males: | 35.0 years |
| Females: | 36.2 years |
Housing prices:
Average estimated value of detached houses in 2021 (107.4% of all units):
| Pecan Park: | $125,875 |
| Houston: | $304,685 |
Average estimated '21 value of housing units in 5-or-more-unit structures (15.8% of all units):
| Pecan Park: | $69,237 |
| Houston: | $227,414 |
Most popular occupations of males: construction, extraction, and maintenance occupations (27.3%); management occupations (except farmers) (16.2%); transportation occupations (14.9%); production occupations (9.9%); service occupations (8.9%); education, training, and library occupations (6.5%); sales and office occupations (4.6%)
Most popular occupations of females: sales and office occupations (37.3%); service occupations (25.1%); life, physical, and social science occupations (14.7%); education, training, and library occupations (6.6%); production occupations (5.5%); management occupations (except farmers) (4.7%); material moving occupations (2.2%)
Limited-access highways (interstate or state) in this neighborhood: Gulf Fwy (I- 45); I- 610 (E Loop Fwy, S Loop Fwy).
Highways in this neighborhood: State Hwy 35 (Reveille Rd).
Roads and streets: Keller St; Narcissus St; Kernel St; Linden St; Moss Rose St; Hemlock St; Japonica St; Ilex St; Evergreen Dr; Berkley St; Myrtle St; Fennell St; Office City Dr; Garden St; Broadway St; Coral St; Bowie St; Harding St; Woodridge Dr; Fir St; Kellogg St; Garland Dr (Garland St); Redwood Ave; Palmetto St; Flowers St; Galveston Rd; Floral St; Dahlia St; Vandeman St; Glover St; Adrian St; Scanlock St; Elvera St; Brumbley St; Schley St; Quince St; Rustic St (Rustic Ln); Sarita St; Parsons St; Lavaca St; Coolidge; Leander St; Gulf Creek Dr; Plum Creek Dr; Woodruff St; Williford St; John St; Eden St; Arberry St; Junior St; Millet St; Roosevelt St; Patricia Ln; Blackburn; Junius St; Phil St; Romans St; Halbert St; Lina St; Delmas St; Deborah St; Pabst St; Brutus St; Bangle St; Bobby Lee Ln; San Marcos St; Whitmire St; Garland St; Metcalf St; Patricia Manor Pl; Reese St; Daisy St; Parsons; Sims; Junius; Power St; Joseph; Hoover; Denby St; Athos St; Browne; Sanchez St; S Loop Fwy.
Railroad features: Union Pacific RR.
Other features: Plum Crk.
Pecan Park neighborhood detailed profile
Pemberton neighborhood in Houston statistics: (Find on map)
Area: 0.187 square miles
Population: 1,301
Population density:
Median household income in 2021:
Median rent in in 2021:
Male vs Females
Median age
Housing prices:
Average estimated value of detached houses in 2021 (86.7% of all units):
Average estimated value of townhouses or other attached units in 2021 (12.8% of all units):
Most popular occupations of males: healthcare practitioners and technical occupations (22.7%); management occupations (except farmers) (21.1%); architecture and engineering occupations (16.8%); legal occupations (10.8%); construction, extraction, and maintenance occupations (8.2%); sales and office occupations (8.1%); transportation occupations (5.7%)
Most popular occupations of females: healthcare practitioners and technical occupations (30.3%); management occupations (except farmers) (26.4%); education, training, and library occupations (20.5%); sales and office occupations (14.0%); legal occupations (7.0%); community and social services occupations (1.1%)
Roads and streets: Kirby Dr; Annapolis St; Lake St; Charlotte St; Fordham St; University Blvd; Tangley St; Amherst St; Rice Blvd; Plumb St; Fenwood Rd; Pemberton Dr; Robinhood St.
Pemberton neighborhood detailed profile
Area: 0.187 square miles
Population: 1,301
Population density:
| Pemberton: | 6,953 people per square mile |
| Houston: | 3,947 people per square mile |
Median household income in 2021:
| Pemberton: | $228,826 |
| Houston: | $55,499 |
Median rent in in 2021:
| Pemberton: | $2,147 |
| Houston: | $974 |
Male vs Females
| Males: | 642 |
| Females: | 658 |
Median age
| Males: | 43.2 years |
| Females: | 43.2 years |
Housing prices:
Average estimated value of detached houses in 2021 (86.7% of all units):
| Pemberton: | $1,364,967 |
| Houston: | $304,685 |
Average estimated value of townhouses or other attached units in 2021 (12.8% of all units):
| This neighborhood: | $418,246 |
| city: | $305,463 |
Most popular occupations of males: healthcare practitioners and technical occupations (22.7%); management occupations (except farmers) (21.1%); architecture and engineering occupations (16.8%); legal occupations (10.8%); construction, extraction, and maintenance occupations (8.2%); sales and office occupations (8.1%); transportation occupations (5.7%)
Most popular occupations of females: healthcare practitioners and technical occupations (30.3%); management occupations (except farmers) (26.4%); education, training, and library occupations (20.5%); sales and office occupations (14.0%); legal occupations (7.0%); community and social services occupations (1.1%)
Roads and streets: Kirby Dr; Annapolis St; Lake St; Charlotte St; Fordham St; University Blvd; Tangley St; Amherst St; Rice Blvd; Plumb St; Fenwood Rd; Pemberton Dr; Robinhood St.
Pemberton neighborhood detailed profile
Pleasantville neighborhood in Houston statistics: (Find on map)
Area: 3.426 square miles
Population: 3,785
Population density:
Median household income in 2021:
Median rent in in 2021:
Male vs Females
Median age
Housing prices:
Average estimated value of detached houses in 2021 (64.0% of all units):
Average estimated value of mobile home in 2021 (9.1% of all units):
Most popular occupations of males: service occupations (20.3%); material moving occupations (19.2%); construction, extraction, and maintenance occupations (12.3%); transportation occupations (10.0%); production occupations (8.3%); management occupations (except farmers) (5.8%); healthcare practitioners and technical occupations (4.1%)
Most popular occupations of females: sales and office occupations (31.4%); service occupations (30.5%); healthcare practitioners and technical occupations (12.5%); production occupations (7.9%); management occupations (except farmers) (5.7%); material moving occupations (3.6%); education, training, and library occupations (3.4%)
Limited-access highways (interstate or state) in this neighborhood: I- 610 (N Loop Fwy); I- 10 (East Fwy, US Hwy 90).
Highways in this neighborhood: US Hwy 90 Alt (N McCarty St); US Hwy 90 Alt (McCarty St).
Roads and streets: Gellhorn Dr; Portwall St; Wallisville Rd; Ledwicke St; Pleasantville Dr; Market Street Rd; Guinevere St; Tilgham St; Cowart St; Aleen St; Demaree Ln; Silverdale St; Berndale St; Laurentide St; Othello St; Candy St; Beaver Dr; Josie St; Flossie Mae St; Aire; Teanaway Ln; Wiggins St; Herald St (Herald Ave); Bucroft St; Fannette St; Maxine St; Farqueson St; Pattibob St; Cargill St; Amoor St; Rauch St; Flagship Dr; Killene St; Norvic St; Quaker St; Glesby St; Alsuma St; Lanewell St; Market Street Rd (Market St); Fillmore St; Northton St; Richcroft St; Rye St; Normandale St; Carlos St; Silverdale; Amoor St (Amoor Ave); Munn St; Sam Houston Rd; Sam Houston.
Railroad features: Houston Belt and Terminal Rlwy; Union Pacific RR; Southern Pacific RR.
Other features: Hunting Byu.
Pleasantville neighborhood detailed profile
Area: 3.426 square miles
Population: 3,785
Population density:
| Pleasantville: | 1,105 people per square mile |
| Houston: | 3,947 people per square mile |
Median household income in 2021:
| Pleasantville: | $33,476 |
| Houston: | $55,499 |
Median rent in in 2021:
| Pleasantville: | $681 |
| Houston: | $974 |
Male vs Females
| Males: | 2,346 |
| Females: | 1,438 |
Median age
| Males: | 41.1 years |
| Females: | 38.9 years |
Housing prices:
Average estimated value of detached houses in 2021 (64.0% of all units):
| Pleasantville: | $76,267 |
| Houston: | $304,685 |
Average estimated value of mobile home in 2021 (9.1% of all units):
| Pleasantville: | $80,588 |
| Houston: | $60,006 |
Most popular occupations of males: service occupations (20.3%); material moving occupations (19.2%); construction, extraction, and maintenance occupations (12.3%); transportation occupations (10.0%); production occupations (8.3%); management occupations (except farmers) (5.8%); healthcare practitioners and technical occupations (4.1%)
Most popular occupations of females: sales and office occupations (31.4%); service occupations (30.5%); healthcare practitioners and technical occupations (12.5%); production occupations (7.9%); management occupations (except farmers) (5.7%); material moving occupations (3.6%); education, training, and library occupations (3.4%)
Limited-access highways (interstate or state) in this neighborhood: I- 610 (N Loop Fwy); I- 10 (East Fwy, US Hwy 90).
Highways in this neighborhood: US Hwy 90 Alt (N McCarty St); US Hwy 90 Alt (McCarty St).
Roads and streets: Gellhorn Dr; Portwall St; Wallisville Rd; Ledwicke St; Pleasantville Dr; Market Street Rd; Guinevere St; Tilgham St; Cowart St; Aleen St; Demaree Ln; Silverdale St; Berndale St; Laurentide St; Othello St; Candy St; Beaver Dr; Josie St; Flossie Mae St; Aire; Teanaway Ln; Wiggins St; Herald St (Herald Ave); Bucroft St; Fannette St; Maxine St; Farqueson St; Pattibob St; Cargill St; Amoor St; Rauch St; Flagship Dr; Killene St; Norvic St; Quaker St; Glesby St; Alsuma St; Lanewell St; Market Street Rd (Market St); Fillmore St; Northton St; Richcroft St; Rye St; Normandale St; Carlos St; Silverdale; Amoor St (Amoor Ave); Munn St; Sam Houston Rd; Sam Houston.
Railroad features: Houston Belt and Terminal Rlwy; Union Pacific RR; Southern Pacific RR.
Other features: Hunting Byu.
Pleasantville neighborhood detailed profile
Port Houston neighborhood in Houston statistics: (Find on map)
Area: 6.318 square miles
Population: 52,620
Population density:
Median household income in 2021:
Median rent in in 2021:
Male vs Females
Median age
Average estimated value of detached houses in 2021 (82.6% of all units):
Most popular occupations of males: construction, extraction, and maintenance occupations (38.7%); sales and office occupations (14.2%); service occupations (12.6%); production occupations (10.6%); material moving occupations (6.2%); transportation occupations (5.9%); management occupations (except farmers) (3.0%)
Most popular occupations of females: service occupations (36.2%); sales and office occupations (35.2%); production occupations (14.6%); healthcare practitioners and technical occupations (4.1%); material moving occupations (2.7%); business and financial operations occupations (2.2%); community and social services occupations (2.1%)
Limited-access highways (interstate or state) in this neighborhood: East Fwy (US Hwy 90, I- 10); I- 610 (E Loop Fwy).
Highways in this neighborhood: US Hwy 90 Alt (N Wayside Dr); N McCarty St (US Hwy 90 Alt).
Roads and streets: Clinton Dr; Kress St; Lathrop St; Old Clinton Rd; Hillsboro St; Hershe St; Boyles St; Lyons Ave; Market St; Pearl St; Wallisville Rd; Hahlo St; Harris St; Port St; Lower Level Rd; S McCarty St; Hoffman St; Gazin St; High Level Rd; Woolworth St; Zoe St; Wayside Dr; Dorsett St (Dorsett Ave); Laredo St; Alderson St; Texarkana St; Longview St; Gainesville St; Force St; Amarillo St; Shotwell St; Crown St; Grand Blvd; Corpus Christi St; Victoria St; Eagle Pass St; Rouse St; Waxahachie St; Daugherty St; Brownsville St; Armour Dr; Henke St; Exchange St; Majestic St; Houston Harbor Blvd (Harbor St); Tilgham St; Harbor Dr; Gate 1 Rd; Harvey Wilson Dr; Larimer St; San Pablo Dr; Brownwood St; Leslie St; Abilene Ave (Abilene St); el Paso St; San Angelo St; Denison St; Bonham St; Cowart St; Gonzales St; Wiggins St; Tuck St; Anzac St; Arapahoe St; Boyce St; Greenville St; Labco St; Tremper St; Fillmore St; Palestine St; Corsicana St; Terminal St; Norvic St; Pillot St; Flaxman St; Lane St; Chadwick St; Kerr St; Buchanan St; Richards St; Mendez St; Burman St; Cargill St; Port Houston; Masterson St; Garfield St; Signet St; Tuffly St; McCarty St; Munn St; Market Street Rd; Stedman St; Colfax St; Glenarm St; 69th St; Plummer St; Meters St; Eagle Pass; Downing St; Turkey St (Plastics Ave); Heitman St; Karnes St; Gate 2 Rd; Salina St; Ranger Ave; S Sgt Macario Garcia Dr; Clinton-Wayside Dr; Hewrick St; Terminal; Stonewall St; Harris; Bennett St; Arlicious St; Waxahachie; Exchange; Harbor; Stuebner; Crown; Ranger St; Clinton-Wayside; Tuffly; Lyons; Gonzales; Iris; Tuck; Lyons St; Arapahoe; Daugherty; el Paso; McCarty Dr; Abilene.
Railroad features: Southern Pacific RR; Port Terminal RR; Houston Belt and Terminal Rlwy; Union Pacific RR.
Other features: Hunting Byu.
Port Houston neighborhood detailed profile
Area: 6.318 square miles
Population: 52,620
Population density:
| Port Houston (Denver Harbor): | 8,328 people per square mile |
| Houston: | 3,947 people per square mile |
Median household income in 2021:
| Port Houston (Denver Harbor): | $41,833 |
| Houston: | $55,499 |
Median rent in in 2021:
| Port Houston (Denver Harbor): | $717 |
| Houston: | $974 |
Male vs Females
| Males: | 26,612 |
| Females: | 26,008 |
Median age
| Males: | 37.5 years |
| Females: | 38.3 years |
Average estimated value of detached houses in 2021 (82.6% of all units):
| Port Houston (Denver Harbor): | $109,065 |
| Houston: | $304,685 |
Most popular occupations of males: construction, extraction, and maintenance occupations (38.7%); sales and office occupations (14.2%); service occupations (12.6%); production occupations (10.6%); material moving occupations (6.2%); transportation occupations (5.9%); management occupations (except farmers) (3.0%)
Most popular occupations of females: service occupations (36.2%); sales and office occupations (35.2%); production occupations (14.6%); healthcare practitioners and technical occupations (4.1%); material moving occupations (2.7%); business and financial operations occupations (2.2%); community and social services occupations (2.1%)
Limited-access highways (interstate or state) in this neighborhood: East Fwy (US Hwy 90, I- 10); I- 610 (E Loop Fwy).
Highways in this neighborhood: US Hwy 90 Alt (N Wayside Dr); N McCarty St (US Hwy 90 Alt).
Roads and streets: Clinton Dr; Kress St; Lathrop St; Old Clinton Rd; Hillsboro St; Hershe St; Boyles St; Lyons Ave; Market St; Pearl St; Wallisville Rd; Hahlo St; Harris St; Port St; Lower Level Rd; S McCarty St; Hoffman St; Gazin St; High Level Rd; Woolworth St; Zoe St; Wayside Dr; Dorsett St (Dorsett Ave); Laredo St; Alderson St; Texarkana St; Longview St; Gainesville St; Force St; Amarillo St; Shotwell St; Crown St; Grand Blvd; Corpus Christi St; Victoria St; Eagle Pass St; Rouse St; Waxahachie St; Daugherty St; Brownsville St; Armour Dr; Henke St; Exchange St; Majestic St; Houston Harbor Blvd (Harbor St); Tilgham St; Harbor Dr; Gate 1 Rd; Harvey Wilson Dr; Larimer St; San Pablo Dr; Brownwood St; Leslie St; Abilene Ave (Abilene St); el Paso St; San Angelo St; Denison St; Bonham St; Cowart St; Gonzales St; Wiggins St; Tuck St; Anzac St; Arapahoe St; Boyce St; Greenville St; Labco St; Tremper St; Fillmore St; Palestine St; Corsicana St; Terminal St; Norvic St; Pillot St; Flaxman St; Lane St; Chadwick St; Kerr St; Buchanan St; Richards St; Mendez St; Burman St; Cargill St; Port Houston; Masterson St; Garfield St; Signet St; Tuffly St; McCarty St; Munn St; Market Street Rd; Stedman St; Colfax St; Glenarm St; 69th St; Plummer St; Meters St; Eagle Pass; Downing St; Turkey St (Plastics Ave); Heitman St; Karnes St; Gate 2 Rd; Salina St; Ranger Ave; S Sgt Macario Garcia Dr; Clinton-Wayside Dr; Hewrick St; Terminal; Stonewall St; Harris; Bennett St; Arlicious St; Waxahachie; Exchange; Harbor; Stuebner; Crown; Ranger St; Clinton-Wayside; Tuffly; Lyons; Gonzales; Iris; Tuck; Lyons St; Arapahoe; Daugherty; el Paso; McCarty Dr; Abilene.
Railroad features: Southern Pacific RR; Port Terminal RR; Houston Belt and Terminal Rlwy; Union Pacific RR.
Other features: Hunting Byu.
Port Houston neighborhood detailed profile
Research Forest neighborhood in Houston statistics: (Find on map)
Area: 3.158 square miles
Population: 5,509
Population density:
Median household income in 2021:
Median rent in in 2021:
Male vs Females
Median age
Housing prices:
Average estimated value of detached houses in 2021 (27.0% of all units):
Average estimated value of townhouses or other attached units in 2021 (9.0% of all units):
Average estimated '21 value of housing units in 5-or-more-unit structures (62.5% of all units):
Most popular occupations of males: management occupations (except farmers) (31.7%); sales and office occupations (15.4%); computer and mathematical occupations (14.3%); business and financial operations occupations (8.7%); legal occupations (6.1%); architecture and engineering occupations (5.3%); healthcare practitioners and technical occupations (4.7%)
Most popular occupations of females: sales and office occupations (16.7%); education, training, and library occupations (16.6%); business and financial operations occupations (15.7%); management occupations (except farmers) (14.0%); healthcare practitioners and technical occupations (13.2%); life, physical, and social science occupations (5.9%); computer and mathematical occupations (5.3%)
Roads and streets: Grogans Mill Rd; Lake Woodlands Dr (Woodloch Forests); Research Forest Dr; Lake Front Cir; Lakefront Cir; Shenandoah Dr; Six Pines Rd; Pinecroft Dr; Wellman Rd; Bill Smith Rd; Blue Ridge Dr; Hickory Ridge Dr; New Trails Dr; Lake Front; Woodlands Pkwy; Driftwood Ln; Holly Hill Dr; Prentice Rd; Rosewood Dr; Southwood; Medical Plaza Dr; Savannah Dr; Timberloch Pl; Evergreen Cir; Enchanted Dr; Woodloch Forest Dr; Twisted Oak Dr; High Timbers Dr; Hurley Ln; Prosewood Dr; Thornwood; Thornwood Dr; Mail Route Rd; Avalon Oaks Pl; Hidden Trl; Delmar Green Pl; Technology Forest Pl; Cedarwood Dr; Saddlewood Cir; Pine Hill Dr; Cherrywood Ln; Lake Robbins Dr; Zephyr Bend Pl; Red Bird Ln; Overlyn Pl; Marisco Pl; Deadwood Ln; Elmwood Dr; Bella Luce; Bella Sole; Patina Pines Pl; Cobble Gate Pl; Bella Vis; Bella Luna; S Emory Bend Pl; Maplewood Dr; S Crescendo Path Pl; N Emory Bend Pl; Tuscany Woods Dr; Markham Grove Pl; Adante Trail Pl; N Crescendo Path Pl; Crestwood Dr; Marblewood Pl; Bella Cascata; Julienne Trce; Malaga Forest; Malagueta Ct; Turrett Hill Dr; Sherwood Ct; Torrijos Ct; Bella Donna; Tiffany Green Dr; Dunwood Springs Ct; N Overlyn Pl; Cantwell Forest Dr; Avalon Oaks Ct; E Silverwood Ranch Ests; Dulcimer Woods Dr; W Silverwood Ranch Ests; Etonshire Ct; Cairn Oaks Pl; Twisted Oaks Ct; Langham Ct; Pecan Cir; Tiffany Green Ct; Holly Hill Ct; Jadewing Ct.
Other features: Panther Br.
Research Forest neighborhood detailed profile
Area: 3.158 square miles
Population: 5,509
Population density:
| Research Forest: | 1,744 people per square mile |
| Houston: | 3,947 people per square mile |
Median household income in 2021:
| Research Forest: | $124,841 |
| Houston: | $55,499 |
Median rent in in 2021:
| Research Forest: | $1,922 |
| Houston: | $974 |
Male vs Females
| Males: | 2,727 |
| Females: | 2,782 |
Median age
| Males: | 39.4 years |
| Females: | 42.3 years |
Housing prices:
Average estimated value of detached houses in 2021 (27.0% of all units):
| Research Forest: | $1,036,124 |
| Houston: | $304,685 |
Average estimated value of townhouses or other attached units in 2021 (9.0% of all units):
| This neighborhood: | $666,409 |
| city: | $305,463 |
Average estimated '21 value of housing units in 5-or-more-unit structures (62.5% of all units):
| Research Forest: | $489,076 |
| Houston: | $227,414 |
Most popular occupations of males: management occupations (except farmers) (31.7%); sales and office occupations (15.4%); computer and mathematical occupations (14.3%); business and financial operations occupations (8.7%); legal occupations (6.1%); architecture and engineering occupations (5.3%); healthcare practitioners and technical occupations (4.7%)
Most popular occupations of females: sales and office occupations (16.7%); education, training, and library occupations (16.6%); business and financial operations occupations (15.7%); management occupations (except farmers) (14.0%); healthcare practitioners and technical occupations (13.2%); life, physical, and social science occupations (5.9%); computer and mathematical occupations (5.3%)
Roads and streets: Grogans Mill Rd; Lake Woodlands Dr (Woodloch Forests); Research Forest Dr; Lake Front Cir; Lakefront Cir; Shenandoah Dr; Six Pines Rd; Pinecroft Dr; Wellman Rd; Bill Smith Rd; Blue Ridge Dr; Hickory Ridge Dr; New Trails Dr; Lake Front; Woodlands Pkwy; Driftwood Ln; Holly Hill Dr; Prentice Rd; Rosewood Dr; Southwood; Medical Plaza Dr; Savannah Dr; Timberloch Pl; Evergreen Cir; Enchanted Dr; Woodloch Forest Dr; Twisted Oak Dr; High Timbers Dr; Hurley Ln; Prosewood Dr; Thornwood; Thornwood Dr; Mail Route Rd; Avalon Oaks Pl; Hidden Trl; Delmar Green Pl; Technology Forest Pl; Cedarwood Dr; Saddlewood Cir; Pine Hill Dr; Cherrywood Ln; Lake Robbins Dr; Zephyr Bend Pl; Red Bird Ln; Overlyn Pl; Marisco Pl; Deadwood Ln; Elmwood Dr; Bella Luce; Bella Sole; Patina Pines Pl; Cobble Gate Pl; Bella Vis; Bella Luna; S Emory Bend Pl; Maplewood Dr; S Crescendo Path Pl; N Emory Bend Pl; Tuscany Woods Dr; Markham Grove Pl; Adante Trail Pl; N Crescendo Path Pl; Crestwood Dr; Marblewood Pl; Bella Cascata; Julienne Trce; Malaga Forest; Malagueta Ct; Turrett Hill Dr; Sherwood Ct; Torrijos Ct; Bella Donna; Tiffany Green Dr; Dunwood Springs Ct; N Overlyn Pl; Cantwell Forest Dr; Avalon Oaks Ct; E Silverwood Ranch Ests; Dulcimer Woods Dr; W Silverwood Ranch Ests; Etonshire Ct; Cairn Oaks Pl; Twisted Oaks Ct; Langham Ct; Pecan Cir; Tiffany Green Ct; Holly Hill Ct; Jadewing Ct.
Other features: Panther Br.
Research Forest neighborhood detailed profile
Rice Court neighborhood in Houston statistics: (Find on map)
Area: 0.212 square miles
Population: 2,099
Population density:
Median household income in 2021:
Median rent in in 2021:
Male vs Females
Median age
Housing prices:
Average estimated value of detached houses in 2021 (98.0% of all units):
Average estimated value of townhouses or other attached units in 2021 (3.7% of all units):
Most popular occupations of males: management occupations (except farmers) (30.7%); healthcare practitioners and technical occupations (22.9%); business and financial operations occupations (9.5%); sales and office occupations (8.0%); education, training, and library occupations (7.9%); service occupations (5.3%); legal occupations (4.4%)
Most popular occupations of females: legal occupations (23.3%); business and financial operations occupations (22.0%); education, training, and library occupations (10.6%); healthcare practitioners and technical occupations (10.0%); sales and office occupations (10.0%); computer and mathematical occupations (7.1%); arts, design, entertainment, sports, and media occupations (5.6%)
Roads and streets: Belmont St; Wakeforest St; Nottingham St; Sunset Blvd; Albans Rd; Wroxton Rd; Robinhood St; Quenby St; Tangley St; Plumb St; Lafayette; Amherst St; Rice Blvd; Georgetown St; Jarrard St.
Rice Court neighborhood detailed profile
Area: 0.212 square miles
Population: 2,099
Population density:
| Rice Court: | 9,878 people per square mile |
| Houston: | 3,947 people per square mile |
Median household income in 2021:
| Rice Court: | $249,165 |
| Houston: | $55,499 |
Median rent in in 2021:
| Rice Court: | $3,501 |
| Houston: | $974 |
Male vs Females
| Males: | 1,175 |
| Females: | 923 |
Median age
| Males: | 38.9 years |
| Females: | 44.0 years |
Housing prices:
Average estimated value of detached houses in 2021 (98.0% of all units):
| Rice Court: | $1,364,967 |
| Houston: | $304,685 |
Average estimated value of townhouses or other attached units in 2021 (3.7% of all units):
| This neighborhood: | $700,012 |
| city: | $305,463 |
Most popular occupations of males: management occupations (except farmers) (30.7%); healthcare practitioners and technical occupations (22.9%); business and financial operations occupations (9.5%); sales and office occupations (8.0%); education, training, and library occupations (7.9%); service occupations (5.3%); legal occupations (4.4%)
Most popular occupations of females: legal occupations (23.3%); business and financial operations occupations (22.0%); education, training, and library occupations (10.6%); healthcare practitioners and technical occupations (10.0%); sales and office occupations (10.0%); computer and mathematical occupations (7.1%); arts, design, entertainment, sports, and media occupations (5.6%)
Roads and streets: Belmont St; Wakeforest St; Nottingham St; Sunset Blvd; Albans Rd; Wroxton Rd; Robinhood St; Quenby St; Tangley St; Plumb St; Lafayette; Amherst St; Rice Blvd; Georgetown St; Jarrard St.
Rice Court neighborhood detailed profile
Rice Village neighborhood in Houston statistics: (Find on map)
Area: 0.058 square miles
Population: 320
Population density:
Median household income in 2021:
Median rent in in 2021:
Male vs Females
Median age
Housing prices:
Average estimated value of detached houses in 2021 (18.0% of all units):
Average estimated value of townhouses or other attached units in 2021 (13.4% of all units):
Most popular occupations of males: management occupations (except farmers) (22.6%); architecture and engineering occupations (14.9%); business and financial operations occupations (14.0%); healthcare practitioners and technical occupations (13.4%); computer and mathematical occupations (11.4%); life, physical, and social science occupations (7.7%); sales and office occupations (4.6%)
Most popular occupations of females: management occupations (except farmers) (39.9%); education, training, and library occupations (21.0%); sales and office occupations (11.3%); life, physical, and social science occupations (7.9%); healthcare practitioners and technical occupations (4.9%); arts, design, entertainment, sports, and media occupations (4.8%); computer and mathematical occupations (4.1%)
Roads and streets: University Blvd; Kelvin Dr; Amherst St; Times Blvd; Morningside Dr.
Rice Village neighborhood detailed profile
Area: 0.058 square miles
Population: 320
Population density:
| Rice Village (Rice Court): | 5,517 people per square mile |
| Houston: | 3,947 people per square mile |
Median household income in 2021:
| Rice Village (Rice Court): | $193,532 |
| Houston: | $55,499 |
Median rent in in 2021:
| Rice Village (Rice Court): | $2,153 |
| Houston: | $974 |
Male vs Females
| Males: | 160 |
| Females: | 160 |
Median age
| Males: | 38.9 years |
| Females: | 42.3 years |
Housing prices:
Average estimated value of detached houses in 2021 (18.0% of all units):
| Rice Village (Rice Court): | $1,528,821 |
| Houston: | $304,685 |
Average estimated value of townhouses or other attached units in 2021 (13.4% of all units):
| This neighborhood: | $418,246 |
| city: | $305,463 |
Most popular occupations of males: management occupations (except farmers) (22.6%); architecture and engineering occupations (14.9%); business and financial operations occupations (14.0%); healthcare practitioners and technical occupations (13.4%); computer and mathematical occupations (11.4%); life, physical, and social science occupations (7.7%); sales and office occupations (4.6%)
Most popular occupations of females: management occupations (except farmers) (39.9%); education, training, and library occupations (21.0%); sales and office occupations (11.3%); life, physical, and social science occupations (7.9%); healthcare practitioners and technical occupations (4.9%); arts, design, entertainment, sports, and media occupations (4.8%); computer and mathematical occupations (4.1%)
Roads and streets: University Blvd; Kelvin Dr; Amherst St; Times Blvd; Morningside Dr.
Rice Village neighborhood detailed profile
Richmond Plaza neighborhood in Houston statistics: (Find on map)
Area: 0.250 square miles
Population: 1,159
Population density:
Median household income in 2021:
Median rent in in 2021:
Male vs Females
Median age
Average estimated value of detached houses in 2021 (95.3% of all units):
Most popular occupations of males: management occupations (except farmers) (25.4%); healthcare practitioners and technical occupations (18.0%); architecture and engineering occupations (17.2%); business and financial operations occupations (12.8%); computer and mathematical occupations (11.0%); sales and office occupations (6.3%); life, physical, and social science occupations (5.8%)
Most popular occupations of females: healthcare practitioners and technical occupations (27.4%); education, training, and library occupations (14.9%); business and financial operations occupations (12.8%); sales and office occupations (11.9%); management occupations (except farmers) (6.5%); material moving occupations (6.4%); transportation occupations (6.2%)
Roads and streets: Evergreen St; Aspen St; Huisache St; Grand Lake St; Chimney Rock Rd; Jessamine St; Pocahontas St; Ferris Dr; Patrick Henry St; Mapleridge St; Atwell St; Whitehaven St; Alder Dr; Little Lake St; Carol; Woodstock St; S 7th St; Prospect Pl.
Richmond Plaza neighborhood detailed profile
Area: 0.250 square miles
Population: 1,159
Population density:
| Richmond Plaza: | 4,642 people per square mile |
| Houston: | 3,947 people per square mile |
Median household income in 2021:
| Richmond Plaza: | $191,357 |
| Houston: | $55,499 |
Median rent in in 2021:
| Richmond Plaza: | $2,140 |
| Houston: | $974 |
Male vs Females
| Males: | 503 |
| Females: | 655 |
Median age
| Males: | 55.5 years |
| Females: | 47.3 years |
Average estimated value of detached houses in 2021 (95.3% of all units):
| Richmond Plaza: | $886,911 |
| Houston: | $304,685 |
Most popular occupations of males: management occupations (except farmers) (25.4%); healthcare practitioners and technical occupations (18.0%); architecture and engineering occupations (17.2%); business and financial operations occupations (12.8%); computer and mathematical occupations (11.0%); sales and office occupations (6.3%); life, physical, and social science occupations (5.8%)
Most popular occupations of females: healthcare practitioners and technical occupations (27.4%); education, training, and library occupations (14.9%); business and financial operations occupations (12.8%); sales and office occupations (11.9%); management occupations (except farmers) (6.5%); material moving occupations (6.4%); transportation occupations (6.2%)
Roads and streets: Evergreen St; Aspen St; Huisache St; Grand Lake St; Chimney Rock Rd; Jessamine St; Pocahontas St; Ferris Dr; Patrick Henry St; Mapleridge St; Atwell St; Whitehaven St; Alder Dr; Little Lake St; Carol; Woodstock St; S 7th St; Prospect Pl.
Richmond Plaza neighborhood detailed profile
River Oaks neighborhood in Houston statistics: (Find on map)
Area: 2.471 square miles
Population: 6,894
Population density:
Median household income in 2021:
Median rent in in 2021:
Male vs Females
Median age
Housing prices:
Average estimated value of detached houses in 2021 (67.8% of all units):
Average estimated value of townhouses or other attached units in 2021 (4.2% of all units):
Average estimated '21 value of housing units in 5-or-more-unit structures (30.4% of all units):
Most popular occupations of males: management occupations (except farmers) (28.0%); business and financial operations occupations (19.5%); legal occupations (18.4%); sales and office occupations (10.4%); architecture and engineering occupations (7.9%); healthcare practitioners and technical occupations (4.2%); computer and mathematical occupations (2.7%)
Most popular occupations of females: management occupations (except farmers) (23.0%); sales and office occupations (21.8%); business and financial operations occupations (14.7%); healthcare practitioners and technical occupations (7.9%); service occupations (7.0%); arts, design, entertainment, sports, and media occupations (6.8%); legal occupations (6.5%)
Roads and streets: del Monte Dr; San Felipe Rd; Westheimer Rd; Inwood Dr; Ella Lee Ln; Chevy Chase Dr; Willowick Rd; Locke Ln; Kirby Dr; Avalon Pl; Inverness Dr; Overbrook Ln; Reba Dr; Piping Rock Ln; Meadowlake Ln; Lazy Lane Blvd; Wickersham Ln; S Shepherd Dr; Timber Ln; Larchmont Rd; River Oaks Blvd; Bellmeade St; Olympia Dr; Chilton Rd; Pelham Dr; Brentwood Dr; Stanmore Dr; Claremont Ln; Maconda Ln; Welch St; West Ln; Drexel Dr; Troon Rd; Knollwood Dr (Knollwood St); Suffolk Dr; Denman Rd; Mimosa Dr; Westgate Dr (Westgate St); Dickey Pl; Fairview St; Huntingdon Pl; Pine Valley Dr; Persa St; Peckham St; Shadder Way; San Saba St; Argonne St; Mockingbird Ln; Pine Valley Ct (Pine Valley Dr); Pinehill Ln; Sleepy Hollow Ct; Revere St; Kingston St (Kingston Dr); Kingston St; Looscan Ln; Sharp Pl; Groveland Ln; Spann St; St Basil Dr; Briarwood Ct; Salisbury St (Salisbury Ln); Dunraven Ln; Brazoria St; Lake St; Devonshire St; Shannon St; Eastside St; St Anne Dr; Seyborn St; Drexel Cir.
Railroad features: Southern Pacific RR.
River Oaks neighborhood detailed profile
Area: 2.471 square miles
Population: 6,894
Population density:
| River Oaks: | 2,790 people per square mile |
| Houston: | 3,947 people per square mile |
Median household income in 2021:
| River Oaks: | $194,487 |
| Houston: | $55,499 |
Median rent in in 2021:
| River Oaks: | $1,290 |
| Houston: | $974 |
Male vs Females
| Males: | 3,170 |
| Females: | 3,723 |
Median age
| Males: | 49.7 years |
| Females: | 49.8 years |
Housing prices:
Average estimated value of detached houses in 2021 (67.8% of all units):
| River Oaks: | $2,268,185 |
| Houston: | $304,685 |
Average estimated value of townhouses or other attached units in 2021 (4.2% of all units):
| This neighborhood: | $1,067,963 |
| city: | $305,463 |
Average estimated '21 value of housing units in 5-or-more-unit structures (30.4% of all units):
| River Oaks: | $508,420 |
| Houston: | $227,414 |
Most popular occupations of males: management occupations (except farmers) (28.0%); business and financial operations occupations (19.5%); legal occupations (18.4%); sales and office occupations (10.4%); architecture and engineering occupations (7.9%); healthcare practitioners and technical occupations (4.2%); computer and mathematical occupations (2.7%)
Most popular occupations of females: management occupations (except farmers) (23.0%); sales and office occupations (21.8%); business and financial operations occupations (14.7%); healthcare practitioners and technical occupations (7.9%); service occupations (7.0%); arts, design, entertainment, sports, and media occupations (6.8%); legal occupations (6.5%)
Roads and streets: del Monte Dr; San Felipe Rd; Westheimer Rd; Inwood Dr; Ella Lee Ln; Chevy Chase Dr; Willowick Rd; Locke Ln; Kirby Dr; Avalon Pl; Inverness Dr; Overbrook Ln; Reba Dr; Piping Rock Ln; Meadowlake Ln; Lazy Lane Blvd; Wickersham Ln; S Shepherd Dr; Timber Ln; Larchmont Rd; River Oaks Blvd; Bellmeade St; Olympia Dr; Chilton Rd; Pelham Dr; Brentwood Dr; Stanmore Dr; Claremont Ln; Maconda Ln; Welch St; West Ln; Drexel Dr; Troon Rd; Knollwood Dr (Knollwood St); Suffolk Dr; Denman Rd; Mimosa Dr; Westgate Dr (Westgate St); Dickey Pl; Fairview St; Huntingdon Pl; Pine Valley Dr; Persa St; Peckham St; Shadder Way; San Saba St; Argonne St; Mockingbird Ln; Pine Valley Ct (Pine Valley Dr); Pinehill Ln; Sleepy Hollow Ct; Revere St; Kingston St (Kingston Dr); Kingston St; Looscan Ln; Sharp Pl; Groveland Ln; Spann St; St Basil Dr; Briarwood Ct; Salisbury St (Salisbury Ln); Dunraven Ln; Brazoria St; Lake St; Devonshire St; Shannon St; Eastside St; St Anne Dr; Seyborn St; Drexel Cir.
Railroad features: Southern Pacific RR.
River Oaks neighborhood detailed profile
Second Ward neighborhood in Houston statistics: (Find on map)
Area: 2.737 square miles
Population: 9,847
Population density:
Median household income in 2021:
Median rent in in 2021:
Male vs Females
Median age
Average estimated value of detached houses in 2021 (63.5% of all units):
Most popular occupations of males: construction, extraction, and maintenance occupations (21.5%); management occupations (except farmers) (15.3%); production occupations (12.7%); service occupations (12.5%); sales and office occupations (12.5%); transportation occupations (4.8%); architecture and engineering occupations (4.3%)
Most popular occupations of females: sales and office occupations (43.7%); service occupations (19.5%); education, training, and library occupations (9.4%); material moving occupations (6.4%); management occupations (except farmers) (5.9%); healthcare practitioners and technical occupations (4.7%); community and social services occupations (2.8%)
Roads and streets: Navigation Blvd; Canal St; Harrisburg Blvd; Sherman St; Commerce St; Garrow St; Brady St; Engelke St; N Greenwood St; Ave I; N Everton St; Texas St; Lockwood Dr (N Maplewood St); N Milby St; N Hutcheson St; N York St; Runnels St; N Eastwood St; N Super St; N Drennan St; Preston St; Fox St; N Velasco St; Crites St; Wilmer St; N Sampson St; Engel St; Velasco St; Bering St; N Sidney St; Saltus St; Lovejoy St; N Saint Charles St; N Bryan St; Norwood St; Clifton St; Lenox St; Linwood St; Caylor St; Latham St; Delmar St; Edgewood St; Altic St; Roberts St; Maplewood Ln (S Lockwood Dr); Adams St; Texas St (Texas Ave); Eastwood St; Stiles St; N Edgewood St; Drennan St; Hunt St; Sidney St; Super St; Estelle St; Middle St; N Estelle St; Hutcheson St; York St; Sampson St; N Live Oak St; Everton St; Ave H; Esperson St; N Nagle St; Burr St; N Adams St; Bryan St; N Ennis St; Ave J; Mc Farland St; N Jenkins St; N Delano St; N Palmer St; Hagerman St; N Stiles St; N Burr St; Milby St; Freund St; West Dr; Jenkins St; Nolan St; Marsden St; Greenwood St; N Hagerman St; Schroeder; Ann; Palmer St; Hawkins St; N Norwood St; Industrial Way; Delano St; Nagle St; Grace St; S Jensen Dr; Suburban St; Mack; Merkel St; Kendall St; Paige St; Oldham St; McAlpine St; Ira St; Rotman St; Burch St; N Kendall St; East Dr; Lottman St; Blanche St; St Charles St; N Lenox St; Baywood; Cordier Ct; Ave L; Colby St; Live Oak Aly; Bob St; Menard St; Middleton St; N Paige St; Taliver St; Basil; Mc Ashan St; Ball St; Foley; Mc Alpine St; Portwood St; Christensen St; Ennis St; Flynn St; Kennedy St; N Latham St; N Delmar St; Felix; Canal Ct; Barziza St; Cowling St; Shadyview St; Dumble St; Live Oak St; Lemke; Sun Ct; Cary St; Neurath Pl; Fox; Hirsch St; Ball; Nix St; Emite Ct; York.
Railroad features: Houston Belt and Terminal Rlwy; Southern Pacific RR.
Other features: Buffalo Byu.
Second Ward neighborhood detailed profile
Area: 2.737 square miles
Population: 9,847
Population density:
| Second Ward: | 3,597 people per square mile |
| Houston: | 3,947 people per square mile |
Median household income in 2021:
| Second Ward: | $40,193 |
| Houston: | $55,499 |
Median rent in in 2021:
| Second Ward: | $726 |
| Houston: | $974 |
Male vs Females
| Males: | 5,283 |
| Females: | 4,563 |
Median age
| Males: | 36.0 years |
| Females: | 38.3 years |
Average estimated value of detached houses in 2021 (63.5% of all units):
| Second Ward: | $230,058 |
| Houston: | $304,685 |
Most popular occupations of males: construction, extraction, and maintenance occupations (21.5%); management occupations (except farmers) (15.3%); production occupations (12.7%); service occupations (12.5%); sales and office occupations (12.5%); transportation occupations (4.8%); architecture and engineering occupations (4.3%)
Most popular occupations of females: sales and office occupations (43.7%); service occupations (19.5%); education, training, and library occupations (9.4%); material moving occupations (6.4%); management occupations (except farmers) (5.9%); healthcare practitioners and technical occupations (4.7%); community and social services occupations (2.8%)
Roads and streets: Navigation Blvd; Canal St; Harrisburg Blvd; Sherman St; Commerce St; Garrow St; Brady St; Engelke St; N Greenwood St; Ave I; N Everton St; Texas St; Lockwood Dr (N Maplewood St); N Milby St; N Hutcheson St; N York St; Runnels St; N Eastwood St; N Super St; N Drennan St; Preston St; Fox St; N Velasco St; Crites St; Wilmer St; N Sampson St; Engel St; Velasco St; Bering St; N Sidney St; Saltus St; Lovejoy St; N Saint Charles St; N Bryan St; Norwood St; Clifton St; Lenox St; Linwood St; Caylor St; Latham St; Delmar St; Edgewood St; Altic St; Roberts St; Maplewood Ln (S Lockwood Dr); Adams St; Texas St (Texas Ave); Eastwood St; Stiles St; N Edgewood St; Drennan St; Hunt St; Sidney St; Super St; Estelle St; Middle St; N Estelle St; Hutcheson St; York St; Sampson St; N Live Oak St; Everton St; Ave H; Esperson St; N Nagle St; Burr St; N Adams St; Bryan St; N Ennis St; Ave J; Mc Farland St; N Jenkins St; N Delano St; N Palmer St; Hagerman St; N Stiles St; N Burr St; Milby St; Freund St; West Dr; Jenkins St; Nolan St; Marsden St; Greenwood St; N Hagerman St; Schroeder; Ann; Palmer St; Hawkins St; N Norwood St; Industrial Way; Delano St; Nagle St; Grace St; S Jensen Dr; Suburban St; Mack; Merkel St; Kendall St; Paige St; Oldham St; McAlpine St; Ira St; Rotman St; Burch St; N Kendall St; East Dr; Lottman St; Blanche St; St Charles St; N Lenox St; Baywood; Cordier Ct; Ave L; Colby St; Live Oak Aly; Bob St; Menard St; Middleton St; N Paige St; Taliver St; Basil; Mc Ashan St; Ball St; Foley; Mc Alpine St; Portwood St; Christensen St; Ennis St; Flynn St; Kennedy St; N Latham St; N Delmar St; Felix; Canal Ct; Barziza St; Cowling St; Shadyview St; Dumble St; Live Oak St; Lemke; Sun Ct; Cary St; Neurath Pl; Fox; Hirsch St; Ball; Nix St; Emite Ct; York.
Railroad features: Houston Belt and Terminal Rlwy; Southern Pacific RR.
Other features: Buffalo Byu.
Second Ward neighborhood detailed profile
Settegast neighborhood in Houston statistics: (Find on map)
Area: 2.005 square miles
Population: 3,322
Population density:
Median household income in 2021:
Median rent in in 2021:
Male vs Females
Median age
Housing prices:
Average estimated value of detached houses in 2021 (75.3% of all units):
Average estimated value of mobile home in 2021 (3.0% of all units):
Most popular occupations of males: material moving occupations (26.6%); construction, extraction, and maintenance occupations (21.5%); service occupations (11.6%); transportation occupations (9.8%); management occupations (except farmers) (7.4%); sales and office occupations (5.1%); farming, fishing, and forestry occupations (4.6%)
Most popular occupations of females: service occupations (34.5%); sales and office occupations (26.7%); healthcare practitioners and technical occupations (10.5%); transportation occupations (9.3%); community and social services occupations (7.3%); education, training, and library occupations (6.7%); production occupations (2.6%)
Limited-access highways (interstate or state) in this neighborhood: I- 610 (N Loop Fwy).
Roads and streets: N Wayside Dr; Eastland St; Bacher St; Liberty Rd; Haight St; Tate; E Houston Rd; Sunbury St; Dockal Rd; Kenton St; Penrod St; Miley St; Safebuy St; Bonaire St; Queensland St; Furray Rd; St Louis St; Howton St; Ethel St; Fields St; Sparta St; Attwater St; Tommye St; Eastover St; Wedgefield St; Birmingham St; Sexton St; Hanna St; Angus St; Joy St; Nashville St; Pardee St; Booker St; Rand St; Bobby Burns St; Fowlie St; Nielan St; Attwater; Betty Boop St; Ritz St; Chateau St; Ranger St; Romea St; Gates St; Fairchild St; Boy St; Amy St; Blue; Jeffrey St; Filltop St; Cinderella St; Little St; Letcher St; Herschell St; Henson St; Parkhurst Dr; Millardst; King St; Queen St; Queensland; Lebate St; Dollar St; Belroit St; Kelford St; Fleta Dr; Sandy St; S Howton St; Earhart St; Grandville; Barlow St; Manton St; Pond St; Yarmouth; N Howton St; Peabody St; Nielan; Midway; Cluett St; E Helene St; Midway St; Grandville St; Ina St; Millard Ave; Wendel Rd; Bacher.
Railroad features: Southern Pacific RR.
Settegast neighborhood detailed profile
Area: 2.005 square miles
Population: 3,322
Population density:
| Settegast: | 1,657 people per square mile |
| Houston: | 3,947 people per square mile |
Median household income in 2021:
| Settegast: | $27,400 |
| Houston: | $55,499 |
Median rent in in 2021:
| Settegast: | $857 |
| Houston: | $974 |
Male vs Females
| Males: | 1,501 |
| Females: | 1,821 |
Median age
| Males: | 29.2 years |
| Females: | 36.6 years |
Housing prices:
Average estimated value of detached houses in 2021 (75.3% of all units):
| Settegast: | $168,900 |
| Houston: | $304,685 |
Average estimated value of mobile home in 2021 (3.0% of all units):
| Settegast: | $80,588 |
| Houston: | $60,006 |
Most popular occupations of males: material moving occupations (26.6%); construction, extraction, and maintenance occupations (21.5%); service occupations (11.6%); transportation occupations (9.8%); management occupations (except farmers) (7.4%); sales and office occupations (5.1%); farming, fishing, and forestry occupations (4.6%)
Most popular occupations of females: service occupations (34.5%); sales and office occupations (26.7%); healthcare practitioners and technical occupations (10.5%); transportation occupations (9.3%); community and social services occupations (7.3%); education, training, and library occupations (6.7%); production occupations (2.6%)
Limited-access highways (interstate or state) in this neighborhood: I- 610 (N Loop Fwy).
Roads and streets: N Wayside Dr; Eastland St; Bacher St; Liberty Rd; Haight St; Tate; E Houston Rd; Sunbury St; Dockal Rd; Kenton St; Penrod St; Miley St; Safebuy St; Bonaire St; Queensland St; Furray Rd; St Louis St; Howton St; Ethel St; Fields St; Sparta St; Attwater St; Tommye St; Eastover St; Wedgefield St; Birmingham St; Sexton St; Hanna St; Angus St; Joy St; Nashville St; Pardee St; Booker St; Rand St; Bobby Burns St; Fowlie St; Nielan St; Attwater; Betty Boop St; Ritz St; Chateau St; Ranger St; Romea St; Gates St; Fairchild St; Boy St; Amy St; Blue; Jeffrey St; Filltop St; Cinderella St; Little St; Letcher St; Herschell St; Henson St; Parkhurst Dr; Millardst; King St; Queen St; Queensland; Lebate St; Dollar St; Belroit St; Kelford St; Fleta Dr; Sandy St; S Howton St; Earhart St; Grandville; Barlow St; Manton St; Pond St; Yarmouth; N Howton St; Peabody St; Nielan; Midway; Cluett St; E Helene St; Midway St; Grandville St; Ina St; Millard Ave; Wendel Rd; Bacher.
Railroad features: Southern Pacific RR.
Settegast neighborhood detailed profile
Sharpstown neighborhood in Houston statistics: (Find on map)
Area: 8.517 square miles
Population: 40,370
Population density:
Median household income in 2021:
Median rent in in 2021:
Male vs Females
Median age
Housing prices:
Average estimated value of detached houses in 2021 (49.8% of all units):
Average estimated value of townhouses or other attached units in 2021 (11.8% of all units):
Average estimated '21 value of housing units in 5-or-more-unit structures (18.7% of all units):
Most popular occupations of males: construction, extraction, and maintenance occupations (30.7%); service occupations (13.4%); sales and office occupations (12.7%); transportation occupations (11.4%); computer and mathematical occupations (6.7%); production occupations (5.6%); management occupations (except farmers) (4.3%)
Most popular occupations of females: service occupations (38.1%); sales and office occupations (25.6%); business and financial operations occupations (9.1%); education, training, and library occupations (8.0%); healthcare practitioners and technical occupations (6.2%); management occupations (except farmers) (2.5%); production occupations (2.3%)
Highways in this neighborhood: US Hwy 59 (Southwest Fwy); US Hwy 59 (Hov US 59).
Roads and streets: Bellaire Blvd; Beechnut St; Neff St; Harwin Dr; Roos Rd; Sharpview Dr; Leader St; Fondren Rd; Mobud Dr; S Gessner Rd; Triola Ln; Carvel Ln; Langdon Ln; Edgemoor Dr; Stroud Dr; Clarewood Dr; Rowan Ln; Sands Point Dr; Sharpcrest St; Corporate Dr; Bintliff Dr; Concho St; Hendon Ln; Hillcroft St (Hillcroft Ave); Redding Rd; Hazen St; Bonhomme Rd; Bellerive Dr; Town Park Dr; Marinette Dr; Pella Dr; Bissonnet St; de Moss Dr; Jorine Dr; Augustine Dr; Hornwood Dr; Osage St (Osage Rd); Rookin St; Glenmont Dr; Sandstone Rd (Sandstone St); Lugary Dr; Tanager St; Tarnef Dr; Mary Bates Blvd; Ranchester Dr; Burning Tree Dr; Albacore Dr; Larkwood Dr; Tanglewilde St (Tanglewilde Ave); Sandpiper Dr; Sharpcrest Ln (Sharpcrest St); Kendalia Dr; Troulon Dr; Waldo St; Tam O Shanter Ln; Savoy Dr; Reims Rd; Barberton Dr; Sovereign Dr; Lacy Hill Dr; la Roche Ln; Eichler Dr; Jackwood St; Gulfton St (Gulfton Dr); Tours St (Tours Dr); Dashwood Dr; Golf Green Cir; Imogene St; Regency Square Blvd; High Star Dr; Grape St (Grape Rd); Commerce Park Dr; Prestwood Dr; Harbor Town Dr; Cannock Rd; Romney Rd; Westwood Village Dr; Braewick Dr; Moonmist Dr; Scribner Rd; Kensico Rd; Dunlap St; Galleon Dr; Westline Dr; Colony St (Colony Dr); Croton Rd; Wagley St; Tasco St; Hiawatha Dr; Mahoning Dr; Braxton Dr; Westwood Place Dr; Sharpstown Green Cir; Mc Avoy Dr; Parkfront Dr; Tarna Ln; Allday Dr; Memorial Ln; Hartsdale Dr; Parkersburg Dr; Beryl St; Darnell St; Point West Dr; Drew St; Captain Dr; United Dr; Stoneybrook Dr; 14th St; G E George St; Forney Dr; SW Memorial Hospital Tw Dr; Verlie Ln; Bellwood Ln; Guildford Rd; Walkway St; Fonvilla St; Regency Square Ct; Bonhomme; Green Ash Dr; Torquay Ln; Oregano Cir; Kings Gate Cir; Brae Acres Rd; Hillcroft Tc Ten Dr; Caraway Ln (Caraway Cir); Tarragon Ln; Robert Hanna Dr; Windwater Pkwy S; Carew St; Pyron Way; Heilig Rd; Coyle; Brou Ln; Huddler St; Sylmar Rd; Gold Tee Dr; Hillcroft Tc One Dr; Stroud Dr (Stroud); Westward; Cadawac Rd; Basil Ln; Burning Tree Dr (Burning Tree); Brandon's Way; Alief Rd; Robert Hanna Loop; Hillcroft Tc Nine Dr; Bob White Dr; Sharpstown Center; Hillcroft Tc Two Dr; W Holcombe Blvd; Hillcroft Tc Three Dr; Hillcroft Tc Eight Dr; Darnell St (Darnell Cir); Concho; Hillcroft Tc Seven Dr; Gold Tee Ct.
Railroad features: Southern Pacific RR.
Other features: Brays Byu; Wennington Byu.
Sharpstown neighborhood detailed profile
Area: 8.517 square miles
Population: 40,370
Population density:
| Sharpstown: | 4,740 people per square mile |
| Houston: | 3,947 people per square mile |
Median household income in 2021:
| Sharpstown: | $51,827 |
| Houston: | $55,499 |
Median rent in in 2021:
| Sharpstown: | $990 |
| Houston: | $974 |
Male vs Females
| Males: | 20,935 |
| Females: | 19,434 |
Median age
| Males: | 37.1 years |
| Females: | 36.5 years |
Housing prices:
Average estimated value of detached houses in 2021 (49.8% of all units):
| Sharpstown: | $246,988 |
| Houston: | $304,685 |
Average estimated value of townhouses or other attached units in 2021 (11.8% of all units):
| This neighborhood: | $740,515 |
| city: | $305,463 |
Average estimated '21 value of housing units in 5-or-more-unit structures (18.7% of all units):
| Sharpstown: | $58,405 |
| Houston: | $227,414 |
Most popular occupations of males: construction, extraction, and maintenance occupations (30.7%); service occupations (13.4%); sales and office occupations (12.7%); transportation occupations (11.4%); computer and mathematical occupations (6.7%); production occupations (5.6%); management occupations (except farmers) (4.3%)
Most popular occupations of females: service occupations (38.1%); sales and office occupations (25.6%); business and financial operations occupations (9.1%); education, training, and library occupations (8.0%); healthcare practitioners and technical occupations (6.2%); management occupations (except farmers) (2.5%); production occupations (2.3%)
Highways in this neighborhood: US Hwy 59 (Southwest Fwy); US Hwy 59 (Hov US 59).
Roads and streets: Bellaire Blvd; Beechnut St; Neff St; Harwin Dr; Roos Rd; Sharpview Dr; Leader St; Fondren Rd; Mobud Dr; S Gessner Rd; Triola Ln; Carvel Ln; Langdon Ln; Edgemoor Dr; Stroud Dr; Clarewood Dr; Rowan Ln; Sands Point Dr; Sharpcrest St; Corporate Dr; Bintliff Dr; Concho St; Hendon Ln; Hillcroft St (Hillcroft Ave); Redding Rd; Hazen St; Bonhomme Rd; Bellerive Dr; Town Park Dr; Marinette Dr; Pella Dr; Bissonnet St; de Moss Dr; Jorine Dr; Augustine Dr; Hornwood Dr; Osage St (Osage Rd); Rookin St; Glenmont Dr; Sandstone Rd (Sandstone St); Lugary Dr; Tanager St; Tarnef Dr; Mary Bates Blvd; Ranchester Dr; Burning Tree Dr; Albacore Dr; Larkwood Dr; Tanglewilde St (Tanglewilde Ave); Sandpiper Dr; Sharpcrest Ln (Sharpcrest St); Kendalia Dr; Troulon Dr; Waldo St; Tam O Shanter Ln; Savoy Dr; Reims Rd; Barberton Dr; Sovereign Dr; Lacy Hill Dr; la Roche Ln; Eichler Dr; Jackwood St; Gulfton St (Gulfton Dr); Tours St (Tours Dr); Dashwood Dr; Golf Green Cir; Imogene St; Regency Square Blvd; High Star Dr; Grape St (Grape Rd); Commerce Park Dr; Prestwood Dr; Harbor Town Dr; Cannock Rd; Romney Rd; Westwood Village Dr; Braewick Dr; Moonmist Dr; Scribner Rd; Kensico Rd; Dunlap St; Galleon Dr; Westline Dr; Colony St (Colony Dr); Croton Rd; Wagley St; Tasco St; Hiawatha Dr; Mahoning Dr; Braxton Dr; Westwood Place Dr; Sharpstown Green Cir; Mc Avoy Dr; Parkfront Dr; Tarna Ln; Allday Dr; Memorial Ln; Hartsdale Dr; Parkersburg Dr; Beryl St; Darnell St; Point West Dr; Drew St; Captain Dr; United Dr; Stoneybrook Dr; 14th St; G E George St; Forney Dr; SW Memorial Hospital Tw Dr; Verlie Ln; Bellwood Ln; Guildford Rd; Walkway St; Fonvilla St; Regency Square Ct; Bonhomme; Green Ash Dr; Torquay Ln; Oregano Cir; Kings Gate Cir; Brae Acres Rd; Hillcroft Tc Ten Dr; Caraway Ln (Caraway Cir); Tarragon Ln; Robert Hanna Dr; Windwater Pkwy S; Carew St; Pyron Way; Heilig Rd; Coyle; Brou Ln; Huddler St; Sylmar Rd; Gold Tee Dr; Hillcroft Tc One Dr; Stroud Dr (Stroud); Westward; Cadawac Rd; Basil Ln; Burning Tree Dr (Burning Tree); Brandon's Way; Alief Rd; Robert Hanna Loop; Hillcroft Tc Nine Dr; Bob White Dr; Sharpstown Center; Hillcroft Tc Two Dr; W Holcombe Blvd; Hillcroft Tc Three Dr; Hillcroft Tc Eight Dr; Darnell St (Darnell Cir); Concho; Hillcroft Tc Seven Dr; Gold Tee Ct.
Railroad features: Southern Pacific RR.
Other features: Brays Byu; Wennington Byu.
Sharpstown neighborhood detailed profile
South Acres neighborhood in Houston statistics: (Find on map)
Area: 6.882 square miles
Population: 14,023
Population density:
Median household income in 2021:
Median rent in in 2021:
Male vs Females
Median age
Housing prices:
Average estimated value of detached houses in 2021 (82.9% of all units):
Average estimated value of townhouses or other attached units in 2021 (5.1% of all units):
Most popular occupations of males: sales and office occupations (23.6%); production occupations (20.1%); construction, extraction, and maintenance occupations (18.1%); material moving occupations (9.5%); service occupations (7.9%); business and financial operations occupations (5.7%); transportation occupations (5.5%)
Most popular occupations of females: service occupations (30.3%); sales and office occupations (24.4%); healthcare practitioners and technical occupations (9.3%); community and social services occupations (7.1%); transportation occupations (6.2%); education, training, and library occupations (6.1%); production occupations (5.2%)
Highways in this neighborhood: South Fwy (State Hwy 288).
Roads and streets: Cullen Blvd (Co Rd 865); Almeda-Genoa Rd; S Acres Dr; Airport Blvd; Swingle Rd; Selinsky Rd; Fuqua St; Kilkenny Dr; Leitrim Way; Furman Rd; Tavenor Ln; Donegal Way; Fairgreen Ln; Segrest Dr; Webercrest Rd; E Orem Dr; Murr Way; Madden Ln; Scott St; Botany Ln; Glen Hollow Dr; Bungalow Ln; Roandale Dr; Holloway Dr; Dumore Dr; Martin Luther King Jr Blvd; Sandrock Dr; Duane St; Bay Cedar Dr; Orem Dr; Park Village Dr; Cork Dr; Rockford Dr; S Park Blvd (Martin Luther King Jr Blvd); Howcher St; Panay Dr; Jutland Rd; Greylog Dr; Brisbane St; Southview St; Groton Dr; Canterway Dr; Rubin St; Claygate Dr; Hickok Ln; Sandhurst Dr; Mowery Rd; Hartsville Rd; Denoron Dr; Grace Point Ln; Dacca Dr; S Coast Dr; Mosscrest Dr; Marchant Rd; Fawnway Dr; Fellows Rd; Paradise Ln; Akard St; Hycohen Rd; Lockcrest St; Greenshire Dr; Friar Point Rd; Cedarburg Dr; Tareyton Ln; Cape Hyannis Dr; Meadow Park Dr; Elm Spring Dr; N 8th St; Blarney Dr; Land Rd; Richfield Ln; Lockgate Ln; Murdock St; Southspring Dr; Southbridge Rd; Elm Tree Dr; Mill Valley Rd; Sugar Bush Dr; Safeguard St; Scenic Dr; Stoneham Ave (Stonham St); Osprey Dr; Alderfer St; Sorsby Way; Palisade Dr; Pembroke St; Russelville Rd; Hunkler Dr; Kennedy Heights Blvd; 9th; Redfern Dr; Anna Held St; Carlson Ln; Kildare Dr; Hiford Dr; Faircroft Dr; Carlton Dr; Long Gate Dr; Honeyvine Dr; Fawngrove Dr; Edgar St; Rosecroft Dr; Scott; Pembroke; Glenhollow Dr; Rosewin Cir; Redwin Cir; Winthrop St; Silver Stone St; Shorehaven Cir; Holloway St; Martin Luther King Blvd; Deluxe St; Neon St; Cresthaven Cir; Denoron Ct; Bay Cedar Ct; Cedarburg Cir; Russelville Dr; Sabra Ct; Holloway Ct.
Other features: Sims Byu.
South Acres neighborhood detailed profile
Area: 6.882 square miles
Population: 14,023
Population density:
| South Acres (Crestmont Parl): | 2,038 people per square mile |
| Houston: | 3,947 people per square mile |
Median household income in 2021:
| South Acres (Crestmont Parl): | $33,116 |
| Houston: | $55,499 |
Median rent in in 2021:
| South Acres (Crestmont Parl): | $827 |
| Houston: | $974 |
Male vs Females
| Males: | 6,813 |
| Females: | 7,209 |
Median age
| Males: | 25.1 years |
| Females: | 40.1 years |
Housing prices:
Average estimated value of detached houses in 2021 (82.9% of all units):
| South Acres (Crestmont Parl): | $100,022 |
| Houston: | $304,685 |
Average estimated value of townhouses or other attached units in 2021 (5.1% of all units):
| This neighborhood: | $158,850 |
| city: | $305,463 |
Most popular occupations of males: sales and office occupations (23.6%); production occupations (20.1%); construction, extraction, and maintenance occupations (18.1%); material moving occupations (9.5%); service occupations (7.9%); business and financial operations occupations (5.7%); transportation occupations (5.5%)
Most popular occupations of females: service occupations (30.3%); sales and office occupations (24.4%); healthcare practitioners and technical occupations (9.3%); community and social services occupations (7.1%); transportation occupations (6.2%); education, training, and library occupations (6.1%); production occupations (5.2%)
Highways in this neighborhood: South Fwy (State Hwy 288).
Roads and streets: Cullen Blvd (Co Rd 865); Almeda-Genoa Rd; S Acres Dr; Airport Blvd; Swingle Rd; Selinsky Rd; Fuqua St; Kilkenny Dr; Leitrim Way; Furman Rd; Tavenor Ln; Donegal Way; Fairgreen Ln; Segrest Dr; Webercrest Rd; E Orem Dr; Murr Way; Madden Ln; Scott St; Botany Ln; Glen Hollow Dr; Bungalow Ln; Roandale Dr; Holloway Dr; Dumore Dr; Martin Luther King Jr Blvd; Sandrock Dr; Duane St; Bay Cedar Dr; Orem Dr; Park Village Dr; Cork Dr; Rockford Dr; S Park Blvd (Martin Luther King Jr Blvd); Howcher St; Panay Dr; Jutland Rd; Greylog Dr; Brisbane St; Southview St; Groton Dr; Canterway Dr; Rubin St; Claygate Dr; Hickok Ln; Sandhurst Dr; Mowery Rd; Hartsville Rd; Denoron Dr; Grace Point Ln; Dacca Dr; S Coast Dr; Mosscrest Dr; Marchant Rd; Fawnway Dr; Fellows Rd; Paradise Ln; Akard St; Hycohen Rd; Lockcrest St; Greenshire Dr; Friar Point Rd; Cedarburg Dr; Tareyton Ln; Cape Hyannis Dr; Meadow Park Dr; Elm Spring Dr; N 8th St; Blarney Dr; Land Rd; Richfield Ln; Lockgate Ln; Murdock St; Southspring Dr; Southbridge Rd; Elm Tree Dr; Mill Valley Rd; Sugar Bush Dr; Safeguard St; Scenic Dr; Stoneham Ave (Stonham St); Osprey Dr; Alderfer St; Sorsby Way; Palisade Dr; Pembroke St; Russelville Rd; Hunkler Dr; Kennedy Heights Blvd; 9th; Redfern Dr; Anna Held St; Carlson Ln; Kildare Dr; Hiford Dr; Faircroft Dr; Carlton Dr; Long Gate Dr; Honeyvine Dr; Fawngrove Dr; Edgar St; Rosecroft Dr; Scott; Pembroke; Glenhollow Dr; Rosewin Cir; Redwin Cir; Winthrop St; Silver Stone St; Shorehaven Cir; Holloway St; Martin Luther King Blvd; Deluxe St; Neon St; Cresthaven Cir; Denoron Ct; Bay Cedar Ct; Cedarburg Cir; Russelville Dr; Sabra Ct; Holloway Ct.
Other features: Sims Byu.
South Acres neighborhood detailed profile
South Main neighborhood in Houston statistics: (Find on map)
Area: 2.596 square miles
Limited-access highways (interstate or state) in this neighborhood: I- 610 (S Loop Fwy).
Highways in this neighborhood: Main St (US Hwy 90 Alt); US Hwy 90 Alt (Old Spanish Trl).
Roads and streets: Kirby Dr; Old Main St Loop Rd; Bellfort St; W Bellfort St; Westridge; Crosspoint Ave (Cross Point Ave); Knight Rd; Murworth Dr; Willowbend Blvd; Buffalo Speedway; Fannin St; Lantern Point Dr; Lakes at 610 Dr; McNee Rd (Mc Nee Rd); S Point Dr; Interchange Dr; Hearth Dr; Center Point Dr; W Bartell Dr; Fannin; E Point Dr; Main; Odom Blvd; Glencove; Hillcrest; Clearview; Bartell Dr; S Bartell Dr; la Concha Ln.
Railroad features: Southern Pacific RR.
South Main neighborhood detailed profile
South Main Gardens neighborhood in Houston statistics: (Find on map)
Area: 0.133 square miles
Population: 245
Population density:
Median household income in 2021:
Median rent in in 2021:
Male vs Females
Median age
Most popular occupations of males: education, training, and library occupations (29.8%); transportation occupations (23.3%); management occupations (except farmers) (22.0%); service occupations (15.9%); sales and office occupations (12.9%); construction, extraction, and maintenance occupations (12.9%); healthcare practitioners and technical occupations (7.0%)
Most popular occupations of females: sales and office occupations (39.0%); education, training, and library occupations (27.0%); management occupations (except farmers) (20.6%); service occupations (20.2%); transportation occupations (20.2%); production occupations (6.2%); computer and mathematical occupations (4.2%)
Roads and streets: N Garden St.
South Main Gardens neighborhood detailed profile
Area: 0.133 square miles
Population: 245
Population density:
| South Main Gardens: | 1,840 people per square mile |
| Houston: | 3,947 people per square mile |
Median household income in 2021:
| South Main Gardens: | $72,819 |
| Houston: | $55,499 |
Median rent in in 2021:
| South Main Gardens: | $914 |
| Houston: | $974 |
Male vs Females
| Males: | 124 |
| Females: | 121 |
Median age
| Males: | 51.4 years |
| Females: | 51.7 years |
Most popular occupations of males: education, training, and library occupations (29.8%); transportation occupations (23.3%); management occupations (except farmers) (22.0%); service occupations (15.9%); sales and office occupations (12.9%); construction, extraction, and maintenance occupations (12.9%); healthcare practitioners and technical occupations (7.0%)
Most popular occupations of females: sales and office occupations (39.0%); education, training, and library occupations (27.0%); management occupations (except farmers) (20.6%); service occupations (20.2%); transportation occupations (20.2%); production occupations (6.2%); computer and mathematical occupations (4.2%)
Roads and streets: N Garden St.
South Main Gardens neighborhood detailed profile
South Park neighborhood in Houston statistics: (Find on map)
Area: 4.372 square miles
Population: 23,646
Population density:
Median household income in 2021:
Median rent in in 2021:
Male vs Females
Median age
Housing prices:
Average estimated value of detached houses in 2021 (87.1% of all units):
Average estimated value of townhouses or other attached units in 2021 (4.8% of all units):
Most popular occupations of males: construction, extraction, and maintenance occupations (26.5%); service occupations (21.0%); transportation occupations (12.0%); sales and office occupations (10.4%); production occupations (7.3%); material moving occupations (7.3%); management occupations (except farmers) (5.2%)
Most popular occupations of females: service occupations (37.9%); sales and office occupations (27.5%); healthcare practitioners and technical occupations (7.1%); business and financial operations occupations (4.3%); management occupations (except farmers) (4.2%); material moving occupations (4.1%); transportation occupations (3.5%)
Limited-access highways (interstate or state) in this neighborhood: I- 610 (S Loop Fwy).
Roads and streets: Mykawa Rd; Crestmont St; S Park Blvd (Martin Luther King Jr Blvd); Bellfort St; Westover St; Southbank; Willow Glen Dr; Ridgeway Dr; Kenilwood Dr; Doulton Dr; Doolittle Blvd; Pershing St; Saint Lo Rd; Belmark St; Beldart St; Belcrest St; Van Fleet St; Belneath St; Southwind St; Southlea St; Belarbor St; Lyndhurst Dr; Vasser Rd; Malmedy Rd; Reed Rd; Glenhurst Dr; Thrush Dr; Sharondale Dr; Flamingo Dr; Hirondel St; Jutland Rd; Bataan Rd; Burma Rd; Heron Dr; Chennault Rd; S Wayside Dr; Herschelwood St; Martin Luther King Jr Blvd; Belbay St; Belgard St; Silsbee; Crestridge St; Kassarine Pass; Northridge Dr; Rapido Rd; Kirbyville St; Southmont St; Dieppe St; Southridge St; Ricky St; Rockford Dr; Overdale St; Southseas St; Schevers St; Southtown St; Groveton St; Lakefield Dr; Southcrest St; Southford St; Southgood St; Wenda St; Southington St; Longmeadow St; Donoho St; Southville St; Rue St; Windemere St; Wortham Way; Cherbourg Rd; Southmund St; Tarawa Rd; Southurst St; Murphy; Southwell St; Osborn St; Calais Rd; Clearway Dr; Elmlawn Dr; Long Meadow St; Peacock; Anzio Rd; Myrtlewood St; Forrestal St; Crestville St; Waterford Dr; Sunbeam St; Marcy Dr; Southlark St; Glen Hollow Dr; Sandhurst Dr; Cresthill St; Dunkirk Rd; Ardennes St; Eisenhower Rd; Guadalcanal Rd; Hurtgen Forest Rd; Bastogne Rd; Iwo Jima Rd; Krueger Rd; Le Havre Rd; Mountbatten Rd; Okinawa Rd; Remegan Rd; Teneha Dr; Vinearbor St; Bayfield Dr; Calhoun Rd; Crest St; Faircroft Dr; Tobruk Ln; Sur Ct; Kildee Park; Medford Dr; Beldart Ct; Bellfort Ct; Glenside St; Merle St; St Lo Rd; Crest Ct.
Railroad features: at and Sf Rlwy.
Other features: Sims Byu.
South Park neighborhood detailed profile
Area: 4.372 square miles
Population: 23,646
Population density:
| South Park: | 5,408 people per square mile |
| Houston: | 3,947 people per square mile |
Median household income in 2021:
| South Park: | $38,345 |
| Houston: | $55,499 |
Median rent in in 2021:
| South Park: | $812 |
| Houston: | $974 |
Male vs Females
| Males: | 11,450 |
| Females: | 12,195 |
Median age
| Males: | 32.8 years |
| Females: | 37.0 years |
Housing prices:
Average estimated value of detached houses in 2021 (87.1% of all units):
| South Park: | $94,288 |
| Houston: | $304,685 |
Average estimated value of townhouses or other attached units in 2021 (4.8% of all units):
| This neighborhood: | $173,893 |
| city: | $305,463 |
Most popular occupations of males: construction, extraction, and maintenance occupations (26.5%); service occupations (21.0%); transportation occupations (12.0%); sales and office occupations (10.4%); production occupations (7.3%); material moving occupations (7.3%); management occupations (except farmers) (5.2%)
Most popular occupations of females: service occupations (37.9%); sales and office occupations (27.5%); healthcare practitioners and technical occupations (7.1%); business and financial operations occupations (4.3%); management occupations (except farmers) (4.2%); material moving occupations (4.1%); transportation occupations (3.5%)
Limited-access highways (interstate or state) in this neighborhood: I- 610 (S Loop Fwy).
Roads and streets: Mykawa Rd; Crestmont St; S Park Blvd (Martin Luther King Jr Blvd); Bellfort St; Westover St; Southbank; Willow Glen Dr; Ridgeway Dr; Kenilwood Dr; Doulton Dr; Doolittle Blvd; Pershing St; Saint Lo Rd; Belmark St; Beldart St; Belcrest St; Van Fleet St; Belneath St; Southwind St; Southlea St; Belarbor St; Lyndhurst Dr; Vasser Rd; Malmedy Rd; Reed Rd; Glenhurst Dr; Thrush Dr; Sharondale Dr; Flamingo Dr; Hirondel St; Jutland Rd; Bataan Rd; Burma Rd; Heron Dr; Chennault Rd; S Wayside Dr; Herschelwood St; Martin Luther King Jr Blvd; Belbay St; Belgard St; Silsbee; Crestridge St; Kassarine Pass; Northridge Dr; Rapido Rd; Kirbyville St; Southmont St; Dieppe St; Southridge St; Ricky St; Rockford Dr; Overdale St; Southseas St; Schevers St; Southtown St; Groveton St; Lakefield Dr; Southcrest St; Southford St; Southgood St; Wenda St; Southington St; Longmeadow St; Donoho St; Southville St; Rue St; Windemere St; Wortham Way; Cherbourg Rd; Southmund St; Tarawa Rd; Southurst St; Murphy; Southwell St; Osborn St; Calais Rd; Clearway Dr; Elmlawn Dr; Long Meadow St; Peacock; Anzio Rd; Myrtlewood St; Forrestal St; Crestville St; Waterford Dr; Sunbeam St; Marcy Dr; Southlark St; Glen Hollow Dr; Sandhurst Dr; Cresthill St; Dunkirk Rd; Ardennes St; Eisenhower Rd; Guadalcanal Rd; Hurtgen Forest Rd; Bastogne Rd; Iwo Jima Rd; Krueger Rd; Le Havre Rd; Mountbatten Rd; Okinawa Rd; Remegan Rd; Teneha Dr; Vinearbor St; Bayfield Dr; Calhoun Rd; Crest St; Faircroft Dr; Tobruk Ln; Sur Ct; Kildee Park; Medford Dr; Beldart Ct; Bellfort Ct; Glenside St; Merle St; St Lo Rd; Crest Ct.
Railroad features: at and Sf Rlwy.
Other features: Sims Byu.
South Park neighborhood detailed profile
South Union neighborhood in Houston statistics: (Find on map)
Area: 4.305 square miles
Population: 18,595
Population density:
Median household income in 2021:
Median rent in in 2021:
Male vs Females
Median age
Average estimated value of detached houses in 2021 (61.9% of all units):
Most popular occupations of males: service occupations (17.9%); construction, extraction, and maintenance occupations (16.0%); sales and office occupations (15.0%); transportation occupations (9.0%); production occupations (8.2%); management occupations (except farmers) (7.8%); material moving occupations (7.1%)
Most popular occupations of females: service occupations (33.7%); sales and office occupations (28.9%); education, training, and library occupations (7.9%); healthcare practitioners and technical occupations (7.6%); business and financial operations occupations (5.1%); legal occupations (3.1%); material moving occupations (3.1%)
Limited-access highways (interstate or state) in this neighborhood: I- 610 (S Loop Fwy).
Highways in this neighborhood: US Hwy 90 Alt (Old Spanish Trl); State Hwy 288 (South Fwy).
Roads and streets: FM 865 N (Cullen Blvd, Co Rd 865); Yellowstone Blvd; Martin Luther King Jr Blvd; Cosby St; Idaho St; Ward St; Griggs Rd; Beekman Rd; Perry St; Scott St; England St; Balkin St; Tierwester St; Conley St; Calhoun Rd (Calhoun St); Saint Augustine St; Milart St; Alice St; Hull St; Goforth St; Foster St; la Salette St; Sidney St; Corder Ave (Corder St); Eastwood St; Faulkner St; Dreyfus St; Mainer St; Daphne St; Luca St; Sherwood Dr; Keystone St; Dewberry St; Mount Pleasant St; Peerless St; Kingsbury St; New York St; London St; Holmes Rd; Seabrook St; Lydia St; Good Hope St; Noah St; Rebecca St; Zephyr St; Arvilla Ln; Liverpool St; Paris St; Dumble St; Winnetka Ave (Winnetka St); Marietta Ln; Winton St; Madrid St; Burkett St; Weston St; Nathaniel Brown St; Enyart St; del Rio St; Dixie Dr; Lozier St; Grace Ln; Nassau Rd; Amos St; Stearns St; Southlawn St; Cadillac St; Springhill St; Florinda St; Alberta St; Kelso St; Alsace St; Lehall St; Porter Ave; Browncroft St; Cavanaugh St; Ventura Ln; Eppes St; du Pont St; Winfree Dr; Bacon St; Cortelyou Ln; Stuyvesant Ln; Culmore Dr; Belvedere; Dickens Rd; Gren St; Schroeder Rd; Branch; Wayland Dr (Wayland St); SE Tc Three Dr; Gammage St; Brookhaven St; Pomander Rd; Allegheny St; Driftwood St; Tristan St; Newkirk Ln; Yosemite St; Alice; Wyoming St; Andrea St; Weingarten St; Lisa Ln; Normandy Way; Willowbrook Blvd; Short St; Albemarle Ln; Tallow Ln; Carol Ln; Madalyn Ln; Lydia; Stearns; Mykawa Rd; Saint Benedict St; Sunrise Rd; Idaho; Scottcrest Dr; Tolnay Ave (Tolnay St); Beachwood St; Mount Pleasant Cir; Swanson St; Blythewood St; Lehall; Faulkner; Tierwester Village St; Wayland; Penfield Ln; Lady St; Royal Palms St (Royal Palms Dr); Holly Hall St; Radial St; Luca; Mosside St; S Loop Fwy (Brookhaven St); Sidney; Raymond St; Niagara St; Ditmas Ln; Mainer; Calais Rd; Mt Pleasant St; Long Dr; Lozier; Cadillac; Nassau Ct; Crestmont Rd.
Railroad features: Southern Pacific RR.
South Union neighborhood detailed profile
Area: 4.305 square miles
Population: 18,595
Population density:
| South Union (Old Spanish Trail): | 4,319 people per square mile |
| Houston: | 3,947 people per square mile |
Median household income in 2021:
| South Union (Old Spanish Trail): | $35,973 |
| Houston: | $55,499 |
Median rent in in 2021:
| South Union (Old Spanish Trail): | $785 |
| Houston: | $974 |
Male vs Females
| Males: | 8,637 |
| Females: | 9,957 |
Median age
| Males: | 35.8 years |
| Females: | 34.3 years |
Average estimated value of detached houses in 2021 (61.9% of all units):
| South Union (Old Spanish Trail): | $146,395 |
| Houston: | $304,685 |
Most popular occupations of males: service occupations (17.9%); construction, extraction, and maintenance occupations (16.0%); sales and office occupations (15.0%); transportation occupations (9.0%); production occupations (8.2%); management occupations (except farmers) (7.8%); material moving occupations (7.1%)
Most popular occupations of females: service occupations (33.7%); sales and office occupations (28.9%); education, training, and library occupations (7.9%); healthcare practitioners and technical occupations (7.6%); business and financial operations occupations (5.1%); legal occupations (3.1%); material moving occupations (3.1%)
Limited-access highways (interstate or state) in this neighborhood: I- 610 (S Loop Fwy).
Highways in this neighborhood: US Hwy 90 Alt (Old Spanish Trl); State Hwy 288 (South Fwy).
Roads and streets: FM 865 N (Cullen Blvd, Co Rd 865); Yellowstone Blvd; Martin Luther King Jr Blvd; Cosby St; Idaho St; Ward St; Griggs Rd; Beekman Rd; Perry St; Scott St; England St; Balkin St; Tierwester St; Conley St; Calhoun Rd (Calhoun St); Saint Augustine St; Milart St; Alice St; Hull St; Goforth St; Foster St; la Salette St; Sidney St; Corder Ave (Corder St); Eastwood St; Faulkner St; Dreyfus St; Mainer St; Daphne St; Luca St; Sherwood Dr; Keystone St; Dewberry St; Mount Pleasant St; Peerless St; Kingsbury St; New York St; London St; Holmes Rd; Seabrook St; Lydia St; Good Hope St; Noah St; Rebecca St; Zephyr St; Arvilla Ln; Liverpool St; Paris St; Dumble St; Winnetka Ave (Winnetka St); Marietta Ln; Winton St; Madrid St; Burkett St; Weston St; Nathaniel Brown St; Enyart St; del Rio St; Dixie Dr; Lozier St; Grace Ln; Nassau Rd; Amos St; Stearns St; Southlawn St; Cadillac St; Springhill St; Florinda St; Alberta St; Kelso St; Alsace St; Lehall St; Porter Ave; Browncroft St; Cavanaugh St; Ventura Ln; Eppes St; du Pont St; Winfree Dr; Bacon St; Cortelyou Ln; Stuyvesant Ln; Culmore Dr; Belvedere; Dickens Rd; Gren St; Schroeder Rd; Branch; Wayland Dr (Wayland St); SE Tc Three Dr; Gammage St; Brookhaven St; Pomander Rd; Allegheny St; Driftwood St; Tristan St; Newkirk Ln; Yosemite St; Alice; Wyoming St; Andrea St; Weingarten St; Lisa Ln; Normandy Way; Willowbrook Blvd; Short St; Albemarle Ln; Tallow Ln; Carol Ln; Madalyn Ln; Lydia; Stearns; Mykawa Rd; Saint Benedict St; Sunrise Rd; Idaho; Scottcrest Dr; Tolnay Ave (Tolnay St); Beachwood St; Mount Pleasant Cir; Swanson St; Blythewood St; Lehall; Faulkner; Tierwester Village St; Wayland; Penfield Ln; Lady St; Royal Palms St (Royal Palms Dr); Holly Hall St; Radial St; Luca; Mosside St; S Loop Fwy (Brookhaven St); Sidney; Raymond St; Niagara St; Ditmas Ln; Mainer; Calais Rd; Mt Pleasant St; Long Dr; Lozier; Cadillac; Nassau Ct; Crestmont Rd.
Railroad features: Southern Pacific RR.
South Union neighborhood detailed profile
Southbelt neighborhood in Houston statistics: (Find on map)
Area: 21.160 square miles
Population: 47,218
Population density:
Median household income in 2021:
Median rent in in 2021:
Male vs Females
Median age
Housing prices:
Average estimated value of detached houses in 2021 (53.8% of all units):
Average estimated value of townhouses or other attached units in 2021 (19.0% of all units):
Most popular occupations of males: construction, extraction, and maintenance occupations (18.5%); service occupations (14.4%); production occupations (14.2%); sales and office occupations (12.5%); transportation occupations (8.4%); management occupations (except farmers) (5.8%); computer and mathematical occupations (5.4%)
Most popular occupations of females: sales and office occupations (43.6%); service occupations (22.9%); education, training, and library occupations (6.8%); management occupations (except farmers) (5.7%); healthcare practitioners and technical occupations (5.1%); business and financial operations occupations (3.6%); material moving occupations (3.0%)
Other features: Clear Crk (Clear Crk).
Limited-access highways (interstate or state) in this neighborhood: I- 45 (Gulf Fwy).
Highways in this neighborhood: State Loop 8 (Sam Houston Pkwy, Beltway 8); Galveston Rd (State Hwy 3).
Roads and streets: Fuqua Rd (Fuqua St); Beamer Rd; Genoa Red Bluff Rd; Almeda-Genoa Rd; Kingspoint Rd; Scarsdale Blvd; Hall Rd; Sagedowne Ln; Hughes Rd; Sabo Rd; Palmsprings Dr; Brantly Ave; Conklin Ln; Palmbeach St; Gulf Point Dr; Astoria Blvd; Lambright Rd; FM 1959 Rd (Dixie Farm-To-Market Rd, FM 1959); Moers Rd; Southport Dr; Dumas St; Monroe Rd; Shoppe Rd; Ryewater Dr; Kurland Dr; Carmalee St; Sageorchard Ln; Ellington Field; Crenshaw Rd; Mango St; Old Genoa Red Bluff Rd; Kirk; Kirkdale Dr; Wayfarer Ln; Kirkholm Dr; Flushing Meadows Dr; Kensington Pl; Windmill Lakes Blvd; Palmdate St; Dixie Farm Rd (1959 Rd); Sagecanyon Dr; Rambling Trl; Blackhawk Blvd; Newton St (Newton Dr); Palmfree St; Teaneck Dr; Sageriver Dr (Sagedriver Dr); Blume Ave; Sagewillow Ln; Tristar Dr; Sagewind Dr; Sagemeadow Ln; Sagepark Ln; Farley St (Farley Rd); Kirkglen Dr; Kingsflower Cir; Hillard; Sagetrail Dr; Sageburrow Dr; Gulf Palms Dr; Koenig St; Broussard; Fairbury Dr; Chapman; Wald Rd; Caribbean Ln; Stover St; 2nd St (Palmfield St); Palmway St; Sandy Hook Dr (Shady Hook Dr); Freehill; Gulfpalms; Allen-Genoa Rd; Scholl; Santa Monica Blvd; Grieg; Aldis St; Kirkmeadow Dr; Misty Vale Dr (Misty Vale Ln); New Brunswick Dr; Grayson; Lettie Ave; Sagevale Ln; Perimeter Rd; Seaford Dr; Tiltree St; Rhea St; Windwater Dr; Sageberry Dr; Buena Park Dr; Kirkvalley Dr; Kirkhollow Dr; Sagehill Dr; Kirkshire Dr; Haynesworth Ln; Bradford Way St (Bradford Way Dr); Gulf Breeze Dr; Freeton St; Blume; Aerospace Ave; Rowlett Rd; Cayman Mist Dr; Grayson Rd (Grayson Dr); Caffrey St; Sageview Dr; Sageheather Dr; Easthaven Blvd; Winding Rd; Grosvenor; Keith Ave; Minnesota St; Fonville Dr; Fern Terrace Dr; Sagevalley Dr; Kirkhill Dr; Gotham Dr; Washam Rd; Linden Gate Dr; Dickinson Rd; Pompton Dr; Currie; Barbizon Dr; Nelson; Kirkway Dr; Leicester Ln; Gulfstream Park; Hessen St; Rhinebeck Dr; Barrow Downs Way; S Shaver St Exd; Sumerlin St; Corning Dr; Coast Bridge St; Gulf Bridge St; Kleckley Dr; Nyack Dr; Perrie; Alta Loma Way; Malden Dr; Ramey St; Roberts; Popa; Fairchild; Elmhurst St; Sneider; Ebb St; Thermon St; Wessex Dr; Pizzitola St; Torrington Ln; Palmcrest St; Palmcroft St; Old Choate Rd; Charidges Dr; Freedale; H; Kirkbriar Dr; Simpson; Algonquin Dr; Ross Rd; Tree Bridge St; Radio Rd; N Featherwood Dr; Sageglen Dr; Ludgate Pass; Overlea Dr; Sagecrest Ln; Sageleaf Ln; Challenger; Featherwood Dr; Freecrest; Freecroft; Catalina Ln; Clothier; Algen St (Thornlea St); Iron Springs Dr; Ellington Park Dr; Hutchinson; Curie; Sagearbor Dr; White Plains Dr; Paxico; Hoffer St; Sagehollow Ln; Wagner; Valley Pass (Valley Ps); Sagegrove Ln; Kirknoll Dr; Sagehurst Ln; Clark; Wertz; Kings Flower Cir; Sageforest Dr; Green Arbor Dr; S Green Dr; Kirkhall Dr; Freecrest St; Sagewood Dr; Misty Bridge St; Sagecreek Dr; Olentangy St; Easthaven Dr; Kirklane Dr; Circle Dr; Adirondack Dr; Sagebluff Dr; Derbyshire Dr; White Clover Dr; Sagetree Dr; el Buey Rd; Binghamton; Wheaton Dr; McGowan Ln; Thornlea Dr; Middle Bayou Rd; Shasta Springs Dr; Sagecliff Dr; Keese Dr; Kirkwyn Dr; Palmton St; Roydon Dr; Garden Bridge St; Bazin St; Copperstown Dr; Kirkfalls Dr; 1st St; Sagehaven Dr; Carthage Dr; Members Dr; Ritow St; Sageville Dr; Grenadier Dr; Kingspass St; Foredale St; Eddyrock Dr (Eddyrock St); Chancery Rd; Cobbleton Dr; Ellenville Dr; Twig Dr; Bay Star Blvd; Sageland Dr; Glenmawr Dr; Sagewick Dr; Boone; Duffer Ln; Stately Ave; Sageplum Dr; Palmleaf; Sage Oak Dr; Sagebriar Dr; Resource Pkwy; Palmdale St; Goya; Hanesworth Dr (Sherrill Dr); Kirkville Dr; Playa Ct; Palmhill St; Sageway Dr; Indus St; Saranac Dr; Mace Rd; Curlee Rd; Young; Cedar Mesa Dr; Genadena St; Cedar Brg; Marylebone Dr; Red Star St; Eastbourne Dr; Longren St; Park Fuqua Dr; Sagerock Dr; Fossil Rock Ln; Johnson; Gamebird Ln; Covered Bridge St; 21st St; 23rd St; 22nd St; Monteleon; Gulfpalms St; Clearwood; Bystreet Rd; Robbins; Kewalo Basin Ln; Almeda Pines Dr; Tower Bridge St; Buena Park Ct; Bonnington Dr; Jetstream Ct; Famcamp; New Rochelle Dr; Sam Houston Pkwy (State Loop 8); Almeda Oaks Dr; Choate Rd; Pierre Ct; Sagepine Ln; Morrocastle St; Tanner Park Ct; Chaumont Dr; Mize Rd; Eagle Island Ln; Whiteclover Dr (White Clover Dr, Clover Dr); Windview Dr; Amsterdam Dr; Almeda Bend Ct; Herbrand Dr; Stover; Gulf Bridge Ct; Short Bridge St; Fuqua Pr Three Dr; Morton; Palm Island St; Little Star St; Doubleday Dr; Backgate Dr; Tierra Park; Robins; Freestone St; Freehill St; Freeton; Freestar; Palmlake St; Sagegulf Ln; Fuqua Pr Two Dr; Old Forge; Ravena Ct; Holborn Dr; Corum St; Lettie Ct; San Jacinto College One Blvd; Fuqua Pr Four Dr; Tara Hills Ct; San Jacinto College Three Dr; Kingsrose Ln; Old Genoa-Red Bluff Rd; Strand Ct; Kirkpark Dr; Southbluff Blvd; Knighton Cir; Blackhawk Cir; SE Memorial Hospital on Dr; Mule Springs Dr; New Rochelle Ct; Agee; Plum Lake; N Broadway; Gulf Bridge Cir; Charidges Ct; 11th; Sage Lea Ln; Garden Breeze; Dove Way; Dickerson-Gulf Fwy; Short Brg; Sage Elm Ln.
Railroad features: Union Pacific RR.
Other features: Turkey Crk; Horsepen Byu.
Other features: Clear Crk (Clear Crk).
Southbelt neighborhood detailed profile
Area: 21.160 square miles
Population: 47,218
Population density:
| Southbelt (Ellington): | 2,231 people per square mile |
| Houston: | 3,947 people per square mile |
Median household income in 2021:
| Southbelt (Ellington): | $88,979 |
| Houston: | $55,499 |
Median rent in in 2021:
| Southbelt (Ellington): | $1,308 |
| Houston: | $974 |
Male vs Females
| Males: | 24,202 |
| Females: | 23,016 |
Median age
| Males: | 32.9 years |
| Females: | 34.9 years |
Housing prices:
Average estimated value of detached houses in 2021 (53.8% of all units):
| Southbelt (Ellington): | $211,093 |
| Houston: | $304,685 |
Average estimated value of townhouses or other attached units in 2021 (19.0% of all units):
| This neighborhood: | $162,831 |
| city: | $305,463 |
Most popular occupations of males: construction, extraction, and maintenance occupations (18.5%); service occupations (14.4%); production occupations (14.2%); sales and office occupations (12.5%); transportation occupations (8.4%); management occupations (except farmers) (5.8%); computer and mathematical occupations (5.4%)
Most popular occupations of females: sales and office occupations (43.6%); service occupations (22.9%); education, training, and library occupations (6.8%); management occupations (except farmers) (5.7%); healthcare practitioners and technical occupations (5.1%); business and financial operations occupations (3.6%); material moving occupations (3.0%)
Other features: Clear Crk (Clear Crk).
Limited-access highways (interstate or state) in this neighborhood: I- 45 (Gulf Fwy).
Highways in this neighborhood: State Loop 8 (Sam Houston Pkwy, Beltway 8); Galveston Rd (State Hwy 3).
Roads and streets: Fuqua Rd (Fuqua St); Beamer Rd; Genoa Red Bluff Rd; Almeda-Genoa Rd; Kingspoint Rd; Scarsdale Blvd; Hall Rd; Sagedowne Ln; Hughes Rd; Sabo Rd; Palmsprings Dr; Brantly Ave; Conklin Ln; Palmbeach St; Gulf Point Dr; Astoria Blvd; Lambright Rd; FM 1959 Rd (Dixie Farm-To-Market Rd, FM 1959); Moers Rd; Southport Dr; Dumas St; Monroe Rd; Shoppe Rd; Ryewater Dr; Kurland Dr; Carmalee St; Sageorchard Ln; Ellington Field; Crenshaw Rd; Mango St; Old Genoa Red Bluff Rd; Kirk; Kirkdale Dr; Wayfarer Ln; Kirkholm Dr; Flushing Meadows Dr; Kensington Pl; Windmill Lakes Blvd; Palmdate St; Dixie Farm Rd (1959 Rd); Sagecanyon Dr; Rambling Trl; Blackhawk Blvd; Newton St (Newton Dr); Palmfree St; Teaneck Dr; Sageriver Dr (Sagedriver Dr); Blume Ave; Sagewillow Ln; Tristar Dr; Sagewind Dr; Sagemeadow Ln; Sagepark Ln; Farley St (Farley Rd); Kirkglen Dr; Kingsflower Cir; Hillard; Sagetrail Dr; Sageburrow Dr; Gulf Palms Dr; Koenig St; Broussard; Fairbury Dr; Chapman; Wald Rd; Caribbean Ln; Stover St; 2nd St (Palmfield St); Palmway St; Sandy Hook Dr (Shady Hook Dr); Freehill; Gulfpalms; Allen-Genoa Rd; Scholl; Santa Monica Blvd; Grieg; Aldis St; Kirkmeadow Dr; Misty Vale Dr (Misty Vale Ln); New Brunswick Dr; Grayson; Lettie Ave; Sagevale Ln; Perimeter Rd; Seaford Dr; Tiltree St; Rhea St; Windwater Dr; Sageberry Dr; Buena Park Dr; Kirkvalley Dr; Kirkhollow Dr; Sagehill Dr; Kirkshire Dr; Haynesworth Ln; Bradford Way St (Bradford Way Dr); Gulf Breeze Dr; Freeton St; Blume; Aerospace Ave; Rowlett Rd; Cayman Mist Dr; Grayson Rd (Grayson Dr); Caffrey St; Sageview Dr; Sageheather Dr; Easthaven Blvd; Winding Rd; Grosvenor; Keith Ave; Minnesota St; Fonville Dr; Fern Terrace Dr; Sagevalley Dr; Kirkhill Dr; Gotham Dr; Washam Rd; Linden Gate Dr; Dickinson Rd; Pompton Dr; Currie; Barbizon Dr; Nelson; Kirkway Dr; Leicester Ln; Gulfstream Park; Hessen St; Rhinebeck Dr; Barrow Downs Way; S Shaver St Exd; Sumerlin St; Corning Dr; Coast Bridge St; Gulf Bridge St; Kleckley Dr; Nyack Dr; Perrie; Alta Loma Way; Malden Dr; Ramey St; Roberts; Popa; Fairchild; Elmhurst St; Sneider; Ebb St; Thermon St; Wessex Dr; Pizzitola St; Torrington Ln; Palmcrest St; Palmcroft St; Old Choate Rd; Charidges Dr; Freedale; H; Kirkbriar Dr; Simpson; Algonquin Dr; Ross Rd; Tree Bridge St; Radio Rd; N Featherwood Dr; Sageglen Dr; Ludgate Pass; Overlea Dr; Sagecrest Ln; Sageleaf Ln; Challenger; Featherwood Dr; Freecrest; Freecroft; Catalina Ln; Clothier; Algen St (Thornlea St); Iron Springs Dr; Ellington Park Dr; Hutchinson; Curie; Sagearbor Dr; White Plains Dr; Paxico; Hoffer St; Sagehollow Ln; Wagner; Valley Pass (Valley Ps); Sagegrove Ln; Kirknoll Dr; Sagehurst Ln; Clark; Wertz; Kings Flower Cir; Sageforest Dr; Green Arbor Dr; S Green Dr; Kirkhall Dr; Freecrest St; Sagewood Dr; Misty Bridge St; Sagecreek Dr; Olentangy St; Easthaven Dr; Kirklane Dr; Circle Dr; Adirondack Dr; Sagebluff Dr; Derbyshire Dr; White Clover Dr; Sagetree Dr; el Buey Rd; Binghamton; Wheaton Dr; McGowan Ln; Thornlea Dr; Middle Bayou Rd; Shasta Springs Dr; Sagecliff Dr; Keese Dr; Kirkwyn Dr; Palmton St; Roydon Dr; Garden Bridge St; Bazin St; Copperstown Dr; Kirkfalls Dr; 1st St; Sagehaven Dr; Carthage Dr; Members Dr; Ritow St; Sageville Dr; Grenadier Dr; Kingspass St; Foredale St; Eddyrock Dr (Eddyrock St); Chancery Rd; Cobbleton Dr; Ellenville Dr; Twig Dr; Bay Star Blvd; Sageland Dr; Glenmawr Dr; Sagewick Dr; Boone; Duffer Ln; Stately Ave; Sageplum Dr; Palmleaf; Sage Oak Dr; Sagebriar Dr; Resource Pkwy; Palmdale St; Goya; Hanesworth Dr (Sherrill Dr); Kirkville Dr; Playa Ct; Palmhill St; Sageway Dr; Indus St; Saranac Dr; Mace Rd; Curlee Rd; Young; Cedar Mesa Dr; Genadena St; Cedar Brg; Marylebone Dr; Red Star St; Eastbourne Dr; Longren St; Park Fuqua Dr; Sagerock Dr; Fossil Rock Ln; Johnson; Gamebird Ln; Covered Bridge St; 21st St; 23rd St; 22nd St; Monteleon; Gulfpalms St; Clearwood; Bystreet Rd; Robbins; Kewalo Basin Ln; Almeda Pines Dr; Tower Bridge St; Buena Park Ct; Bonnington Dr; Jetstream Ct; Famcamp; New Rochelle Dr; Sam Houston Pkwy (State Loop 8); Almeda Oaks Dr; Choate Rd; Pierre Ct; Sagepine Ln; Morrocastle St; Tanner Park Ct; Chaumont Dr; Mize Rd; Eagle Island Ln; Whiteclover Dr (White Clover Dr, Clover Dr); Windview Dr; Amsterdam Dr; Almeda Bend Ct; Herbrand Dr; Stover; Gulf Bridge Ct; Short Bridge St; Fuqua Pr Three Dr; Morton; Palm Island St; Little Star St; Doubleday Dr; Backgate Dr; Tierra Park; Robins; Freestone St; Freehill St; Freeton; Freestar; Palmlake St; Sagegulf Ln; Fuqua Pr Two Dr; Old Forge; Ravena Ct; Holborn Dr; Corum St; Lettie Ct; San Jacinto College One Blvd; Fuqua Pr Four Dr; Tara Hills Ct; San Jacinto College Three Dr; Kingsrose Ln; Old Genoa-Red Bluff Rd; Strand Ct; Kirkpark Dr; Southbluff Blvd; Knighton Cir; Blackhawk Cir; SE Memorial Hospital on Dr; Mule Springs Dr; New Rochelle Ct; Agee; Plum Lake; N Broadway; Gulf Bridge Cir; Charidges Ct; 11th; Sage Lea Ln; Garden Breeze; Dove Way; Dickerson-Gulf Fwy; Short Brg; Sage Elm Ln.
Railroad features: Union Pacific RR.
Other features: Turkey Crk; Horsepen Byu.
Other features: Clear Crk (Clear Crk).
Southbelt neighborhood detailed profile
Spring neighborhood in Houston statistics: (Find on map)
Area: 14.566 square miles
Population: 50,859
Population density:
Median household income in 2021:
Median rent in in 2021:
Male vs Females
Median age
Housing prices:
Average estimated value of detached houses in 2021 (47.6% of all units):
Average estimated value of townhouses or other attached units in 2021 (9.4% of all units):
Average estimated '21 value of housing units in 3-to-4-unit structures (7.7% of all units):
Average estimated '21 value of housing units in 5-or-more-unit structures (11.2% of all units):
Average estimated value of mobile home in 2021 (12.4% of all units):
Most popular occupations of males: construction, extraction, and maintenance occupations (24.3%); service occupations (15.6%); sales and office occupations (13.0%); management occupations (except farmers) (9.8%); business and financial operations occupations (7.6%); production occupations (5.7%); material moving occupations (5.1%)
Most popular occupations of females: sales and office occupations (21.9%); service occupations (20.2%); management occupations (except farmers) (16.7%); production occupations (9.5%); healthcare practitioners and technical occupations (9.0%); business and financial operations occupations (6.4%); education, training, and library occupations (3.0%)
Limited-access highways (interstate or state) in this neighborhood: Katy Fwy (I- 10, US Hwy 90).
Highways in this neighborhood: State Loop 8 (Sam Houston Pkwy, Beltway 8).
Roads and streets: Hammerly Blvd; Old Katy Rd; Shadowdale Dr; Emnora Ln; Kempwood Dr; Campbell Rd; Westview Dr; Long Point Rd; Blalock Rd; Brittmoore Rd; Gessner Dr (Gessner Rd); Shadow Wood Dr; Hollister St (Hollister Rd); Hazelhurst Dr; Knoboak Dr; Kemp Forest Dr; Alcott Dr; Moorberry Ln; Neuens Rd; Sherwood Forest St; Wycliffe Dr; Crestdale Dr; Larston St; Witte Rd; Vogue Ln; Peppermill Rd; Conrad Sauer Dr; Colleen Rd; Oak Tree Dr; Pitner Rd; Bingle Rd; Ojeman Rd; Rosefield Dr; Teague Rd; Upland Dr; Warwana Rd; Norton Dr; Cedardale Dr; Kerrwood Ln; Metronome Dr; Haddington Dr; Mayfield Rd; Carousel Ln; Ivyridge Rd; Adkins Rd; Triway Ln; Elmview Dr; Manila Ln; Timberoak Dr; Chatterton Dr; Tiger Trl; Blankenship Dr; Westray; Bunker Hill Rd; Springrock Ln; Pine Lake Dr; Spring Branch Dr; Lazy Spring Dr; Maux Dr; Brinwood Dr; Railton St; Cedar Post Ln; Friendship Rd; Mc Kean Dr; Theysen Dr; Laverne St; Stebbins Dr; Eddystone Dr; Shadow Bend Dr; Tilson Ln; Parana Dr; Rollingwood Dr; Lumpkin Rd; Bauer Dr; Springview Ln; Durban Dr; Timberline Rd; Wisterwood Dr; Rockhurst Dr; Oakstream Dr; Derrik Dr; Autauga St; Mona Lee Ln; Stetson Ln; Shadow Ln; Fontana Dr; Eaglerock Dr; Pine Village Dr; Spring Valley Rd; Quincannon Ln; Morningview Dr; Hoskins Dr; Briarwild Ln; Willowview Ln; Confederate Rd; Spillers Ln; Knoll St; Kismet Ln; Hanka Dr; Whiteside Ln; Hollow Hook Rd; Raritan Dr; Livernois Rd; Lexford Ln; Kenross St; Oak Point Dr; Elmgate Dr; Shadow Oaks Dr; Nocturne Ln; Rothbury St; Bernadette Ln; Scenic Ridge Dr; Imperial Crown Dr; Southwick St; Londonderry Dr; Helmsdale St; Opelika St; Barwood Dr; Elizabeth Rd; Raider Cir N; Benbow Way; Palo Pinto Dr; Riata Ln; Sowden Rd; Kevin Ln; Pecos St; Longacre Dr; Claymoore Park Dr; Moss Ridge Rd; Weatherwood Dr; Creek Dr; Mountain Rose Ln; Truscon Dr; Mapleton Dr; Moss Hill Dr; Ottawa Ln; Clarborough Pl; Timberwood Dr; Long Branch Ln; Springmont Dr; Shadeland Dr; Stebbins Cir; Olathe St; Springwood Forest Dr; Bracher St; Butlercrest St; Pomeran Dr; Anne St; Townhurst Dr; Mc Dade St; Greiner Dr; Peer Dr; Clanton St; Raider Cir S; Rosstown Way; Waterville Rd; Rangely Dr; Galway Ln; Springwood Dr; Eldora Dr; Tappenbeck Dr; Mallard Dr; Lazy Oaks St; Allegro St N; Dalecrest Dr; S Fairhollow Ln; Yupondale Dr (Yupondale St); Bundy Ln; Cranway Dr; Vilven Ln; N Fairhollow Ln; Bear Creek Meadows Ln; Greensward Rd; Sonneville Dr; Stillwood Dr; Talina Way; Philmont Dr; Fredonia Dr; Bandelier Dr; Ruland Rd; Anniston Dr; Day Rd; Ridgeview Dr; Lawngate Dr; Western Village Ln; Aruba Dr; Church Ln; Fullerton Dr; Valleyfield Dr; S Youngwood Ln; N Youngwood Ln; Greyburn Ln; Moss Branch Rd; Echo Grove Ln; Bullock Ln; Murrayhill Dr; Crownover Rd; Northbrook Dr; Allegro St S; Bronco Dr; Candace St; Kersten Dr; Wood Hollow Ln; Ganyard Dr; Georgibelle Dr; Canoga Ln; Maple Springs Dr; Windhover Ln; Longhorn Dr; Chaparral Dr; Centennial Dr; Buescher Dr; Braymore Dr; Sedgie Dr; Oak Spring Dr; Padfield St; Springmeadows St; Fairbend St; E Tri Oaks Ln; Turriff St; Colleen Meadows Cir; Montridge Dr; Cameo Dr; Prism Ln; Murray Bay St; Colleen Woods Cir; Billings Dr; Durango Dr; Saddle Ln; Western Dr; Poco Rd; Leto Rd; Maribelle Way; Demaret Ln; Highcrest Dr; Lively Ln; Mountain Ridge Rd; Panola Way; Raider Cir E; Moss Tree Rd; Cathey Ln; Kimwood Dr; Varner Rd; Cold Spring Dr; Hornpipe Ln; Shelmer Dr; Banzer St; Willow Springs Ln; Waseca St; Agar Ln; Moorhead Dr; Foley; Springwell Dr; Mathewson Ln; Philco Dr; Ash Creek Dr; Kemp Hollow Ln; Tollis St; Pecan Creek Dr; Valley Stream Dr; Pado St; Barr St; Valley Spring Dr; Debbie Ln; Mesa Ridge Rd; Brigade; Cluster Dr; Springmeadow; Clarblak Ln; du Lock Ln; Wickerbay St; Coleen Cir (Coleenwood Cir); Crispin Ln; Brooktree Dr; Big Bend Dr; Britt Way; Birchton St; Rossette Dr; W Belt Pr One Dr; Shadow Bend; Claret Ln; Manire Dr; Spur Ln; Barr Cir; Namora Ln; Bookman Park Dr; Renwood Dr; Target Dr; Butlercrest; Tanbark Dr; Cedar Post St; Fitze Ln; N Wickerwood St; S Wickerwood St; Mardi Ln; Buckmann Ct; Millspring Dr; Kenross; Skyview Dr; N Wilcrest Dr; Allegro St E; Beekman Place Dr; Target Ct; Foxrun Ct; Laurenhurst Ct; Tiara Ln; Imperial Crown Ct; Anne; Theysen Cir; Fire Creek Dr; Railton Ct; Knoboak Cir; Namora Ct; Parana Ct; Lanell Ln; Echo Ln; Vaja Dr; Sherwood Forest; Bordeau Blvd; Crestdale Cir; Southwick Dr; Barwood Ct.
Other features: Briar Br.
Other features: Spring Branch Crk.
Other features: Brickhouse Gully; Rummel Crk; Brickhouse Gully Strm.
Spring neighborhood detailed profile
Area: 14.566 square miles
Population: 50,859
Population density:
| Spring: | 3,492 people per square mile |
| Houston: | 3,947 people per square mile |
Median household income in 2021:
| Spring: | $107,201 |
| Houston: | $55,499 |
Median rent in in 2021:
| Spring: | $1,057 |
| Houston: | $974 |
Male vs Females
| Males: | 25,279 |
| Females: | 25,580 |
Median age
| Males: | 36.8 years |
| Females: | 38.9 years |
Housing prices:
Average estimated value of detached houses in 2021 (47.6% of all units):
| Spring: | $323,364 |
| Houston: | $304,685 |
Average estimated value of townhouses or other attached units in 2021 (9.4% of all units):
| This neighborhood: | $177,825 |
| city: | $305,463 |
Average estimated '21 value of housing units in 3-to-4-unit structures (7.7% of all units):
| Spring: | $80,833 |
| city: | $184,874 |
Average estimated '21 value of housing units in 5-or-more-unit structures (11.2% of all units):
| Spring: | $102,336 |
| Houston: | $227,414 |
Average estimated value of mobile home in 2021 (12.4% of all units):
| Spring: | $33,151 |
| Houston: | $60,006 |
Most popular occupations of males: construction, extraction, and maintenance occupations (24.3%); service occupations (15.6%); sales and office occupations (13.0%); management occupations (except farmers) (9.8%); business and financial operations occupations (7.6%); production occupations (5.7%); material moving occupations (5.1%)
Most popular occupations of females: sales and office occupations (21.9%); service occupations (20.2%); management occupations (except farmers) (16.7%); production occupations (9.5%); healthcare practitioners and technical occupations (9.0%); business and financial operations occupations (6.4%); education, training, and library occupations (3.0%)
Limited-access highways (interstate or state) in this neighborhood: Katy Fwy (I- 10, US Hwy 90).
Highways in this neighborhood: State Loop 8 (Sam Houston Pkwy, Beltway 8).
Roads and streets: Hammerly Blvd; Old Katy Rd; Shadowdale Dr; Emnora Ln; Kempwood Dr; Campbell Rd; Westview Dr; Long Point Rd; Blalock Rd; Brittmoore Rd; Gessner Dr (Gessner Rd); Shadow Wood Dr; Hollister St (Hollister Rd); Hazelhurst Dr; Knoboak Dr; Kemp Forest Dr; Alcott Dr; Moorberry Ln; Neuens Rd; Sherwood Forest St; Wycliffe Dr; Crestdale Dr; Larston St; Witte Rd; Vogue Ln; Peppermill Rd; Conrad Sauer Dr; Colleen Rd; Oak Tree Dr; Pitner Rd; Bingle Rd; Ojeman Rd; Rosefield Dr; Teague Rd; Upland Dr; Warwana Rd; Norton Dr; Cedardale Dr; Kerrwood Ln; Metronome Dr; Haddington Dr; Mayfield Rd; Carousel Ln; Ivyridge Rd; Adkins Rd; Triway Ln; Elmview Dr; Manila Ln; Timberoak Dr; Chatterton Dr; Tiger Trl; Blankenship Dr; Westray; Bunker Hill Rd; Springrock Ln; Pine Lake Dr; Spring Branch Dr; Lazy Spring Dr; Maux Dr; Brinwood Dr; Railton St; Cedar Post Ln; Friendship Rd; Mc Kean Dr; Theysen Dr; Laverne St; Stebbins Dr; Eddystone Dr; Shadow Bend Dr; Tilson Ln; Parana Dr; Rollingwood Dr; Lumpkin Rd; Bauer Dr; Springview Ln; Durban Dr; Timberline Rd; Wisterwood Dr; Rockhurst Dr; Oakstream Dr; Derrik Dr; Autauga St; Mona Lee Ln; Stetson Ln; Shadow Ln; Fontana Dr; Eaglerock Dr; Pine Village Dr; Spring Valley Rd; Quincannon Ln; Morningview Dr; Hoskins Dr; Briarwild Ln; Willowview Ln; Confederate Rd; Spillers Ln; Knoll St; Kismet Ln; Hanka Dr; Whiteside Ln; Hollow Hook Rd; Raritan Dr; Livernois Rd; Lexford Ln; Kenross St; Oak Point Dr; Elmgate Dr; Shadow Oaks Dr; Nocturne Ln; Rothbury St; Bernadette Ln; Scenic Ridge Dr; Imperial Crown Dr; Southwick St; Londonderry Dr; Helmsdale St; Opelika St; Barwood Dr; Elizabeth Rd; Raider Cir N; Benbow Way; Palo Pinto Dr; Riata Ln; Sowden Rd; Kevin Ln; Pecos St; Longacre Dr; Claymoore Park Dr; Moss Ridge Rd; Weatherwood Dr; Creek Dr; Mountain Rose Ln; Truscon Dr; Mapleton Dr; Moss Hill Dr; Ottawa Ln; Clarborough Pl; Timberwood Dr; Long Branch Ln; Springmont Dr; Shadeland Dr; Stebbins Cir; Olathe St; Springwood Forest Dr; Bracher St; Butlercrest St; Pomeran Dr; Anne St; Townhurst Dr; Mc Dade St; Greiner Dr; Peer Dr; Clanton St; Raider Cir S; Rosstown Way; Waterville Rd; Rangely Dr; Galway Ln; Springwood Dr; Eldora Dr; Tappenbeck Dr; Mallard Dr; Lazy Oaks St; Allegro St N; Dalecrest Dr; S Fairhollow Ln; Yupondale Dr (Yupondale St); Bundy Ln; Cranway Dr; Vilven Ln; N Fairhollow Ln; Bear Creek Meadows Ln; Greensward Rd; Sonneville Dr; Stillwood Dr; Talina Way; Philmont Dr; Fredonia Dr; Bandelier Dr; Ruland Rd; Anniston Dr; Day Rd; Ridgeview Dr; Lawngate Dr; Western Village Ln; Aruba Dr; Church Ln; Fullerton Dr; Valleyfield Dr; S Youngwood Ln; N Youngwood Ln; Greyburn Ln; Moss Branch Rd; Echo Grove Ln; Bullock Ln; Murrayhill Dr; Crownover Rd; Northbrook Dr; Allegro St S; Bronco Dr; Candace St; Kersten Dr; Wood Hollow Ln; Ganyard Dr; Georgibelle Dr; Canoga Ln; Maple Springs Dr; Windhover Ln; Longhorn Dr; Chaparral Dr; Centennial Dr; Buescher Dr; Braymore Dr; Sedgie Dr; Oak Spring Dr; Padfield St; Springmeadows St; Fairbend St; E Tri Oaks Ln; Turriff St; Colleen Meadows Cir; Montridge Dr; Cameo Dr; Prism Ln; Murray Bay St; Colleen Woods Cir; Billings Dr; Durango Dr; Saddle Ln; Western Dr; Poco Rd; Leto Rd; Maribelle Way; Demaret Ln; Highcrest Dr; Lively Ln; Mountain Ridge Rd; Panola Way; Raider Cir E; Moss Tree Rd; Cathey Ln; Kimwood Dr; Varner Rd; Cold Spring Dr; Hornpipe Ln; Shelmer Dr; Banzer St; Willow Springs Ln; Waseca St; Agar Ln; Moorhead Dr; Foley; Springwell Dr; Mathewson Ln; Philco Dr; Ash Creek Dr; Kemp Hollow Ln; Tollis St; Pecan Creek Dr; Valley Stream Dr; Pado St; Barr St; Valley Spring Dr; Debbie Ln; Mesa Ridge Rd; Brigade; Cluster Dr; Springmeadow; Clarblak Ln; du Lock Ln; Wickerbay St; Coleen Cir (Coleenwood Cir); Crispin Ln; Brooktree Dr; Big Bend Dr; Britt Way; Birchton St; Rossette Dr; W Belt Pr One Dr; Shadow Bend; Claret Ln; Manire Dr; Spur Ln; Barr Cir; Namora Ln; Bookman Park Dr; Renwood Dr; Target Dr; Butlercrest; Tanbark Dr; Cedar Post St; Fitze Ln; N Wickerwood St; S Wickerwood St; Mardi Ln; Buckmann Ct; Millspring Dr; Kenross; Skyview Dr; N Wilcrest Dr; Allegro St E; Beekman Place Dr; Target Ct; Foxrun Ct; Laurenhurst Ct; Tiara Ln; Imperial Crown Ct; Anne; Theysen Cir; Fire Creek Dr; Railton Ct; Knoboak Cir; Namora Ct; Parana Ct; Lanell Ln; Echo Ln; Vaja Dr; Sherwood Forest; Bordeau Blvd; Crestdale Cir; Southwick Dr; Barwood Ct.
Other features: Briar Br.
Other features: Spring Branch Crk.
Other features: Brickhouse Gully; Rummel Crk; Brickhouse Gully Strm.
Spring neighborhood detailed profile
Spring Branch neighborhood in Houston statistics: (Find on map)
Area: 3.010 square miles
Population: 6,852
Population density:
Median household income in 2021:
Median rent in in 2021:
Male vs Females
Median age
Housing prices:
Average estimated value of detached houses in 2021 (88.0% of all units):
Average estimated value of townhouses or other attached units in 2021 (14.4% of all units):
Most popular occupations of males: construction, extraction, and maintenance occupations (17.6%); service occupations (15.7%); sales and office occupations (12.3%); transportation occupations (9.8%); production occupations (8.6%); management occupations (except farmers) (7.8%); education, training, and library occupations (5.4%)
Most popular occupations of females: service occupations (28.4%); sales and office occupations (23.8%); management occupations (except farmers) (10.6%); healthcare practitioners and technical occupations (10.4%); computer and mathematical occupations (9.3%); transportation occupations (5.0%); business and financial operations occupations (3.7%)
Highways in this neighborhood: Beltway 8 (State Loop 8, Sam Houston Pkwy).
Roads and streets: Sommermeyer St; Hempstead Rd (Hempstead Hwy); Gessner Dr (Gessner Rd); Windfern Rd; Okanella St; Genard Rd; Teague Rd; Campbell Rd; Hempstead Rd; Tanner Rd; Hollow Hook Rd; Talina Way; Papalote St; W Little York Rd; Porto Rico Rd; Fisher Rd; Burnside Ln; Algiers Rd; Senate St; Bus Park Dr; Bamboo Rd; W Wingfoot Rd; Crawford Rd; Triway Ln; Tangiers Rd; Clara Rd; Dancy Rd; Olga Ln; Alfred Ln; Hardison Ln; Comanche Ln; Chickasaw Ln; Sussex Ln; Grover Ln; Clay Rd; Talley Ln; Morocco Rd; Vallen Dr; Perimeter Park Dr; Sweetbay Ln; Dierker Dr; Roxburgh Dr; Nyoka St; Softwind Rd; Drysdale Ln; Park Entry Dr; Keyko St; Perimeter West Dr; Goodrum Rd; Rockcrest Dr (Rockcrest Rd); Lybert Rd; Lybert Dr; Hillcrest Rd; Crossover.
Railroad features: Southern Pacific RR.
Other features: Cole Crk.
Spring Branch neighborhood detailed profile
Area: 3.010 square miles
Population: 6,852
Population density:
| Spring Branch: | 2,277 people per square mile |
| Houston: | 3,947 people per square mile |
Median household income in 2021:
| Spring Branch: | $73,178 |
| Houston: | $55,499 |
Median rent in in 2021:
| Spring Branch: | $1,056 |
| Houston: | $974 |
Male vs Females
| Males: | 3,676 |
| Females: | 3,175 |
Median age
| Males: | 40.7 years |
| Females: | 41.5 years |
Housing prices:
Average estimated value of detached houses in 2021 (88.0% of all units):
| Spring Branch: | $178,550 |
| Houston: | $304,685 |
Average estimated value of townhouses or other attached units in 2021 (14.4% of all units):
| This neighborhood: | $21,734 |
| city: | $305,463 |
Most popular occupations of males: construction, extraction, and maintenance occupations (17.6%); service occupations (15.7%); sales and office occupations (12.3%); transportation occupations (9.8%); production occupations (8.6%); management occupations (except farmers) (7.8%); education, training, and library occupations (5.4%)
Most popular occupations of females: service occupations (28.4%); sales and office occupations (23.8%); management occupations (except farmers) (10.6%); healthcare practitioners and technical occupations (10.4%); computer and mathematical occupations (9.3%); transportation occupations (5.0%); business and financial operations occupations (3.7%)
Highways in this neighborhood: Beltway 8 (State Loop 8, Sam Houston Pkwy).
Roads and streets: Sommermeyer St; Hempstead Rd (Hempstead Hwy); Gessner Dr (Gessner Rd); Windfern Rd; Okanella St; Genard Rd; Teague Rd; Campbell Rd; Hempstead Rd; Tanner Rd; Hollow Hook Rd; Talina Way; Papalote St; W Little York Rd; Porto Rico Rd; Fisher Rd; Burnside Ln; Algiers Rd; Senate St; Bus Park Dr; Bamboo Rd; W Wingfoot Rd; Crawford Rd; Triway Ln; Tangiers Rd; Clara Rd; Dancy Rd; Olga Ln; Alfred Ln; Hardison Ln; Comanche Ln; Chickasaw Ln; Sussex Ln; Grover Ln; Clay Rd; Talley Ln; Morocco Rd; Vallen Dr; Perimeter Park Dr; Sweetbay Ln; Dierker Dr; Roxburgh Dr; Nyoka St; Softwind Rd; Drysdale Ln; Park Entry Dr; Keyko St; Perimeter West Dr; Goodrum Rd; Rockcrest Dr (Rockcrest Rd); Lybert Rd; Lybert Dr; Hillcrest Rd; Crossover.
Railroad features: Southern Pacific RR.
Other features: Cole Crk.
Spring Branch neighborhood detailed profile
Spring Branch Central neighborhood in Houston statistics: (Find on map)
Area: 3.699 square miles
Population: 18,505
Population density:
Median household income in 2021:
Median rent in in 2021:
Male vs Females
Median age
Housing prices:
Average estimated value of detached houses in 2021 (42.7% of all units):
Average estimated value of townhouses or other attached units in 2021 (4.5% of all units):
Average estimated value of mobile home in 2021 (49.7% of all units):
Most popular occupations of males: construction, extraction, and maintenance occupations (27.3%); service occupations (20.9%); sales and office occupations (10.9%); management occupations (except farmers) (10.3%); production occupations (6.3%); business and financial operations occupations (6.1%); material moving occupations (4.6%)
Most popular occupations of females: service occupations (25.3%); sales and office occupations (22.7%); production occupations (14.1%); management occupations (except farmers) (10.7%); healthcare practitioners and technical occupations (8.1%); business and financial operations occupations (5.5%); education, training, and library occupations (4.3%)
Roads and streets: Campbell Rd; Hollister St (Hollister Rd); Blalock Rd; Emnora Ln; Long Point Rd; Hammerly Blvd; Peppermill Rd; Pitner Rd; Bingle Rd; Ojeman Rd; Kempwood Dr; Colleen Rd; Spring Branch Dr; Lazy Spring Dr; Blankenship Dr; Friendship Rd; Mc Kean Dr; Theysen Dr; Laverne St; Carousel Ln; Tilson Ln; Alcott Dr; Bauer Dr; Adkins Rd; Autauga St; Mona Lee Ln; Kerrwood Ln; Morningview Dr; Hoskins Dr; Westview Dr; Knoll St; Railton St; Rockhurst Dr; Livernois Rd; Willowview Ln; Derrik Dr; Vogue Ln; Opelika St; Elizabeth Rd; Benbow Way; Sowden Rd; Larston St; Pecos St; Longacre Dr; Creek Dr; Olathe St; Bracher St; Anne St; Mc Dade St; Greiner Dr; Springview Ln; Rosstown Way; Waterville Rd; Rangely Dr; Galway Ln; Springwood Dr; Eldora Dr; Norton Dr; Allegro St N; Cranway Dr; Greensward Rd; Sonneville Dr; Fredonia Dr; Ruland Rd; Aruba Dr; Valleyfield Dr; Crownover Rd; Allegro St S; Bronco Dr; Candace St; Padfield St; Springmeadows St; Fairbend St; Turriff St; Colleen Meadows Cir; Montridge Dr; Cameo Dr; Colleen Woods Cir; Billings Dr; Durango Dr; Saddle Ln; Western Dr; Poco Rd; Leto Rd; Highcrest Dr; Cathey Ln; Kimwood Dr; Varner Rd; Shelmer Dr; Banzer St; Willow Springs Ln; Waseca St; Foley; Philco Dr; Tollis St; Pado St; Barr St; Springmont Dr; Springmeadow; Coleen Cir (Coleenwood Cir); Big Bend Dr; Birchton St; Rossette Dr; Clanton St; Manire Dr; Spur Ln; Barr Cir; Namora Ln; Renwood Dr; Tanbark Dr; Millspring Dr; Allegro St E; Anne; Theysen Cir; Railton Ct; Namora Ct.
Other features: Spring Branch Crk.
Other features: Brickhouse Gully; Briar Br; Brickhouse Gully Strm.
Spring Branch Central neighborhood detailed profile
Area: 3.699 square miles
Population: 18,505
Population density:
| Spring Branch Central: | 5,003 people per square mile |
| Houston: | 3,947 people per square mile |
Median household income in 2021:
| Spring Branch Central: | $57,912 |
| Houston: | $55,499 |
Median rent in in 2021:
| Spring Branch Central: | $937 |
| Houston: | $974 |
Male vs Females
| Males: | 9,550 |
| Females: | 8,954 |
Median age
| Males: | 32.5 years |
| Females: | 32.0 years |
Housing prices:
Average estimated value of detached houses in 2021 (42.7% of all units):
| Spring Branch Central: | $287,094 |
| Houston: | $304,685 |
Average estimated value of townhouses or other attached units in 2021 (4.5% of all units):
| This neighborhood: | $375,432 |
| city: | $305,463 |
Average estimated value of mobile home in 2021 (49.7% of all units):
| Spring Branch Central: | $33,151 |
| Houston: | $60,006 |
Most popular occupations of males: construction, extraction, and maintenance occupations (27.3%); service occupations (20.9%); sales and office occupations (10.9%); management occupations (except farmers) (10.3%); production occupations (6.3%); business and financial operations occupations (6.1%); material moving occupations (4.6%)
Most popular occupations of females: service occupations (25.3%); sales and office occupations (22.7%); production occupations (14.1%); management occupations (except farmers) (10.7%); healthcare practitioners and technical occupations (8.1%); business and financial operations occupations (5.5%); education, training, and library occupations (4.3%)
Roads and streets: Campbell Rd; Hollister St (Hollister Rd); Blalock Rd; Emnora Ln; Long Point Rd; Hammerly Blvd; Peppermill Rd; Pitner Rd; Bingle Rd; Ojeman Rd; Kempwood Dr; Colleen Rd; Spring Branch Dr; Lazy Spring Dr; Blankenship Dr; Friendship Rd; Mc Kean Dr; Theysen Dr; Laverne St; Carousel Ln; Tilson Ln; Alcott Dr; Bauer Dr; Adkins Rd; Autauga St; Mona Lee Ln; Kerrwood Ln; Morningview Dr; Hoskins Dr; Westview Dr; Knoll St; Railton St; Rockhurst Dr; Livernois Rd; Willowview Ln; Derrik Dr; Vogue Ln; Opelika St; Elizabeth Rd; Benbow Way; Sowden Rd; Larston St; Pecos St; Longacre Dr; Creek Dr; Olathe St; Bracher St; Anne St; Mc Dade St; Greiner Dr; Springview Ln; Rosstown Way; Waterville Rd; Rangely Dr; Galway Ln; Springwood Dr; Eldora Dr; Norton Dr; Allegro St N; Cranway Dr; Greensward Rd; Sonneville Dr; Fredonia Dr; Ruland Rd; Aruba Dr; Valleyfield Dr; Crownover Rd; Allegro St S; Bronco Dr; Candace St; Padfield St; Springmeadows St; Fairbend St; Turriff St; Colleen Meadows Cir; Montridge Dr; Cameo Dr; Colleen Woods Cir; Billings Dr; Durango Dr; Saddle Ln; Western Dr; Poco Rd; Leto Rd; Highcrest Dr; Cathey Ln; Kimwood Dr; Varner Rd; Shelmer Dr; Banzer St; Willow Springs Ln; Waseca St; Foley; Philco Dr; Tollis St; Pado St; Barr St; Springmont Dr; Springmeadow; Coleen Cir (Coleenwood Cir); Big Bend Dr; Birchton St; Rossette Dr; Clanton St; Manire Dr; Spur Ln; Barr Cir; Namora Ln; Renwood Dr; Tanbark Dr; Millspring Dr; Allegro St E; Anne; Theysen Cir; Railton Ct; Namora Ct.
Other features: Spring Branch Crk.
Other features: Brickhouse Gully; Briar Br; Brickhouse Gully Strm.
Spring Branch Central neighborhood detailed profile
Spring Branch East neighborhood in Houston statistics: (Find on map)
Area: 6.008 square miles
Population: 23,488
Population density:
Median household income in 2021:
Median rent in in 2021:
Male vs Females
Median age
Housing prices:
Average estimated value of detached houses in 2021 (57.9% of all units):
Average estimated value of townhouses or other attached units in 2021 (3.1% of all units):
Average estimated '21 value of housing units in 5-or-more-unit structures (20.0% of all units):
Most popular occupations of males: management occupations (except farmers) (18.4%); construction, extraction, and maintenance occupations (13.6%); service occupations (13.2%); sales and office occupations (13.2%); business and financial operations occupations (8.8%); legal occupations (4.9%); architecture and engineering occupations (4.6%)
Most popular occupations of females: sales and office occupations (35.8%); service occupations (17.0%); management occupations (except farmers) (16.0%); business and financial operations occupations (10.5%); healthcare practitioners and technical occupations (5.7%); education, training, and library occupations (5.2%); legal occupations (2.6%)
Limited-access highways (interstate or state) in this neighborhood: Katy Fwy (I- 10, US Hwy 90); I- 610 (W Loop Fwy).
Highways in this neighborhood: US Hwy 290; 290-Hov Fwy (US Hwy 290).
Roads and streets: Westview Dr; Antoine Dr; Long Point Rd; Hempstead Rd; Hammerly Blvd; Wirt Rd; Silber Rd; Afton St; Pech Rd; Woodvine Dr; Spenwick Dr; Shadyvilla Ln; Schiller St; Jacquelyn Dr; Amelia Rd; N Post Oak Rd (Post Oak Rd); Kempwood Dr; W 34th St; Blankenship Dr; Todd St; Huge Oaks St; Johanna Dr; Hempstead Hwy (Hempstead Rd); Mitchelldale St; Lynnview Dr; Ridgemore Dr; Cedel Dr; Ridgecrest Dr; Karbach St; Harland Dr; Thonig Rd; Montridge Dr; Janak Dr; Gardendale Dr; Jalna St; Story St; Moritz Dr; Mc Allister Rd; Westwood Dr; Housman St; Hillendahl Blvd; Hartland St; Longridge Dr; Northampton Way; Shavelson St; Monarch Oaks St; Marnel Rd; Pine Chase Dr; Counter Point Dr; Centralcrest St; Turquoise Ln; Flowerdale St; Raton St; Wirtcrest Ln; Danbury Rd; Central Pkwy; Ridgeview Dr; Highcrest Dr; Dacoma St; Bayram Dr; Hurfus Dr; Alderney Dr; Rolla St; Saxet St; Caywood Ln; Bobbitt Ln; Fairway Park Dr; Glourie Dr; Blandford Ln; Dearborn St; Western Dr; Vogue Ln; W 12th St; Teluco St; Ronson Rd; Westcrest Dr; Norcrest Dr; Zora St; Old Katy Rd; Clarkson Ln; Ramus St; Awty School Ln; Restridge Dr; Whispering Pines Dr; Glenmore Forest St; Aldrich St; Afton Woods Dr; Waterbury Dr; French Village Dr (French Village Cir); Wharton St; Ravenwood Cir; Shoshone Rd; Clawson St; Corbin St; Pasket Ln; Sivley St; Reverse St; Ridgepoint Dr; Coulcrest Dr; Glosridge Dr; Remlap St; Maybank Dr; Delery Dr; Coldstream Rd; Bellewood Dr; Kilburn Rd; Gingerleaf Ln; Tulsa Rd; Turnbury Oak; Deauville Plaza Dr; Ridgewood Pl; Tickner St; Lawler Ridge; Gary St; Janet St; Ora St; Panatella Dr; Muirfield Pl; Haldane Dr; Hafner Dr; Harwood Dr; Bolin Rd; Baggett Ln; Early Ln; Wedgewood Ln; Auline Ln; Silver Bonnet; Lumberdale Rd; April Ln; Purswell Rd; Milwee St; Woodridge Pl; Inch Rd; Deborah; Campton Ct; Earl St; 12th St; Wellington Ct N; Wellington Ct S; W 20th St; Turnbury Oak Ln; Moritz Ct; French Village Ct (French Village Dr); Cyr; Gray Moss Ln; Forum Dr; 18th St; N Hunters Court Dr; N Hilshire Park Dr; Wingo; Hunters Park Way; Wellington Way; Wentworth Ct; S Hunters Court Dr; W Hilshire Park Dr; Drury Ln; Housman; Shortpoint St; Woodvine Place Ct; Wellington Ct; E Hunters Court Dr; Brykerwoods Dr; E Hilshire Park Dr; Wyatt St.
Railroad features: Southern Pacific RR.
Other features: Newman Br.
Other features: Brickhouse Gully.
Spring Branch East neighborhood detailed profile
Area: 6.008 square miles
Population: 23,488
Population density:
| Spring Branch East: | 3,910 people per square mile |
| Houston: | 3,947 people per square mile |
Median household income in 2021:
| Spring Branch East: | $101,845 |
| Houston: | $55,499 |
Median rent in in 2021:
| Spring Branch East: | $1,064 |
| Houston: | $974 |
Male vs Females
| Males: | 10,617 |
| Females: | 12,871 |
Median age
| Males: | 37.7 years |
| Females: | 40.4 years |
Housing prices:
Average estimated value of detached houses in 2021 (57.9% of all units):
| Spring Branch East: | $317,553 |
| Houston: | $304,685 |
Average estimated value of townhouses or other attached units in 2021 (3.1% of all units):
| This neighborhood: | $100,345 |
| city: | $305,463 |
Average estimated '21 value of housing units in 5-or-more-unit structures (20.0% of all units):
| Spring Branch East: | $81,563 |
| Houston: | $227,414 |
Most popular occupations of males: management occupations (except farmers) (18.4%); construction, extraction, and maintenance occupations (13.6%); service occupations (13.2%); sales and office occupations (13.2%); business and financial operations occupations (8.8%); legal occupations (4.9%); architecture and engineering occupations (4.6%)
Most popular occupations of females: sales and office occupations (35.8%); service occupations (17.0%); management occupations (except farmers) (16.0%); business and financial operations occupations (10.5%); healthcare practitioners and technical occupations (5.7%); education, training, and library occupations (5.2%); legal occupations (2.6%)
Limited-access highways (interstate or state) in this neighborhood: Katy Fwy (I- 10, US Hwy 90); I- 610 (W Loop Fwy).
Highways in this neighborhood: US Hwy 290; 290-Hov Fwy (US Hwy 290).
Roads and streets: Westview Dr; Antoine Dr; Long Point Rd; Hempstead Rd; Hammerly Blvd; Wirt Rd; Silber Rd; Afton St; Pech Rd; Woodvine Dr; Spenwick Dr; Shadyvilla Ln; Schiller St; Jacquelyn Dr; Amelia Rd; N Post Oak Rd (Post Oak Rd); Kempwood Dr; W 34th St; Blankenship Dr; Todd St; Huge Oaks St; Johanna Dr; Hempstead Hwy (Hempstead Rd); Mitchelldale St; Lynnview Dr; Ridgemore Dr; Cedel Dr; Ridgecrest Dr; Karbach St; Harland Dr; Thonig Rd; Montridge Dr; Janak Dr; Gardendale Dr; Jalna St; Story St; Moritz Dr; Mc Allister Rd; Westwood Dr; Housman St; Hillendahl Blvd; Hartland St; Longridge Dr; Northampton Way; Shavelson St; Monarch Oaks St; Marnel Rd; Pine Chase Dr; Counter Point Dr; Centralcrest St; Turquoise Ln; Flowerdale St; Raton St; Wirtcrest Ln; Danbury Rd; Central Pkwy; Ridgeview Dr; Highcrest Dr; Dacoma St; Bayram Dr; Hurfus Dr; Alderney Dr; Rolla St; Saxet St; Caywood Ln; Bobbitt Ln; Fairway Park Dr; Glourie Dr; Blandford Ln; Dearborn St; Western Dr; Vogue Ln; W 12th St; Teluco St; Ronson Rd; Westcrest Dr; Norcrest Dr; Zora St; Old Katy Rd; Clarkson Ln; Ramus St; Awty School Ln; Restridge Dr; Whispering Pines Dr; Glenmore Forest St; Aldrich St; Afton Woods Dr; Waterbury Dr; French Village Dr (French Village Cir); Wharton St; Ravenwood Cir; Shoshone Rd; Clawson St; Corbin St; Pasket Ln; Sivley St; Reverse St; Ridgepoint Dr; Coulcrest Dr; Glosridge Dr; Remlap St; Maybank Dr; Delery Dr; Coldstream Rd; Bellewood Dr; Kilburn Rd; Gingerleaf Ln; Tulsa Rd; Turnbury Oak; Deauville Plaza Dr; Ridgewood Pl; Tickner St; Lawler Ridge; Gary St; Janet St; Ora St; Panatella Dr; Muirfield Pl; Haldane Dr; Hafner Dr; Harwood Dr; Bolin Rd; Baggett Ln; Early Ln; Wedgewood Ln; Auline Ln; Silver Bonnet; Lumberdale Rd; April Ln; Purswell Rd; Milwee St; Woodridge Pl; Inch Rd; Deborah; Campton Ct; Earl St; 12th St; Wellington Ct N; Wellington Ct S; W 20th St; Turnbury Oak Ln; Moritz Ct; French Village Ct (French Village Dr); Cyr; Gray Moss Ln; Forum Dr; 18th St; N Hunters Court Dr; N Hilshire Park Dr; Wingo; Hunters Park Way; Wellington Way; Wentworth Ct; S Hunters Court Dr; W Hilshire Park Dr; Drury Ln; Housman; Shortpoint St; Woodvine Place Ct; Wellington Ct; E Hunters Court Dr; Brykerwoods Dr; E Hilshire Park Dr; Wyatt St.
Railroad features: Southern Pacific RR.
Other features: Newman Br.
Other features: Brickhouse Gully.
Spring Branch East neighborhood detailed profile
Spring Branch West neighborhood in Houston statistics: (Find on map)
Area: 7.445 square miles
Population: 18,245
Population density:
Median household income in 2021:
Median rent in in 2021:
Male vs Females
Median age
Housing prices:
Average estimated value of detached houses in 2021 (40.9% of all units):
Average estimated value of townhouses or other attached units in 2021 (16.6% of all units):
Average estimated '21 value of housing units in 3-to-4-unit structures (10.2% of all units):
Average estimated '21 value of housing units in 5-or-more-unit structures (13.2% of all units):
Most popular occupations of males: sales and office occupations (20.7%); construction, extraction, and maintenance occupations (16.2%); service occupations (9.0%); material moving occupations (8.9%); production occupations (8.8%); business and financial operations occupations (7.4%); management occupations (except farmers) (7.3%)
Most popular occupations of females: service occupations (28.5%); sales and office occupations (20.9%); management occupations (except farmers) (9.8%); transportation occupations (7.1%); business and financial operations occupations (6.0%); production occupations (6.0%); construction, extraction, and maintenance occupations (5.7%)
Limited-access highways (interstate or state) in this neighborhood: Katy Fwy (I- 10, US Hwy 90).
Highways in this neighborhood: State Loop 8 (Sam Houston Pkwy, Beltway 8).
Roads and streets: Old Katy Rd; Shadowdale Dr; Brittmoore Rd; Westview Dr; Shadow Wood Dr; Hazelhurst Dr; Gessner Dr (Gessner Rd); Long Point Rd; Sherwood Forest St; Wycliffe Dr; Knoboak Dr; Witte Rd; Conrad Sauer Dr; Upland Dr; Warwana Rd; Cedardale Dr; Blalock Rd; Metronome Dr; Haddington Dr; Mayfield Rd; Ivyridge Rd; Larston St; Timberoak Dr; Chatterton Dr; Tiger Trl; Bunker Hill Rd; Oak Tree Dr; Pine Lake Dr; Maux Dr; Moorberry Ln; Brinwood Dr; Cedar Post Ln; Stebbins Dr; Eddystone Dr; Shadow Bend Dr; Rollingwood Dr; Lumpkin Rd; Timberline Rd; Wisterwood Dr; Oakstream Dr; Hammerly Blvd; Neuens Rd; Briarwild Ln; Crestdale Dr; Confederate Rd; Spillers Ln; Hanka Dr; Whiteside Ln; Raritan Dr; Shadow Ln; Springrock Ln; Oak Point Dr; Shadow Oaks Dr; Nocturne Ln; Scenic Ridge Dr; Imperial Crown Dr; Londonderry Dr; Barwood Dr; Claymoore Park Dr; Moss Ridge Rd; Mountain Rose Ln; Mapleton Dr; Clarborough Pl; Timberwood Dr; Long Branch Ln; Shadeland Dr; Stebbins Cir; Springwood Forest Dr; Butlercrest St; Townhurst Dr; Adkins Rd; Peer Dr; Tappenbeck Dr; Mallard Dr; Lazy Oaks St; Dalecrest Dr; Kempwood Dr; S Fairhollow Ln; Yupondale Dr (Yupondale St); Hollow Hook Rd; Kerrwood Ln; N Fairhollow Ln; Bear Creek Meadows Ln; Alcott Dr; Day Rd; Ridgeview Dr; Western Village Ln; Church Ln; Fullerton Dr; Ottawa Ln; S Youngwood Ln; N Youngwood Ln; Moss Branch Rd; Echo Grove Ln; Pine Village Dr; Bullock Ln; Murrayhill Dr; Parana Dr; Northbrook Dr; Kersten Dr; Wood Hollow Ln; Ganyard Dr; Teague Rd; Georgibelle Dr; Southwick St; Maple Springs Dr; Windhover Ln; Longhorn Dr; Chaparral Dr; Centennial Dr; Buescher Dr; Braymore Dr; Oak Spring Dr; Manila Ln; E Tri Oaks Ln; Prism Ln; Murray Bay St; Maribelle Way; Demaret Ln; Mountain Ridge Rd; Panola Way; Moss Tree Rd; Cold Spring Dr; Moorhead Dr; Triway Ln; Springwell Dr; Mathewson Ln; Ash Creek Dr; Kemp Hollow Ln; Pecan Creek Dr; Valley Stream Dr; Valley Spring Dr; Debbie Ln; Mesa Ridge Rd; Cluster Dr; du Lock Ln; Wickerbay St; Brooktree Dr; Britt Way; W Belt Pr One Dr; Shadow Bend; Claret Ln; Bookman Park Dr; Target Dr; Butlercrest; Cedar Post St; N Wickerwood St; S Wickerwood St; Mardi Ln; Buckmann Ct; Skyview Dr; N Wilcrest Dr; Beekman Place Dr; Target Ct; Laurenhurst Ct; Tiara Ln; Imperial Crown Ct; Fire Creek Dr; Echo Ln; Vaja Dr; Sherwood Forest; Bordeau Blvd; Southwick Dr; Barwood Ct.
Other features: Briar Br; Rummel Crk.
Spring Branch West neighborhood detailed profile
Area: 7.445 square miles
Population: 18,245
Population density:
| Spring Branch West: | 2,451 people per square mile |
| Houston: | 3,947 people per square mile |
Median household income in 2021:
| Spring Branch West: | $116,574 |
| Houston: | $55,499 |
Median rent in in 2021:
| Spring Branch West: | $1,061 |
| Houston: | $974 |
Male vs Females
| Males: | 8,954 |
| Females: | 9,290 |
Median age
| Males: | 36.1 years |
| Females: | 37.9 years |
Housing prices:
Average estimated value of detached houses in 2021 (40.9% of all units):
| Spring Branch West: | $379,462 |
| Houston: | $304,685 |
Average estimated value of townhouses or other attached units in 2021 (16.6% of all units):
| This neighborhood: | $77,939 |
| city: | $305,463 |
Average estimated '21 value of housing units in 3-to-4-unit structures (10.2% of all units):
| Spring Branch West: | $80,833 |
| city: | $184,874 |
Average estimated '21 value of housing units in 5-or-more-unit structures (13.2% of all units):
| Spring Branch West: | $40,986 |
| Houston: | $227,414 |
Most popular occupations of males: sales and office occupations (20.7%); construction, extraction, and maintenance occupations (16.2%); service occupations (9.0%); material moving occupations (8.9%); production occupations (8.8%); business and financial operations occupations (7.4%); management occupations (except farmers) (7.3%)
Most popular occupations of females: service occupations (28.5%); sales and office occupations (20.9%); management occupations (except farmers) (9.8%); transportation occupations (7.1%); business and financial operations occupations (6.0%); production occupations (6.0%); construction, extraction, and maintenance occupations (5.7%)
Limited-access highways (interstate or state) in this neighborhood: Katy Fwy (I- 10, US Hwy 90).
Highways in this neighborhood: State Loop 8 (Sam Houston Pkwy, Beltway 8).
Roads and streets: Old Katy Rd; Shadowdale Dr; Brittmoore Rd; Westview Dr; Shadow Wood Dr; Hazelhurst Dr; Gessner Dr (Gessner Rd); Long Point Rd; Sherwood Forest St; Wycliffe Dr; Knoboak Dr; Witte Rd; Conrad Sauer Dr; Upland Dr; Warwana Rd; Cedardale Dr; Blalock Rd; Metronome Dr; Haddington Dr; Mayfield Rd; Ivyridge Rd; Larston St; Timberoak Dr; Chatterton Dr; Tiger Trl; Bunker Hill Rd; Oak Tree Dr; Pine Lake Dr; Maux Dr; Moorberry Ln; Brinwood Dr; Cedar Post Ln; Stebbins Dr; Eddystone Dr; Shadow Bend Dr; Rollingwood Dr; Lumpkin Rd; Timberline Rd; Wisterwood Dr; Oakstream Dr; Hammerly Blvd; Neuens Rd; Briarwild Ln; Crestdale Dr; Confederate Rd; Spillers Ln; Hanka Dr; Whiteside Ln; Raritan Dr; Shadow Ln; Springrock Ln; Oak Point Dr; Shadow Oaks Dr; Nocturne Ln; Scenic Ridge Dr; Imperial Crown Dr; Londonderry Dr; Barwood Dr; Claymoore Park Dr; Moss Ridge Rd; Mountain Rose Ln; Mapleton Dr; Clarborough Pl; Timberwood Dr; Long Branch Ln; Shadeland Dr; Stebbins Cir; Springwood Forest Dr; Butlercrest St; Townhurst Dr; Adkins Rd; Peer Dr; Tappenbeck Dr; Mallard Dr; Lazy Oaks St; Dalecrest Dr; Kempwood Dr; S Fairhollow Ln; Yupondale Dr (Yupondale St); Hollow Hook Rd; Kerrwood Ln; N Fairhollow Ln; Bear Creek Meadows Ln; Alcott Dr; Day Rd; Ridgeview Dr; Western Village Ln; Church Ln; Fullerton Dr; Ottawa Ln; S Youngwood Ln; N Youngwood Ln; Moss Branch Rd; Echo Grove Ln; Pine Village Dr; Bullock Ln; Murrayhill Dr; Parana Dr; Northbrook Dr; Kersten Dr; Wood Hollow Ln; Ganyard Dr; Teague Rd; Georgibelle Dr; Southwick St; Maple Springs Dr; Windhover Ln; Longhorn Dr; Chaparral Dr; Centennial Dr; Buescher Dr; Braymore Dr; Oak Spring Dr; Manila Ln; E Tri Oaks Ln; Prism Ln; Murray Bay St; Maribelle Way; Demaret Ln; Mountain Ridge Rd; Panola Way; Moss Tree Rd; Cold Spring Dr; Moorhead Dr; Triway Ln; Springwell Dr; Mathewson Ln; Ash Creek Dr; Kemp Hollow Ln; Pecan Creek Dr; Valley Stream Dr; Valley Spring Dr; Debbie Ln; Mesa Ridge Rd; Cluster Dr; du Lock Ln; Wickerbay St; Brooktree Dr; Britt Way; W Belt Pr One Dr; Shadow Bend; Claret Ln; Bookman Park Dr; Target Dr; Butlercrest; Cedar Post St; N Wickerwood St; S Wickerwood St; Mardi Ln; Buckmann Ct; Skyview Dr; N Wilcrest Dr; Beekman Place Dr; Target Ct; Laurenhurst Ct; Tiara Ln; Imperial Crown Ct; Fire Creek Dr; Echo Ln; Vaja Dr; Sherwood Forest; Bordeau Blvd; Southwick Dr; Barwood Ct.
Other features: Briar Br; Rummel Crk.
Spring Branch West neighborhood detailed profile
Spring Shadows neighborhood in Houston statistics: (Find on map)
Area: 3.423 square miles
Population: 7,997
Population density:
Median household income in 2021:
Median rent in in 2021:
Male vs Females
Median age
Housing prices:
Average estimated value of detached houses in 2021 (64.3% of all units):
Average estimated value of townhouses or other attached units in 2021 (16.3% of all units):
Average estimated '21 value of housing units in 3-to-4-unit structures (6.2% of all units):
Average estimated '21 value of housing units in 5-or-more-unit structures (6.2% of all units):
Most popular occupations of males: construction, extraction, and maintenance occupations (21.6%); business and financial operations occupations (13.7%); sales and office occupations (13.0%); management occupations (except farmers) (10.7%); education, training, and library occupations (8.3%); life, physical, and social science occupations (6.4%); transportation occupations (5.0%)
Most popular occupations of females: management occupations (except farmers) (34.4%); sales and office occupations (20.7%); healthcare practitioners and technical occupations (14.3%); business and financial operations occupations (8.9%); community and social services occupations (5.8%); architecture and engineering occupations (4.6%); service occupations (3.8%)
Highways in this neighborhood: Beltway 8 (State Loop 8, Sam Houston Pkwy).
Roads and streets: Hammerly Blvd; Emnora Ln; Kempwood Dr; Kemp Forest Dr; Rosefield Dr; Shadowdale Dr; Gessner Rd (Gessner Dr); Westray; Vogue Ln; Neuens Rd; Teague Rd; Triway Ln; Norton Dr; Alcott Dr; Manila Ln; Crestdale Dr; Moorberry Ln; Durban Dr; Stetson Ln; Fontana Dr; Eaglerock Dr; Spring Valley Rd; Quincannon Ln; Kismet Ln; Elmview Dr; Campbell Rd; Lexford Ln; Kenross St; Elmgate Dr; Rothbury St; Bernadette Ln; Springrock Ln; Helmsdale St; Palo Pinto Dr; Riata Ln; Kevin Ln; Weatherwood Dr; Truscon Dr; Parana Dr; Moss Hill Dr; Pomeran Dr; Raider Cir N; Springview Ln; Raider Cir S; Railton St; Bundy Ln; Carousel Ln; Vilven Ln; Kerrwood Ln; Stillwood Dr; Talina Way; Philmont Dr; Bandelier Dr; Southwick St; Anniston Dr; Colleen Rd; Hollow Hook Rd; Pine Village Dr; Springmont Dr; Lawngate Dr; Clanton St; Greyburn Ln; Knoboak Dr; Canoga Ln; Derrik Dr; Sedgie Dr; Lively Ln; Raider Cir E; Hornpipe Ln; Ottawa Ln; Rockhurst Dr; Agar Ln; Blankenship Dr; Brigade; Clarblak Ln; Fitze Ln; Kenross; Foxrun Ct; Knoboak Cir; Parana Ct; Lanell Ln; Crestdale Cir.
Spring Shadows neighborhood detailed profile
Area: 3.423 square miles
Population: 7,997
Population density:
| Spring Shadows: | 2,336 people per square mile |
| Houston: | 3,947 people per square mile |
Median household income in 2021:
| Spring Shadows: | $52,518 |
| Houston: | $55,499 |
Median rent in in 2021:
| Spring Shadows: | $1,323 |
| Houston: | $974 |
Male vs Females
| Males: | 3,598 |
| Females: | 4,399 |
Median age
| Males: | 35.6 years |
| Females: | 38.3 years |
Housing prices:
Average estimated value of detached houses in 2021 (64.3% of all units):
| Spring Shadows: | $326,909 |
| Houston: | $304,685 |
Average estimated value of townhouses or other attached units in 2021 (16.3% of all units):
| This neighborhood: | $77,792 |
| city: | $305,463 |
Average estimated '21 value of housing units in 3-to-4-unit structures (6.2% of all units):
| Spring Shadows: | $80,833 |
| city: | $184,874 |
Average estimated '21 value of housing units in 5-or-more-unit structures (6.2% of all units):
| Spring Shadows: | $101,875 |
| Houston: | $227,414 |
Most popular occupations of males: construction, extraction, and maintenance occupations (21.6%); business and financial operations occupations (13.7%); sales and office occupations (13.0%); management occupations (except farmers) (10.7%); education, training, and library occupations (8.3%); life, physical, and social science occupations (6.4%); transportation occupations (5.0%)
Most popular occupations of females: management occupations (except farmers) (34.4%); sales and office occupations (20.7%); healthcare practitioners and technical occupations (14.3%); business and financial operations occupations (8.9%); community and social services occupations (5.8%); architecture and engineering occupations (4.6%); service occupations (3.8%)
Highways in this neighborhood: Beltway 8 (State Loop 8, Sam Houston Pkwy).
Roads and streets: Hammerly Blvd; Emnora Ln; Kempwood Dr; Kemp Forest Dr; Rosefield Dr; Shadowdale Dr; Gessner Rd (Gessner Dr); Westray; Vogue Ln; Neuens Rd; Teague Rd; Triway Ln; Norton Dr; Alcott Dr; Manila Ln; Crestdale Dr; Moorberry Ln; Durban Dr; Stetson Ln; Fontana Dr; Eaglerock Dr; Spring Valley Rd; Quincannon Ln; Kismet Ln; Elmview Dr; Campbell Rd; Lexford Ln; Kenross St; Elmgate Dr; Rothbury St; Bernadette Ln; Springrock Ln; Helmsdale St; Palo Pinto Dr; Riata Ln; Kevin Ln; Weatherwood Dr; Truscon Dr; Parana Dr; Moss Hill Dr; Pomeran Dr; Raider Cir N; Springview Ln; Raider Cir S; Railton St; Bundy Ln; Carousel Ln; Vilven Ln; Kerrwood Ln; Stillwood Dr; Talina Way; Philmont Dr; Bandelier Dr; Southwick St; Anniston Dr; Colleen Rd; Hollow Hook Rd; Pine Village Dr; Springmont Dr; Lawngate Dr; Clanton St; Greyburn Ln; Knoboak Dr; Canoga Ln; Derrik Dr; Sedgie Dr; Lively Ln; Raider Cir E; Hornpipe Ln; Ottawa Ln; Rockhurst Dr; Agar Ln; Blankenship Dr; Brigade; Clarblak Ln; Fitze Ln; Kenross; Foxrun Ct; Knoboak Cir; Parana Ct; Lanell Ln; Crestdale Cir.
Spring Shadows neighborhood detailed profile
Sterling Ridge neighborhood in Houston statistics: (Find on map)
Area: 6.964 square miles
Population: 15,614
Population density:
Median household income in 2021:
Median rent in in 2021:
Male vs Females
Median age
Average estimated value of detached houses in 2021 (98.5% of all units):
Most popular occupations of males: management occupations (except farmers) (36.4%); sales and office occupations (20.3%); business and financial operations occupations (12.0%); education, training, and library occupations (5.4%); healthcare practitioners and technical occupations (5.0%); service occupations (4.7%); architecture and engineering occupations (3.2%)
Most popular occupations of females: sales and office occupations (23.7%); education, training, and library occupations (20.2%); business and financial operations occupations (14.1%); management occupations (except farmers) (11.2%); service occupations (10.9%); healthcare practitioners and technical occupations (10.2%); arts, design, entertainment, sports, and media occupations (7.4%)
Roads and streets: Woodlands Pkwy; Grand Regency Cir; Sterling Ridge Dr; Branch Crossing Dr; Kuykendahl Rd; Red Bay Cir; Flintridge Dr; W Grand Regency Cir; Sweet Bay Cir; Ken Lake Dr (Kenlake Dr); W Branch Crossing Dr; Lake Woodlands Dr; Cranebrook Dr; Player Bend Dr; Bartlett Bend Dr; E Bracebridge Cir; Burr Oak Trce; Shag Bark Dr; Stoneyhurst Dr; E Beckonvale Cir; Electra Cir; S Bantam Woods Cir; N Pentenwell Cir; N Queenscliff Cir; Netherfield Way; Carlton Woods Dr; Philbrook Way; Douvaine Ct; Degas Park Dr; W Bracebridge Cir; E Mirror Ridge Cir; Hildene Way; Legato Way; S Knightsgate Cir; N Lansdowne Cir; W Old Sterling Cir; Ledgestone Pl; N Hazelcrest Cir; S Forestgate Dr; Dove Trace Cir; Kingscote Way; W Shale Creek Cir; Old Sterling Cir; Villeroy Way; W Mirror Ridge Cir; S Longsford Cir; S Garnet Bend; N Forestgate Dr; Bracebridge Dr; N Garnet Bend; Lenox Hill Dr; N Dulcet Hollow Cir; S Warbler Bend Cir; Norlund Way; S Dulcet Hollow Cir; S Chantsong Cir; N Longsford Cir; N Bantam Woods Cir; Longbourne Dr; W Lansdowne Cir; Dapple Gray St; S Provence Cir; Golden Scroll Cir; Damask Rose Way; W Beckonvale Cir; Goldwood Pl; Mirror Ridge Dr; Grand Colonial Dr; Shawnee Ridge Dr; Strawberry Canyon Pl; Black Cherry; Glensheen Way; E Lansdowne Cir; N Chantsong Cir; Columbia Crest Pl; Maymont Way; Player Green Pl; E Shale Creek Cir; Midday Sun Pl; S Shawnee Ridge Cir; S Queenscliff Cir; E Artist Grove Cir; Silver Maple Pl; N Altwood Cir; Hunnewell Way; Galway Pl; Hazelcrest Dr; Blue Creek Pl; S Altwood Cir; W Artist Grove Pl; Cezanne Woods Dr; Hepplewhite Way; N Shawnee Ridge Cir; Fledgling Path St; Dresden Pl; Harmony Links Pl; Amulet Oaks Pl; Monet Bend Pl; Pinnacle Point Dr; E Thymewood Pl; Pascale Creek Pl; Villa Canyon Pl; Silver Iris Way; Mission Bend Pl; Cezanne Woods Pl; Baronial Cir; Glowing Star Pl; Desert Rose Pl; Barley Hall St; Winslow Way; W Bonny Branch St; E Bonny Branch St; Eloquence Way; Carlyle Pl; Blue Jack Ln; N Spring Trellis Cir; Filigree Pines Pl; Angelique Way; Short Leaf; Heather Bank Pl; English Heather Pl; S Dove Trace Cir; E Majestic Woods Pl; Electra Dr; W Majestic Woods Pl; E Cartouche Cir; N Knightsgate Cir; Stanwick Pl; Snow Pond Pl; Scenic Brook Pl; N Warbler Bend Cir; N Provence Cir; W Thymewood Pl; Brywood Pl; Lanesend Pl; Julian Woods Pl; Sutton Mill Pl; Frontenac Way; Charmaine Way; Largo Woods Pl; Heron Hollow Ct; Valcourt Pl; E Legacy Point Cir; Meadow Rose Pl; Angel Dove Pl; Jewelsford Dr; Chamomile Ct; S Spring Trellis Cir; Peony Springs Ct; Eagle Rise Pl; W Legacy Point Cir; Bunnelle Way; Clary Sage Ct; Maypole Ln; Middle Gate Pl; Spruce Canyon Pl; W Cartouche Cir; Picasso Path Pl; Hansom Trail St; Pine Lodge Pl; Renoir Trail Pl; Highland Breeze Ln; Millwright Pl; Cascade Creek Dr; Gateshead Pl; Lenox Hill Pl; Fleury Way; Skipwith Pl; Oakley Downs Pl; Shawnee Ridge Ct; Culverdale Pl; Bantam Woods Dr; Hope Valley Pl; Cotillion Ct; Sedgewick Pl; Split Rail Pl; Gallery Grove Dr; Marymont Way; Journal Leaf Pl; Farington Way; Graylin Woods Pl; Birchwood Park Pl; Cantwell Way; S Pentenwell Cir; Sapling Pl; Fairlight Ct; Elfen Way; Amulet Oaks Ct; Pemberly Dr; W Beckonvale Ct; Cluny Ct; S Pentewell Cir; Larkspur Trl; S Spring Brook Ct; Stone Arrow Pl; Southern Garden Pl; Balmoral Pl; N Spring Brook Ct; New Light Pl; Blue Creek Ct; Beckonvale Ct; Peach Ridge Pl; Margaux Way; Cartouche Dr; Dulcet Hollow Ct; E Shale Creek Ct; Camino Ct; Lenox Hill Ct; Mustang Point Ct; Dahlia Trail Pl; Gentle Haze Ct; Pagehurst Ct; White Wing Ct; Vincent Ct; Mirror Ridge Ct; Scenic Brook Ct; Cambria Pines Ct; Sentinel Point Ct; Garnet Bend Ct; Hunnewell Ct.
Other features: Bear Br.
Sterling Ridge neighborhood detailed profile
Area: 6.964 square miles
Population: 15,614
Population density:
| Sterling Ridge (Village of Sterling Ridge): | 2,242 people per square mile |
| Houston: | 3,947 people per square mile |
Median household income in 2021:
| Sterling Ridge (Village of Sterling Ridge): | $170,263 |
| Houston: | $55,499 |
Median rent in in 2021:
| Sterling Ridge (Village of Sterling Ridge): | $2,679 |
| Houston: | $974 |
Male vs Females
| Males: | 7,897 |
| Females: | 7,717 |
Median age
| Males: | 43.7 years |
| Females: | 46.3 years |
Average estimated value of detached houses in 2021 (98.5% of all units):
| Sterling Ridge (Village of Sterling Ridge): | $368,673 |
| Houston: | $304,685 |
Most popular occupations of males: management occupations (except farmers) (36.4%); sales and office occupations (20.3%); business and financial operations occupations (12.0%); education, training, and library occupations (5.4%); healthcare practitioners and technical occupations (5.0%); service occupations (4.7%); architecture and engineering occupations (3.2%)
Most popular occupations of females: sales and office occupations (23.7%); education, training, and library occupations (20.2%); business and financial operations occupations (14.1%); management occupations (except farmers) (11.2%); service occupations (10.9%); healthcare practitioners and technical occupations (10.2%); arts, design, entertainment, sports, and media occupations (7.4%)
Roads and streets: Woodlands Pkwy; Grand Regency Cir; Sterling Ridge Dr; Branch Crossing Dr; Kuykendahl Rd; Red Bay Cir; Flintridge Dr; W Grand Regency Cir; Sweet Bay Cir; Ken Lake Dr (Kenlake Dr); W Branch Crossing Dr; Lake Woodlands Dr; Cranebrook Dr; Player Bend Dr; Bartlett Bend Dr; E Bracebridge Cir; Burr Oak Trce; Shag Bark Dr; Stoneyhurst Dr; E Beckonvale Cir; Electra Cir; S Bantam Woods Cir; N Pentenwell Cir; N Queenscliff Cir; Netherfield Way; Carlton Woods Dr; Philbrook Way; Douvaine Ct; Degas Park Dr; W Bracebridge Cir; E Mirror Ridge Cir; Hildene Way; Legato Way; S Knightsgate Cir; N Lansdowne Cir; W Old Sterling Cir; Ledgestone Pl; N Hazelcrest Cir; S Forestgate Dr; Dove Trace Cir; Kingscote Way; W Shale Creek Cir; Old Sterling Cir; Villeroy Way; W Mirror Ridge Cir; S Longsford Cir; S Garnet Bend; N Forestgate Dr; Bracebridge Dr; N Garnet Bend; Lenox Hill Dr; N Dulcet Hollow Cir; S Warbler Bend Cir; Norlund Way; S Dulcet Hollow Cir; S Chantsong Cir; N Longsford Cir; N Bantam Woods Cir; Longbourne Dr; W Lansdowne Cir; Dapple Gray St; S Provence Cir; Golden Scroll Cir; Damask Rose Way; W Beckonvale Cir; Goldwood Pl; Mirror Ridge Dr; Grand Colonial Dr; Shawnee Ridge Dr; Strawberry Canyon Pl; Black Cherry; Glensheen Way; E Lansdowne Cir; N Chantsong Cir; Columbia Crest Pl; Maymont Way; Player Green Pl; E Shale Creek Cir; Midday Sun Pl; S Shawnee Ridge Cir; S Queenscliff Cir; E Artist Grove Cir; Silver Maple Pl; N Altwood Cir; Hunnewell Way; Galway Pl; Hazelcrest Dr; Blue Creek Pl; S Altwood Cir; W Artist Grove Pl; Cezanne Woods Dr; Hepplewhite Way; N Shawnee Ridge Cir; Fledgling Path St; Dresden Pl; Harmony Links Pl; Amulet Oaks Pl; Monet Bend Pl; Pinnacle Point Dr; E Thymewood Pl; Pascale Creek Pl; Villa Canyon Pl; Silver Iris Way; Mission Bend Pl; Cezanne Woods Pl; Baronial Cir; Glowing Star Pl; Desert Rose Pl; Barley Hall St; Winslow Way; W Bonny Branch St; E Bonny Branch St; Eloquence Way; Carlyle Pl; Blue Jack Ln; N Spring Trellis Cir; Filigree Pines Pl; Angelique Way; Short Leaf; Heather Bank Pl; English Heather Pl; S Dove Trace Cir; E Majestic Woods Pl; Electra Dr; W Majestic Woods Pl; E Cartouche Cir; N Knightsgate Cir; Stanwick Pl; Snow Pond Pl; Scenic Brook Pl; N Warbler Bend Cir; N Provence Cir; W Thymewood Pl; Brywood Pl; Lanesend Pl; Julian Woods Pl; Sutton Mill Pl; Frontenac Way; Charmaine Way; Largo Woods Pl; Heron Hollow Ct; Valcourt Pl; E Legacy Point Cir; Meadow Rose Pl; Angel Dove Pl; Jewelsford Dr; Chamomile Ct; S Spring Trellis Cir; Peony Springs Ct; Eagle Rise Pl; W Legacy Point Cir; Bunnelle Way; Clary Sage Ct; Maypole Ln; Middle Gate Pl; Spruce Canyon Pl; W Cartouche Cir; Picasso Path Pl; Hansom Trail St; Pine Lodge Pl; Renoir Trail Pl; Highland Breeze Ln; Millwright Pl; Cascade Creek Dr; Gateshead Pl; Lenox Hill Pl; Fleury Way; Skipwith Pl; Oakley Downs Pl; Shawnee Ridge Ct; Culverdale Pl; Bantam Woods Dr; Hope Valley Pl; Cotillion Ct; Sedgewick Pl; Split Rail Pl; Gallery Grove Dr; Marymont Way; Journal Leaf Pl; Farington Way; Graylin Woods Pl; Birchwood Park Pl; Cantwell Way; S Pentenwell Cir; Sapling Pl; Fairlight Ct; Elfen Way; Amulet Oaks Ct; Pemberly Dr; W Beckonvale Ct; Cluny Ct; S Pentewell Cir; Larkspur Trl; S Spring Brook Ct; Stone Arrow Pl; Southern Garden Pl; Balmoral Pl; N Spring Brook Ct; New Light Pl; Blue Creek Ct; Beckonvale Ct; Peach Ridge Pl; Margaux Way; Cartouche Dr; Dulcet Hollow Ct; E Shale Creek Ct; Camino Ct; Lenox Hill Ct; Mustang Point Ct; Dahlia Trail Pl; Gentle Haze Ct; Pagehurst Ct; White Wing Ct; Vincent Ct; Mirror Ridge Ct; Scenic Brook Ct; Cambria Pines Ct; Sentinel Point Ct; Garnet Bend Ct; Hunnewell Ct.
Other features: Bear Br.
Sterling Ridge neighborhood detailed profile
Sunnyside neighborhood in Houston statistics: (Find on map)
Area: 6.339 square miles
Population: 26,328
Population density:
Median household income in 2021:
Median rent in in 2021:
Male vs Females
Median age
Housing prices:
Average estimated value of detached houses in 2021 (82.0% of all units):
Average estimated value of townhouses or other attached units in 2021 (4.9% of all units):
Most popular occupations of males: service occupations (17.5%); material moving occupations (14.6%); sales and office occupations (13.7%); construction, extraction, and maintenance occupations (11.7%); transportation occupations (11.1%); production occupations (8.7%); management occupations (except farmers) (5.7%)
Most popular occupations of females: sales and office occupations (30.2%); service occupations (29.2%); material moving occupations (9.2%); healthcare practitioners and technical occupations (8.2%); education, training, and library occupations (5.3%); business and financial operations occupations (4.6%); transportation occupations (3.7%)
Limited-access highways (interstate or state) in this neighborhood: S Loop Fwy (I- 610).
Highways in this neighborhood: South Fwy (State Hwy 288).
Roads and streets: Cullen Blvd (Co Rd 865, FM 865 N); Reed Rd; Bellfort St; Wilmington St; Scott St; Airport Blvd; Red Bud St; Sunbeam St; Larkspur St; Stassen St; Fairland Dr; Mallow St; Coffee St; Clover St; Jutland Rd; Alvin St; Brandon St; Holmes Rd; Brinkley St; Comal St; Carmen St; Buffum St; Maggie St; Rosehaven Dr; Sunflower St; Pederson St; Rosemont St; Ferdinand St; Mayflower St; Shelby Cir; Dulcimer St; Davenport St; Ashville Dr; Higgins St; Chesterfield Dr; Briscoe St; Phlox St; Chimira Ln; Parnell St; Barberry Dr; Edgar St; Tangerine St; Sparrow St; Cannon St; Grassmere St; Aledo St; Galesburg St; Calhoun Rd; Knoxville St; Edfield St; Rue St; Teton St; Dawson Ln; Bricker St; Southview St; Sierra Dr; Noel St; Colonial Ln; Cathedral Dr; Duane St; Mc Lean; Chain St; Elberta St; Livingston St; Lawler St; Niagara St; Woodward St; Sterling St; Wenda St; Grandview St; Theresa St; White Rock St; Corinth St; Danube St; Hondo St; Fountain St; Canyon St; Vera Lou St; Bloomfield St; Corksie St; Jipsie Ln; Nita St; McKinley St; Rockingham St; Groveton St; Elmwood St; Gladstone St; Glenrose St; Bassett St; Paula St; Mariah St; Ricky St; Dulcrest St; Sunnydale Dr; Angleton St; Delilah St; Elpyco St; Bowen St; Incinerator Dr; Rock Rose St; Woodward; 18th St; Merle St; Darnay Dr; Brisbane St; Dobie; Lowden St; Jester St; Rack St; Kewanee St; Newberry St; Panay Dr; Akard St; Lockhart; Bolt St; Akard; Groton Dr; Dacca Dr; Hartsville Rd; Erica Ln; Ligonberry St; Jezebel St; Kay Cir; Jethro St; Pershing St; Heno St; Peacock; Friar Point Rd; Independence; Glenrose; Altus Dr; Vinearbor St; Rubin St; Safeguard St; Jarmese St; Lingonberry St; Mallory St; Martell St; Culver St; du Bois St; Northridge Dr; Mayflower; Mallow; Poe Rd; Kinder Ln; Sh 288-Ih 610 Fwy; Pershing; Lee Otis St; Dosia St; Kappa Dr; Colt; Hilda St; Livingstone St; Tierwester St; Amadwe St; Freedom; Glory Land; Clearview St; Maggie Ave; Westover St; Redbud; Doulton Dr; Divine; Coma St; Fasco; Arden Ct; Kish; Makalu St; Arrow; Evelo; Theresa; Mc Kinley; Sunflower.
Railroad features: Southern Pacific RR.
Other features: Sims Byu.
Sunnyside neighborhood detailed profile
Area: 6.339 square miles
Population: 26,328
Population density:
| Sunnyside: | 4,154 people per square mile |
| Houston: | 3,947 people per square mile |
Median household income in 2021:
| Sunnyside: | $33,648 |
| Houston: | $55,499 |
Median rent in in 2021:
| Sunnyside: | $936 |
| Houston: | $974 |
Male vs Females
| Males: | 13,538 |
| Females: | 12,790 |
Median age
| Males: | 29.1 years |
| Females: | 37.0 years |
Housing prices:
Average estimated value of detached houses in 2021 (82.0% of all units):
| Sunnyside: | $99,671 |
| Houston: | $304,685 |
Average estimated value of townhouses or other attached units in 2021 (4.9% of all units):
| This neighborhood: | $158,850 |
| city: | $305,463 |
Most popular occupations of males: service occupations (17.5%); material moving occupations (14.6%); sales and office occupations (13.7%); construction, extraction, and maintenance occupations (11.7%); transportation occupations (11.1%); production occupations (8.7%); management occupations (except farmers) (5.7%)
Most popular occupations of females: sales and office occupations (30.2%); service occupations (29.2%); material moving occupations (9.2%); healthcare practitioners and technical occupations (8.2%); education, training, and library occupations (5.3%); business and financial operations occupations (4.6%); transportation occupations (3.7%)
Limited-access highways (interstate or state) in this neighborhood: S Loop Fwy (I- 610).
Highways in this neighborhood: South Fwy (State Hwy 288).
Roads and streets: Cullen Blvd (Co Rd 865, FM 865 N); Reed Rd; Bellfort St; Wilmington St; Scott St; Airport Blvd; Red Bud St; Sunbeam St; Larkspur St; Stassen St; Fairland Dr; Mallow St; Coffee St; Clover St; Jutland Rd; Alvin St; Brandon St; Holmes Rd; Brinkley St; Comal St; Carmen St; Buffum St; Maggie St; Rosehaven Dr; Sunflower St; Pederson St; Rosemont St; Ferdinand St; Mayflower St; Shelby Cir; Dulcimer St; Davenport St; Ashville Dr; Higgins St; Chesterfield Dr; Briscoe St; Phlox St; Chimira Ln; Parnell St; Barberry Dr; Edgar St; Tangerine St; Sparrow St; Cannon St; Grassmere St; Aledo St; Galesburg St; Calhoun Rd; Knoxville St; Edfield St; Rue St; Teton St; Dawson Ln; Bricker St; Southview St; Sierra Dr; Noel St; Colonial Ln; Cathedral Dr; Duane St; Mc Lean; Chain St; Elberta St; Livingston St; Lawler St; Niagara St; Woodward St; Sterling St; Wenda St; Grandview St; Theresa St; White Rock St; Corinth St; Danube St; Hondo St; Fountain St; Canyon St; Vera Lou St; Bloomfield St; Corksie St; Jipsie Ln; Nita St; McKinley St; Rockingham St; Groveton St; Elmwood St; Gladstone St; Glenrose St; Bassett St; Paula St; Mariah St; Ricky St; Dulcrest St; Sunnydale Dr; Angleton St; Delilah St; Elpyco St; Bowen St; Incinerator Dr; Rock Rose St; Woodward; 18th St; Merle St; Darnay Dr; Brisbane St; Dobie; Lowden St; Jester St; Rack St; Kewanee St; Newberry St; Panay Dr; Akard St; Lockhart; Bolt St; Akard; Groton Dr; Dacca Dr; Hartsville Rd; Erica Ln; Ligonberry St; Jezebel St; Kay Cir; Jethro St; Pershing St; Heno St; Peacock; Friar Point Rd; Independence; Glenrose; Altus Dr; Vinearbor St; Rubin St; Safeguard St; Jarmese St; Lingonberry St; Mallory St; Martell St; Culver St; du Bois St; Northridge Dr; Mayflower; Mallow; Poe Rd; Kinder Ln; Sh 288-Ih 610 Fwy; Pershing; Lee Otis St; Dosia St; Kappa Dr; Colt; Hilda St; Livingstone St; Tierwester St; Amadwe St; Freedom; Glory Land; Clearview St; Maggie Ave; Westover St; Redbud; Doulton Dr; Divine; Coma St; Fasco; Arden Ct; Kish; Makalu St; Arrow; Evelo; Theresa; Mc Kinley; Sunflower.
Railroad features: Southern Pacific RR.
Other features: Sims Byu.
Sunnyside neighborhood detailed profile
Sunset Terrace neighborhood in Houston statistics: (Find on map)
Area: 0.188 square miles
Population: 1,133
Population density:
Median household income in 2021:
Median rent in in 2021:
Male vs Females
Median age
Most popular occupations of males: healthcare practitioners and technical occupations (30.6%); business and financial operations occupations (22.2%); management occupations (except farmers) (20.4%); sales and office occupations (13.9%); computer and mathematical occupations (7.4%); legal occupations (5.6%); architecture and engineering occupations (3.7%)
Most popular occupations of females: sales and office occupations (57.5%); management occupations (except farmers) (20.4%); business and financial operations occupations (15.9%); healthcare practitioners and technical occupations (6.2%); legal occupations (5.5%); service occupations (5.0%); life, physical, and social science occupations (4.6%)
Roads and streets: Westpark Dr; Bissonnet St; Edloe St; Purdue St; Westerman St; Drake St; Auden St; Childress St; Syracuse St; Weslayan St; Navajo.
Railroad features: Southern Pacific RR.
Sunset Terrace neighborhood detailed profile
Area: 0.188 square miles
Population: 1,133
Population density:
| Sunset Terrace: | 6,039 people per square mile |
| Houston: | 3,947 people per square mile |
Median household income in 2021:
| Sunset Terrace: | $241,023 |
| Houston: | $55,499 |
Median rent in in 2021:
| Sunset Terrace: | $3,072 |
| Houston: | $974 |
Male vs Females
| Males: | 536 |
| Females: | 597 |
Median age
| Males: | 33.7 years |
| Females: | 31.1 years |
Most popular occupations of males: healthcare practitioners and technical occupations (30.6%); business and financial operations occupations (22.2%); management occupations (except farmers) (20.4%); sales and office occupations (13.9%); computer and mathematical occupations (7.4%); legal occupations (5.6%); architecture and engineering occupations (3.7%)
Most popular occupations of females: sales and office occupations (57.5%); management occupations (except farmers) (20.4%); business and financial operations occupations (15.9%); healthcare practitioners and technical occupations (6.2%); legal occupations (5.5%); service occupations (5.0%); life, physical, and social science occupations (4.6%)
Roads and streets: Westpark Dr; Bissonnet St; Edloe St; Purdue St; Westerman St; Drake St; Auden St; Childress St; Syracuse St; Weslayan St; Navajo.
Railroad features: Southern Pacific RR.
Sunset Terrace neighborhood detailed profile
The Villages neighborhood in Houston statistics: (Find on map)
Area: 16.153 square miles
Population: 49,881
Population density:
Median household income in 2021:
Median rent in in 2021:
Male vs Females
Median age
Housing prices:
Average estimated value of detached houses in 2021 (53.6% of all units):
Average estimated value of townhouses or other attached units in 2021 (17.0% of all units):
Average estimated '21 value of housing units in 3-to-4-unit structures (9.9% of all units):
Average estimated '21 value of housing units in 5-or-more-unit structures (47.3% of all units):
Most popular occupations of males: management occupations (except farmers) (32.0%); sales and office occupations (16.8%); business and financial operations occupations (10.0%); healthcare practitioners and technical occupations (7.2%); architecture and engineering occupations (6.1%); legal occupations (5.5%); computer and mathematical occupations (4.6%)
Most popular occupations of females: sales and office occupations (25.6%); management occupations (except farmers) (16.9%); business and financial operations occupations (11.3%); education, training, and library occupations (10.0%); service occupations (9.5%); healthcare practitioners and technical occupations (8.1%); arts, design, entertainment, sports, and media occupations (6.1%)
Limited-access highways (interstate or state) in this neighborhood: US Hwy 90 (Katy Fwy, I- 10); W Loop Fwy (I- 610).
Highways in this neighborhood: Sam Houston Pkwy (Beltway 8, State Loop 8).
Roads and streets: Memorial Dr; Old Katy Rd; Gessner Rd (Gessner Dr); Piney Point Rd; Bunker Hill Rd; Blalock Rd; Voss Rd; Taylorcrest Rd; N Post Oak Rd (Post Oak Rd); Beinhorn Rd; Westview Dr; Plantation Rd; Knipp Rd; Barryknoll Ln; Gaylord Dr; Kimberley Ln; Broken Bough Dr; River Bend Dr (Woodway Dr); Chimney Rock Rd; Boheme Dr; Cobblestone Dr; Bingle Rd; Frostwood Dr; Benignus Rd; Wirt Rd; Bayou Glen Rd; Larston St; Post Oak Ln (N Post Oak Ln); Strey Ln; Hedwig Rd (Hedwig St); Old Oaks Dr; Winningham Ln; Pine Lake Dr; Stable Crest Blvd; Burkhart Rd; Mossycup Dr; Queensbury Ln; Overcup Dr; Perthshire Rd; Chatsworth Dr; Silber Rd; Antoine Dr; Shady River Dr; Briar Dr; Cedarbrake Dr (Cedarbrake Ln); Hallie Dr; Greenbay St; Kingsride Ln; Echo Ln; Flintdale Rd; Saddlewood Ln; Saddlebrook Ln; E Friar Tuck Ln; Attingham Dr; Rip Van Winkle Dr; Stoney Creek Dr; Warrenton Dr; Elizabeth Rd; Cedardale Dr; Buckingham Dr; Wink Rd; Country Ln; W Friar Tuck Ln; San Felipe St (San Felipe Rd); Pebblebrook Dr; Pinerock Ln; Windermere Ln; Smithdale Rd; Cardwell Dr; Farnham Park Dr; Denise Dr; Little John Ln; Bryn Mawr Cir; Cedarspur St (Cedarspur Dr); Hedwig Cir; Broken Arrow Dr (Broken Arrow St); Claymore Rd; Tallowood Rd; Hartland St; Northampton Way; Shavelson St; Sandringham Dr; Westminster Dr; Vanderpool Ln; Longleaf Ln; Town and Country Way; Mayerling Dr; Campbell Rd; Green Tree Rd; Corbindale Rd; Williamsburg Ln; Pinehaven Dr; S Voss Rd; Longwoods Ln; Greenbay St (Greenbay Dr); Shartle Cir; Pine Forest Rd; Ridgeley Dr; Shadowdale Dr; Timberwilde Ln; Hibury Dr; Adkins Rd; Tynebridge Ln; Kuhlman Rd; Briar Forest Dr; Conrad Sauer Dr; Radney Rd; Lindenwood Dr; Lumpkin Rd; Town and Country Blvd; Brogden Rd; Huntingwick Dr; Afton St; Danbury Rd; Durrette Dr; Beauregard Dr; Witte Rd; Shadywood Rd; Alderney Dr; Wickwood Dr; Magdalene Dr; Lacewood Ln; Willowend Dr; Carolane Trl; Carnarvon Dr; Pifer Rd; W 12th St; Crab Orchard Rd; Shasta Dr; Wickford Dr; Fries Rd; Sage Rd; Woodsage Dr; Wisterwood Dr; Blandford Ln; Bace Dr; Wilding Ln; Valley Forge Dr; Woodthorpe Ln; Hunterwood Dr; Hollow Dr; Woodsborough Cir; Hunters Grove Ln; Long Branch Ln; Paul Revere Dr; Timberglen Dr; Riedel Dr; W Creekside Dr; Green Oaks Dr (Green Oaks St); Wendover Ln; Stablewood Blvd; Monica St; E Stillforest St; ; Memorial City Way; Maple Valley Rd; Cresent Gate Ln; Tamerlaine Dr; N Lou-Al Ct; Patti Lynn Ln; S Piney Point Rd (Fondren Rd); W Stillforest St; Thamer Ln; Bryonwood Dr; Tarrington Dr; Park Laureate Dr; Betty Jane Ln; Ben Hur Dr; Hunters Creek Dr; Croes Dr; Gage Ct; Wade Hampton Dr; Saddletree; Briar Ridge Dr; S Ripple Creek Dr; Long Shadow Ln; Wedgewood Ln; Litchfield Ln; Flint River Dr; Faust Ln; Bellewood Dr; Sugar Berry Cir; Edgeway Dr; Hickory Ridge Dr; Quail Hollow Ln; S Country Squire; Fall River Rd; N Country Squire; Sandalwood Dr; International Blvd; Kenilworth St (Kenilworth Dr); S Post Oak Ln; E Broad Oaks Dr; Roaring Brook Ln; Ripple Creek Dr; Awty School Ln; Tealwood Dr; Creek Wood Way; Pine Hollow Ln; Merrie Way Ln; Holidan Way; Longworth Ln; Glourie Dr; Gawain Ln; Cedar Post Ln; Gingham Dr; Oak Ln; Pine Shadows Dr; River Bend Dr; Joan of Arc Dr (Joan of Arc St); Clearbrook Ln; Raintree Cir; Kinkaid School Dr; Shadow Way St; W Bough Ln; Calico Ln; Memorial Woods Dr; Three Corners Dr; Spriggs Way; Indian Trl; Arrowood Cir; Legend Ln; Stable Ln; Ourlane Cir; Hilldale St; Vindon Dr; Smithdale Estates Dr; Trail Hollow Dr; Rocky Meadow Dr; E Creekside Dr; Powder Horn St (Powderhorn Ln); Blalock Forest; N Creekside Ln; Valley Star Dr; S Creekside Ct; Woods Edge Ln; Hunters Park Ln; Old Lake Rd; Marchmont Dr; Longbow Ln; Shady Grove Ln; Green Tree Dr (Green Tree Rd); Haversham Dr; Highgrove Park; Lanecrest Ln; Wellesley Dr; W Dana Ln; Bridlewood St; Wickwild; Kilts Dr; Hickory Hollow; S Lou-Al Ct; Mignon Ln; Pasture View Ln; Habersham Ln; Frandora Ln; Bendwood Dr; Storywood Dr; Hunters Trl; River Glyn Dr; Hickory Shadows Dr; W Tex Dr; Winshire Dr (Winshire Cir); Wickline Dr; Mott Ln; Heritage Oaks Ln; Willowron Dr; Walwick Dr; Dunbeath Dr; Talmadge Dr; Bade St; Forest Glen St; Bayou Timber Ln; Camelot Ln; Surrey Ln; Memorial Point Ln; Meadowick Dr; Green Valley Dr; Dunnam Ln; Stonegate Dr; Flintwood Dr; Georgibelle Dr; Krist Dr; Village Oaks Ln; Shadyglen Dr; Wood Ln; Chuckanut Ln; Coldstream Rd; Anne St; Oak Valley Dr; Fleetway Dr; Fairlane Dr; Butterfly Ln; Homewoodlane Pl (Homewood Ln); Chapel Belle Ln; Brown Saddle St (Brown Saddle Rd); Winwood Ln; Kemwood Dr; Wyndham Park Dr; Windhover Ln; Bayhurst Dr; Duart Dr; Echo Valley Dr; Riverview Way; Naughton St; Taweek Dr; Smithdale Ct; Park Trl; Hollyridge Dr; Surrey Oaks Ln; Winston Woods Dr; S Durrette Dr; W Memorial Park Dr; Applewood St; Jan Kelly Ln; Indian Cir; Boros Dr; Hunters Park Dr; Coloma Ln; Oaklawn Dr; Hedwig Way; Bettina Ct (Bettina Ln); Herman St; Hunters Branch Dr; Inwood Oaks Dr; Leisure Ln; Tickner St; Queen Annes Rd; Rolling Knolls; Hunters Trail St; Farther Point St; Rainier Dr; Tecumseh Ln; Pinewold Dr; N Evers Park Dr; Lone Star Dr; Merridel Rd; Bayou Glen St; N Durrette Dr; Blalock Ln; Old Coach Ln; White Pillars Ln; Trail End St; Marsha Ln; Tynewood Dr; Pineland Dr; Somerland Way; Saddlewood Estates Dr; Kensington Ct; Fallen Timbers; Kingsbrook Rd; Holy Rood Ln; Demaret Ln; Wickdale Dr; Post Oak Cir; S Evers Park Dr; Wild Valley Rd; Arrowwood Cir; Kirwick Dr; Vaja Dr; Pech Rd; Memorial Woods Cir; Loeser Dr; River Point Dr; Tokeneke Trl; Liberty Bell Cir; Robinlake Ln; Bridgewood St; Glynn Way Dr; Creekside Ln; Wickway; Confederate Rd; Memorial Park B Dr; la Fonte St; S Cheska Ln; Mooremeadow Ln; Gretel Dr; Lookmoor; Jeffers Ct; Potomac Dr; Falling Leaf Ln; Green Vale Dr; Country Ct; Memorial Village Dr; Mustang Ln; Innisfree St (Innisfree Ct); Jamestown Rd; Guinea Dr; Oak Tree Dr; Tynebrook Ln; Mooreknoll Ln; ; Harness Creek Ln; Iris Lee Ln; Country Way; Moordale Ln; Bending Oaks Ln; Piney Point Cir; Churchill Ct; Knippwood Ln; Mathewson Ln; Randy Dr; Edgewood St; Timber Terrace Rd; Kingsworthy Ln; Musket Ln; Mockingbird; Fidelia Ct; Everwood Ln; Starwood Dr; Indian Bayou; Rhett Dr; Long Timbers Ln; Hedwig Green St; Beechmont Rd; N Cheska Ln; Tarleton Dr; Tara Dr; Hudson Cir; Millbrook St; Carsey Woods Cir (Carsey Ln); Chowning Rd; Capri; Shadeland Dr; Town & Country; Skene Way; Sprucewood Ln; Debbie Ln; Val Lena Dr; Saddlehorn Dr (Saddlehorn Ln); Twelve Oaks Dr; Way Manor; Springrock Ln; Echo Hollow; Hedwig Shadows Dr (Hedwig Shadows Ln); Lornmead Dr; Briar Branch Ln (Briar Branch Dr); Hermosa Ct; Timberknoll St; Caruthers Ln; Constance Dr; Williamsburg Dr (Williamsburg); Lochtyne Way; Landon Ln; Heathcliff Ct; Bolton Pl; Bylane Dr; Bayou Shadows St; Saybrook; Huntwyck Dr; Jack Ln; Hampton Ct; Hickorywood Ln; Cluster Dr; Heather Ct; Whippoorwill; Hunters Ridge Ct; Village Park Cir; Shallowbrook Ln; Arbordale Ln; Pineneedle Dr; Timber Hill Dr; Dunsinane St (Dunsinane Dr); Pine Grove Cir; Laurie Ln; Long Leaf Ln; W Broad Oaks Dr; Bothwell Way; Steppingstone Ln; Huntington Cove; Rain Hollow Pl; Stablewood Ct; Pecan Trail Ln; Pine Forest Cir; Heather Cir; Pound Ridge; Windy Ln; Pine Tree Dr (Pine Tree Ln); Robinwood Ln; Glendenning Ln; Memorial Park Dr; Wexford Ct; Stuckey Ln; Hudson Ct; N Post Oak Ln; Burkhart Ct; Farish Cir; Pine Chase Dr; Chatten Way; Wild Oak Cir; Tamy Ln; Cawdor Way; S Chestwood Dr; Carlton Park Ct; Tunbridge Ln; Tyne Ct; N Chestwood Dr; Knipp Forest St; Lazee Trl; Patrick Ct; Heritage; Cavell St; Mockingbird Ln; Hacienda Ln; Stillforest St; Rip Van Winkle Ln; Clarendon Ln; Trianon St; Pebble Hill Dr; Callie Ct; Sleepy Oaks Cir; Martin Ln; Woodstone; Bradfield Ct; Cavell Ln; Jaycee Ln; Murrayhill Dr; Shannon Cir; Anadell St; Traviata Dr; Robbins Dr; Doncaster Rd; Belin Manor Dr; Raydon Ln; Tall Oaks; Voss Park Dr; Limerick Ln; Brandon Way; Flint Forest Ln; Greenbay Cir; Chatam Ln; Hilshire Green Dr; Tealwood North Dr; Teakwood Ln; Claret Ln; Patriot Ln; Echo Wood St; Heritage Ln; Flint Point Dr; Lazy Wood Ln; Pinewood Cir; Cleghorn Ln; Claymore Ct; Walden Ln; Gentilly Pl; Little Lisa Ln; Longwood Ct; Clifford; Buckingham Ct (Buckingham Court Cir); Taylorcrest Ct; Stoney Ridge Ln; Coachman Ln (Coachman St); Maggie Ln; Baker Cove; Duchess Ct; Figaro Dr; Lou-Al Dr; Thamer Cir; Carl Ln; Mc Leods Ln; Saddle Creek; Montebello Ct; Broken Bough Cir; Oakford Ct; Loop Fwy; Pine Briar Cir; Briar Trl; Pinewold Cir; Hackamore Ln; E Broad Oaks Ln; Grecian Way; Lorrielake Ln; Hunters Forest Dr; Radney Ests; Pine Bayou St; Glennville Ct; Chapelwood Ct; Oak Hollow; Memorial Bend; Gray Moss Ln; Mallie Ct; Cedar Post St; Bauerle Ct; Cape Cod Ln; Sauve Ln; Winrock Blvd; Fountain Bleu St; Longwoods Dr; Monticello St; Oakford Dr; Glen Echo; Ames Cir; Brompton Ct; Stable Crest Ct; Lochtyne Cir; Pecanwood Ln; Red Coat Ln; Tealmeadow Ct; Hilshire Oaks Ct; Radney Cir; Pifer Way; Soldiers Creek Cir; Stayton Cir; Crestwood Estates Dr; Concord Cir; Fontainbleu; Penn Manor Ct; Stagestop Cir; Melody Ln; Joshua Ln; Holly Springs Dr; Teresa Dr; Mickey Way; River Cir; Broad Oaks Cir; Knipp Oaks St; Summer Hill Ln; Norvell Ct; Tecumseh Cir; Buffalo Ridge Cir; Quail Creek Ct; Willowick Cir; Verdi Dr; Winners Cir; Chapelwood Ln; Pama Cir; Shadow Way; Houstonian; Blalock Cir; Corwin Pl; Fall River Ct; Folwell Ln; Moss Spring Ln; Magnolia Bend Dr; Deerwood Rd; Arrowood Cir N; Oak Creek St; Claywood St (Claywood Ct); Magnolia Cir; Broad Oaks Park; Hedwig Ln; Amberton Ln; Spring Hollow; Ripple Ln; Creekside Cir (Creekside Ct); Martin Ct; Tiber St; Derham Parc; Arborway St; Our Lane Trl; Karos Ln; Cheshirevale St; Drury Ln; Deepwell Ln; Memorial Cove; Millgrove Ln; Barazi Oaks Ct; Greencove St; Mais; Dolphin Ct; Spring Hollow St; Hibury Ct; Rebecca Pines Ct; Providence Park; Eaton Ct; Indian Bluff; Hickory Ridge Ct; April Way; Tiny Trl; Burkhart Cir; Hedwig Ct; Cavell Ct (Cavell Ln); Pinewold Ct; Winding Brook Ln; Branch Bend; Memorial Cir; Oak Shadows Ln; Willowgren Dr; Radney Road Ests (Radney Estate Rd); Barracuda Ct; Modiste St; Hunters Creek Pl; Knipp Ct (Knipp Rd); Shadow Way Ct; Applewood Dr; Pine Crescent Ct; Kari Ct; Broad Oaks Trl; Voss Pkwy; Menking Ct; Broad Oaks Ct; J Star Ct; Saddlebranch Ct; Ourlane Ct (Our Long Ct); Trails Ct; Lodge Hollow Ct; Burkhart Dr; Hickory Ct; Balmorai Ln; Tarrington Ct; Huntington Park Ct; Anne; Cardwell St; Ourlane Cove; Gessner Rd; Blalock Woods St; Fries Ct; Pom Ct; Gens Ct; Huntington Park Cir; Gable Lodge Ct; Parkland Ct; Crescent Gate Ct; Blalock Pines Ct; Glourie Cir; Our Lane Pl; Godsey Ct; Ball Chase; Chartwell Ct; Vanderpool Ct; Raina Ln; Lariat Rd; Boheme Ct; Wolf Ct; Long Timbers Trl; Oak Glen Ct; Hunters Way Ct; Clay Point Ct; Green Point Ct.
Other features: Buffalo Byu.
Other features: Briar Br; Briar Branch Byu.
Other features: Spring Branch Byu.
Other features: Briar Branch Crk.
Other features: Newman Br; Spring Branch Crk.
Other features: Bering Ditch.
The Villages neighborhood detailed profile
Area: 16.153 square miles
Population: 49,881
Population density:
| The Villages: | 3,088 people per square mile |
| Houston: | 3,947 people per square mile |
Median household income in 2021:
| The Villages: | $160,771 |
| Houston: | $55,499 |
Median rent in in 2021:
| The Villages: | $1,497 |
| Houston: | $974 |
Male vs Females
| Males: | 23,848 |
| Females: | 26,032 |
Median age
| Males: | 43.5 years |
| Females: | 41.9 years |
Housing prices:
Average estimated value of detached houses in 2021 (53.6% of all units):
| The Villages: | $1,441,545 |
| Houston: | $304,685 |
Average estimated value of townhouses or other attached units in 2021 (17.0% of all units):
| This neighborhood: | $343,419 |
| city: | $305,463 |
Average estimated '21 value of housing units in 3-to-4-unit structures (9.9% of all units):
| The Villages: | $159,037 |
| city: | $184,874 |
Average estimated '21 value of housing units in 5-or-more-unit structures (47.3% of all units):
| The Villages: | $243,024 |
| Houston: | $227,414 |
Most popular occupations of males: management occupations (except farmers) (32.0%); sales and office occupations (16.8%); business and financial operations occupations (10.0%); healthcare practitioners and technical occupations (7.2%); architecture and engineering occupations (6.1%); legal occupations (5.5%); computer and mathematical occupations (4.6%)
Most popular occupations of females: sales and office occupations (25.6%); management occupations (except farmers) (16.9%); business and financial operations occupations (11.3%); education, training, and library occupations (10.0%); service occupations (9.5%); healthcare practitioners and technical occupations (8.1%); arts, design, entertainment, sports, and media occupations (6.1%)
Limited-access highways (interstate or state) in this neighborhood: US Hwy 90 (Katy Fwy, I- 10); W Loop Fwy (I- 610).
Highways in this neighborhood: Sam Houston Pkwy (Beltway 8, State Loop 8).
Roads and streets: Memorial Dr; Old Katy Rd; Gessner Rd (Gessner Dr); Piney Point Rd; Bunker Hill Rd; Blalock Rd; Voss Rd; Taylorcrest Rd; N Post Oak Rd (Post Oak Rd); Beinhorn Rd; Westview Dr; Plantation Rd; Knipp Rd; Barryknoll Ln; Gaylord Dr; Kimberley Ln; Broken Bough Dr; River Bend Dr (Woodway Dr); Chimney Rock Rd; Boheme Dr; Cobblestone Dr; Bingle Rd; Frostwood Dr; Benignus Rd; Wirt Rd; Bayou Glen Rd; Larston St; Post Oak Ln (N Post Oak Ln); Strey Ln; Hedwig Rd (Hedwig St); Old Oaks Dr; Winningham Ln; Pine Lake Dr; Stable Crest Blvd; Burkhart Rd; Mossycup Dr; Queensbury Ln; Overcup Dr; Perthshire Rd; Chatsworth Dr; Silber Rd; Antoine Dr; Shady River Dr; Briar Dr; Cedarbrake Dr (Cedarbrake Ln); Hallie Dr; Greenbay St; Kingsride Ln; Echo Ln; Flintdale Rd; Saddlewood Ln; Saddlebrook Ln; E Friar Tuck Ln; Attingham Dr; Rip Van Winkle Dr; Stoney Creek Dr; Warrenton Dr; Elizabeth Rd; Cedardale Dr; Buckingham Dr; Wink Rd; Country Ln; W Friar Tuck Ln; San Felipe St (San Felipe Rd); Pebblebrook Dr; Pinerock Ln; Windermere Ln; Smithdale Rd; Cardwell Dr; Farnham Park Dr; Denise Dr; Little John Ln; Bryn Mawr Cir; Cedarspur St (Cedarspur Dr); Hedwig Cir; Broken Arrow Dr (Broken Arrow St); Claymore Rd; Tallowood Rd; Hartland St; Northampton Way; Shavelson St; Sandringham Dr; Westminster Dr; Vanderpool Ln; Longleaf Ln; Town and Country Way; Mayerling Dr; Campbell Rd; Green Tree Rd; Corbindale Rd; Williamsburg Ln; Pinehaven Dr; S Voss Rd; Longwoods Ln; Greenbay St (Greenbay Dr); Shartle Cir; Pine Forest Rd; Ridgeley Dr; Shadowdale Dr; Timberwilde Ln; Hibury Dr; Adkins Rd; Tynebridge Ln; Kuhlman Rd; Briar Forest Dr; Conrad Sauer Dr; Radney Rd; Lindenwood Dr; Lumpkin Rd; Town and Country Blvd; Brogden Rd; Huntingwick Dr; Afton St; Danbury Rd; Durrette Dr; Beauregard Dr; Witte Rd; Shadywood Rd; Alderney Dr; Wickwood Dr; Magdalene Dr; Lacewood Ln; Willowend Dr; Carolane Trl; Carnarvon Dr; Pifer Rd; W 12th St; Crab Orchard Rd; Shasta Dr; Wickford Dr; Fries Rd; Sage Rd; Woodsage Dr; Wisterwood Dr; Blandford Ln; Bace Dr; Wilding Ln; Valley Forge Dr; Woodthorpe Ln; Hunterwood Dr; Hollow Dr; Woodsborough Cir; Hunters Grove Ln; Long Branch Ln; Paul Revere Dr; Timberglen Dr; Riedel Dr; W Creekside Dr; Green Oaks Dr (Green Oaks St); Wendover Ln; Stablewood Blvd; Monica St; E Stillforest St; ; Memorial City Way; Maple Valley Rd; Cresent Gate Ln; Tamerlaine Dr; N Lou-Al Ct; Patti Lynn Ln; S Piney Point Rd (Fondren Rd); W Stillforest St; Thamer Ln; Bryonwood Dr; Tarrington Dr; Park Laureate Dr; Betty Jane Ln; Ben Hur Dr; Hunters Creek Dr; Croes Dr; Gage Ct; Wade Hampton Dr; Saddletree; Briar Ridge Dr; S Ripple Creek Dr; Long Shadow Ln; Wedgewood Ln; Litchfield Ln; Flint River Dr; Faust Ln; Bellewood Dr; Sugar Berry Cir; Edgeway Dr; Hickory Ridge Dr; Quail Hollow Ln; S Country Squire; Fall River Rd; N Country Squire; Sandalwood Dr; International Blvd; Kenilworth St (Kenilworth Dr); S Post Oak Ln; E Broad Oaks Dr; Roaring Brook Ln; Ripple Creek Dr; Awty School Ln; Tealwood Dr; Creek Wood Way; Pine Hollow Ln; Merrie Way Ln; Holidan Way; Longworth Ln; Glourie Dr; Gawain Ln; Cedar Post Ln; Gingham Dr; Oak Ln; Pine Shadows Dr; River Bend Dr; Joan of Arc Dr (Joan of Arc St); Clearbrook Ln; Raintree Cir; Kinkaid School Dr; Shadow Way St; W Bough Ln; Calico Ln; Memorial Woods Dr; Three Corners Dr; Spriggs Way; Indian Trl; Arrowood Cir; Legend Ln; Stable Ln; Ourlane Cir; Hilldale St; Vindon Dr; Smithdale Estates Dr; Trail Hollow Dr; Rocky Meadow Dr; E Creekside Dr; Powder Horn St (Powderhorn Ln); Blalock Forest; N Creekside Ln; Valley Star Dr; S Creekside Ct; Woods Edge Ln; Hunters Park Ln; Old Lake Rd; Marchmont Dr; Longbow Ln; Shady Grove Ln; Green Tree Dr (Green Tree Rd); Haversham Dr; Highgrove Park; Lanecrest Ln; Wellesley Dr; W Dana Ln; Bridlewood St; Wickwild; Kilts Dr; Hickory Hollow; S Lou-Al Ct; Mignon Ln; Pasture View Ln; Habersham Ln; Frandora Ln; Bendwood Dr; Storywood Dr; Hunters Trl; River Glyn Dr; Hickory Shadows Dr; W Tex Dr; Winshire Dr (Winshire Cir); Wickline Dr; Mott Ln; Heritage Oaks Ln; Willowron Dr; Walwick Dr; Dunbeath Dr; Talmadge Dr; Bade St; Forest Glen St; Bayou Timber Ln; Camelot Ln; Surrey Ln; Memorial Point Ln; Meadowick Dr; Green Valley Dr; Dunnam Ln; Stonegate Dr; Flintwood Dr; Georgibelle Dr; Krist Dr; Village Oaks Ln; Shadyglen Dr; Wood Ln; Chuckanut Ln; Coldstream Rd; Anne St; Oak Valley Dr; Fleetway Dr; Fairlane Dr; Butterfly Ln; Homewoodlane Pl (Homewood Ln); Chapel Belle Ln; Brown Saddle St (Brown Saddle Rd); Winwood Ln; Kemwood Dr; Wyndham Park Dr; Windhover Ln; Bayhurst Dr; Duart Dr; Echo Valley Dr; Riverview Way; Naughton St; Taweek Dr; Smithdale Ct; Park Trl; Hollyridge Dr; Surrey Oaks Ln; Winston Woods Dr; S Durrette Dr; W Memorial Park Dr; Applewood St; Jan Kelly Ln; Indian Cir; Boros Dr; Hunters Park Dr; Coloma Ln; Oaklawn Dr; Hedwig Way; Bettina Ct (Bettina Ln); Herman St; Hunters Branch Dr; Inwood Oaks Dr; Leisure Ln; Tickner St; Queen Annes Rd; Rolling Knolls; Hunters Trail St; Farther Point St; Rainier Dr; Tecumseh Ln; Pinewold Dr; N Evers Park Dr; Lone Star Dr; Merridel Rd; Bayou Glen St; N Durrette Dr; Blalock Ln; Old Coach Ln; White Pillars Ln; Trail End St; Marsha Ln; Tynewood Dr; Pineland Dr; Somerland Way; Saddlewood Estates Dr; Kensington Ct; Fallen Timbers; Kingsbrook Rd; Holy Rood Ln; Demaret Ln; Wickdale Dr; Post Oak Cir; S Evers Park Dr; Wild Valley Rd; Arrowwood Cir; Kirwick Dr; Vaja Dr; Pech Rd; Memorial Woods Cir; Loeser Dr; River Point Dr; Tokeneke Trl; Liberty Bell Cir; Robinlake Ln; Bridgewood St; Glynn Way Dr; Creekside Ln; Wickway; Confederate Rd; Memorial Park B Dr; la Fonte St; S Cheska Ln; Mooremeadow Ln; Gretel Dr; Lookmoor; Jeffers Ct; Potomac Dr; Falling Leaf Ln; Green Vale Dr; Country Ct; Memorial Village Dr; Mustang Ln; Innisfree St (Innisfree Ct); Jamestown Rd; Guinea Dr; Oak Tree Dr; Tynebrook Ln; Mooreknoll Ln; ; Harness Creek Ln; Iris Lee Ln; Country Way; Moordale Ln; Bending Oaks Ln; Piney Point Cir; Churchill Ct; Knippwood Ln; Mathewson Ln; Randy Dr; Edgewood St; Timber Terrace Rd; Kingsworthy Ln; Musket Ln; Mockingbird; Fidelia Ct; Everwood Ln; Starwood Dr; Indian Bayou; Rhett Dr; Long Timbers Ln; Hedwig Green St; Beechmont Rd; N Cheska Ln; Tarleton Dr; Tara Dr; Hudson Cir; Millbrook St; Carsey Woods Cir (Carsey Ln); Chowning Rd; Capri; Shadeland Dr; Town & Country; Skene Way; Sprucewood Ln; Debbie Ln; Val Lena Dr; Saddlehorn Dr (Saddlehorn Ln); Twelve Oaks Dr; Way Manor; Springrock Ln; Echo Hollow; Hedwig Shadows Dr (Hedwig Shadows Ln); Lornmead Dr; Briar Branch Ln (Briar Branch Dr); Hermosa Ct; Timberknoll St; Caruthers Ln; Constance Dr; Williamsburg Dr (Williamsburg); Lochtyne Way; Landon Ln; Heathcliff Ct; Bolton Pl; Bylane Dr; Bayou Shadows St; Saybrook; Huntwyck Dr; Jack Ln; Hampton Ct; Hickorywood Ln; Cluster Dr; Heather Ct; Whippoorwill; Hunters Ridge Ct; Village Park Cir; Shallowbrook Ln; Arbordale Ln; Pineneedle Dr; Timber Hill Dr; Dunsinane St (Dunsinane Dr); Pine Grove Cir; Laurie Ln; Long Leaf Ln; W Broad Oaks Dr; Bothwell Way; Steppingstone Ln; Huntington Cove; Rain Hollow Pl; Stablewood Ct; Pecan Trail Ln; Pine Forest Cir; Heather Cir; Pound Ridge; Windy Ln; Pine Tree Dr (Pine Tree Ln); Robinwood Ln; Glendenning Ln; Memorial Park Dr; Wexford Ct; Stuckey Ln; Hudson Ct; N Post Oak Ln; Burkhart Ct; Farish Cir; Pine Chase Dr; Chatten Way; Wild Oak Cir; Tamy Ln; Cawdor Way; S Chestwood Dr; Carlton Park Ct; Tunbridge Ln; Tyne Ct; N Chestwood Dr; Knipp Forest St; Lazee Trl; Patrick Ct; Heritage; Cavell St; Mockingbird Ln; Hacienda Ln; Stillforest St; Rip Van Winkle Ln; Clarendon Ln; Trianon St; Pebble Hill Dr; Callie Ct; Sleepy Oaks Cir; Martin Ln; Woodstone; Bradfield Ct; Cavell Ln; Jaycee Ln; Murrayhill Dr; Shannon Cir; Anadell St; Traviata Dr; Robbins Dr; Doncaster Rd; Belin Manor Dr; Raydon Ln; Tall Oaks; Voss Park Dr; Limerick Ln; Brandon Way; Flint Forest Ln; Greenbay Cir; Chatam Ln; Hilshire Green Dr; Tealwood North Dr; Teakwood Ln; Claret Ln; Patriot Ln; Echo Wood St; Heritage Ln; Flint Point Dr; Lazy Wood Ln; Pinewood Cir; Cleghorn Ln; Claymore Ct; Walden Ln; Gentilly Pl; Little Lisa Ln; Longwood Ct; Clifford; Buckingham Ct (Buckingham Court Cir); Taylorcrest Ct; Stoney Ridge Ln; Coachman Ln (Coachman St); Maggie Ln; Baker Cove; Duchess Ct; Figaro Dr; Lou-Al Dr; Thamer Cir; Carl Ln; Mc Leods Ln; Saddle Creek; Montebello Ct; Broken Bough Cir; Oakford Ct; Loop Fwy; Pine Briar Cir; Briar Trl; Pinewold Cir; Hackamore Ln; E Broad Oaks Ln; Grecian Way; Lorrielake Ln; Hunters Forest Dr; Radney Ests; Pine Bayou St; Glennville Ct; Chapelwood Ct; Oak Hollow; Memorial Bend; Gray Moss Ln; Mallie Ct; Cedar Post St; Bauerle Ct; Cape Cod Ln; Sauve Ln; Winrock Blvd; Fountain Bleu St; Longwoods Dr; Monticello St; Oakford Dr; Glen Echo; Ames Cir; Brompton Ct; Stable Crest Ct; Lochtyne Cir; Pecanwood Ln; Red Coat Ln; Tealmeadow Ct; Hilshire Oaks Ct; Radney Cir; Pifer Way; Soldiers Creek Cir; Stayton Cir; Crestwood Estates Dr; Concord Cir; Fontainbleu; Penn Manor Ct; Stagestop Cir; Melody Ln; Joshua Ln; Holly Springs Dr; Teresa Dr; Mickey Way; River Cir; Broad Oaks Cir; Knipp Oaks St; Summer Hill Ln; Norvell Ct; Tecumseh Cir; Buffalo Ridge Cir; Quail Creek Ct; Willowick Cir; Verdi Dr; Winners Cir; Chapelwood Ln; Pama Cir; Shadow Way; Houstonian; Blalock Cir; Corwin Pl; Fall River Ct; Folwell Ln; Moss Spring Ln; Magnolia Bend Dr; Deerwood Rd; Arrowood Cir N; Oak Creek St; Claywood St (Claywood Ct); Magnolia Cir; Broad Oaks Park; Hedwig Ln; Amberton Ln; Spring Hollow; Ripple Ln; Creekside Cir (Creekside Ct); Martin Ct; Tiber St; Derham Parc; Arborway St; Our Lane Trl; Karos Ln; Cheshirevale St; Drury Ln; Deepwell Ln; Memorial Cove; Millgrove Ln; Barazi Oaks Ct; Greencove St; Mais; Dolphin Ct; Spring Hollow St; Hibury Ct; Rebecca Pines Ct; Providence Park; Eaton Ct; Indian Bluff; Hickory Ridge Ct; April Way; Tiny Trl; Burkhart Cir; Hedwig Ct; Cavell Ct (Cavell Ln); Pinewold Ct; Winding Brook Ln; Branch Bend; Memorial Cir; Oak Shadows Ln; Willowgren Dr; Radney Road Ests (Radney Estate Rd); Barracuda Ct; Modiste St; Hunters Creek Pl; Knipp Ct (Knipp Rd); Shadow Way Ct; Applewood Dr; Pine Crescent Ct; Kari Ct; Broad Oaks Trl; Voss Pkwy; Menking Ct; Broad Oaks Ct; J Star Ct; Saddlebranch Ct; Ourlane Ct (Our Long Ct); Trails Ct; Lodge Hollow Ct; Burkhart Dr; Hickory Ct; Balmorai Ln; Tarrington Ct; Huntington Park Ct; Anne; Cardwell St; Ourlane Cove; Gessner Rd; Blalock Woods St; Fries Ct; Pom Ct; Gens Ct; Huntington Park Cir; Gable Lodge Ct; Parkland Ct; Crescent Gate Ct; Blalock Pines Ct; Glourie Cir; Our Lane Pl; Godsey Ct; Ball Chase; Chartwell Ct; Vanderpool Ct; Raina Ln; Lariat Rd; Boheme Ct; Wolf Ct; Long Timbers Trl; Oak Glen Ct; Hunters Way Ct; Clay Point Ct; Green Point Ct.
Other features: Buffalo Byu.
Other features: Briar Br; Briar Branch Byu.
Other features: Spring Branch Byu.
Other features: Briar Branch Crk.
Other features: Newman Br; Spring Branch Crk.
Other features: Bering Ditch.
The Villages neighborhood detailed profile
Third Ward neighborhood in Houston statistics: (Find on map)
Area: 2.953 square miles
Population: 17,470
Population density:
Median household income in 2021:
Median rent in in 2021:
Male vs Females
Median age
Housing prices:
Average estimated value of detached houses in 2021 (49.9% of all units):
Average estimated value of housing units in 2-unit structures in 2021 (14.2% of all units):
Most popular occupations of males: service occupations (16.5%); sales and office occupations (15.9%); transportation occupations (12.2%); management occupations (except farmers) (10.1%); education, training, and library occupations (6.8%); business and financial operations occupations (6.3%); material moving occupations (5.4%)
Most popular occupations of females: sales and office occupations (21.4%); service occupations (21.0%); education, training, and library occupations (15.2%); business and financial operations occupations (11.3%); management occupations (except farmers) (8.0%); healthcare practitioners and technical occupations (7.2%); material moving occupations (3.0%)
Limited-access highways (interstate or state) in this neighborhood: I- 45 (Gulf Fwy).
Highways in this neighborhood: State Hwy 35; Eastex Fwy (US Hwy 59); US Hwy 59 (Southwest Fwy); South Fwy (State Hwy 288).
Roads and streets: Elgin St; Wheeler St; Tuam St; McGowen St; Holman St; Cleburne St; Dennis St; Drew St; Anita St; Live Oak St; Dowling St; Tierwester St; Hadley St; Hutchins St; Rosalie St; Alabama St; Delano St; St Emanuel St; Calhoun Rd; Sampson St; McIlhenny St; Francis St; Winbern St; Scott St; Truxillo St; Nettleton St; Webster St; Cullen Blvd; Rosewood St; Burkett St; Sauer St; Bremond St; Isabella St; Canfield St; Gray St; Eagle St; Bastrop St; Ruth St; St Charles St (Saint Charles St); Ennis St; Nagle St; Berry St; Briley St; Napoleon St; Beulah St; Simmons St; Barbee St; Reeves St; Velasco St; Chartres St; Lucinda St; Cobb St; Brailsfort St; Milby St; University Park; Adair St; Callie St; E Alabama Ave; Trulley St; Stuart St; Leek St; Susan Ann Ct; Attucks St; Reading; Chenevert St; Paige St; S Lockwood Dr; Pierce St; Francis; Sanders St; Beulah; Roberts St; Cougar Pl; Drew; Anita; Tuam; Division St; Nalle St; Cuney Dr; Palmer St; Rose Ct; Hamilton St; Milby; Elgin Ct; Sheppard Rd; Calhoun-Pease; Rugley St; Callie; Webster; Mc Ilhenny; Chaco St; Gray Ct; Alabama; Naplava St; Sauer Aly; Jones Ct; Lockwood Dr; Overton Ct; Adair; Live Oak Ct; Simmons Ct; University Oaks Blvd; Blodgett St; Francis Ct.
Railroad features: at and Sf Rlwy; Houston Belt and Terminal Rlwy; Southern Pacific RR.
Other features: Brays Byu.
Third Ward neighborhood detailed profile
Area: 2.953 square miles
Population: 17,470
Population density:
| Third Ward: | 5,916 people per square mile |
| Houston: | 3,947 people per square mile |
Median household income in 2021:
| Third Ward: | $53,477 |
| Houston: | $55,499 |
Median rent in in 2021:
| Third Ward: | $602 |
| Houston: | $974 |
Male vs Females
| Males: | 7,955 |
| Females: | 9,514 |
Median age
| Males: | 34.6 years |
| Females: | 33.9 years |
Housing prices:
Average estimated value of detached houses in 2021 (49.9% of all units):
| Third Ward: | $250,222 |
| Houston: | $304,685 |
Average estimated value of housing units in 2-unit structures in 2021 (14.2% of all units):
| This neighborhood: | $219,600 |
| Houston: | $330,754 |
Most popular occupations of males: service occupations (16.5%); sales and office occupations (15.9%); transportation occupations (12.2%); management occupations (except farmers) (10.1%); education, training, and library occupations (6.8%); business and financial operations occupations (6.3%); material moving occupations (5.4%)
Most popular occupations of females: sales and office occupations (21.4%); service occupations (21.0%); education, training, and library occupations (15.2%); business and financial operations occupations (11.3%); management occupations (except farmers) (8.0%); healthcare practitioners and technical occupations (7.2%); material moving occupations (3.0%)
Limited-access highways (interstate or state) in this neighborhood: I- 45 (Gulf Fwy).
Highways in this neighborhood: State Hwy 35; Eastex Fwy (US Hwy 59); US Hwy 59 (Southwest Fwy); South Fwy (State Hwy 288).
Roads and streets: Elgin St; Wheeler St; Tuam St; McGowen St; Holman St; Cleburne St; Dennis St; Drew St; Anita St; Live Oak St; Dowling St; Tierwester St; Hadley St; Hutchins St; Rosalie St; Alabama St; Delano St; St Emanuel St; Calhoun Rd; Sampson St; McIlhenny St; Francis St; Winbern St; Scott St; Truxillo St; Nettleton St; Webster St; Cullen Blvd; Rosewood St; Burkett St; Sauer St; Bremond St; Isabella St; Canfield St; Gray St; Eagle St; Bastrop St; Ruth St; St Charles St (Saint Charles St); Ennis St; Nagle St; Berry St; Briley St; Napoleon St; Beulah St; Simmons St; Barbee St; Reeves St; Velasco St; Chartres St; Lucinda St; Cobb St; Brailsfort St; Milby St; University Park; Adair St; Callie St; E Alabama Ave; Trulley St; Stuart St; Leek St; Susan Ann Ct; Attucks St; Reading; Chenevert St; Paige St; S Lockwood Dr; Pierce St; Francis; Sanders St; Beulah; Roberts St; Cougar Pl; Drew; Anita; Tuam; Division St; Nalle St; Cuney Dr; Palmer St; Rose Ct; Hamilton St; Milby; Elgin Ct; Sheppard Rd; Calhoun-Pease; Rugley St; Callie; Webster; Mc Ilhenny; Chaco St; Gray Ct; Alabama; Naplava St; Sauer Aly; Jones Ct; Lockwood Dr; Overton Ct; Adair; Live Oak Ct; Simmons Ct; University Oaks Blvd; Blodgett St; Francis Ct.
Railroad features: at and Sf Rlwy; Houston Belt and Terminal Rlwy; Southern Pacific RR.
Other features: Brays Byu.
Third Ward neighborhood detailed profile
Trinity neighborhood in Houston statistics: (Find on map)
Area: 6.854 square miles
Population: 22,478
Population density:
Median household income in 2021:
Median rent in in 2021:
Male vs Females
Median age
Housing prices:
Average estimated value of detached houses in 2021 (81.2% of all units):
Average estimated value of mobile home in 2021 (4.7% of all units):
Most popular occupations of males: construction, extraction, and maintenance occupations (20.2%); service occupations (15.8%); transportation occupations (12.5%); production occupations (11.7%); material moving occupations (11.3%); sales and office occupations (8.5%); management occupations (except farmers) (5.7%)
Most popular occupations of females: sales and office occupations (39.6%); service occupations (34.8%); education, training, and library occupations (4.8%); community and social services occupations (3.5%); healthcare practitioners and technical occupations (3.3%); management occupations (except farmers) (2.8%); transportation occupations (2.2%)
Limited-access highways (interstate or state) in this neighborhood: I- 610 (N Loop Fwy).
Roads and streets: Homestead Rd; Lockwood Dr; Laura Koppe Rd; Darien St; Hirsch Rd; Bennington St; Shreveport Blvd; Kelley St; Lavender St; Peachtree St; Elbert St; Weaver Rd; Sandra St; Firnat St; Kirkpatrick Blvd; Shotwell St; Hoffman St; Wileyvale Rd; Denmark Rd (Denmark St); Caplin St; Banyan St; Apache St; Finch St; Jay St; Carothers St; Sayers St; W Knoll St; S Hall St; Woodwick St; Ley Rd; Orville St; Bonita St; Bywood St; Touchstone St; Weyburn St; E Crosstimbers St; Spaulding St; Bertwood St; Allwood St; Westcott St; Springdale St; Los Angeles St; Glass St; Shady Dr; Camway St; Drey St; Sundown Dr; Lanewood Dr (Lanewood St); Kittridge St; Baton Rouge St; Glen Manor Dr; Tronewood St; Saint Louis St (St Louis St); Cruse Rd; Boicewood St; Miley St; Fitch St; Westcott Rd; Camay Dr; Earline St; Fawnridge Dr; Ireland St; Compton St; Momus; Ernie Rd; Howton St; Lynnfield St; Peyton St; Landor St; Dandy St; Hanna; Plaag St; Crofton St; Pointer St; Autumn Ln; Melbourne St; Linder St; King St; Sparta; Tampico St; Reid St; Fowlie; Heatherside St; Larkstone St; Creston Dr; Tuscon St; Corto St; Carey St; Wayne St; Kashmere St; June St; Wipprecht St; E Toliver St; Grady St; Philibert Ln; Tipton St; Keeland St; Vance St; Sherbourne St; Lavender; Jones St; Dorchester St; Lumber Ln; Vaughn St; Kelburn Dr; Knoxwood St; Sadler St; Lundy Rd; Bostic St; Pembrook St; Honus St; Clarington St; Roanoke St; Delavan Dr; Lawnridge St; Bellingham Dr; Ernie; Teesdale Dr; Yorkshire St; Glass Cir; Pickfair St; Maldon Ct; Leighton St; Comus St; True Ln; S Finch Cir; Wayne; Mariosa St; Malesa St; N Finch Cir; Leben St; Ralston St; Karnauch Dr; Levering Ln; Hanes Rd; Homestead Ct; Creston St; Sandradale St; Milliken St; Fountaine St; Senegal St; Glass Ct; Keeland; Radcliffe St; Senna St; Winship St; Parkhurst Dr; Los Angeles; Jay; Winship; Tuscon; Spaulding.
Railroad features: Houston Belt and Terminal Rlwy; Southern Pacific RR; Union Pacific RR.
Other features: Hunting Byu.
Trinity neighborhood detailed profile
Area: 6.854 square miles
Population: 22,478
Population density:
| Trinity (Houston Gardens): | 3,279 people per square mile |
| Houston: | 3,947 people per square mile |
Median household income in 2021:
| Trinity (Houston Gardens): | $38,246 |
| Houston: | $55,499 |
Median rent in in 2021:
| Trinity (Houston Gardens): | $799 |
| Houston: | $974 |
Male vs Females
| Males: | 10,922 |
| Females: | 11,556 |
Median age
| Males: | 36.8 years |
| Females: | 38.0 years |
Housing prices:
Average estimated value of detached houses in 2021 (81.2% of all units):
| Trinity (Houston Gardens): | $105,705 |
| Houston: | $304,685 |
Average estimated value of mobile home in 2021 (4.7% of all units):
| Trinity (Houston Gardens): | $80,588 |
| Houston: | $60,006 |
Most popular occupations of males: construction, extraction, and maintenance occupations (20.2%); service occupations (15.8%); transportation occupations (12.5%); production occupations (11.7%); material moving occupations (11.3%); sales and office occupations (8.5%); management occupations (except farmers) (5.7%)
Most popular occupations of females: sales and office occupations (39.6%); service occupations (34.8%); education, training, and library occupations (4.8%); community and social services occupations (3.5%); healthcare practitioners and technical occupations (3.3%); management occupations (except farmers) (2.8%); transportation occupations (2.2%)
Limited-access highways (interstate or state) in this neighborhood: I- 610 (N Loop Fwy).
Roads and streets: Homestead Rd; Lockwood Dr; Laura Koppe Rd; Darien St; Hirsch Rd; Bennington St; Shreveport Blvd; Kelley St; Lavender St; Peachtree St; Elbert St; Weaver Rd; Sandra St; Firnat St; Kirkpatrick Blvd; Shotwell St; Hoffman St; Wileyvale Rd; Denmark Rd (Denmark St); Caplin St; Banyan St; Apache St; Finch St; Jay St; Carothers St; Sayers St; W Knoll St; S Hall St; Woodwick St; Ley Rd; Orville St; Bonita St; Bywood St; Touchstone St; Weyburn St; E Crosstimbers St; Spaulding St; Bertwood St; Allwood St; Westcott St; Springdale St; Los Angeles St; Glass St; Shady Dr; Camway St; Drey St; Sundown Dr; Lanewood Dr (Lanewood St); Kittridge St; Baton Rouge St; Glen Manor Dr; Tronewood St; Saint Louis St (St Louis St); Cruse Rd; Boicewood St; Miley St; Fitch St; Westcott Rd; Camay Dr; Earline St; Fawnridge Dr; Ireland St; Compton St; Momus; Ernie Rd; Howton St; Lynnfield St; Peyton St; Landor St; Dandy St; Hanna; Plaag St; Crofton St; Pointer St; Autumn Ln; Melbourne St; Linder St; King St; Sparta; Tampico St; Reid St; Fowlie; Heatherside St; Larkstone St; Creston Dr; Tuscon St; Corto St; Carey St; Wayne St; Kashmere St; June St; Wipprecht St; E Toliver St; Grady St; Philibert Ln; Tipton St; Keeland St; Vance St; Sherbourne St; Lavender; Jones St; Dorchester St; Lumber Ln; Vaughn St; Kelburn Dr; Knoxwood St; Sadler St; Lundy Rd; Bostic St; Pembrook St; Honus St; Clarington St; Roanoke St; Delavan Dr; Lawnridge St; Bellingham Dr; Ernie; Teesdale Dr; Yorkshire St; Glass Cir; Pickfair St; Maldon Ct; Leighton St; Comus St; True Ln; S Finch Cir; Wayne; Mariosa St; Malesa St; N Finch Cir; Leben St; Ralston St; Karnauch Dr; Levering Ln; Hanes Rd; Homestead Ct; Creston St; Sandradale St; Milliken St; Fountaine St; Senegal St; Glass Ct; Keeland; Radcliffe St; Senna St; Winship St; Parkhurst Dr; Los Angeles; Jay; Winship; Tuscon; Spaulding.
Railroad features: Houston Belt and Terminal Rlwy; Southern Pacific RR; Union Pacific RR.
Other features: Hunting Byu.
Trinity neighborhood detailed profile
University Place neighborhood in Houston statistics: (Find on map)
Area: 2.700 square miles
Population: 18,360
Population density:
Median household income in 2021:
Median rent in in 2021:
Male vs Females
Median age
Housing prices:
Average estimated value of detached houses in 2021 (51.5% of all units):
Average estimated value of townhouses or other attached units in 2021 (12.7% of all units):
Most popular occupations of males: management occupations (except farmers) (22.5%); business and financial operations occupations (18.9%); healthcare practitioners and technical occupations (14.9%); architecture and engineering occupations (8.7%); education, training, and library occupations (7.4%); sales and office occupations (6.9%); computer and mathematical occupations (5.3%)
Most popular occupations of females: management occupations (except farmers) (29.3%); education, training, and library occupations (19.9%); sales and office occupations (12.5%); healthcare practitioners and technical occupations (9.9%); arts, design, entertainment, sports, and media occupations (6.0%); computer and mathematical occupations (4.7%); legal occupations (4.4%)
Roads and streets: Greenbriar St; Morningside Dr; Bissonnet St; Sunset Blvd; Milford St; North Blvd; Banks St; South Blvd; Rice Blvd; Bolsover St; Albans Rd; University Blvd; Dunstan Rd; Wroxton Rd; Vassar St; Dryden Rd; S Shepherd Dr; Kelvin Dr; S Main St (Main St); Bartlett St; Swift Blvd; Montclair Dr; Southgate Blvd; Hazard St; Quenby St; Addison Rd; Goldsmith St; Sheridan St; Travis St; W Holcombe Blvd; Tangley St; Wilton St; Montrose Blvd; Mandell St; Mc Clendon St; Robinhood St; Mount Vernon St; Maroneal St; Yoakum Blvd; Bellefontaine St; Watts Rd (Watts St); Dorrington St; Kent St; Macarthur Dr (Macarthur St); Kelving St; McClendon St; Bluebonnet Blvd; Shakespeare St; Remington Ln; Stockton; Ashby St; Graustark St; Barkdull St; Woodhead St; Dunlavy St; Berthea St; Bayard Ln; Cherokee St; Chelsea Blvd; Autrey St; Glen Haven Blvd; Northhampton Pl; Shadow Lawn St; Roseland St; Underwood St; Dora St; Parkway Dr; Portland St; Whitley St; N Braeswood Blvd; Lanier Dr; Chaucer Dr; Gramercy St; Wordsworth St; Longfellow Ln; Bellgreen Dr; Milam St; Shamrock Dr; Pinedale St; Institute Ln; Wroxton Ct; Nottingham St; Amherst St; Oakdale St; Times Blvd; Rosedale St; N Blvd Park; School St; Louisiana St; Waverly Ct; Braeswood Ct; West Blvd; W 11th St; Mellon St; Bowden St; Wentworth St; Southhampton Ests; Stockton Dr.
Railroad features: Southern Pacific RR.
Other features: Brays Byu.
University Place neighborhood detailed profile
Area: 2.700 square miles
Population: 18,360
Population density:
| University Place (South Grove): | 6,800 people per square mile |
| Houston: | 3,947 people per square mile |
Median household income in 2021:
| University Place (South Grove): | $227,220 |
| Houston: | $55,499 |
Median rent in in 2021:
| University Place (South Grove): | $1,699 |
| Houston: | $974 |
Male vs Females
| Males: | 9,197 |
| Females: | 9,163 |
Median age
| Males: | 47.4 years |
| Females: | 42.8 years |
Housing prices:
Average estimated value of detached houses in 2021 (51.5% of all units):
| University Place (South Grove): | $1,202,315 |
| Houston: | $304,685 |
Average estimated value of townhouses or other attached units in 2021 (12.7% of all units):
| This neighborhood: | $418,246 |
| city: | $305,463 |
Most popular occupations of males: management occupations (except farmers) (22.5%); business and financial operations occupations (18.9%); healthcare practitioners and technical occupations (14.9%); architecture and engineering occupations (8.7%); education, training, and library occupations (7.4%); sales and office occupations (6.9%); computer and mathematical occupations (5.3%)
Most popular occupations of females: management occupations (except farmers) (29.3%); education, training, and library occupations (19.9%); sales and office occupations (12.5%); healthcare practitioners and technical occupations (9.9%); arts, design, entertainment, sports, and media occupations (6.0%); computer and mathematical occupations (4.7%); legal occupations (4.4%)
Roads and streets: Greenbriar St; Morningside Dr; Bissonnet St; Sunset Blvd; Milford St; North Blvd; Banks St; South Blvd; Rice Blvd; Bolsover St; Albans Rd; University Blvd; Dunstan Rd; Wroxton Rd; Vassar St; Dryden Rd; S Shepherd Dr; Kelvin Dr; S Main St (Main St); Bartlett St; Swift Blvd; Montclair Dr; Southgate Blvd; Hazard St; Quenby St; Addison Rd; Goldsmith St; Sheridan St; Travis St; W Holcombe Blvd; Tangley St; Wilton St; Montrose Blvd; Mandell St; Mc Clendon St; Robinhood St; Mount Vernon St; Maroneal St; Yoakum Blvd; Bellefontaine St; Watts Rd (Watts St); Dorrington St; Kent St; Macarthur Dr (Macarthur St); Kelving St; McClendon St; Bluebonnet Blvd; Shakespeare St; Remington Ln; Stockton; Ashby St; Graustark St; Barkdull St; Woodhead St; Dunlavy St; Berthea St; Bayard Ln; Cherokee St; Chelsea Blvd; Autrey St; Glen Haven Blvd; Northhampton Pl; Shadow Lawn St; Roseland St; Underwood St; Dora St; Parkway Dr; Portland St; Whitley St; N Braeswood Blvd; Lanier Dr; Chaucer Dr; Gramercy St; Wordsworth St; Longfellow Ln; Bellgreen Dr; Milam St; Shamrock Dr; Pinedale St; Institute Ln; Wroxton Ct; Nottingham St; Amherst St; Oakdale St; Times Blvd; Rosedale St; N Blvd Park; School St; Louisiana St; Waverly Ct; Braeswood Ct; West Blvd; W 11th St; Mellon St; Bowden St; Wentworth St; Southhampton Ests; Stockton Dr.
Railroad features: Southern Pacific RR.
Other features: Brays Byu.
University Place neighborhood detailed profile
Upper Kirby neighborhood in Houston statistics: (Find on map)
Area: 3.130 square miles
Population: 6,794
Population density:
Median household income in 2021:
Median rent in in 2021:
Male vs Females
Median age
Housing prices:
Average estimated value of detached houses in 2021 (19.7% of all units):
Average estimated value of townhouses or other attached units in 2021 (10.9% of all units):
Average estimated '21 value of housing units in 5-or-more-unit structures (31.7% of all units):
Most popular occupations of males: sales and office occupations (36.9%); management occupations (except farmers) (14.2%); business and financial operations occupations (12.4%); architecture and engineering occupations (10.8%); computer and mathematical occupations (7.4%); construction, extraction, and maintenance occupations (5.1%); production occupations (3.4%)
Most popular occupations of females: sales and office occupations (39.5%); management occupations (except farmers) (13.4%); education, training, and library occupations (9.8%); healthcare practitioners and technical occupations (9.8%); business and financial operations occupations (8.0%); production occupations (7.7%); service occupations (7.0%)
Highways in this neighborhood: US Hwy 59 (Southwest Fwy); 59-Hov (US Hwy 59).
Roads and streets: Westpark Dr; W Alabama St; Richmond Ave; Norfolk St; Portsmouth St; W Main St; Colquitt St; Weslayan St; Purdue St; Edloe St; Kirby Dr; Buffalo Speedway; Branard St; Westheimer Rd; Drake St; Childress St; Sul Ross St; Kipling St; S Shepherd Dr; Eastside St; Bissonnet St; Drexel Dr; Greenbriar St; Newcastle Dr (Newcastle St); Virginia St; Cummins St; Timmons Ln; Mercer St; Las Palmas St (Las Palmas Dr); Wakeforest St; Ferndale St; Suffolk Dr; Revere St; Audley St; Greenway Plaza Dr; Sackett St; Bammel Ln; Pin Oak Park; Westerman St; Essex Ln; Lake St; Argonne St; Mc Duffie St; Steele St; Cameron St; Law St; Harold St; Markham St; Whitman St; Rosamond St; Wild Indigo; Morningside Dr; Alabama Ct; Auden St; Belmont; Lp Central Dr; Academy St; Richton St; Lexington St; Pin Oak Pl; Dincans St; Westgate Dr (Westgate St); Abercrombe Pl; Marquart St; South Blvd; Arena Dr; Farnham St; S Sandman St; Marshall St; Chatham Ln; Huldy St; Betsy Ln; Elbert St; North Blvd; Plaza Dr; Danville; Cummins Green; la Salle St; Syracuse St; Essex Green St; City Club Dr; Community Dr; Fairmont St; Joanel St; Saint St; Park; Westchester St; Essex Ter; Newcastle St; Edloe-Driveway; Saint Pl; E Greenway Plz; Algerian Way; Lomitas St; Harper; Philfall St; Earl St; County Cress Rd; ; Navajo; Audley; Mc Duffie; Orleans; Belmont St.
Railroad features: Southern Pacific RR.
Upper Kirby neighborhood detailed profile
Area: 3.130 square miles
Population: 6,794
Population density:
| Upper Kirby (Greenway): | 2,171 people per square mile |
| Houston: | 3,947 people per square mile |
Median household income in 2021:
| Upper Kirby (Greenway): | $179,163 |
| Houston: | $55,499 |
Median rent in in 2021:
| Upper Kirby (Greenway): | $1,159 |
| Houston: | $974 |
Male vs Females
| Males: | 3,153 |
| Females: | 3,640 |
Median age
| Males: | 43.8 years |
| Females: | 42.9 years |
Housing prices:
Average estimated value of detached houses in 2021 (19.7% of all units):
| Upper Kirby (Greenway): | $1,090,137 |
| Houston: | $304,685 |
Average estimated value of townhouses or other attached units in 2021 (10.9% of all units):
| This neighborhood: | $716,066 |
| city: | $305,463 |
Average estimated '21 value of housing units in 5-or-more-unit structures (31.7% of all units):
| Upper Kirby (Greenway): | $650,530 |
| Houston: | $227,414 |
Most popular occupations of males: sales and office occupations (36.9%); management occupations (except farmers) (14.2%); business and financial operations occupations (12.4%); architecture and engineering occupations (10.8%); computer and mathematical occupations (7.4%); construction, extraction, and maintenance occupations (5.1%); production occupations (3.4%)
Most popular occupations of females: sales and office occupations (39.5%); management occupations (except farmers) (13.4%); education, training, and library occupations (9.8%); healthcare practitioners and technical occupations (9.8%); business and financial operations occupations (8.0%); production occupations (7.7%); service occupations (7.0%)
Highways in this neighborhood: US Hwy 59 (Southwest Fwy); 59-Hov (US Hwy 59).
Roads and streets: Westpark Dr; W Alabama St; Richmond Ave; Norfolk St; Portsmouth St; W Main St; Colquitt St; Weslayan St; Purdue St; Edloe St; Kirby Dr; Buffalo Speedway; Branard St; Westheimer Rd; Drake St; Childress St; Sul Ross St; Kipling St; S Shepherd Dr; Eastside St; Bissonnet St; Drexel Dr; Greenbriar St; Newcastle Dr (Newcastle St); Virginia St; Cummins St; Timmons Ln; Mercer St; Las Palmas St (Las Palmas Dr); Wakeforest St; Ferndale St; Suffolk Dr; Revere St; Audley St; Greenway Plaza Dr; Sackett St; Bammel Ln; Pin Oak Park; Westerman St; Essex Ln; Lake St; Argonne St; Mc Duffie St; Steele St; Cameron St; Law St; Harold St; Markham St; Whitman St; Rosamond St; Wild Indigo; Morningside Dr; Alabama Ct; Auden St; Belmont; Lp Central Dr; Academy St; Richton St; Lexington St; Pin Oak Pl; Dincans St; Westgate Dr (Westgate St); Abercrombe Pl; Marquart St; South Blvd; Arena Dr; Farnham St; S Sandman St; Marshall St; Chatham Ln; Huldy St; Betsy Ln; Elbert St; North Blvd; Plaza Dr; Danville; Cummins Green; la Salle St; Syracuse St; Essex Green St; City Club Dr; Community Dr; Fairmont St; Joanel St; Saint St; Park; Westchester St; Essex Ter; Newcastle St; Edloe-Driveway; Saint Pl; E Greenway Plz; Algerian Way; Lomitas St; Harper; Philfall St; Earl St; County Cress Rd; ; Navajo; Audley; Mc Duffie; Orleans; Belmont St.
Railroad features: Southern Pacific RR.
Upper Kirby neighborhood detailed profile
Uptown neighborhood in Houston statistics: (Find on map)
Area: 8.281 square miles
Population: 26,809
Population density:
Median household income in 2021:
Median rent in in 2021:
Male vs Females
Median age
Housing prices:
Average estimated value of detached houses in 2021 (45.6% of all units):
Average estimated value of townhouses or other attached units in 2021 (7.1% of all units):
Average estimated '21 value of housing units in 3-to-4-unit structures (19.9% of all units):
Average estimated '21 value of housing units in 5-or-more-unit structures (23.8% of all units):
Most popular occupations of males: management occupations (except farmers) (26.9%); sales and office occupations (17.2%); business and financial operations occupations (12.9%); legal occupations (6.3%); computer and mathematical occupations (4.7%); healthcare practitioners and technical occupations (4.4%); material moving occupations (4.0%)
Most popular occupations of females: sales and office occupations (30.5%); business and financial operations occupations (12.3%); healthcare practitioners and technical occupations (10.6%); education, training, and library occupations (10.5%); service occupations (10.3%); management occupations (except farmers) (8.8%); legal occupations (5.6%)
Limited-access highways (interstate or state) in this neighborhood: I- 610 (W Loop Fwy); I- 10 (10-Hov Fwy).
Highways in this neighborhood: Southwest Fwy (US Hwy 59); US Hwy 59 (59-Hov).
Roads and streets: Memorial Dr; FM 1093 (Westheimer Rd); Woodway Dr; San Felipe St (San Felipe Rd); Chimney Rock Rd; Sage Rd; Bering Dr; Sugar Hill Dr; Post Oak Blvd; Potomac Dr; Doliver Dr; Briar Ridge Dr; Augusta Dr; del Monte Dr; Winrock Blvd; Fountain View Dr; Yorktown St; S Voss Rd; Nantucket Dr; Longmont Dr; Cedar Creek Dr; N Post Oak Rd (Post Oak Rd); S Post Oak Ln; Chevy Chase Dr; Inwood Dr; Burgoyne Rd; Lynbrook Dr; Willers Way; Hidalgo St; Briargrove Dr; Bayou Glen Rd; Holly Springs Dr; Post Oak Ln (N Post Oak Ln); W Alabama; Tanglewood Rd; Briarmead Dr; Stable Crest Blvd; Piping Rock Ln; Valley Forge Dr; Crab Orchard Rd; S Rice Ave; Meadowlake Ln; Chatsworth Dr; Bordley Dr; Richmond Ave; Riverview Way; Shady River Dr; Briar Dr; Ella Lee Ln; Olympia Dr; Pine Shadows Dr; Saddlebrook Ln; E Friar Tuck Ln; Rocky River Rd; Tilbury Dr; Green Tree Rd; W Friar Tuck Ln; Pine Forest Rd; Val Verde St; Mc Culloch Cir; Little John Ln; Shadywood Rd; Fieldwood Dr; Buckingham Dr; Sandringham Dr; Westminster Dr; Pinehaven Dr; Longwoods Ln; Navarro St; Briar Rose Dr; Woodhollow Dr; Candlewood Dr; Clearbrook Ln; Tupper Lake Dr; Sherbrooke Rd; Mc Cue Rd; Carnarvon Dr; E Broad Oaks Dr; Wickford Dr; Deerwood Rd; Sturbridge Dr; Fayette St; Stablewood Blvd; Overbrook Ln; Brown Saddle St (Brown Saddle Rd); Wickersham Ln; Maple Valley Rd; Pagewood Ln; Cresent Gate Ln; Wirt Rd; Uptown Park Blvd; Park Laureate Dr; Yorktown Dr; McCue Rd; S Ripple Creek Dr; Windswept Ln; Post Oak Timber Dr; Hollyhurst Ln; Fall River Rd; International Blvd; Kenilworth St (Kenilworth Dr); Locke Ln; Pine Hollow Ln; Saint James Pl; Antoine Dr; N Wynden Dr; Fairdale Ln; Tangle Ln; Riverway Dr; S Wynden Dr; Stones Throw Rd; Memorial Woods Dr; Huckleberry Cir; Ambassodor Way; Indian Trl; Stable Ln; Cranbrook Rd; Holly Terrace Dr; Saddletree; Brownway St; Old Lake Rd; Longbow Ln; Green Tree Dr (Green Tree Rd); Highgrove Park; Westheimer Ct; Pasture View Ln; Lampasas St; Transco One Dr; Beverlyhill St; Briarhurst Dr; W Broad Oaks Dr; Guilford Ct; Bayou Timber Ln; Bering Cir; Four Oaks Pl; Marilee Ln; Hallmark Dr; Kleberg; Terwilliger Dr (Terwilliger Way); Huckleberry Ln; Schumacher Ln; Park Trl; Silber Rd; Winston Woods Dr; Indian Cir; Judalon Ln; Herman St; Lynn Ln; Inwood Park Ct; John Dreaper Dr; Farther Point St; Tecumseh Ln; Pinewold Dr; York Town Pl; Bayou Glen St; Transco Three Dr; N West Oak Dr; Terwilliger Way; Kingsbrook Rd; Holy Rood Ln; Post Oak Cir; Wynden Oaks Dr; Wild Valley Rd; Briar Town Ln; Memorial Woods Cir; Westbriar Ln; Garrettson Ln; Glynn Way Dr; S West Oak Dr; la Fonte St; Griscom Ln; Harness Creek Ln; Timber Terrace Rd; Lander Ln; Indian Bayou; Ambassador Way; W Oak Dr; Mc Cue St; Chesapeake Way; Bolton Pl; Exbury Way; Stablewood Ct; Westheimer Way; Pine Forest Cir; N Post Oak Ln; Sky Lark Ln; Farish Cir; S Post Oak Rd; Longmont Ln; Trianon St; Park Creek Dr; Tanglewood Park St; Russett Dr; Augusta Ct; Limerick Ln; Sagesquare St; Stoney Point St; Cleghorn Ln; Longwood Ct; Riverway; Shady Hollow; Transco Four Dr; Oakford Ct; Candlewood Ln; Loop Fwy; Pine Briar Cir; Briar Trl; Pinewold Cir; E Broad Oaks Ln; Staples Way; Westpark Dr; Jamestown Mall St (Jamestown Mall); Woodway Place Ct; Barrington Rd; Sauve Ln; Champlain Bend St; Fountain Bleu St; Longwoods Dr; Stamper Way; Oakford Dr; Townplace; Stable Crest Ct; Ilfrey Ln; Fontainbleu; Woodway Oaks Ln; N Wynden Estates Ct; Town Place St; Broad Oaks Cir; Wynden Oaks Garden Dr; Tecumseh Cir; Buffalo Ridge Cir; Sagecircle E; Sagecircle W; Ripple Creek; Houstonian; Fall River Ct; Sagecircle S; Stonewalk Dr; Sagecircle N; Tarrytown Mall St (Tarrytown Mall); Tanglecircle Ln; Canongate Dr; Spring Park St; Nantucket Woods Ln (Nantucketwood Ln); Ector; Broad Oaks Park; Wynden Oak Ct; Spring Hollow; Huntley Dr; Arborway St; Watertown Mall St (Watertown Mall); Post Oak Hill; Spring Hollow St; Indian Bluff; W Oak Mews; Ripple Creek Dr; Pinewold Ct; Wynden Place Ln; Wynden Crescent Ct; Broad Oaks Trl; Pineland Dr; Broad Oaks Ct; Saddlebranch Ct; Lodge Hollow Ct; Quebec Blvd; Homewood Row Ln; Upperway Ln; Gable Lodge Ct; Crescent Gate Ct.
Other features: Buffalo Byu.
Other features: Bering Ditch.
Other features: Spring Branch Byu; Newman Br; Briar Branch Byu.
Uptown neighborhood detailed profile
Area: 8.281 square miles
Population: 26,809
Population density:
| Uptown (Galleria): | 3,237 people per square mile |
| Houston: | 3,947 people per square mile |
Median household income in 2021:
| Uptown (Galleria): | $155,983 |
| Houston: | $55,499 |
Median rent in in 2021:
| Uptown (Galleria): | $1,298 |
| Houston: | $974 |
Male vs Females
| Males: | 11,287 |
| Females: | 15,522 |
Median age
| Males: | 46.4 years |
| Females: | 43.5 years |
Housing prices:
Average estimated value of detached houses in 2021 (45.6% of all units):
| Uptown (Galleria): | $2,005,957 |
| Houston: | $304,685 |
Average estimated value of townhouses or other attached units in 2021 (7.1% of all units):
| This neighborhood: | $478,671 |
| city: | $305,463 |
Average estimated '21 value of housing units in 3-to-4-unit structures (19.9% of all units):
| Uptown (Galleria): | $143,101 |
| city: | $184,874 |
Average estimated '21 value of housing units in 5-or-more-unit structures (23.8% of all units):
| Uptown (Galleria): | $169,382 |
| Houston: | $227,414 |
Most popular occupations of males: management occupations (except farmers) (26.9%); sales and office occupations (17.2%); business and financial operations occupations (12.9%); legal occupations (6.3%); computer and mathematical occupations (4.7%); healthcare practitioners and technical occupations (4.4%); material moving occupations (4.0%)
Most popular occupations of females: sales and office occupations (30.5%); business and financial operations occupations (12.3%); healthcare practitioners and technical occupations (10.6%); education, training, and library occupations (10.5%); service occupations (10.3%); management occupations (except farmers) (8.8%); legal occupations (5.6%)
Limited-access highways (interstate or state) in this neighborhood: I- 610 (W Loop Fwy); I- 10 (10-Hov Fwy).
Highways in this neighborhood: Southwest Fwy (US Hwy 59); US Hwy 59 (59-Hov).
Roads and streets: Memorial Dr; FM 1093 (Westheimer Rd); Woodway Dr; San Felipe St (San Felipe Rd); Chimney Rock Rd; Sage Rd; Bering Dr; Sugar Hill Dr; Post Oak Blvd; Potomac Dr; Doliver Dr; Briar Ridge Dr; Augusta Dr; del Monte Dr; Winrock Blvd; Fountain View Dr; Yorktown St; S Voss Rd; Nantucket Dr; Longmont Dr; Cedar Creek Dr; N Post Oak Rd (Post Oak Rd); S Post Oak Ln; Chevy Chase Dr; Inwood Dr; Burgoyne Rd; Lynbrook Dr; Willers Way; Hidalgo St; Briargrove Dr; Bayou Glen Rd; Holly Springs Dr; Post Oak Ln (N Post Oak Ln); W Alabama; Tanglewood Rd; Briarmead Dr; Stable Crest Blvd; Piping Rock Ln; Valley Forge Dr; Crab Orchard Rd; S Rice Ave; Meadowlake Ln; Chatsworth Dr; Bordley Dr; Richmond Ave; Riverview Way; Shady River Dr; Briar Dr; Ella Lee Ln; Olympia Dr; Pine Shadows Dr; Saddlebrook Ln; E Friar Tuck Ln; Rocky River Rd; Tilbury Dr; Green Tree Rd; W Friar Tuck Ln; Pine Forest Rd; Val Verde St; Mc Culloch Cir; Little John Ln; Shadywood Rd; Fieldwood Dr; Buckingham Dr; Sandringham Dr; Westminster Dr; Pinehaven Dr; Longwoods Ln; Navarro St; Briar Rose Dr; Woodhollow Dr; Candlewood Dr; Clearbrook Ln; Tupper Lake Dr; Sherbrooke Rd; Mc Cue Rd; Carnarvon Dr; E Broad Oaks Dr; Wickford Dr; Deerwood Rd; Sturbridge Dr; Fayette St; Stablewood Blvd; Overbrook Ln; Brown Saddle St (Brown Saddle Rd); Wickersham Ln; Maple Valley Rd; Pagewood Ln; Cresent Gate Ln; Wirt Rd; Uptown Park Blvd; Park Laureate Dr; Yorktown Dr; McCue Rd; S Ripple Creek Dr; Windswept Ln; Post Oak Timber Dr; Hollyhurst Ln; Fall River Rd; International Blvd; Kenilworth St (Kenilworth Dr); Locke Ln; Pine Hollow Ln; Saint James Pl; Antoine Dr; N Wynden Dr; Fairdale Ln; Tangle Ln; Riverway Dr; S Wynden Dr; Stones Throw Rd; Memorial Woods Dr; Huckleberry Cir; Ambassodor Way; Indian Trl; Stable Ln; Cranbrook Rd; Holly Terrace Dr; Saddletree; Brownway St; Old Lake Rd; Longbow Ln; Green Tree Dr (Green Tree Rd); Highgrove Park; Westheimer Ct; Pasture View Ln; Lampasas St; Transco One Dr; Beverlyhill St; Briarhurst Dr; W Broad Oaks Dr; Guilford Ct; Bayou Timber Ln; Bering Cir; Four Oaks Pl; Marilee Ln; Hallmark Dr; Kleberg; Terwilliger Dr (Terwilliger Way); Huckleberry Ln; Schumacher Ln; Park Trl; Silber Rd; Winston Woods Dr; Indian Cir; Judalon Ln; Herman St; Lynn Ln; Inwood Park Ct; John Dreaper Dr; Farther Point St; Tecumseh Ln; Pinewold Dr; York Town Pl; Bayou Glen St; Transco Three Dr; N West Oak Dr; Terwilliger Way; Kingsbrook Rd; Holy Rood Ln; Post Oak Cir; Wynden Oaks Dr; Wild Valley Rd; Briar Town Ln; Memorial Woods Cir; Westbriar Ln; Garrettson Ln; Glynn Way Dr; S West Oak Dr; la Fonte St; Griscom Ln; Harness Creek Ln; Timber Terrace Rd; Lander Ln; Indian Bayou; Ambassador Way; W Oak Dr; Mc Cue St; Chesapeake Way; Bolton Pl; Exbury Way; Stablewood Ct; Westheimer Way; Pine Forest Cir; N Post Oak Ln; Sky Lark Ln; Farish Cir; S Post Oak Rd; Longmont Ln; Trianon St; Park Creek Dr; Tanglewood Park St; Russett Dr; Augusta Ct; Limerick Ln; Sagesquare St; Stoney Point St; Cleghorn Ln; Longwood Ct; Riverway; Shady Hollow; Transco Four Dr; Oakford Ct; Candlewood Ln; Loop Fwy; Pine Briar Cir; Briar Trl; Pinewold Cir; E Broad Oaks Ln; Staples Way; Westpark Dr; Jamestown Mall St (Jamestown Mall); Woodway Place Ct; Barrington Rd; Sauve Ln; Champlain Bend St; Fountain Bleu St; Longwoods Dr; Stamper Way; Oakford Dr; Townplace; Stable Crest Ct; Ilfrey Ln; Fontainbleu; Woodway Oaks Ln; N Wynden Estates Ct; Town Place St; Broad Oaks Cir; Wynden Oaks Garden Dr; Tecumseh Cir; Buffalo Ridge Cir; Sagecircle E; Sagecircle W; Ripple Creek; Houstonian; Fall River Ct; Sagecircle S; Stonewalk Dr; Sagecircle N; Tarrytown Mall St (Tarrytown Mall); Tanglecircle Ln; Canongate Dr; Spring Park St; Nantucket Woods Ln (Nantucketwood Ln); Ector; Broad Oaks Park; Wynden Oak Ct; Spring Hollow; Huntley Dr; Arborway St; Watertown Mall St (Watertown Mall); Post Oak Hill; Spring Hollow St; Indian Bluff; W Oak Mews; Ripple Creek Dr; Pinewold Ct; Wynden Place Ln; Wynden Crescent Ct; Broad Oaks Trl; Pineland Dr; Broad Oaks Ct; Saddlebranch Ct; Lodge Hollow Ct; Quebec Blvd; Homewood Row Ln; Upperway Ln; Gable Lodge Ct; Crescent Gate Ct.
Other features: Buffalo Byu.
Other features: Bering Ditch.
Other features: Spring Branch Byu; Newman Br; Briar Branch Byu.
Uptown neighborhood detailed profile
Virginia Court neighborhood in Houston statistics: (Find on map)
Area: 0.069 square miles
Population: 495
Population density:
Median household income in 2021:
Median rent in in 2021:
Male vs Females
Median age
Housing prices:
Average estimated value of detached houses in 2021 (85.8% of all units):
Average estimated value of townhouses or other attached units in 2021 (13.7% of all units):
Most popular occupations of males: healthcare practitioners and technical occupations (25.3%); management occupations (except farmers) (19.2%); architecture and engineering occupations (15.5%); legal occupations (12.2%); construction, extraction, and maintenance occupations (9.4%); service occupations (9.3%); sales and office occupations (8.2%)
Most popular occupations of females: management occupations (except farmers) (31.4%); healthcare practitioners and technical occupations (29.5%); education, training, and library occupations (21.3%); sales and office occupations (12.4%); legal occupations (5.3%); service occupations (4.8%); computer and mathematical occupations (4.1%)
Roads and streets: Amherst St; Village Pkwy (Kirby Dr); Rice Blvd; Lake St; Annapolis St; Fordham St; Charlotte St.
Virginia Court neighborhood detailed profile
Area: 0.069 square miles
Population: 495
Population density:
| Virginia Court: | 7,150 people per square mile |
| Houston: | 3,947 people per square mile |
Median household income in 2021:
| Virginia Court: | $214,294 |
| Houston: | $55,499 |
Median rent in in 2021:
| Virginia Court: | $2,153 |
| Houston: | $974 |
Male vs Females
| Males: | 248 |
| Females: | 246 |
Median age
| Males: | 41.5 years |
| Females: | 44.9 years |
Housing prices:
Average estimated value of detached houses in 2021 (85.8% of all units):
| Virginia Court: | $1,364,967 |
| Houston: | $304,685 |
Average estimated value of townhouses or other attached units in 2021 (13.7% of all units):
| This neighborhood: | $418,246 |
| city: | $305,463 |
Most popular occupations of males: healthcare practitioners and technical occupations (25.3%); management occupations (except farmers) (19.2%); architecture and engineering occupations (15.5%); legal occupations (12.2%); construction, extraction, and maintenance occupations (9.4%); service occupations (9.3%); sales and office occupations (8.2%)
Most popular occupations of females: management occupations (except farmers) (31.4%); healthcare practitioners and technical occupations (29.5%); education, training, and library occupations (21.3%); sales and office occupations (12.4%); legal occupations (5.3%); service occupations (4.8%); computer and mathematical occupations (4.1%)
Roads and streets: Amherst St; Village Pkwy (Kirby Dr); Rice Blvd; Lake St; Annapolis St; Fordham St; Charlotte St.
Virginia Court neighborhood detailed profile
Washington Ave. neighborhood in Houston statistics: (Find on map)
Area: 7.798 square miles
Population: 84,857
Population density:
Median household income in 2021:
Median rent in in 2021:
Male vs Females
Median age
Housing prices:
Average estimated value of detached houses in 2021 (45.7% of all units):
Average estimated value of townhouses or other attached units in 2021 (8.0% of all units):
Most popular occupations of males: management occupations (except farmers) (18.2%); business and financial operations occupations (14.4%); sales and office occupations (14.4%); architecture and engineering occupations (13.2%); computer and mathematical occupations (9.3%); construction, extraction, and maintenance occupations (6.0%); service occupations (5.5%)
Most popular occupations of females: sales and office occupations (29.1%); healthcare practitioners and technical occupations (20.9%); management occupations (except farmers) (13.0%); business and financial operations occupations (10.5%); education, training, and library occupations (6.4%); service occupations (4.8%); legal occupations (3.5%)
Limited-access highways (interstate or state) in this neighborhood: I- 10 (Katy Fwy, US Hwy 90); US Hwy 75 (I- 45, Gulf Fwy); I- 610 (W Loop Fwy).
Roads and streets: Memorial Dr; Washington Ave; Center St; Allen St; Westcott St; Blossom St; Feagan St; Rose St; Shepherd Dr; Schuler St; Summer St; Floyd St; Darling St; W Memorial Loop Dr; Gibson St; Lillian St; Kiam St; Crockett St; Memorial Loop Dr; Larkin St; Detering St; Sabine St; Houston Ave; Maxie St; Petty St; Reinerman St; Durham Dr; Kansas St; Edwards St; Cornish St; Roy St; Birdsall St; Sandman St; S Picnic Ln; Shearn St; Katy Rd; Dickson St; Studemont St; Knox St; Hempstead Rd; Spring St; Nolda St; Eigel St; Inker St; Malone St; Winter St; Silver St; Lubbock St; E Memorial Loop Dr; Sawyer St; Cohn St; White St; Crest Wood Dr; Patterson St; Asbury St; Parker St; Woodway Dr; T C Jester Blvd; Bingham St; Fowler St; Portwest Dr; Dart St; Colorado St; Arnot St; N Memorial Way; Goliad St; Nett St; Old Katy Rd; State St; Decatur St; Hemphill St; Eli St; Henderson St; Kane St; Johnson St; Hickory St; Taylor St; Waugh Dr; Terrace Dr; Haskell St; Koehler St; Katy Frwy Svc Rd; Reinecke St; Jackson Hill St; Spencer St; Hicks St; Thompson St; Heights Blvd; Taggart St; Bonner St; Yale St; Ovid St; Rodrigo St; Oliver St; Pickens St; Holly St; Snover St; Sherwin St; Scotland St; Weber St; Radcliffe St; E Cowan Dr; Harvard St; Barnes St; Lacy St; Alamo St; Utah St; S Heights Blvd; W Cowan Dr; Hamman St; W 11th St; Glenwood Dr; Stillman St; W 12th St; Durford Dr (Durford St); Elder St; Marina St; Union St; Roy Cir; Leverkuhn St; Wichman St; Venice St; Memorial Hts (Memorial Heights Dr); Prague St; Minola St; Patterson; Arabelle St; Lakin St; Lester St; Coppage St; Calder St; Court St; Trinity; Wagner St; Studer St; Mc Donald St; Willia St; Girard St; Moy St; O Reilly St; Bethje St; Preston St; Truro St; Clyde St; Tyne St; Asbury Ave (Asbury St); Givens St; Riesner St; Logan Ln; E 2nd St; Glen Cove St; Hartman St; Montrose Blvd; Langston St; Portway Dr; Crooms St; Henderson; Olive St; E Bend Ln; Comira; Byway St; Penner St; East; Beachton St; Garvin Ct; Augusta St; Chester St; Franklin St; Sellers Rd; Depelchin St; W Terrace Dr; National St; Camelia St; Wanita Pl; Artesian Pl; Chandler St; Brashear St; Sachs St; Dell St; Pennercrest St; Cortlandt St; Weens; Maud St; Martin Pl; Kessler St; Bayou Meadow Ln; E Terrace Dr; Butler St (Memorial Ct); Diesel; Morin Pl; Home St; Smith Dr; Bismark; Mellus St; Kelley St; Starkey St; Asbury Pl; Ware Ave; Raymond St; Waughford St; Bass Ct; Ash Pl; Maxroy St; Hohl St; Epstein Ct; Aloe St; Brown; Sawyer; Birdsall Market Pl; Lakin; S Gate Stone; Mc Millan; Herd; Honsinger St; Capitol St; Bass St; Montana St; Custus St; Ida Bell St; Barber St; High St; Arnold; Colorado Ct; Dewey St; Floyd; Wood Brg; W Sawyer St; Westcott; Abbott St; Kuhn; Bace Ct; Riesner.
Railroad features: Southern Pacific RR; Union Pacific RR.
Other features: Buffalo Byu; White Oak Byu.
Washington Ave. neighborhood detailed profile
Area: 7.798 square miles
Population: 84,857
Population density:
| Washington Ave.: | 10,882 people per square mile |
| Houston: | 3,947 people per square mile |
Median household income in 2021:
| Washington Ave.: | $123,851 |
| Houston: | $55,499 |
Median rent in in 2021:
| Washington Ave.: | $1,814 |
| Houston: | $974 |
Male vs Females
| Males: | 50,295 |
| Females: | 34,562 |
Median age
| Males: | 39.0 years |
| Females: | 35.8 years |
Housing prices:
Average estimated value of detached houses in 2021 (45.7% of all units):
| Washington Ave.: | $385,831 |
| Houston: | $304,685 |
Average estimated value of townhouses or other attached units in 2021 (8.0% of all units):
| This neighborhood: | $419,791 |
| city: | $305,463 |
Most popular occupations of males: management occupations (except farmers) (18.2%); business and financial operations occupations (14.4%); sales and office occupations (14.4%); architecture and engineering occupations (13.2%); computer and mathematical occupations (9.3%); construction, extraction, and maintenance occupations (6.0%); service occupations (5.5%)
Most popular occupations of females: sales and office occupations (29.1%); healthcare practitioners and technical occupations (20.9%); management occupations (except farmers) (13.0%); business and financial operations occupations (10.5%); education, training, and library occupations (6.4%); service occupations (4.8%); legal occupations (3.5%)
Limited-access highways (interstate or state) in this neighborhood: I- 10 (Katy Fwy, US Hwy 90); US Hwy 75 (I- 45, Gulf Fwy); I- 610 (W Loop Fwy).
Roads and streets: Memorial Dr; Washington Ave; Center St; Allen St; Westcott St; Blossom St; Feagan St; Rose St; Shepherd Dr; Schuler St; Summer St; Floyd St; Darling St; W Memorial Loop Dr; Gibson St; Lillian St; Kiam St; Crockett St; Memorial Loop Dr; Larkin St; Detering St; Sabine St; Houston Ave; Maxie St; Petty St; Reinerman St; Durham Dr; Kansas St; Edwards St; Cornish St; Roy St; Birdsall St; Sandman St; S Picnic Ln; Shearn St; Katy Rd; Dickson St; Studemont St; Knox St; Hempstead Rd; Spring St; Nolda St; Eigel St; Inker St; Malone St; Winter St; Silver St; Lubbock St; E Memorial Loop Dr; Sawyer St; Cohn St; White St; Crest Wood Dr; Patterson St; Asbury St; Parker St; Woodway Dr; T C Jester Blvd; Bingham St; Fowler St; Portwest Dr; Dart St; Colorado St; Arnot St; N Memorial Way; Goliad St; Nett St; Old Katy Rd; State St; Decatur St; Hemphill St; Eli St; Henderson St; Kane St; Johnson St; Hickory St; Taylor St; Waugh Dr; Terrace Dr; Haskell St; Koehler St; Katy Frwy Svc Rd; Reinecke St; Jackson Hill St; Spencer St; Hicks St; Thompson St; Heights Blvd; Taggart St; Bonner St; Yale St; Ovid St; Rodrigo St; Oliver St; Pickens St; Holly St; Snover St; Sherwin St; Scotland St; Weber St; Radcliffe St; E Cowan Dr; Harvard St; Barnes St; Lacy St; Alamo St; Utah St; S Heights Blvd; W Cowan Dr; Hamman St; W 11th St; Glenwood Dr; Stillman St; W 12th St; Durford Dr (Durford St); Elder St; Marina St; Union St; Roy Cir; Leverkuhn St; Wichman St; Venice St; Memorial Hts (Memorial Heights Dr); Prague St; Minola St; Patterson; Arabelle St; Lakin St; Lester St; Coppage St; Calder St; Court St; Trinity; Wagner St; Studer St; Mc Donald St; Willia St; Girard St; Moy St; O Reilly St; Bethje St; Preston St; Truro St; Clyde St; Tyne St; Asbury Ave (Asbury St); Givens St; Riesner St; Logan Ln; E 2nd St; Glen Cove St; Hartman St; Montrose Blvd; Langston St; Portway Dr; Crooms St; Henderson; Olive St; E Bend Ln; Comira; Byway St; Penner St; East; Beachton St; Garvin Ct; Augusta St; Chester St; Franklin St; Sellers Rd; Depelchin St; W Terrace Dr; National St; Camelia St; Wanita Pl; Artesian Pl; Chandler St; Brashear St; Sachs St; Dell St; Pennercrest St; Cortlandt St; Weens; Maud St; Martin Pl; Kessler St; Bayou Meadow Ln; E Terrace Dr; Butler St (Memorial Ct); Diesel; Morin Pl; Home St; Smith Dr; Bismark; Mellus St; Kelley St; Starkey St; Asbury Pl; Ware Ave; Raymond St; Waughford St; Bass Ct; Ash Pl; Maxroy St; Hohl St; Epstein Ct; Aloe St; Brown; Sawyer; Birdsall Market Pl; Lakin; S Gate Stone; Mc Millan; Herd; Honsinger St; Capitol St; Bass St; Montana St; Custus St; Ida Bell St; Barber St; High St; Arnold; Colorado Ct; Dewey St; Floyd; Wood Brg; W Sawyer St; Westcott; Abbott St; Kuhn; Bace Ct; Riesner.
Railroad features: Southern Pacific RR; Union Pacific RR.
Other features: Buffalo Byu; White Oak Byu.
Washington Ave. neighborhood detailed profile
Wayside neighborhood in Houston statistics: (Find on map)
Area: 2.990 square miles
Population: 14,289
Population density:
Median household income in 2021:
Median rent in in 2021:
Male vs Females
Median age
Average estimated value of detached houses in 2021 (57.3% of all units):
Most popular occupations of males: construction, extraction, and maintenance occupations (27.9%); production occupations (13.6%); management occupations (except farmers) (9.7%); sales and office occupations (9.1%); service occupations (7.5%); transportation occupations (6.6%); material moving occupations (5.7%)
Most popular occupations of females: service occupations (29.9%); sales and office occupations (28.1%); healthcare practitioners and technical occupations (8.2%); management occupations (except farmers) (6.3%); education, training, and library occupations (5.6%); production occupations (4.9%); business and financial operations occupations (4.3%)
Limited-access highways (interstate or state) in this neighborhood: Gulf Fwy (I- 45).
Highways in this neighborhood: US Hwy 90 Alt (S Wayside Dr).
Roads and streets: Lawndale St; Griggs Rd; S 75th St; Forest Hill Blvd; Satsuma St; Hackney St; Dismuke St; Rusk St; Pasadena St; Tipps St; Hughes St; Magnolia St; Sunnyland St; Polk St; Telephone Rd; N Mac Gregor Way; Jefferson St; Alta Vista St; Azalea St; Des Jardines St; Erath St; Eskridge St; Elm St; Fair Oaks Rd; Santa Rosa St; Idylwood Dr; Evergreen Dr; Dallas St; Santiago St; Villa de Matel Rd; Brookside Dr; Rainbow Dr; Sylvan Rd; Supply Row; Santa Maria St; Barremore St; Lawson St; Wildwood Way; Fairfield Dr (Fairfield St); Country Club Dr; Meadowlawn St; Redwood Ave (Redwood St); Esperanza St; Pinehurst Dr (Pinehurst St); Dorbrandt St; Walker St; Smallwood Ln; Newport St; S 66th St; Bonsrell St; Truett St; Mc Cormick St; Hillman St; Tellepsen St; Munger St; Park Ln; Merry Ln; Craig St; Capitol St; Maxwell Ln; Harriet St; Hatwell St; Kolfahl St; S 69th St; Coral St; S 72nd St; Baldinger St; Rockbridge Ln; Jean St; Lamar St; Bell St; Jamail Dr; Leeland St; S 67th St (S Cesar Chavez Blvd); Lindy Ln; S 74th St; Marlo St; Clay St; Jocelin St; Matamoras St; Miraglen St; Harwell Dr; Polk Ct; Mc Cormick; Mc Kinney St; Kemp St; Myrtle St; Hub St; Palo Alto St; Herbert St; Lawndale Plz; Swope; Kenmore St; Lansing St; Dwinnell St; Pease St; Manchester St; Sibley St; Telephone-Gulf Fwy; Rosebud St; S 77th St; S 76th St; Hughes; Benjamin; Magnolia; Craigmont St; S 65th St.
Railroad features: Union Pacific RR; Houston Belt and Terminal Rlwy; Southern Pacific RR.
Other features: Brays Byu; Country Club Byu.
Wayside neighborhood detailed profile
Area: 2.990 square miles
Population: 14,289
Population density:
| Wayside (Lawndale): | 4,779 people per square mile |
| Houston: | 3,947 people per square mile |
Median household income in 2021:
| Wayside (Lawndale): | $46,321 |
| Houston: | $55,499 |
Median rent in in 2021:
| Wayside (Lawndale): | $794 |
| Houston: | $974 |
Male vs Females
| Males: | 7,143 |
| Females: | 7,145 |
Median age
| Males: | 36.8 years |
| Females: | 35.5 years |
Average estimated value of detached houses in 2021 (57.3% of all units):
| Wayside (Lawndale): | $202,631 |
| Houston: | $304,685 |
Most popular occupations of males: construction, extraction, and maintenance occupations (27.9%); production occupations (13.6%); management occupations (except farmers) (9.7%); sales and office occupations (9.1%); service occupations (7.5%); transportation occupations (6.6%); material moving occupations (5.7%)
Most popular occupations of females: service occupations (29.9%); sales and office occupations (28.1%); healthcare practitioners and technical occupations (8.2%); management occupations (except farmers) (6.3%); education, training, and library occupations (5.6%); production occupations (4.9%); business and financial operations occupations (4.3%)
Limited-access highways (interstate or state) in this neighborhood: Gulf Fwy (I- 45).
Highways in this neighborhood: US Hwy 90 Alt (S Wayside Dr).
Roads and streets: Lawndale St; Griggs Rd; S 75th St; Forest Hill Blvd; Satsuma St; Hackney St; Dismuke St; Rusk St; Pasadena St; Tipps St; Hughes St; Magnolia St; Sunnyland St; Polk St; Telephone Rd; N Mac Gregor Way; Jefferson St; Alta Vista St; Azalea St; Des Jardines St; Erath St; Eskridge St; Elm St; Fair Oaks Rd; Santa Rosa St; Idylwood Dr; Evergreen Dr; Dallas St; Santiago St; Villa de Matel Rd; Brookside Dr; Rainbow Dr; Sylvan Rd; Supply Row; Santa Maria St; Barremore St; Lawson St; Wildwood Way; Fairfield Dr (Fairfield St); Country Club Dr; Meadowlawn St; Redwood Ave (Redwood St); Esperanza St; Pinehurst Dr (Pinehurst St); Dorbrandt St; Walker St; Smallwood Ln; Newport St; S 66th St; Bonsrell St; Truett St; Mc Cormick St; Hillman St; Tellepsen St; Munger St; Park Ln; Merry Ln; Craig St; Capitol St; Maxwell Ln; Harriet St; Hatwell St; Kolfahl St; S 69th St; Coral St; S 72nd St; Baldinger St; Rockbridge Ln; Jean St; Lamar St; Bell St; Jamail Dr; Leeland St; S 67th St (S Cesar Chavez Blvd); Lindy Ln; S 74th St; Marlo St; Clay St; Jocelin St; Matamoras St; Miraglen St; Harwell Dr; Polk Ct; Mc Cormick; Mc Kinney St; Kemp St; Myrtle St; Hub St; Palo Alto St; Herbert St; Lawndale Plz; Swope; Kenmore St; Lansing St; Dwinnell St; Pease St; Manchester St; Sibley St; Telephone-Gulf Fwy; Rosebud St; S 77th St; S 76th St; Hughes; Benjamin; Magnolia; Craigmont St; S 65th St.
Railroad features: Union Pacific RR; Houston Belt and Terminal Rlwy; Southern Pacific RR.
Other features: Brays Byu; Country Club Byu.
Wayside neighborhood detailed profile
West University Place neighborhood in Houston statistics: (Find on map)
Area: 2.152 square miles
Population: 18,884
Population density:
Median household income in 2021:
Median rent in in 2021:
Male vs Females
Median age
Housing prices:
Average estimated value of detached houses in 2021 (90.0% of all units):
Average estimated value of townhouses or other attached units in 2021 (8.6% of all units):
Average estimated '21 value of housing units in 5-or-more-unit structures (37.1% of all units):
Most popular occupations of males: management occupations (except farmers) (27.1%); healthcare practitioners and technical occupations (18.2%); sales and office occupations (10.5%); business and financial operations occupations (9.6%); legal occupations (9.0%); architecture and engineering occupations (6.6%); education, training, and library occupations (5.3%)
Most popular occupations of females: healthcare practitioners and technical occupations (20.3%); management occupations (except farmers) (15.5%); sales and office occupations (14.8%); business and financial operations occupations (12.3%); legal occupations (12.0%); education, training, and library occupations (8.1%); service occupations (5.5%)
Roads and streets: Rice Blvd; University Blvd; Amherst St; Bellaire Blvd; Sunset Blvd; Mercer St; Plumb St; Robinhood St; Nottingham St; Tangley St; Belmont St; Buffalo Speedway; Edloe St; Rutgers St; Sewanee St; Westchester St; Wakeforest St; Cason St; Kirby Dr; Auden St; Albans Rd; Georgetown St; Weslayan St; Pittsburg St; Annapolis St; Academy St; College St; W Point St; Wroxton Rd; Carnegie St; Duke St; Community Dr; Tennyson St; Milton St; Marquette St; Byron St; Swarthmore St; Villanova St; Arnold St; Southwestern St; Case St; Oberlin St; Brompton Rd (Brompton St); Vanderbilt St; Riley St; Quenby St; Ruskin St; Coleridge St; W Holcombe Blvd; Marlowe St; Lake St; Lafayette; Jarrard St; Fairhaven St; Browning St; Charlotte St; Fordham St; Carolina Way; Barbara Ln; Fenwood Rd; Arbuckle St; Centenary St; Pemberton Dr; Talbott St; Garnet St; Darcus St; Elmora St; Farber St; Carlon St; Jardin St; Ingold St; Harper St; Werlein St; Stella Link Rd; Corondo Ct; Pittsburgh; Northwestern St; Virginia St (Virginia Ct); Rutgers Pl; Lew Hill; Chilos St; W College St; E College St; Jane Austen St.
Railroad features: Southern Pacific RR.
West University Place neighborhood detailed profile
Area: 2.152 square miles
Population: 18,884
Population density:
| West University Place (West University): | 8,777 people per square mile |
| Houston: | 3,947 people per square mile |
Median household income in 2021:
| West University Place (West University): | $222,279 |
| Houston: | $55,499 |
Median rent in in 2021:
| West University Place (West University): | $2,454 |
| Houston: | $974 |
Male vs Females
| Males: | 9,368 |
| Females: | 9,516 |
Median age
| Males: | 43.0 years |
| Females: | 43.4 years |
Housing prices:
Average estimated value of detached houses in 2021 (90.0% of all units):
| West University Place (West University): | $1,373,235 |
| Houston: | $304,685 |
Average estimated value of townhouses or other attached units in 2021 (8.6% of all units):
| This neighborhood: | $463,671 |
| city: | $305,463 |
Average estimated '21 value of housing units in 5-or-more-unit structures (37.1% of all units):
| West University Place (West University): | $320,345 |
| Houston: | $227,414 |
Most popular occupations of males: management occupations (except farmers) (27.1%); healthcare practitioners and technical occupations (18.2%); sales and office occupations (10.5%); business and financial operations occupations (9.6%); legal occupations (9.0%); architecture and engineering occupations (6.6%); education, training, and library occupations (5.3%)
Most popular occupations of females: healthcare practitioners and technical occupations (20.3%); management occupations (except farmers) (15.5%); sales and office occupations (14.8%); business and financial operations occupations (12.3%); legal occupations (12.0%); education, training, and library occupations (8.1%); service occupations (5.5%)
Roads and streets: Rice Blvd; University Blvd; Amherst St; Bellaire Blvd; Sunset Blvd; Mercer St; Plumb St; Robinhood St; Nottingham St; Tangley St; Belmont St; Buffalo Speedway; Edloe St; Rutgers St; Sewanee St; Westchester St; Wakeforest St; Cason St; Kirby Dr; Auden St; Albans Rd; Georgetown St; Weslayan St; Pittsburg St; Annapolis St; Academy St; College St; W Point St; Wroxton Rd; Carnegie St; Duke St; Community Dr; Tennyson St; Milton St; Marquette St; Byron St; Swarthmore St; Villanova St; Arnold St; Southwestern St; Case St; Oberlin St; Brompton Rd (Brompton St); Vanderbilt St; Riley St; Quenby St; Ruskin St; Coleridge St; W Holcombe Blvd; Marlowe St; Lake St; Lafayette; Jarrard St; Fairhaven St; Browning St; Charlotte St; Fordham St; Carolina Way; Barbara Ln; Fenwood Rd; Arbuckle St; Centenary St; Pemberton Dr; Talbott St; Garnet St; Darcus St; Elmora St; Farber St; Carlon St; Jardin St; Ingold St; Harper St; Werlein St; Stella Link Rd; Corondo Ct; Pittsburgh; Northwestern St; Virginia St (Virginia Ct); Rutgers Pl; Lew Hill; Chilos St; W College St; E College St; Jane Austen St.
Railroad features: Southern Pacific RR.
West University Place neighborhood detailed profile
Westbury neighborhood in Houston statistics: (Find on map)
Area: 3.790 square miles
Population: 16,843
Population density:
Median household income in 2021:
Median rent in in 2021:
Male vs Females
Median age
Housing prices:
Average estimated value of detached houses in 2021 (83.5% of all units):
Average estimated value of townhouses or other attached units in 2021 (7.2% of all units):
Average estimated '21 value of housing units in 5-or-more-unit structures (13.7% of all units):
Most popular occupations of males: sales and office occupations (23.9%); service occupations (14.8%); management occupations (except farmers) (12.7%); construction, extraction, and maintenance occupations (9.5%); production occupations (7.5%); business and financial operations occupations (4.3%); education, training, and library occupations (4.2%)
Most popular occupations of females: service occupations (30.0%); sales and office occupations (22.2%); education, training, and library occupations (12.6%); management occupations (except farmers) (9.6%); business and financial operations occupations (8.0%); legal occupations (4.0%); healthcare practitioners and technical occupations (3.5%)
Highways in this neighborhood: US Hwy 90 Alt (Main St).
Roads and streets: Hillcroft St (Hillcroft Ave); Chimney Rock Rd; W Bellfort St; Dryad Dr; Ashcroft Dr; Dunlap St; W Airport Blvd; Braewick Dr; Stillbrooke Dr; Spellman Rd; Sanford Rd; Gasmer Dr; Atwell Dr; Hummingbird St (Hummingbird Dr); Landsdowne Dr; Briarbend Dr; Benning Dr; Creekbend Dr; Burdine St; Ludington Dr; Mc Knight St; Mullins Dr; Bankside Dr; S Willow Dr; Warm Springs Rd; Redstart St; Effingham Dr; Rampart St; Arboles Dr; Portal Dr; Fontenelle Dr; Cartagena St; S Post Oak Rd; Ettrick Dr; Endicott Ln; Kingfisher Dr (Kingfisher St); Belrose Dr; Greencraig Dr; Kinglet St; Burlinghall Dr; Duxbury St; Albury Dr; Willowbend Blvd; Cerritos Dr; Clematis Ln; Farwell Dr; Southminster Dr; Claridge Dr; Alvarado Dr; Cedarhurst Dr; Kirkside Dr; Dawnridge Dr; Firenza Dr; Lattimer Dr; Oasis Dr; Mc Clearen Dr; Vickijohn Dr; Densmore Dr; Gaymoor Dr; Beaudry Dr; Moonlight Dr; Hummingbird St; Renwick Dr; Starkridge Dr; S Renwick Dr; Doud St; Haviland St; Fondmeadow Dr (Walteria St); Ricecrest St; Checkerboard St; Dellfern Dr; Capello Dr; Stone West Dr; Stone East Dr; S Bowlan Ln; Carlota Ct; Glenfield Ct; Torchlight Dr; Nesmith Dr; Minetta St; Fonda St; Kit St; Westbury Sq; Rollingbrook Dr; Manhattan Dr; Chimney Rock; Crestmore St; Burdine; Sagamore St; Spellman Ct; Ludington Dr (Ludington Blvd).
Railroad features: Southern Pacific RR.
Other features: Waterhole Byu; Willow Waterhole Byu.
Westbury neighborhood detailed profile
Area: 3.790 square miles
Population: 16,843
Population density:
| Westbury: | 4,445 people per square mile |
| Houston: | 3,947 people per square mile |
Median household income in 2021:
| Westbury: | $71,508 |
| Houston: | $55,499 |
Median rent in in 2021:
| Westbury: | $1,078 |
| Houston: | $974 |
Male vs Females
| Males: | 8,379 |
| Females: | 8,463 |
Median age
| Males: | 34.0 years |
| Females: | 36.2 years |
Housing prices:
Average estimated value of detached houses in 2021 (83.5% of all units):
| Westbury: | $283,478 |
| Houston: | $304,685 |
Average estimated value of townhouses or other attached units in 2021 (7.2% of all units):
| This neighborhood: | $233,235 |
| city: | $305,463 |
Average estimated '21 value of housing units in 5-or-more-unit structures (13.7% of all units):
| Westbury: | $98,214 |
| Houston: | $227,414 |
Most popular occupations of males: sales and office occupations (23.9%); service occupations (14.8%); management occupations (except farmers) (12.7%); construction, extraction, and maintenance occupations (9.5%); production occupations (7.5%); business and financial operations occupations (4.3%); education, training, and library occupations (4.2%)
Most popular occupations of females: service occupations (30.0%); sales and office occupations (22.2%); education, training, and library occupations (12.6%); management occupations (except farmers) (9.6%); business and financial operations occupations (8.0%); legal occupations (4.0%); healthcare practitioners and technical occupations (3.5%)
Highways in this neighborhood: US Hwy 90 Alt (Main St).
Roads and streets: Hillcroft St (Hillcroft Ave); Chimney Rock Rd; W Bellfort St; Dryad Dr; Ashcroft Dr; Dunlap St; W Airport Blvd; Braewick Dr; Stillbrooke Dr; Spellman Rd; Sanford Rd; Gasmer Dr; Atwell Dr; Hummingbird St (Hummingbird Dr); Landsdowne Dr; Briarbend Dr; Benning Dr; Creekbend Dr; Burdine St; Ludington Dr; Mc Knight St; Mullins Dr; Bankside Dr; S Willow Dr; Warm Springs Rd; Redstart St; Effingham Dr; Rampart St; Arboles Dr; Portal Dr; Fontenelle Dr; Cartagena St; S Post Oak Rd; Ettrick Dr; Endicott Ln; Kingfisher Dr (Kingfisher St); Belrose Dr; Greencraig Dr; Kinglet St; Burlinghall Dr; Duxbury St; Albury Dr; Willowbend Blvd; Cerritos Dr; Clematis Ln; Farwell Dr; Southminster Dr; Claridge Dr; Alvarado Dr; Cedarhurst Dr; Kirkside Dr; Dawnridge Dr; Firenza Dr; Lattimer Dr; Oasis Dr; Mc Clearen Dr; Vickijohn Dr; Densmore Dr; Gaymoor Dr; Beaudry Dr; Moonlight Dr; Hummingbird St; Renwick Dr; Starkridge Dr; S Renwick Dr; Doud St; Haviland St; Fondmeadow Dr (Walteria St); Ricecrest St; Checkerboard St; Dellfern Dr; Capello Dr; Stone West Dr; Stone East Dr; S Bowlan Ln; Carlota Ct; Glenfield Ct; Torchlight Dr; Nesmith Dr; Minetta St; Fonda St; Kit St; Westbury Sq; Rollingbrook Dr; Manhattan Dr; Chimney Rock; Crestmore St; Burdine; Sagamore St; Spellman Ct; Ludington Dr (Ludington Blvd).
Railroad features: Southern Pacific RR.
Other features: Waterhole Byu; Willow Waterhole Byu.
Westbury neighborhood detailed profile
Westchase neighborhood in Houston statistics: (Find on map)
Area: 4.532 square miles
Population: 15,236
Population density:
Median household income in 2021:
Median rent in in 2021:
Male vs Females
Median age
Housing prices:
Average estimated value of detached houses in 2021 (75.2% of all units):
Average estimated value of townhouses or other attached units in 2021 (5.4% of all units):
Most popular occupations of males: sales and office occupations (20.3%); service occupations (19.6%); production occupations (15.1%); management occupations (except farmers) (9.0%); construction, extraction, and maintenance occupations (8.5%); transportation occupations (5.3%); arts, design, entertainment, sports, and media occupations (4.2%)
Most popular occupations of females: sales and office occupations (34.3%); service occupations (20.3%); management occupations (except farmers) (10.9%); healthcare practitioners and technical occupations (10.7%); business and financial operations occupations (5.4%); production occupations (5.4%); material moving occupations (2.9%)
Highways in this neighborhood: State Loop 8 (Sam Houston Pkwy, Beltway 8).
Roads and streets: FM 1093 (Westheimer Rd); Westpark Dr; Richmond Ave; Meadowglen Ln; Old Westheimer Rd; Wilcrest Dr; Rogerdale Rd; Briarpark Dr; Harwin Dr; Walnut Bend Ln; Andrau Dr; Hayes Rd; Bonnebridge Way Blvd; Woodchase Dr; Elmside Dr; Alief Rd; Woodland Park Dr; Royal Oaks Club Dr; Westchase Dr; Wallingford Dr; Westcenter Dr; Rosemary Park Ln; Westoffice Dr; Pagewood Ln; Wilcrest Green Dr; Bridgeberry Ln; Tudor Manor; Versailles Lake Ln; Gallant Ridge Ln; Chartreuse Way; Royal Rose Dr; Butterstone; Ranchester Dr; Bonneridge Way Blvd; Westmart Dr; Oakberry St; Empress Oaks Ct; Waterstone Dr; Breezewood Dr; Thistlemont Dr; Coachpoint; Velure; Chaucer Oaks Ct; Newmont; Rosebrier Park Ln; Tudor Bend; Tudor Crst; Chartreuse Ct (Chartreuse Way Ct); Manet Ct.
Railroad features: Southern Pacific RR.
Other features: Brays Byu.
Westchase neighborhood detailed profile
Area: 4.532 square miles
Population: 15,236
Population density:
| Westchase: | 3,362 people per square mile |
| Houston: | 3,947 people per square mile |
Median household income in 2021:
| Westchase: | $68,606 |
| Houston: | $55,499 |
Median rent in in 2021:
| Westchase: | $1,038 |
| Houston: | $974 |
Male vs Females
| Males: | 7,906 |
| Females: | 7,330 |
Median age
| Males: | 37.4 years |
| Females: | 38.5 years |
Housing prices:
Average estimated value of detached houses in 2021 (75.2% of all units):
| Westchase: | $319,215 |
| Houston: | $304,685 |
Average estimated value of townhouses or other attached units in 2021 (5.4% of all units):
| This neighborhood: | $224,898 |
| city: | $305,463 |
Most popular occupations of males: sales and office occupations (20.3%); service occupations (19.6%); production occupations (15.1%); management occupations (except farmers) (9.0%); construction, extraction, and maintenance occupations (8.5%); transportation occupations (5.3%); arts, design, entertainment, sports, and media occupations (4.2%)
Most popular occupations of females: sales and office occupations (34.3%); service occupations (20.3%); management occupations (except farmers) (10.9%); healthcare practitioners and technical occupations (10.7%); business and financial operations occupations (5.4%); production occupations (5.4%); material moving occupations (2.9%)
Highways in this neighborhood: State Loop 8 (Sam Houston Pkwy, Beltway 8).
Roads and streets: FM 1093 (Westheimer Rd); Westpark Dr; Richmond Ave; Meadowglen Ln; Old Westheimer Rd; Wilcrest Dr; Rogerdale Rd; Briarpark Dr; Harwin Dr; Walnut Bend Ln; Andrau Dr; Hayes Rd; Bonnebridge Way Blvd; Woodchase Dr; Elmside Dr; Alief Rd; Woodland Park Dr; Royal Oaks Club Dr; Westchase Dr; Wallingford Dr; Westcenter Dr; Rosemary Park Ln; Westoffice Dr; Pagewood Ln; Wilcrest Green Dr; Bridgeberry Ln; Tudor Manor; Versailles Lake Ln; Gallant Ridge Ln; Chartreuse Way; Royal Rose Dr; Butterstone; Ranchester Dr; Bonneridge Way Blvd; Westmart Dr; Oakberry St; Empress Oaks Ct; Waterstone Dr; Breezewood Dr; Thistlemont Dr; Coachpoint; Velure; Chaucer Oaks Ct; Newmont; Rosebrier Park Ln; Tudor Bend; Tudor Crst; Chartreuse Ct (Chartreuse Way Ct); Manet Ct.
Railroad features: Southern Pacific RR.
Other features: Brays Byu.
Westchase neighborhood detailed profile
Westwood neighborhood in Houston statistics: (Find on map)
Area: 2.007 square miles
Population: 4,061
Population density:
Median household income in 2021:
Median rent in in 2021:
Male vs Females
Median age
Housing prices:
Average estimated value of detached houses in 2021 (5.0% of all units):
Average estimated value of townhouses or other attached units in 2021 (28.5% of all units):
Average estimated '21 value of housing units in 5-or-more-unit structures (18.3% of all units):
Most popular occupations of males: construction, extraction, and maintenance occupations (34.7%); service occupations (25.5%); transportation occupations (13.9%); production occupations (3.8%); sales and office occupations (3.2%); business and financial operations occupations (2.9%); computer and mathematical occupations (2.7%)
Most popular occupations of females: service occupations (39.7%); sales and office occupations (30.0%); education, training, and library occupations (8.9%); computer and mathematical occupations (6.7%); community and social services occupations (3.5%); construction, extraction, and maintenance occupations (2.5%); business and financial operations occupations (2.3%)
Highways in this neighborhood: US Hwy 59 (Southwest Fwy); US Hwy 59 (Hov US 59); Sam Houston Pkwy (State Loop 8, Beltway 8).
Roads and streets: Bissonnet St; Club Creek Dr; White Chapel Ln; Summerbell Ln; Sugar Branch Dr; Ronda Ln; Woodfair Dr; Ponderosa Ln; Alberene Dr; Forum Park Dr; Country Creek Dr; Honeywell; Concourse Dr; Centre Pkwy; Green Fork Dr; State Loop 8 (Sam Houston Pkwy); Barger Rd; Deering Dr; Consuela Dr; SW Plaza Dr; Lansdale Dr; Public Ln; Forum Place Dr; Forum West Dr; Parkwood Circle Dr; Beechnut St; Plainfield St; Duchamp Dr; Starfire Ln; Westwood Pr One Dr; Corner Oaks Ln; Pebble Park Ln; Westwood Pr Four Dr; SW Plaza Ct; S Braeswood Blvd; Eagle Creek Ln; Finchwood Ln; Stonecreek Ln; Glengate Ln; Reedwood Ln; Honeywell Ln; Westwood Pr Three Dr; Braeswood Blvd; Westwood Pr Two Dr.
Other features: Keegans Byu.
Westwood neighborhood detailed profile
Area: 2.007 square miles
Population: 4,061
Population density:
| Westwood: | 2,024 people per square mile |
| Houston: | 3,947 people per square mile |
Median household income in 2021:
| Westwood: | $32,221 |
| Houston: | $55,499 |
Median rent in in 2021:
| Westwood: | $769 |
| Houston: | $974 |
Male vs Females
| Males: | 1,928 |
| Females: | 2,132 |
Median age
| Males: | 25.6 years |
| Females: | 29.4 years |
Housing prices:
Average estimated value of detached houses in 2021 (5.0% of all units):
| Westwood: | $157,257 |
| Houston: | $304,685 |
Average estimated value of townhouses or other attached units in 2021 (28.5% of all units):
| This neighborhood: | $104,944 |
| city: | $305,463 |
Average estimated '21 value of housing units in 5-or-more-unit structures (18.3% of all units):
| Westwood: | $58,405 |
| Houston: | $227,414 |
Most popular occupations of males: construction, extraction, and maintenance occupations (34.7%); service occupations (25.5%); transportation occupations (13.9%); production occupations (3.8%); sales and office occupations (3.2%); business and financial operations occupations (2.9%); computer and mathematical occupations (2.7%)
Most popular occupations of females: service occupations (39.7%); sales and office occupations (30.0%); education, training, and library occupations (8.9%); computer and mathematical occupations (6.7%); community and social services occupations (3.5%); construction, extraction, and maintenance occupations (2.5%); business and financial operations occupations (2.3%)
Highways in this neighborhood: US Hwy 59 (Southwest Fwy); US Hwy 59 (Hov US 59); Sam Houston Pkwy (State Loop 8, Beltway 8).
Roads and streets: Bissonnet St; Club Creek Dr; White Chapel Ln; Summerbell Ln; Sugar Branch Dr; Ronda Ln; Woodfair Dr; Ponderosa Ln; Alberene Dr; Forum Park Dr; Country Creek Dr; Honeywell; Concourse Dr; Centre Pkwy; Green Fork Dr; State Loop 8 (Sam Houston Pkwy); Barger Rd; Deering Dr; Consuela Dr; SW Plaza Dr; Lansdale Dr; Public Ln; Forum Place Dr; Forum West Dr; Parkwood Circle Dr; Beechnut St; Plainfield St; Duchamp Dr; Starfire Ln; Westwood Pr One Dr; Corner Oaks Ln; Pebble Park Ln; Westwood Pr Four Dr; SW Plaza Ct; S Braeswood Blvd; Eagle Creek Ln; Finchwood Ln; Stonecreek Ln; Glengate Ln; Reedwood Ln; Honeywell Ln; Westwood Pr Three Dr; Braeswood Blvd; Westwood Pr Two Dr.
Other features: Keegans Byu.
Westwood neighborhood detailed profile
Willow Bend neighborhood in Houston statistics: (Find on map)
Area: 2.650 square miles
Population: 10,923
Population density:
Median household income in 2021:
Median rent in in 2021:
Male vs Females
Median age
Housing prices:
Average estimated value of detached houses in 2021 (64.5% of all units):
Average estimated value of townhouses or other attached units in 2021 (4.8% of all units):
Most popular occupations of males: sales and office occupations (14.9%); management occupations (except farmers) (11.2%); service occupations (9.2%); production occupations (8.3%); material moving occupations (8.2%); business and financial operations occupations (7.8%); life, physical, and social science occupations (6.4%)
Most popular occupations of females: education, training, and library occupations (20.9%); sales and office occupations (19.7%); service occupations (17.0%); healthcare practitioners and technical occupations (11.0%); business and financial operations occupations (9.8%); management occupations (except farmers) (8.0%); arts, design, entertainment, sports, and media occupations (5.1%)
Limited-access highways (interstate or state) in this neighborhood: I- 610 (S Loop Fwy).
Highways in this neighborhood: US Hwy 90 Alt (Main St).
Roads and streets: Cliffwood Dr; Willowbend Blvd; Omeara Dr (O Meara Dr); Willowilde Dr; Greenwillow St; Stella Link Rd; Kingfisher Dr; Hummingbird St; Kinglet St; Creekbend Dr; W Bellfort St; Benning Dr; Briarbend Dr; Stillbrooke Dr; Spellman Rd; Sanford Rd; Bassoon Dr; Lemac Dr; Warm Springs Rd; Osby Dr; Mc Dermed Dr; Nenana Dr; Woodwind Dr; Waycross St; Craighead Dr; Silverwood Dr; Tonawanda Dr; Cheena Dr; Redstart St; Gasmer Dr; Sarong Dr; Link Valley Dr; Waynesboro Dr; Old Main Street Loop Rd; Greenwillow Dr (Greenwillow St); Windwood Dr; Oboe Dr; Wood Fox St; Woodfin St; Brookbend Dr; Hazelton St; Lymbar Dr; Woodcraft St; Woodhaven St; Wigton Dr; Waxwing St; Firestone Dr; Woodshire St; Charleston Park Dr; Goldfinch St; Fariss; Elbeck Dr; Timberside Dr; Huggins; Mickler St; Kapri Ln; Marlive Ln; Riddlewood Ln; Dawn; Linkmeadow Ln; Woodpecker St; Wabash; Glencove; Lark Ln; Hartt St; Rose Way; Riding; Cara Pl; Teen Ave; Willowisp Dr; Ice Palace Dr.
Railroad features: Southern Pacific RR.
Other features: Willow Waterhole Byu.
Willow Bend neighborhood detailed profile
Area: 2.650 square miles
Population: 10,923
Population density:
| Willow Bend (Willow Meadows): | 4,122 people per square mile |
| Houston: | 3,947 people per square mile |
Median household income in 2021:
| Willow Bend (Willow Meadows): | $75,858 |
| Houston: | $55,499 |
Median rent in in 2021:
| Willow Bend (Willow Meadows): | $1,288 |
| Houston: | $974 |
Male vs Females
| Males: | 5,341 |
| Females: | 5,582 |
Median age
| Males: | 36.7 years |
| Females: | 36.9 years |
Housing prices:
Average estimated value of detached houses in 2021 (64.5% of all units):
| Willow Bend (Willow Meadows): | $318,892 |
| Houston: | $304,685 |
Average estimated value of townhouses or other attached units in 2021 (4.8% of all units):
| This neighborhood: | $267,397 |
| city: | $305,463 |
Most popular occupations of males: sales and office occupations (14.9%); management occupations (except farmers) (11.2%); service occupations (9.2%); production occupations (8.3%); material moving occupations (8.2%); business and financial operations occupations (7.8%); life, physical, and social science occupations (6.4%)
Most popular occupations of females: education, training, and library occupations (20.9%); sales and office occupations (19.7%); service occupations (17.0%); healthcare practitioners and technical occupations (11.0%); business and financial operations occupations (9.8%); management occupations (except farmers) (8.0%); arts, design, entertainment, sports, and media occupations (5.1%)
Limited-access highways (interstate or state) in this neighborhood: I- 610 (S Loop Fwy).
Highways in this neighborhood: US Hwy 90 Alt (Main St).
Roads and streets: Cliffwood Dr; Willowbend Blvd; Omeara Dr (O Meara Dr); Willowilde Dr; Greenwillow St; Stella Link Rd; Kingfisher Dr; Hummingbird St; Kinglet St; Creekbend Dr; W Bellfort St; Benning Dr; Briarbend Dr; Stillbrooke Dr; Spellman Rd; Sanford Rd; Bassoon Dr; Lemac Dr; Warm Springs Rd; Osby Dr; Mc Dermed Dr; Nenana Dr; Woodwind Dr; Waycross St; Craighead Dr; Silverwood Dr; Tonawanda Dr; Cheena Dr; Redstart St; Gasmer Dr; Sarong Dr; Link Valley Dr; Waynesboro Dr; Old Main Street Loop Rd; Greenwillow Dr (Greenwillow St); Windwood Dr; Oboe Dr; Wood Fox St; Woodfin St; Brookbend Dr; Hazelton St; Lymbar Dr; Woodcraft St; Woodhaven St; Wigton Dr; Waxwing St; Firestone Dr; Woodshire St; Charleston Park Dr; Goldfinch St; Fariss; Elbeck Dr; Timberside Dr; Huggins; Mickler St; Kapri Ln; Marlive Ln; Riddlewood Ln; Dawn; Linkmeadow Ln; Woodpecker St; Wabash; Glencove; Lark Ln; Hartt St; Rose Way; Riding; Cara Pl; Teen Ave; Willowisp Dr; Ice Palace Dr.
Railroad features: Southern Pacific RR.
Other features: Willow Waterhole Byu.
Willow Bend neighborhood detailed profile