Bayard Park Historic District neighborhood in Evansville, Indiana (IN), 47713 detailed profile
Settings
X


Business Search - 14 Million verified businesses
Area: 0.128 square miles
Population: 1,116
Population density:
| Bayard Park Historic District: | 8,710 people per square mile |
| Evansville: | 2,912 people per square mile |

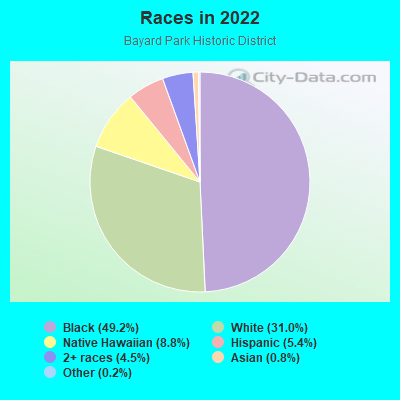
- 62149.2%Black
- 39131.0%White
- 1118.8%Native Hawaiian and Other
Pacific Islander - 685.4%Hispanic or Latino
- 574.5%Two or more races
- 100.8%Asian
- 30.2%Some other race
- 10.08%American Indian
Median household income in 2022:
| Bayard Park Historic District: | $40,351 |
| Evansville: | $48,127 |
Distribution of median household income
![Distribution of median household income]()
- 26Less than $10,000
- 59$10,000 to $19,999
- 63$20,000 to $29,999
- 91$30,000 to $39,999
- 39$40,000 to $49,999
- 49$50,000 to $59,999
- 51$60,000 to $74,999
- 48$75,000 to $99,999
- 38$100,000 to $124,999
- 24$125,000 to $149,999
- 20$150,000 to $199,999

Distribution of owner-occupied house/condo value
![Distribution of owner-occupied house/condo value]()
- 145Less than $50,000
- 269$50,000 to $99,999
- 42$100,000 to $149,999
- 23$150,000 to $199,999
- 11$200,000 to $249,999
- 5$500,000 to $749,999

Distribution of rent paid by renters
![Distribution of rent paid by renters]()
- 20$200 to $299
- 32$300 to $399
- 44$400 to $499
- 30$500 to $599
- 30$600 to $699
- 50$700 to $799
- 30$800 to $899
- 12$900 to $999
- 8$1,000 to $1,249
- 18$1,500 to $1,999

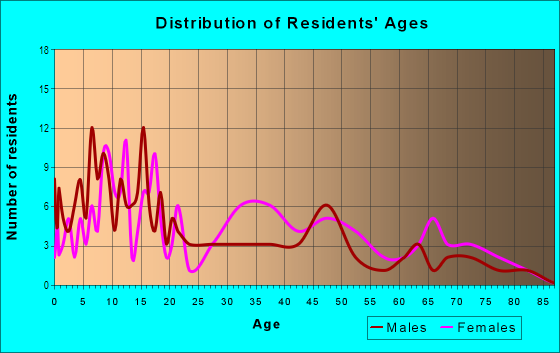
| Males: | 608 |
| Females: | 507 |
Males:
| This neighborhood: | 37.8 years |
| Whole city: | 36.6 years |
| This neighborhood: | 44.2 years |
| Whole city: | 38.9 years |
Average household size:
| Bayard Park Historic District: | 2.2 people |
| Evansville: | 2.1 people |
Percentage of family households:
| Bayard Park Historic District: | 34.8% |
| Evansville: | 38.3% |
| Here: | 24.6% |
| Evansville: | 33.7% |
Percentage of married-couple families with children (among all households):
| Bayard Park Historic District: | 13.5% |
| Evansville: | 25.3% |
Percentage of single-mother households (among all households):
| Bayard Park Historic District: | 15.1% |
| Evansville: | 15.6% |
Percentage of never married males 15 years old and over:
Percentage of never married females 15 years old and over:
| Bayard Park Historic District: | 22.5% |
| Evansville: | 19.5% |
Percentage of never married females 15 years old and over:
| Bayard Park Historic District: | 19.9% |
| city: | 17.0% |
Percentage of people that speak English not well or not at all:
| Bayard Park Historic District: | 0.2% |
| Evansville: | 0.7% |
Percentage of people born in this state:
Percentage of people born in another U.S. state:
Percentage of native residents but born outside the U.S.:
Percentage of foreign born residents:
| Here: | 66.3% |
| Evansville: | 70.5% |
Percentage of people born in another U.S. state:
| Bayard Park Historic District: | 30.2% |
| Evansville: | 25.5% |
Percentage of native residents but born outside the U.S.:
| Here: | 0.2% |
| city: | 0.8% |
Percentage of foreign born residents:
| Here: | 3.5% |
| Evansville: | 3.2% |
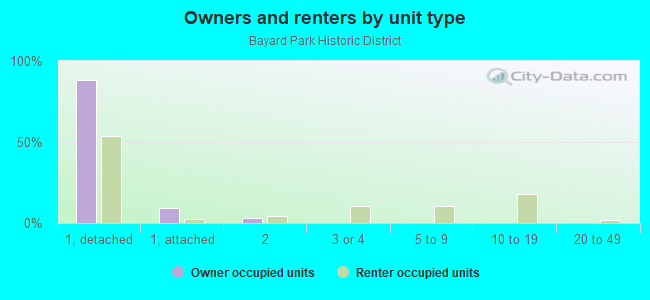
Owner-occupied
Renter-occupied

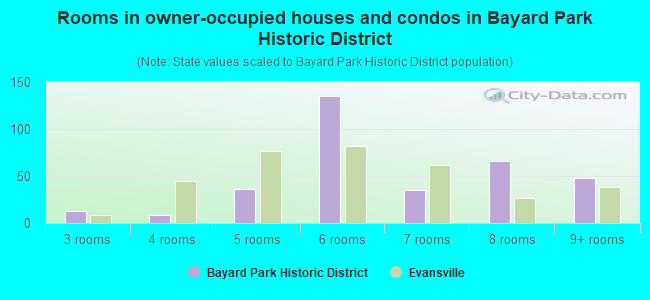
- Rooms in owner-occupied houses and condos in Bayard Park Historic District
- 01 room
- 02 rooms
- 133 rooms
- 84 rooms
- 365 rooms
- 1356 rooms
- 357 rooms
- 668 rooms
- 489+ rooms
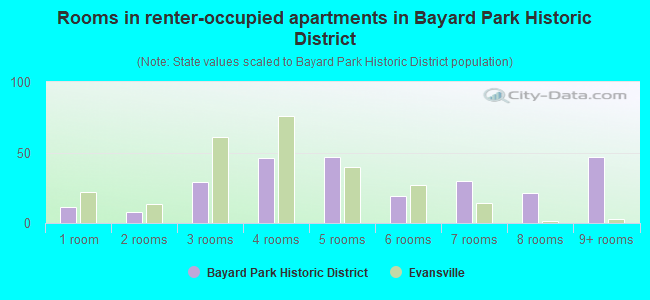
- Rooms in renter-occupied apartments in Bayard Park Historic District
- 111 room
- 82 rooms
- 293 rooms
- 464 rooms
- 475 rooms
- 196 rooms
- 307 rooms
- 218 rooms
- 479+ rooms
Owner-occupied
Renter-occupied
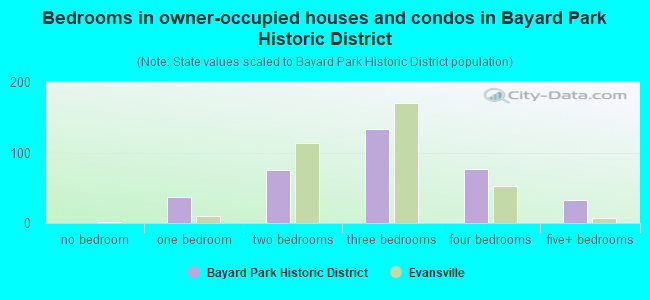
- Bedrooms in owner-occupied houses and condos in Bayard Park Historic District
- 0no bedroom
- 371 bedroom
- 752 bedrooms
- 1343 bedrooms
- 774 bedrooms
- 335+ bedrooms
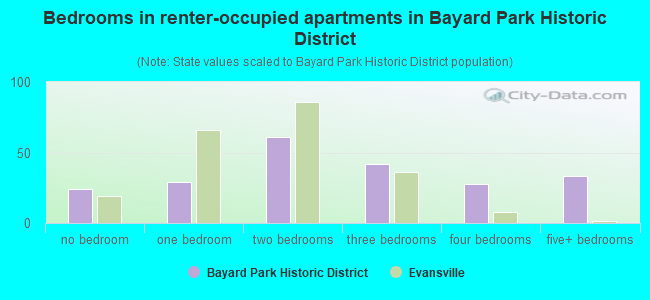
- Bedrooms in renter-occupied apartments in Bayard Park Historic District
- 24no bedroom
- 291 bedroom
- 612 bedrooms
- 423 bedrooms
- 284 bedrooms
- 335+ bedrooms
Average number of cars or other vehicles available in houses/condos:
Average number of cars or other vehicles available in apartments:
| This neighborhood: | 2.1 |
| Evansville: | 1.8 |
Average number of cars or other vehicles available in apartments:
| Here: | 1.0 |
| city: | 1.1 |
Percentage of units with a mortgage:
| Bayard Park Historic District: | 56.1% |
| Evansville: | 58.5% |
Average estimated value of detached houses in 2022 (88.7% of all units):
| Bayard Park Historic District: | $72,096 |
| Indiana: | $257,916 |
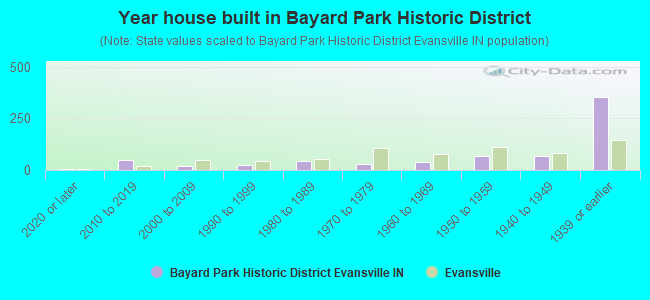
- Year house built in Bayard Park Historic District
- 42020 or later
- 482010 to 2019
- 182000 to 2009
- 241990 to 1999
- 461980 to 1989
- 291970 to 1979
- 371960 to 1969
- 691950 to 1959
- 681940 to 1949
- 3521939 or earlier
City-data.com crime index for city in 2020 (higher means more crime):
| City: | 440.8 |
| U.S. average: | 219.5 |
Travel time to work (commute)
![Travel time to work (commute)]()
- 77Less than 5 minutes
- 485 to 9 minutes
- 6410 to 14 minutes
- 8615 to 19 minutes
- 4620 to 24 minutes
- 2425 to 29 minutes
- 2930 to 34 minutes
- 635 to 39 minutes
- 640 to 44 minutes
- 1345 to 59 minutes
- 360 to 89 minutes
- 1590 or more minutes

Means of transportation to work
![Means of transportation to work]()
- 70.7%317Drove a car alone
- 20.1%90Carpooled
- 4.7%21Bus
- 3.1%14Other means
- 4.5%20Worked at home

Time leaving home to go to work
![Time leaving home to go to work]()
- 4212:00 a.m. to 4:59 a.m.
- 275:00 a.m. to 5:29 a.m.
- 245:30 a.m. to 5:59 a.m.
- 216:00 a.m. to 6:29 a.m.
- 176:30 a.m. to 6:59 a.m.
- 447:00 a.m. to 7:29 a.m.
- 107:30 a.m. to 7:59 a.m.
- 118:00 a.m. to 8:29 a.m.
- 58:30 a.m. to 8:59 a.m.
- 139:00 a.m. to 9:59 a.m.
- 2910:00 a.m. to 10:59 a.m.
- 611:00 a.m. to 11:59 a.m.
- 7512:00 p.m. to 3:59 p.m.
- 314:00 p.m. to 11:59 p.m.

Occupations of males:
- Percentage of males in management occupations (except farmers):
Here: 1.9% city: 8.4%
- Percentage of males in computer and mathematical occupations:
Here: 5.2% city: 3.0%
- Percentage of males in education, training, and library occupations:
Here: 1.0% city: 2.7%
- Percentage of males in healthcare practitioners and technical occupations:
Here: 6.4% city: 2.1%
- Percentage of males in service occupations:
Here: 25.5% city: 15.9%
- Percentage of males in sales and office occupations:
Here: 18.4% city: 14.7%
- Percentage of males in production occupations:
Here: 14.8% city: 14.9%
- Percentage of males in transportation occupations:
Here: 6.2% city: 7.3%
- Percentage of males in material moving occupations:
Here: 17.3% city: 8.2%
Occupations of females:
- Percentage of females in management occupations (except farmers):
Here: 6.8% city: 6.4%
- Percentage of females in business and financial operations occupations:
Here: 2.6% city: 4.6%
- Percentage of females in community and social services occupations:
Here: 2.1% city: 2.7%
- Percentage of females in education, training, and library occupations:
Here: 5.0% city: 5.7%
- Percentage of females in arts, design, entertainment, sports, and media occupations:
Here: 3.8% city: 1.3%
- Percentage of females in healthcare practitioners and technical occupations:
Here: 3.0% city: 8.9%
- Percentage of females in service occupations:
Here: 38.7% city: 26.1%
- Percentage of females in sales and office occupations:
Here: 22.5% city: 30.9%
- Percentage of females in production occupations:
Here: 13.8% city: 5.3%
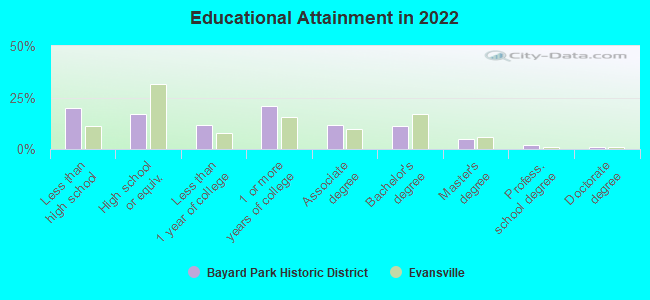
Education in this neighborhood (subdivision or community):
- Percentage of people 3 years and older in K-12 schools:
Bayard Park Historic District: 22.0% Evansville: 15.5%
- Percentage of people 3 years and older in undergraduate colleges:
Bayard Park Historic District: 2.9% Evansville: 5.1%
- Percentage of people 3 years and older in grad. or professional schools:
Bayard Park Historic District: 0.5% Evansville: 0.8%
- Percentage of students K-12 enrolled in private schools:
Bayard Park Historic District: 0.0% Evansville: 15.2%
Percentage of population below poverty level:
| Bayard Park Historic District: | 26.7% |
| Evansville: | 19.3% |
Median year owner moved in (as recorded in 2022):
Median year renter moved in (as recorded in 2022):
| Bayard Park Historic District: | 2000 |
| Evansville: | 2011 |
Median year renter moved in (as recorded in 2022):
| Bayard Park Historic District: | 2016 |
| Evansville: | 2020 |
Percentage of married-couple families with both working:
| Bayard Park Historic District: | 119.5% |
| Evansville: | 71.5% |
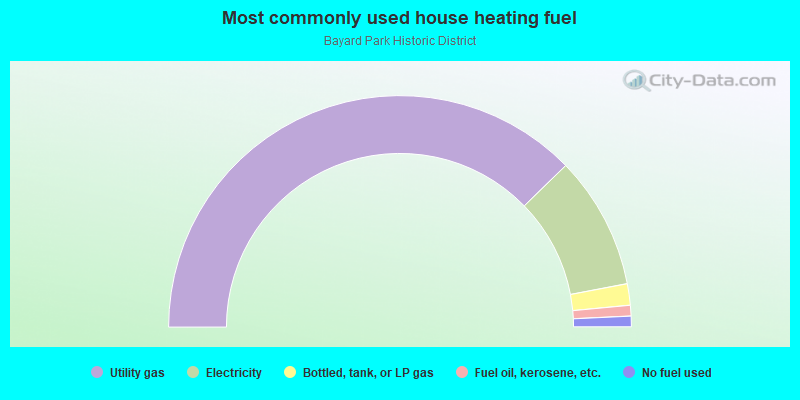
- 75.5%Utility gas
- 18.6%Electricity
- 3.0%Bottled, tank, or LP gas
- 1.5%Fuel oil, kerosene, etc.
- 1.5%No fuel used
Roads and streets:
E Blackford Ave
Length: 0.50 miles
Direction: E-W
Address range: 700 to 999
Direction: E-W
Address range: 700 to 999
E Powell Ave
Length: 0.50 miles
Direction: E-W
Address range: 700 to 999
Direction: E-W
Address range: 700 to 999
Bayard Park Dr
Length: 0.50 miles
Direction: E-W
Address range: 700 to 999
Direction: E-W
Address range: 700 to 999
E Chandler Ave
Length: 0.33 miles
Direction: E-W
Address range: 700 to 899
Direction: E-W
Address range: 700 to 899
S Bedford Ave
Length: 0.20 miles
Directions: N-S, SW-NE
Address range: 800 to 999
Directions: N-S, SW-NE
Address range: 800 to 999
S Kentucky Ave
Length: 0.19 miles
Direction: N-S
Address range: 800 to 949
Direction: N-S
Address range: 800 to 949
S Evans Ave
Length: 0.19 miles
Direction: N-S
Address range: 800 to 949
Direction: N-S
Address range: 800 to 949
S Morton Ave
Length: 0.19 miles
Direction: N-S
Address range: 800 to 949
Direction: N-S
Address range: 800 to 949
S Grand Ave
Length: 0.06 miles
Direction: N-S
Address range: 900 to 949
Direction: N-S
Address range: 900 to 949