Estimated zip code population in 2022: 9,659 Zip code population in 2010: 11,032 Zip code population in 2000: 12,154
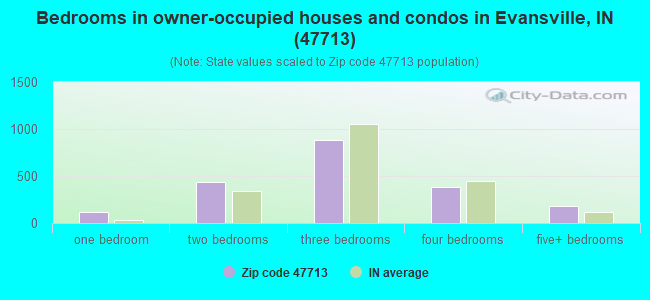
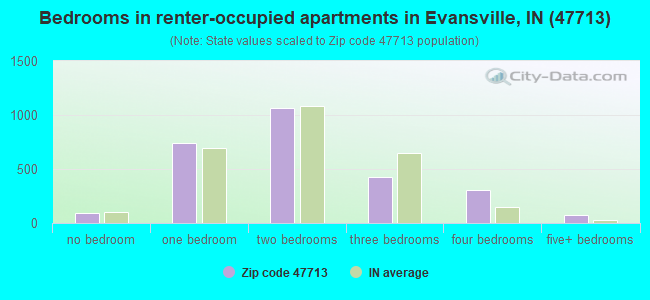
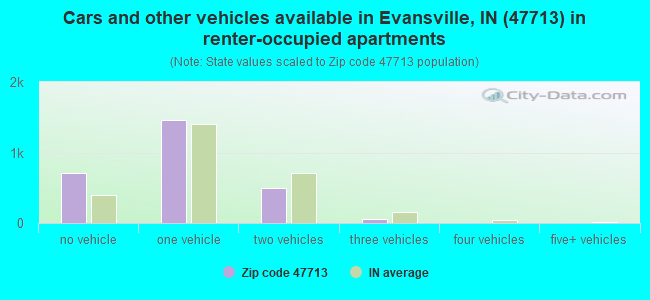
Houses and condos: 5,615 Renter-occupied apartments: 2,704
% of renters here:
58%
State:
29%
March 2022 cost of living index in zip code 47713: 81.8 (low, U.S. average is 100)
Land area: 3.9 sq. mi. Water area: 0.1 sq. mi.
Population density: 2,509 people per square mile
(average).
OSM Map
General Map
Google Map
MSN Map
OSM Map
General Map
Google Map
MSN Map
OSM Map
General Map
Google Map
MSN Map
OSM Map
General Map
Google Map
MSN Map
Please wait while loading the map...
Real estate property taxes paid for housing units in 2022:
This zip code:
0.6% ($604)
Indiana:
0.7% ($1,467)
Median real estate property taxes paid for housing units with mortgages in 2022: $874 (0.9%) Median real estate property taxes paid for housing units with no mortgage in 2022: $544 (0.7%)
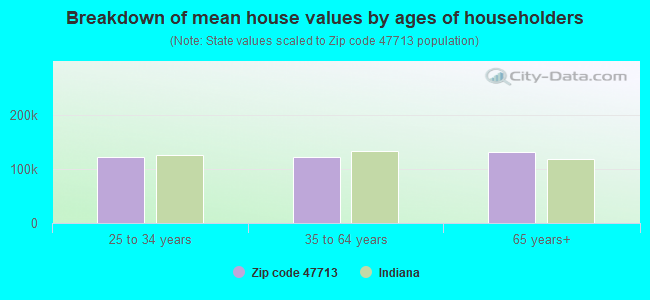
Estimated median house/condo value in 2022: $94,006
47713:
$94,006
Indiana:
$208,700
According to our research of Indiana and other state lists, there were 5 registered sex offenders living in 47713 zip code as of April 27, 2024. The ratio of all residents to sex offenders in zip code 47713 is 2,086 to 1. The ratio of registered sex offenders to all residents in this zip code is much lower than the state average.
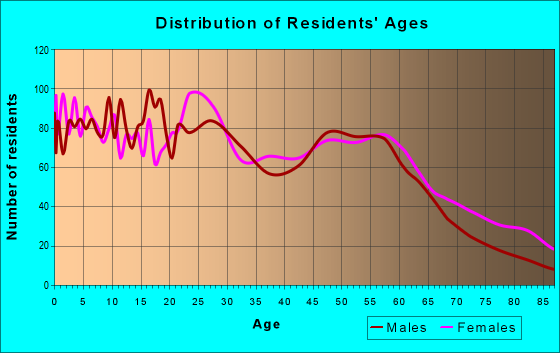
Median resident age:
This zip code:
40.5 years
Indiana median age:
38.2 years
Average household size:
This zip code:
2.0 people
Indiana:
2.4 people
Averages for the 2020 tax year for zip code 47713, filed in 2021:
Average Adjusted Gross Income (AGI) in 2020: $33,697 (Individual Income Tax Returns)
Here:
$33,697
State:
$64,978
Salary/wage: $30,301 (reported on 88.6% of returns)
Here:
$30,301
State:
$55,245
(% of AGI for various income ranges: 1077.1% for AGIs below $25k, 3605.7% for AGIs $25k-50k, 6713.7% for AGIs $50k-75k, 9185.0% for AGIs $75k-100k, 15728.8% for AGIs $100k-200k)
Taxable interest for individuals: $874 (reported on 10.9% of returns)
This zip code:
$874
Indiana:
$1,351
(% of AGI for various income ranges: 3.0% for AGIs below $25k, 4.2% for AGIs $25k-50k, 19.7% for AGIs $50k-75k, 28.3% for AGIs $75k-100k, 111.2% for AGIs $100k-200k)
Ordinary dividends: $4,496 (reported on 6.1% of returns)
Here:
$4,496
State:
$5,827
(% of AGI for various income ranges: 4.1% for AGIs below $25k, 7.4% for AGIs $25k-50k, 40.3% for AGIs $50k-75k, 55.0% for AGIs $75k-100k, 302.5% for AGIs $100k-200k)
Net capital gain/loss in AGI: +$6,756 (reported on 5.5% of returns)
Here:
+$6,756
State:
+$17,730
(% of AGI for various income ranges: 0.8% for AGIs below $25k, 6.4% for AGIs $25k-50k, 61.4% for AGIs $50k-75k, 175.8% for AGIs $75k-100k, 220.0% for AGIs $100k-200k)
Profit/loss from business: +$5,481 (reported on 10.3% of returns)
Here:
+$5,481
State:
+$12,144
(% of AGI for various income ranges: 57.0% for AGIs below $25k, 50.1% for AGIs $25k-50k, 220.8% for AGIs $75k-100k, 777.5% for AGIs $100k-200k)
Taxable individual retirement arrangement distribution: $17,824 (reported on 3.7% of returns)
47713:
$17,824
Indiana:
$18,302
(% of AGI for various income ranges: 10.9% for AGIs below $25k, 32.1% for AGIs $25k-50k, 277.4% for AGIs $50k-75k, 1836.2% for AGIs $100k-200k)
Total itemized deductions: $30,371 (reported on 1.5% of returns)
Here:
$30,371
State:
$35,601
(% of AGI for various income ranges: 22.8% for AGIs below $25k, 562.5% for AGIs $75k-100k)
Charity contributions: $11,220 (reported on 1.1% of returns)
Here:
$11,220
State:
$15,596
(% of AGI for various income ranges: 701.2% for AGIs $100k-200k)
Taxes paid: $6,229 (reported on 1.5% of returns)
47713:
$6,229
State:
$7,542
(% of AGI for various income ranges: 200.0% for AGIs $75k-100k)
Earned income credit: $2,341 (reported on 34.6% of returns)
Here:
$2,341
State:
$2,298
(% of AGI for various income ranges: 134.2% for AGIs below $25k, 89.0% for AGIs $25k-50k)
Percentage of individuals using paid preparers for their 2020 taxes: 95.4%
Here:
95%
State:
94%
(% for various income ranges: 95.4% for AGIs below $25k, 96.3% for AGIs $25k-50k, 95.7% for AGIs $50k-75k, 94.1% for AGIs $75k-100k, 84.6% for AGIs $100k-200k, 100.0% for AGIs over 200k)
Averages for the 2012 tax year for zip code 47713, filed in 2013:
Average Adjusted Gross Income (AGI) in 2012: $26,899 (Individual Income Tax Returns)
Here:
$26,899
State:
$52,932
Salary/wage: $22,787 (reported on 89.5% of returns)
Here:
$22,787
State:
$45,173
(% of AGI for various income ranges: 82.0% for AGIs below $25k, 86.3% for AGIs $25k-50k, 82.1% for AGIs $50k-75k, 81.6% for AGIs $75k-100k, 64.0% for AGIs $100k-200k, 33.2% for AGIs over 200k)
Taxable interest for individuals: $747 (reported on 10.8% of returns)
This zip code:
$747
Indiana:
$1,311
(% of AGI for various income ranges: 0.3% for AGIs below $25k, 0.1% for AGIs $25k-50k, 0.2% for AGIs $50k-75k, 0.2% for AGIs $75k-100k, 0.8% for AGIs $100k-200k, 0.6% for AGIs over 200k)
Ordinary dividends: $5,396 (reported on 5.7% of returns)
Here:
$5,396
State:
$4,690
(% of AGI for various income ranges: 0.3% for AGIs below $25k, 0.4% for AGIs $25k-50k, 1.3% for AGIs $50k-75k, 4.1% for AGIs $100k-200k, 3.5% for AGIs over 200k)
Net capital gain/loss in AGI: +$4,959 (reported on 3.9% of returns)
Here:
+$4,959
State:
+$10,406
(% of AGI for various income ranges: 8.7% for AGIs $100k-200k)
Profit/loss from business: +$12,840 (reported on 9.6% of returns)
Here:
+$12,840
State:
+$11,105
(% of AGI for various income ranges: 7.2% for AGIs below $25k, 1.7% for AGIs $25k-50k, 2.7% for AGIs $50k-75k, 19.5% for AGIs $100k-200k)
Taxable individual retirement arrangement distribution: $11,225 (reported on 4.6% of returns)
47713:
$11,225
Indiana:
$13,841
(% of AGI for various income ranges: 0.8% for AGIs below $25k, 1.2% for AGIs $25k-50k, 4.2% for AGIs $50k-75k, 9.0% for AGIs $100k-200k)
Total itemized deductions: $21,438 (21% of AGI, reported on 7.3% of returns)
Here:
$21,438
State:
$20,913
Here:
21.2% of AGI
State:
18.2% of AGI
(% of AGI for various income ranges: 1.8% for AGIs below $25k, 3.5% for AGIs $25k-50k, 5.2% for AGIs $50k-75k, 8.5% for AGIs $75k-100k, 14.4% for AGIs $100k-200k, 14.4% for AGIs over 200k)
Charity contributions: $5,360 (reported on 5.7% of returns)
Here:
$5,360
State:
$4,697
(% of AGI for various income ranges: 0.3% for AGIs below $25k, 0.6% for AGIs $25k-50k, 0.9% for AGIs $50k-75k, 2.3% for AGIs $75k-100k, 2.9% for AGIs $100k-200k, 2.8% for AGIs over 200k)
Taxes paid: $6,075 (reported on 7.3% of returns)
47713:
$6,075
State:
$7,456
(% of AGI for various income ranges: 0.2% for AGIs below $25k, 0.7% for AGIs $25k-50k, 1.5% for AGIs $50k-75k, 2.7% for AGIs $75k-100k, 4.4% for AGIs $100k-200k, 5.0% for AGIs over 200k)
Earned income credit: $2,379 (reported on 41.0% of returns)
Here:
$2,379
State:
$2,265
(% of AGI for various income ranges: 10.8% for AGIs below $25k, 1.6% for AGIs $25k-50k)
Percentage of individuals using paid preparers for their 2012 taxes: 54.0%
Here:
54%
State:
53%
(% for various income ranges: 52.1% for AGIs below $25k, 54.4% for AGIs $25k-50k, 60.0% for AGIs $50k-75k, 66.7% for AGIs $75k-100k, 71.4% for AGIs $100k-200k, 100.0% for AGIs over 200k)
Averages for the 2004 tax year for zip code 47713, filed in 2005:
Average Adjusted Gross Income (AGI) in 2004: $24,780 (Individual Income Tax Returns)
Here:
$24,780
State:
$44,790
Salary/wage: $22,165 (reported on 91.8% of returns)
Here:
$22,165
State:
$39,615
(% of AGI for various income ranges: 91.4% for AGIs below $10k, 88.2% for AGIs $10k-25k, 90.1% for AGIs $25k-50k, 85.8% for AGIs $50k-75k, 82.2% for AGIs $75k-100k, 57.1% for AGIs over 100k)
Taxable interest for individuals: $1,164 (reported on 18.4% of returns)
This zip code:
$1,164
Indiana:
$1,535
(% of AGI for various income ranges: 1.3% for AGIs below $10k, 0.6% for AGIs $10k-25k, 0.5% for AGIs $25k-50k, 0.2% for AGIs $50k-75k, 0.4% for AGIs $75k-100k, 2.2% for AGIs over 100k)
Taxable dividends: $3,090 (reported on 7.5% of returns)
Here:
$3,090
State:
$2,998
(% of AGI for various income ranges: 1.0% for AGIs below $10k, 0.3% for AGIs $10k-25k, 0.5% for AGIs $25k-50k, 1.0% for AGIs $50k-75k, 0.4% for AGIs $75k-100k, 2.3% for AGIs over 100k)
Net capital gain/loss: +$4,662 (reported on 5.3% of returns)
Here:
+$4,662
State:
+$8,619
(% of AGI for various income ranges: -0.3% for AGIs below $10k, 0.0% for AGIs $10k-25k, 0.1% for AGIs $25k-50k, 0.5% for AGIs $50k-75k, 0.1% for AGIs $75k-100k, 4.7% for AGIs over 100k)
Profit/loss from business: +$7,746 (reported on 7.6% of returns)
Here:
+$7,746
State:
+$10,071
(% of AGI for various income ranges: 3.2% for AGIs below $10k, 3.1% for AGIs $10k-25k, 1.3% for AGIs $25k-50k, 1.4% for AGIs $50k-75k, 1.2% for AGIs $75k-100k, 3.8% for AGIs over 100k)
IRA payment deduction: $2,234 (reported on 1.1% of returns)
47713:
$2,234
Indiana:
$2,840
Total itemized deductions: $14,524 (18% of AGI, reported on 10.7% of returns)
Here:
$14,524
State:
$17,065
Here:
18.4% of AGI
State:
19.5% of AGI
(% of AGI for various income ranges: 1.7% for AGIs below $10k, 2.6% for AGIs $10k-25k, 5.5% for AGIs $25k-50k, 9.2% for AGIs $50k-75k, 11.5% for AGIs $75k-100k, 9.7% for AGIs over 100k)
Charity contributions deductions: $3,680 (4% of AGI, reported on 8.6% of returns)
Here:
$3,680
State:
$3,550
Here:
4.3% of AGI
State:
3.8% of AGI
(% of AGI for various income ranges: 0.4% for AGIs $10k-25k, 0.8% for AGIs $25k-50k, 1.9% for AGIs $50k-75k, 2.3% for AGIs $75k-100k, 2.7% for AGIs over 100k)
Total tax: $4,155 (reported on 55.8% of returns)
47713:
$4,155
State:
$6,914
(% of AGI for various income ranges: 1.2% for AGIs below $10k, 3.5% for AGIs $10k-25k, 6.8% for AGIs $25k-50k, 9.8% for AGIs $50k-75k, 11.7% for AGIs $75k-100k, 21.9% for AGIs over 100k)
Earned income credit: $1,751 (reported on 38.7% of returns)
Here:
$1,751
State:
$1,685
Percentage of individuals using paid preparers for their 2004 taxes: 68.7%
Here:
69%
State:
59%
(% for various income ranges: 65.4% for AGIs below $10k, 70.2% for AGIs $10k-25k, 69.5% for AGIs $25k-50k, 74.4% for AGIs $50k-75k, 59.3% for AGIs $75k-100k, 81.8% for AGIs over 100k)
Likely homosexual households (counted as self-reported same-sex unmarried-partner households)
Lesbian couples: 1.0% of all households
Gay men: 0.1% of all households
Household received Food Stamps/SNAP in the past 12 months: 1,153 Household did not receive Food Stamps/SNAP in the past 12 months: 3,600
Women who had a birth in the past 12 months: 101 (34 now married, 59 unmarried) Women who did not have a birth in the past 12 months: 2,213 (477 now married, 1,727 unmarried)
Housing units in zip code 47713 with a mortgage: 976 (69 second mortgage, 71 both second mortgage and home equity loan) Houses without a mortgage: 188
Median monthly owner costs for units with a mortgage: $823 Median monthly owner costs for units without a mortgage: $474
Residents with income below the poverty level in 2022:
This zip code:
30.5%
Whole state:
12.6%
Residents with income below 50% of the poverty level in 2022:
This zip code:
15.6%
Whole state:
6.3%
Median number of rooms in houses and condos:
Here:
6.4
State:
6.6
Median number of rooms in apartments:
Here:
4.1
State:
4.3
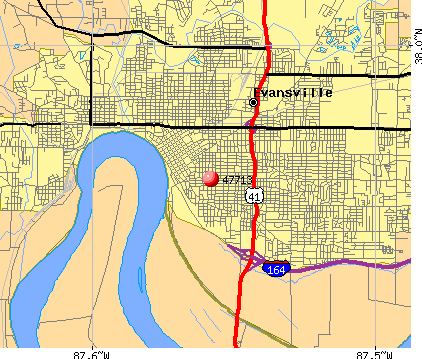
Notable locations in this zip code not listed on our city pages
Notable locations in zip code 47713: Evansville Fire Department Station 1 (A), Select Specialty Hospital Evansville Campus (B). Display/hide their locations on the map
In group quarters: 376 (-1 institutionalized population)
Size of family households: 1,073 2-persons, 525 3-persons, 381 4-persons, 168 5-persons, 147 6-persons, 21 7-or-more-persons
Size of nonfamily households: 2,031 1-person, 391 2-persons, 3 3-persons
574 married couples with children.
996 single-parent households (315 men, 681 women).
95.6% of residents of 47713 zip code speak English at home.
2.1% of residents speak Spanish at home (74% very well, 10% well, 16% not well).
1.1% of residents speak other Indo-European language at home (5% very well, 91% well, 4% not well).
0.1% of residents speak Asian or Pacific Island language at home (100% very well).
0.6% of residents speak other language at home (70% very well, 30% not well).
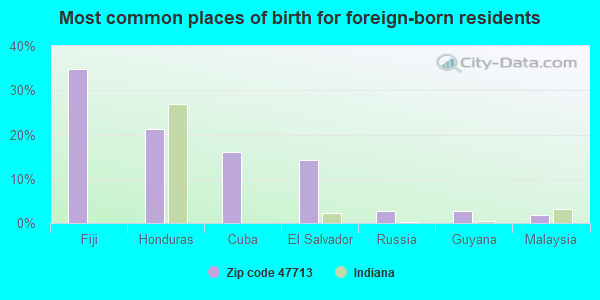
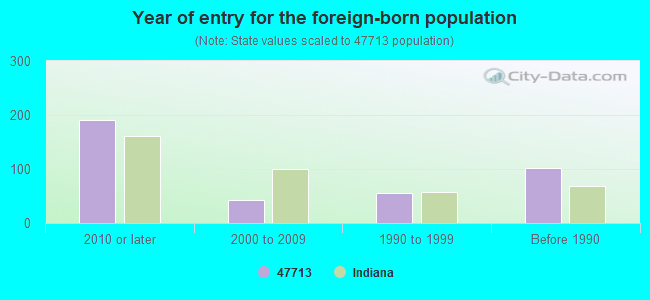
Foreign born population: 383 (4.0%) (33.6% of them are naturalized citizens)
Facilities with environmental interests located in this zip code:
M & J HANDWASH & DETAIL (101 E WALNUT ST in EVANSVILLE, IN)
AIR MINOR (AIRS/AFS) STATE MASTER (Indiana facility tracking) - UST-22314, UNDERGROUND STORAGE TANK PROGRAM (Resource Conservation and Recovery Act (tracking hazardous waste)) Business SIC classification: NONCLASSIFIABLE ESTABLISHMENTS Organizations: RJJ LIMITED INC (CONTACT/OWNER)
Alternative names: HOOSIER AUTOMOTIVE, PRECISION TRANSMISSION
CRESCENT CLEANERS (668 LINCOLN AVE in EVANSVILLE, IN)
SUPERFUND (Superfund database) (Integrated Compliance Information System) - ICIS-05-2005-0619, FORMAL ENFORCEMENT ACTION, ENFORCEMENT/COMPLIANCE ACTIVITY STATE MASTER (Indiana facility tracking) (Resource Conservation and Recovery Act (tracking hazardous waste)) Organizations: MANIS JAYNE AND AMOS D (CONTACT/OWNER)
Alternative names: CRESCENT CLEANERS SITE
CARVER COMMUNITY ORGANIZATION (400 SE EIGHTH ST in EVANSVILLE, IN)
STATE MASTER (Indiana facility tracking) - LUST-199403535, LEAKING STORAGE TANK, UST-18851, UNDERGROUND STORAGE TANK PROGRAM (Resource Conservation and Recovery Act (tracking hazardous waste)) Organizations: SWANSON NUNN DIV ST GRP INTL LTD (CONTACT/OWNER)
Alternative names: SWANSON NUNN DIV ST GRP INTL LTD
LINCOLN ELEMENTARY SCHOOL (635 LINCOLN AVE in EVANSVILLE, IN)
(National Center for Education Statistics) - STATE ID-8251 Organizations: EVANSVILLE-VANDERBURGH SCH CORP (SCHOOL DISTRICT)
COASTAL TANK LINES INC (1905 SHADEWOOD in EVANSVILLE, IN)
STATE MASTER (Indiana facility tracking) (Resource Conservation and Recovery Act (tracking hazardous waste)) Organizations: AL MORRIS (CONTACT/OWNER)
SCHULZE PRINTING (104 S HEIDELBACH in EVANSVILLE, IN)
STATE MASTER (Indiana facility tracking) (Resource Conservation and Recovery Act (tracking hazardous waste)) Organizations: MARKS BONNIE J (CONTACT/OWNER)
CARVER DAY CARE 82 (100 E WALNUT ST in EVANSVILLE, IN)
STATE MASTER (Indiana facility tracking) COMPLIANCE ACTIVITY (Tracking inspections of insecticide, fungicide, and rodenticide, and toxic substances)
PRO TEX ALL CO (210 S MORTON AVE in EVANSVILLE, IN)
COMPLIANCE ACTIVITY (Tracking inspections of insecticide, fungicide, and rodenticide, and toxic substances)
Housing units lacking complete plumbing facilities: 6.8% Housing units lacking complete kitchen facilities: 5.4%
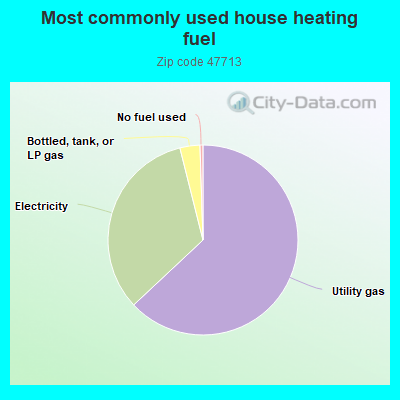
62.9%Utility gas
33.0%Electricity
3.4%Bottled, tank, or LP gas
0.5%No fuel used
Population in 1990: 14,121.
Place of birth for U.S.-born residents:
This state: 6,299
Northeast: 164
Midwest: 1,192
South: 1,180
West: 411
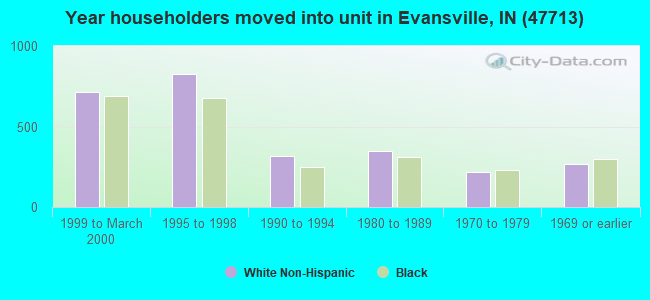
48% of the 47713 zip code residents lived in the same house 5 years ago. Out of people who lived in different houses, 72% lived in this county. Out of people who lived in different counties, 50% lived in Indiana.
84% of the 47713 zip code residents lived in the same house 1 year ago. Out of people who lived in different houses, 72% moved from this county. Out of people who lived in different houses, 10% moved from different county within same state. Out of people who lived in different houses, 14% moved from different state.
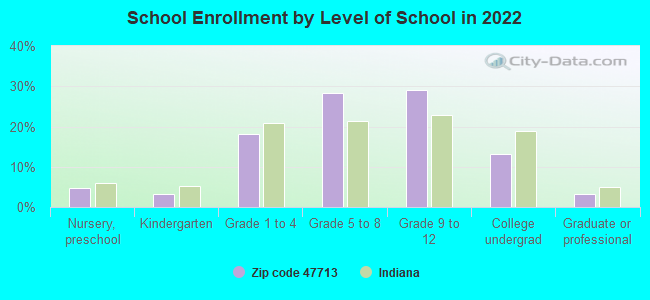
Private vs. public school enrollment:
Students in private schools in grades 1 to 8 (elementary and middle school): 145
Here:
16.2%
Indiana:
14.9%
Students in private schools in grades 9 to 12 (high school): 54
Here:
9.6%
Indiana:
11.4%
Students in private undergraduate colleges: 61
Here:
23.7%
Indiana:
22.3%
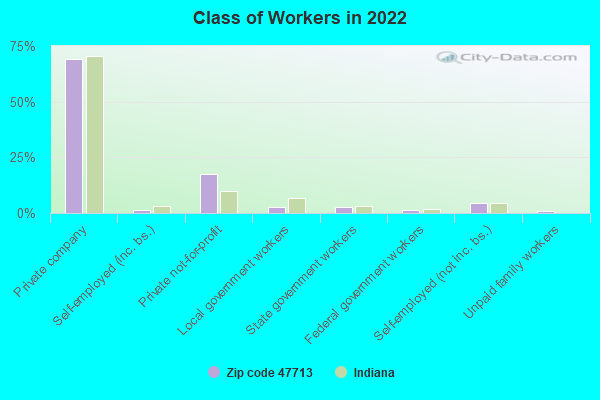
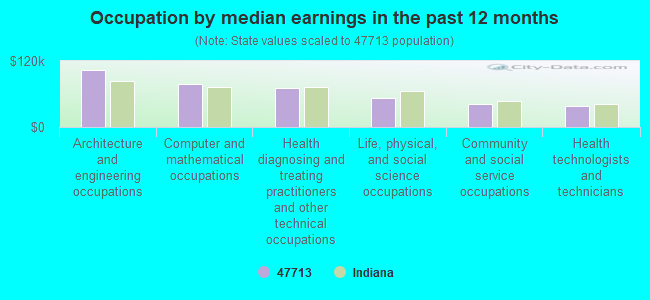
Occupation by median earnings in the past 12 months ($)
104,398Architecture and engineering occupations
77,372Computer and mathematical occupations
70,485Health diagnosing and treating practitioners and other technical occupations
53,571Life, physical, and social science occupations
41,546Community and social service occupations
38,427Health technologists and technicians
Companies with federal contracts located in this zip code (EVANSVILLE, IN):
FACILITY MANAGEMENT & ENGINEER (842 BAYARD PARK DRIVE; small business) : $1,060,970 in 15 contractsfrom 2005 to 2006
Contracts for Maintenance, Repair or Alteration of Real Property -- Miscellaneous Buildings, Construction of Structures and Facilities -- Production Buildings, Maintenance, Repair or Alteration of Real Property -- Ammunition Facilities, Maintenance, Repair or Alteration of Real Property -- Ammunition Storage Buildings, and moreby Navy, Army Signed by year:2000: $0; 2001: $0; 2002: $0; 2003: $0; 2004: $0; 2005: $752,933; 2006: $308,037.
Biggest contracts:
$277,028 with Navy for Maintenance, Repair or Alteration of Real Property -- Miscellaneous Buildings. Signed on 2005-07-08. Completion date: 2005-09-30.
$154,523 with Army for Maintenance, Repair or Alteration of Real Property -- Miscellaneous Buildings. Taking place in MO. Signed on 2005-09-30. Completion date: 2005-09-29.
$116,228 with Navy for Construction of Structures and Facilities -- Production Buildings. Signed on 2005-08-24. Completion date: 2005-11-03.
$111,191 with Navy for Maintenance, Repair or Alteration of Real Property -- Ammunition Facilities. Signed on 2005-10-31. Completion date: 2005-11-30.
CK UNITED SHEET METAL & MECHAN (5 EAST RIVERSIDE DRIVE; small business) : $444,058 in 18 contractsfrom 2001 to 2006
Contracts for Maintenance, Repair or Alteration of Real Property -- Miscellaneous Buildings, Miscellaneous Construction Materials, Maintenance, Repair or Alteration of Real Property -- Other Administrative Facilities and Service Buildings, Building Components, Prefabricated, and moreby Navy, Air Force, Army, Bureau of Prisoners/Federal Prison System, and others Signed by year:2000: $0; 2001: $174,456; 2002: $58,407; 2003: $0; 2004: $80,919; 2005: $15,844; 2006: $114,432.
Biggest contracts:
$86,472 with Navy for Maintenance, Repair or Alteration of Real Property -- Miscellaneous Buildings. Signed on 2001-04-17. Completion date: 2001-06-08.
$72,400 with Air Force for Miscellaneous Construction Materials. Taking place in NV. Signed on 2006-05-03. Completion date: 2006-05-12.
$60,337 with Army for Maintenance, Repair or Alteration of Real Property -- Other Administrative Facilities and Service Buildings. Signed on 2001-09-26. Completion date: 2001-12-31.
$51,611 with Bureau of Prisoners/Federal Prison System for Building Components, Prefabricated. Taking place in FL. Signed on 2004-04-19. Completion date: 2004-05-19.
WILDERMAN & ASSOCIATES INC (20 SHAWNEE DR; small business) : $31,212 in 2 contractsin 2005
$15,720 with Navy for Architect - Engineer Services (including landscaping, interior layout, and designing). Signed on 2005-04-20. Completion date: 2005-05-02.
$15,492, same as above.Signed on 2005-03-15. Completion date: 2005-05-02.
OHIO VALLEY COMMUNICATIONS, IN (20 EAST SYCAMORE STREET; small business) : $28,242 in 4 contractsfrom 2003 to 2004
$18,529 with Army for Miscellaneous Communication Equipment. Signed on 2003-05-22. Completion date: 2003-06-20.
$4,960, same as above.Signed on 2003-09-18. Completion date: 2003-06-20.
$2,779 with Army for Modification of Equipment -- Alarm, Signal, and Security Detection Systems. Signed on 2004-07-23. Completion date: 2004-08-05.
$1,974 with Army for Miscellaneous Communication Equipment. Signed on 2003-08-01. Completion date: 2003-06-20.
Top industries in this zip code by the number of employees in 2005:
Health Care and Social Assistance: Offices of Physicians (except Mental Health Specialists) (500-999 employees: 1 establishment, 50-99 employees: 1 establishment, 10-19 employees: 1 establishment)
Administrative and Support and Waste Management and Remediation Services: Investigation Services (250-499: 1)
Information: Newspaper Publishers (250-499: 1)
Health Care and Social Assistance: Nursing Care Facilities (50-99: 3)
Health Care and Social Assistance: Services for the Elderly and Persons with Disabilities (100-249: 1, 10-19: 1)
Health Care and Social Assistance: Child Day Care Services (20-49: 3, 10-19: 4, 5-9: 1, 1-4: 5)
Administrative and Support and Waste Management and Remediation Services: Temporary Help Services (100-249: 1, 1-4: 1)
Health Care and Social Assistance: Outpatient Mental Health and Substance Abuse Centers (50-99: 1, 20-49: 1, 10-19: 3, 5-9: 1)
Other Services (except Public Administration): Religious Organizations (20-49: 1, 10-19: 5, 5-9: 6, 1-4: 3)
Administrative and Support and Waste Management and Remediation Services: Janitorial Services (50-99: 1, 20-49: 1, 10-19: 1, 5-9: 1, 1-4: 2)
People in group quarters in 2010:
216 people in nursing facilities/skilled-nursing facilities
198 people in emergency and transitional shelters (with sleeping facilities) for people experiencing homelessness
168 people in other noninstitutional facilities
22 people in correctional facilities intended for juveniles
14 people in group homes intended for adults
People in group quarters in 2000:
165 people in other noninstitutional group quarters
124 people in nursing homes
30 people in orthopedic wards and institutions for the physically handicapped
20 people in homes for the mentally ill
9 people in short-term care, detention or diagnostic centers for delinquent children
7 people in homes for the mentally retarded
7 people in other group homes
Fatal accident statistics in 2012:
Fatal accident count: 2
Vehicles involved in fatal accidents: 3
Fatal accidents caused by drunken drivers: 1
Fatalities: 2
Persons involved in fatal accidents: 4
Pedestrians involved in fatal accidents: 0
Fatal accident statistics in 2011:
Fatal accident count: 1
Vehicles involved in fatal accidents: 1
Fatal accidents caused by drunken drivers: 0
Fatalities: 1
Persons involved in fatal accidents: 2
Pedestrians involved in fatal accidents: 0
Home Mortgage Disclosure Act Aggregated Statistics For Year 2009 (Based on 7 full and 8 partial tracts)
A) FHA, FSA/RHS & VA Home Purchase Loans
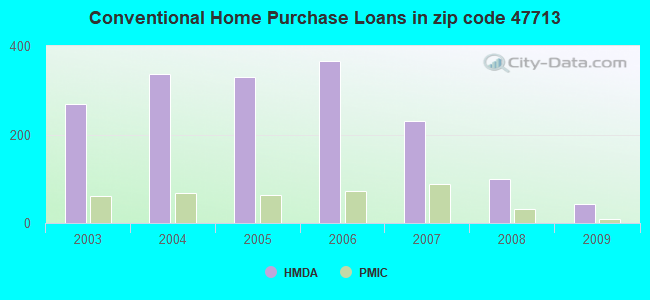
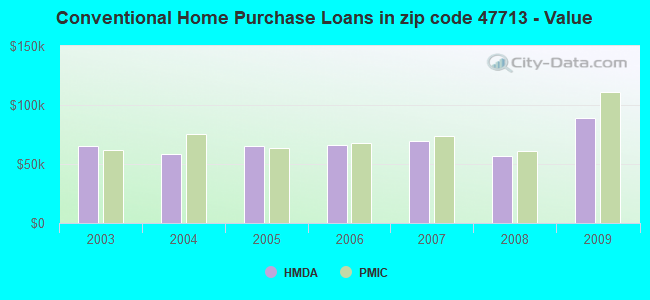
B) Conventional Home Purchase Loans
C) Refinancings
D) Home Improvement Loans
E) Loans on Dwellings For 5+ Families
F) Non-occupant Loans on < 5 Family Dwellings (A B C & D)
G) Loans On Manufactured Home Dwelling (A B C & D)
Number
Average Value
Number
Average Value
Number
Average Value
Number
Average Value
Number
Average Value
Number
Average Value
Number
Average Value
LOANS ORIGINATED
46
$67,785
43
$88,800
163
$84,483
22
$14,737
9
$467,137
69
$71,035
1
$80,690
APPLICATIONS APPROVED, NOT ACCEPTED
5
$62,184
6
$74,082
17
$107,799
4
$5,398
0
$0
4
$204,618
0
$0
APPLICATIONS DENIED
13
$61,047
20
$76,637
148
$77,021
32
$24,451
4
$501,945
20
$51,196
0
$0
APPLICATIONS WITHDRAWN
8
$89,964
2
$89,710
53
$85,855
5
$71,440
0
$0
5
$65,132
0
$0
FILES CLOSED FOR INCOMPLETENESS
1
$106,960
0
$0
5
$146,362
2
$12,760
0
$0
0
$0
0
$0
Aggregated Statistics For Year 2008 (Based on 7 full and 8 partial tracts)
A) FHA, FSA/RHS & VA Home Purchase Loans
B) Conventional Home Purchase Loans
C) Refinancings
D) Home Improvement Loans
E) Loans on Dwellings For 5+ Families
F) Non-occupant Loans on < 5 Family Dwellings (A B C & D)
G) Loans On Manufactured Home Dwelling (A B C & D)
Number
Average Value
Number
Average Value
Number
Average Value
Number
Average Value
Number
Average Value
Number
Average Value
Number
Average Value
LOANS ORIGINATED
46
$83,393
99
$56,765
192
$75,474
52
$26,078
13
$572,873
127
$69,725
1
$13,000
APPLICATIONS APPROVED, NOT ACCEPTED
3
$50,297
4
$39,840
25
$63,813
4
$18,130
0
$0
4
$35,640
0
$0
APPLICATIONS DENIED
18
$90,392
40
$56,060
219
$79,142
42
$29,148
4
$653,158
23
$72,867
3
$41,077
APPLICATIONS WITHDRAWN
5
$49,158
12
$96,277
86
$78,640
5
$40,138
2
$523,320
10
$53,664
0
$0
FILES CLOSED FOR INCOMPLETENESS
0
$0
3
$49,733
11
$77,659
2
$58,475
0
$0
3
$54,930
0
$0
Aggregated Statistics For Year 2007 (Based on 7 full and 8 partial tracts)
A) FHA, FSA/RHS & VA Home Purchase Loans
B) Conventional Home Purchase Loans
C) Refinancings
D) Home Improvement Loans
E) Loans on Dwellings For 5+ Families
F) Non-occupant Loans on < 5 Family Dwellings (A B C & D)
G) Loans On Manufactured Home Dwelling (A B C & D)
Number
Average Value
Number
Average Value
Number
Average Value
Number
Average Value
Number
Average Value
Number
Average Value
Number
Average Value
LOANS ORIGINATED
25
$71,291
231
$69,112
263
$64,091
90
$30,613
9
$1,088,842
189
$54,405
1
$55,880
APPLICATIONS APPROVED, NOT ACCEPTED
3
$47,330
28
$80,257
53
$70,972
13
$34,758
0
$0
23
$50,639
1
$68,540
APPLICATIONS DENIED
16
$58,361
83
$63,907
281
$75,880
99
$30,322
0
$0
61
$62,599
2
$65,550
APPLICATIONS WITHDRAWN
6
$122,280
31
$70,421
106
$69,887
11
$49,432
0
$0
23
$63,167
0
$0
FILES CLOSED FOR INCOMPLETENESS
0
$0
10
$61,131
21
$63,718
0
$0
0
$0
2
$39,500
0
$0
Aggregated Statistics For Year 2006 (Based on 7 full and 8 partial tracts)
A) FHA, FSA/RHS & VA Home Purchase Loans
B) Conventional Home Purchase Loans
C) Refinancings
D) Home Improvement Loans
E) Loans on Dwellings For 5+ Families
F) Non-occupant Loans on < 5 Family Dwellings (A B C & D)
G) Loans On Manufactured Home Dwelling (A B C & D)
Number
Average Value
Number
Average Value
Number
Average Value
Number
Average Value
Number
Average Value
Number
Average Value
Number
Average Value
LOANS ORIGINATED
22
$62,302
366
$65,819
271
$73,356
70
$58,737
10
$433,484
251
$65,428
2
$52,835
APPLICATIONS APPROVED, NOT ACCEPTED
2
$76,050
38
$65,905
58
$87,883
9
$50,680
0
$0
11
$47,057
1
$65,770
APPLICATIONS DENIED
17
$69,688
114
$59,482
359
$76,278
77
$32,133
2
$446,120
76
$55,283
4
$32,640
APPLICATIONS WITHDRAWN
11
$75,635
52
$62,273
189
$87,271
10
$63,708
2
$598,080
18
$68,411
0
$0
FILES CLOSED FOR INCOMPLETENESS
0
$0
12
$67,138
57
$101,955
3
$51,273
0
$0
14
$72,809
0
$0
Aggregated Statistics For Year 2005 (Based on 7 full and 8 partial tracts)
A) FHA, FSA/RHS & VA Home Purchase Loans
B) Conventional Home Purchase Loans
C) Refinancings
D) Home Improvement Loans
E) Loans on Dwellings For 5+ Families
F) Non-occupant Loans on < 5 Family Dwellings (A B C & D)
G) Loans On Manufactured Home Dwelling (A B C & D)
Number
Average Value
Number
Average Value
Number
Average Value
Number
Average Value
Number
Average Value
Number
Average Value
Number
Average Value
LOANS ORIGINATED
32
$67,828
331
$65,270
408
$65,787
73
$29,248
9
$669,572
256
$54,870
2
$87,775
APPLICATIONS APPROVED, NOT ACCEPTED
4
$56,440
67
$66,459
70
$67,486
5
$14,990
0
$0
21
$48,398
4
$43,155
APPLICATIONS DENIED
7
$53,453
168
$53,498
475
$64,512
112
$22,990
3
$531,883
72
$49,669
19
$47,756
APPLICATIONS WITHDRAWN
2
$57,360
46
$82,037
190
$73,740
49
$78,953
0
$0
23
$62,325
1
$53,540
FILES CLOSED FOR INCOMPLETENESS
2
$37,345
24
$55,436
48
$92,302
3
$39,333
0
$0
18
$75,899
0
$0
Aggregated Statistics For Year 2004 (Based on 7 full and 8 partial tracts)
A) FHA, FSA/RHS & VA Home Purchase Loans
B) Conventional Home Purchase Loans
C) Refinancings
D) Home Improvement Loans
E) Loans on Dwellings For 5+ Families
F) Non-occupant Loans on < 5 Family Dwellings (A B C & D)
G) Loans On Manufactured Home Dwelling (A B C & D)
Number
Average Value
Number
Average Value
Number
Average Value
Number
Average Value
Number
Average Value
Number
Average Value
Number
Average Value
LOANS ORIGINATED
40
$73,019
337
$58,838
466
$64,419
83
$23,707
14
$245,061
264
$58,064
3
$38,870
APPLICATIONS APPROVED, NOT ACCEPTED
0
$0
31
$49,995
88
$70,372
6
$41,720
0
$0
19
$63,995
4
$43,820
APPLICATIONS DENIED
9
$57,526
112
$56,515
431
$66,612
88
$21,980
1
$53,000
81
$57,860
11
$41,135
APPLICATIONS WITHDRAWN
3
$59,643
33
$51,751
193
$72,351
38
$52,448
1
$64,000
19
$64,239
0
$0
FILES CLOSED FOR INCOMPLETENESS
0
$0
12
$50,964
30
$76,619
0
$0
0
$0
3
$38,310
0
$0
Aggregated Statistics For Year 2003 (Based on 7 full and 8 partial tracts)
A) FHA, FSA/RHS & VA Home Purchase Loans
B) Conventional Home Purchase Loans
C) Refinancings
D) Home Improvement Loans
E) Loans on Dwellings For 5+ Families
F) Non-occupant Loans on < 5 Family Dwellings (A B C & D)
2003 - 2018 National Fire Incident Reporting System (NFIRS) incidents
Based on the data from the years 2003 - 2018 the average number of fires per year is 63. The highest number of fire incidents - 119 took place in 2003, and the least - 0 in 2014. The data has a decreasing trend.
When looking into fire subcategories, the most reports belonged to: Structure Fires (48.4%), and Outside Fires (36.7%).
Fire incident types reported to NFIRS in Zip Code 47713
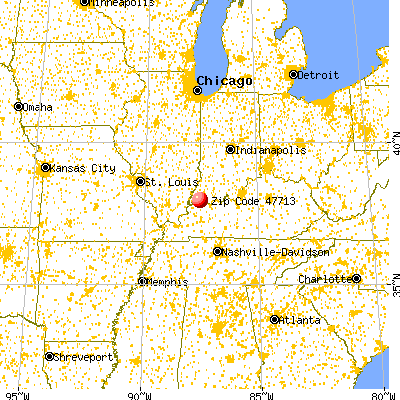


 Nearest zip codes: 47708, 47714, 47711, 47710, 47715, 47712.
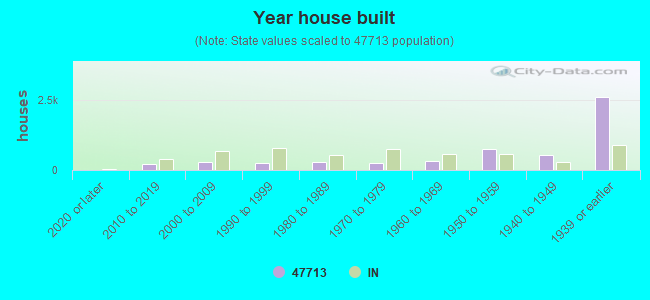


 Based on the data from the years 2003 - 2018 the average number of fires per year is 63. The highest number of fire incidents - 119 took place in 2003, and the least - 0 in 2014. The data has a decreasing trend.
 When looking into fire subcategories, the most reports belonged to: Structure Fires (48.4%), and Outside Fires (36.7%).