Culver neighborhood in Evansville, Indiana (IN), 47713 detailed profile
Settings
X

Business Search - 14 Million verified businesses
Area: 0.240 square miles
Population: 1,163
Population density:
| Culver: | 4,855 people per square mile |
| Evansville: | 2,912 people per square mile |

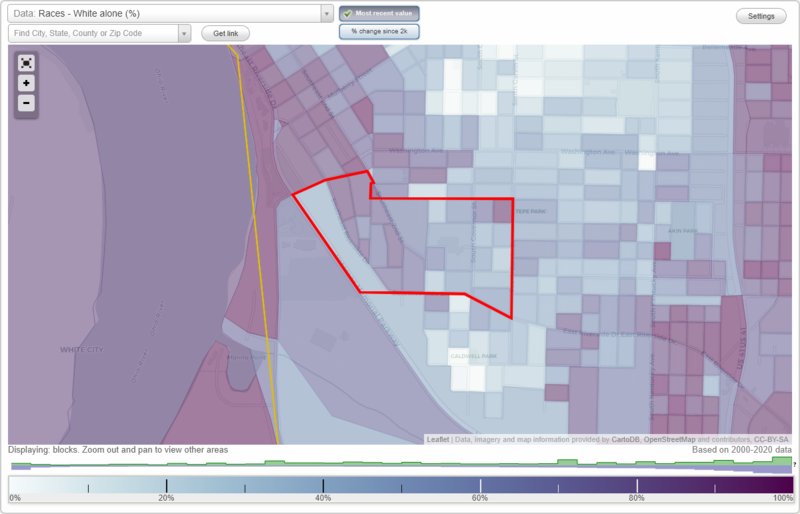
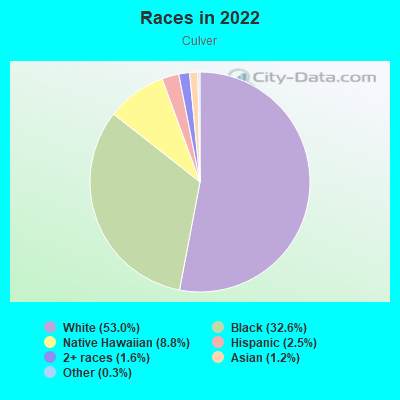
- 68453.0%White
- 42132.6%Black
- 1138.8%Native Hawaiian and Other
Pacific Islander - 322.5%Hispanic or Latino
- 201.6%Two or more races
- 161.2%Asian
- 40.3%Some other race
Median household income in 2022:
| Culver: | $27,280 |
| Evansville: | $48,127 |
Distribution of median household income
![Distribution of median household income]()
- 56Less than $10,000
- 166$10,000 to $19,999
- 53$20,000 to $29,999
- 71$30,000 to $39,999
- 74$40,000 to $49,999
- 52$50,000 to $59,999
- 44$60,000 to $74,999
- 52$75,000 to $99,999
- 22$100,000 to $124,999
- 39$125,000 to $149,999
- 13$150,000 to $199,999
- 11$200,000 or more

Distribution of owner-occupied house/condo value
![Distribution of owner-occupied house/condo value]()
- 80Less than $50,000
- 167$50,000 to $99,999
- 71$100,000 to $149,999
- 74$150,000 to $199,999
- 19$200,000 to $249,999
- 24$250,000 to $299,999
- 39$300,000 to $399,999
- 6$400,000 to $499,999
- 4$500,000 to $749,999
- 6$750,000 to $999,999

Distribution of rent paid by renters
![Distribution of rent paid by renters]()
- 18Less than $100
- 22$100 to $199
- 29$200 to $299
- 54$300 to $399
- 45$400 to $499
- 44$500 to $599
- 109$600 to $699
- 17$700 to $799
- 13$800 to $899
- 27$900 to $999
- 22$1,000 to $1,249
- 8$1,250 to $1,499
- 45$1,500 to $1,999

Median rent in 2022:
| Culver: | $577 |
| Evansville: | $691 |
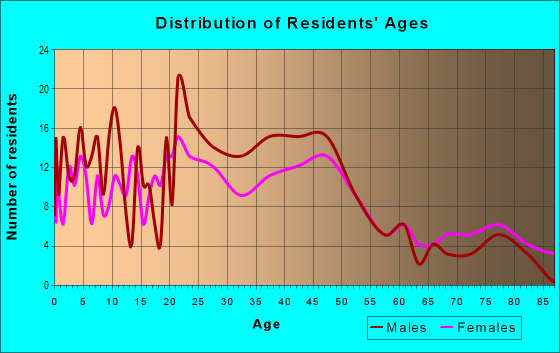
| Males: | 558 |
| Females: | 605 |
Males:
| This neighborhood: | 50.7 years |
| Whole city: | 36.6 years |
| This neighborhood: | 47.7 years |
| Whole city: | 38.9 years |
Average household size:
| Culver: | 1.6 people |
| Evansville: | 2.1 people |
Percentage of family households:
| Culver: | 31.3% |
| Evansville: | 38.3% |
| Here: | 20.4% |
| Evansville: | 33.7% |
Percentage of married-couple families with children (among all households):
| Culver: | 23.8% |
| Evansville: | 25.3% |
Percentage of single-mother households (among all households):
| Culver: | 36.6% |
| Evansville: | 15.6% |
Percentage of never married males 15 years old and over:
Percentage of never married females 15 years old and over:
| Culver: | 21.9% |
| Evansville: | 19.5% |
Percentage of never married females 15 years old and over:
| Culver: | 19.2% |
| city: | 17.0% |
Percentage of people that speak English not well or not at all:
| Culver: | 0.3% |
| Evansville: | 0.7% |
Percentage of people born in this state:
Percentage of people born in another U.S. state:
Percentage of native residents but born outside the U.S.:
Percentage of foreign born residents:
| Here: | 48.4% |
| Evansville: | 70.5% |
Percentage of people born in another U.S. state:
| Culver: | 44.0% |
| Evansville: | 25.5% |
Percentage of native residents but born outside the U.S.:
| Here: | 0.2% |
| city: | 0.8% |
Percentage of foreign born residents:
| Here: | 7.6% |
| Evansville: | 3.2% |
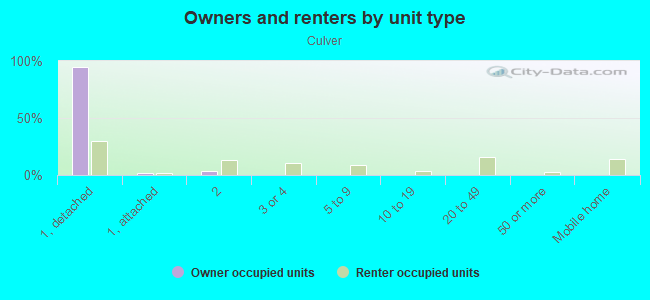
Owner-occupied
Renter-occupied

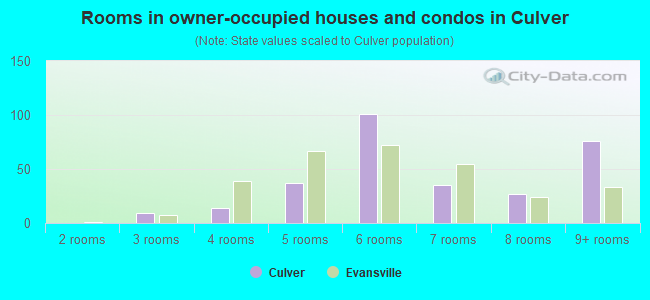
- Rooms in owner-occupied houses and condos in Culver
- 01 room
- 02 rooms
- 93 rooms
- 144 rooms
- 375 rooms
- 1016 rooms
- 357 rooms
- 278 rooms
- 769+ rooms
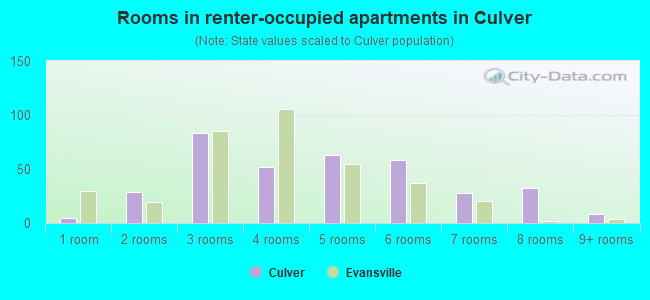
- Rooms in renter-occupied apartments in Culver
- 51 room
- 292 rooms
- 833 rooms
- 524 rooms
- 635 rooms
- 586 rooms
- 287 rooms
- 328 rooms
- 89+ rooms
Owner-occupied
Renter-occupied
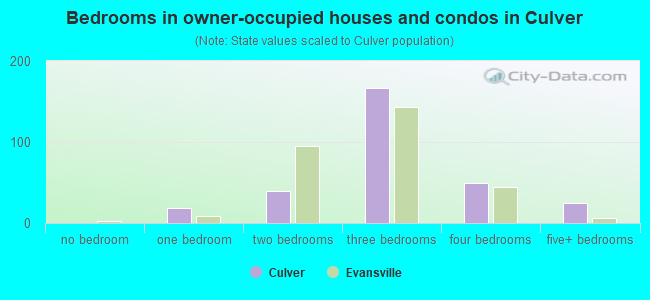
- Bedrooms in owner-occupied houses and condos in Culver
- 0no bedroom
- 181 bedroom
- 402 bedrooms
- 1673 bedrooms
- 504 bedrooms
- 255+ bedrooms
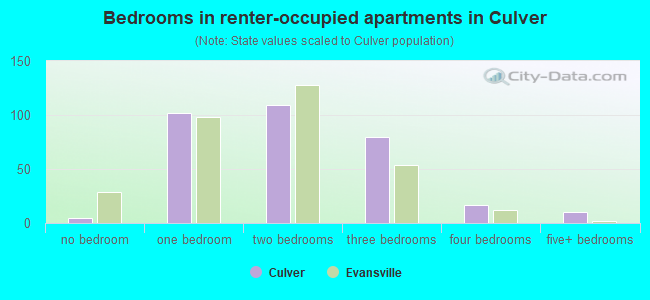
- Bedrooms in renter-occupied apartments in Culver
- 5no bedroom
- 1021 bedroom
- 1092 bedrooms
- 803 bedrooms
- 174 bedrooms
- 105+ bedrooms
Average number of cars or other vehicles available in houses/condos:
Average number of cars or other vehicles available in apartments:
| This neighborhood: | 2.0 |
| Evansville: | 1.8 |
Average number of cars or other vehicles available in apartments:
| Here: | 1.1 |
| city: | 1.1 |
Percentage of units with a mortgage:
| Culver: | 61.5% |
| Evansville: | 58.5% |
Average estimated value of detached houses in 2022 (58.9% of all units):
| Culver: | $112,709 |
| Indiana: | $257,916 |
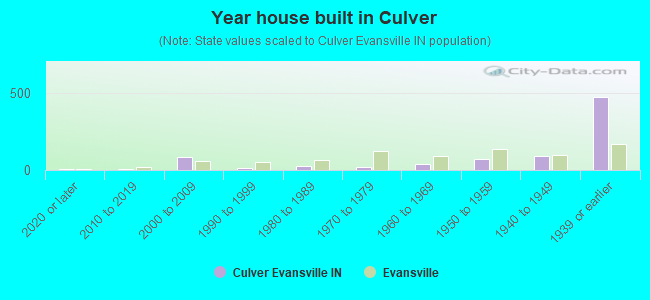
- Year house built in Culver
- 82020 or later
- 62010 to 2019
- 882000 to 2009
- 131990 to 1999
- 241980 to 1989
- 171970 to 1979
- 381960 to 1969
- 691950 to 1959
- 901940 to 1949
- 4741939 or earlier
City-data.com crime index for city in 2020 (higher means more crime):
| City: | 440.8 |
| U.S. average: | 219.5 |
Travel time to work (commute)
![Travel time to work (commute)]()
- 7Less than 5 minutes
- 1025 to 9 minutes
- 7210 to 14 minutes
- 12715 to 19 minutes
- 10620 to 24 minutes
- 1025 to 29 minutes
- 1130 to 34 minutes
- 1735 to 39 minutes
- 1540 to 44 minutes
- 5545 to 59 minutes
- 2060 to 89 minutes
- 1290 or more minutes

Means of transportation to work
![Means of transportation to work]()
- 78.6%464Drove a car alone
- 4.2%25Carpooled
- 5.3%31Bus
- 1.5%9Bicycle
- 0.3%2Walked
- 6.4%38Other means
- 8.3%49Worked at home

Time leaving home to go to work
![Time leaving home to go to work]()
- 6312:00 a.m. to 4:59 a.m.
- 215:00 a.m. to 5:29 a.m.
- 375:30 a.m. to 5:59 a.m.
- 216:00 a.m. to 6:29 a.m.
- 896:30 a.m. to 6:59 a.m.
- 207:00 a.m. to 7:29 a.m.
- 647:30 a.m. to 7:59 a.m.
- 238:00 a.m. to 8:29 a.m.
- 228:30 a.m. to 8:59 a.m.
- 269:00 a.m. to 9:59 a.m.
- 2110:00 a.m. to 10:59 a.m.
- 3511:00 a.m. to 11:59 a.m.
- 8412:00 p.m. to 3:59 p.m.
- 394:00 p.m. to 11:59 p.m.

Occupations of males:
- Percentage of males in management occupations (except farmers):
Here: 4.2% city: 8.4%
- Percentage of males in business and financial operations occupations:
Here: 10.9% city: 3.1%
- Percentage of males in computer and mathematical occupations:
Here: 4.8% city: 3.0%
- Percentage of males in architecture and engineering occupations:
Here: 1.0% city: 3.0%
- Percentage of males in legal occupations:
Here: 1.4% city: 0.2%
- Percentage of males in arts, design, entertainment, sports, and media occupations:
Here: 3.7% city: 1.4%
- Percentage of males in service occupations:
Here: 20.9% city: 15.9%
- Percentage of males in sales and office occupations:
Here: 20.8% city: 14.7%
- Percentage of males in construction, extraction, and maintenance occupations:
Here: 2.8% city: 7.3%
- Percentage of males in production occupations:
Here: 17.2% city: 14.9%
- Percentage of males in transportation occupations:
Here: 6.2% city: 7.3%
- Percentage of males in material moving occupations:
Here: 6.1% city: 8.2%
Occupations of females:
- Percentage of females in management occupations (except farmers):
Here: 6.4% city: 6.4%
- Percentage of females in community and social services occupations:
Here: 3.0% city: 2.7%
- Percentage of females in education, training, and library occupations:
Here: 7.3% city: 5.7%
- Percentage of females in arts, design, entertainment, sports, and media occupations:
Here: 3.0% city: 1.3%
- Percentage of females in healthcare practitioners and technical occupations:
Here: 13.5% city: 8.9%
- Percentage of females in service occupations:
Here: 31.5% city: 26.1%
- Percentage of females in sales and office occupations:
Here: 21.1% city: 30.9%
- Percentage of females in production occupations:
Here: 11.0% city: 5.3%
- Percentage of females in transportation occupations:
Here: 1.5% city: 1.3%
- Percentage of females in material moving occupations:
Here: 1.5% city: 3.1%
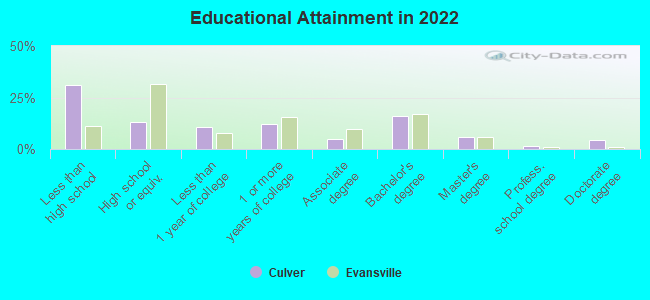
Education in this neighborhood (subdivision or community):
- Percentage of people 3 years and older in K-12 schools:
Culver: 15.4% Evansville: 15.5%
- Percentage of people 3 years and older in undergraduate colleges:
Culver: 5.9% Evansville: 5.1%
- Percentage of people 3 years and older in grad. or professional schools:
Culver: 3.3% Evansville: 0.8%
- Percentage of students K-12 enrolled in private schools:
Culver: 62.4% Evansville: 15.2%
Percentage of population below poverty level:
| Culver: | 28.8% |
| Evansville: | 19.3% |
Median year renter moved in (as recorded in 2022):
| Culver: | 2015 |
| Evansville: | 2020 |
Percentage of married-couple families with both working:
| Culver: | 208.3% |
| Evansville: | 71.5% |
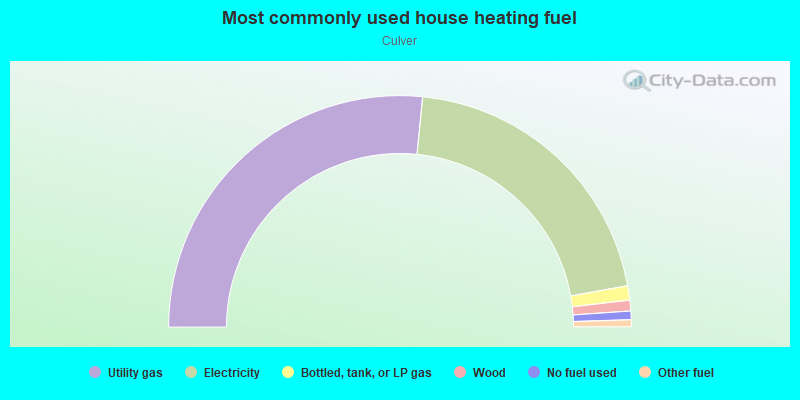
- 53.2%Utility gas
- 41.2%Electricity
- 2.0%Bottled, tank, or LP gas
- 1.5%Wood
- 1.2%No fuel used
- 1.0%Other fuel
Roads and streets:
Monroe Ave
Length: 0.61 miles
Direction: E-W
Address range: 16 to 599
Direction: E-W
Address range: 16 to 599
Taylor Ave
Length: 0.52 miles
Directions: E-W, SW-NE
Address range: 1 to 599
Directions: E-W, SW-NE
Address range: 1 to 599
E Riverside Dr
Length: 0.45 miles
Directions: E-W, SE-NW
Address range: 1 to 499
Directions: E-W, SE-NW
Address range: 1 to 499
S Garvin St
Length: 0.38 miles
Direction: N-S
Address range: 1240 to 1651
Direction: N-S
Address range: 1240 to 1651
SE Riverside Dr
Length: 0.33 miles
Directions: E-W, SE-NW
Address range: 1300 to 1599
Directions: E-W, SE-NW
Address range: 1300 to 1599
Parrett St
Length: 0.30 miles
Directions: N-S, SW-NE
Address range: 1100 to 1599
Directions: N-S, SW-NE
Address range: 1100 to 1599
Jackson Ave (Jackson St)
Length: 0.29 miles
Direction: E-W
Address range: 200 to 599
Direction: E-W
Address range: 200 to 599
S Governor St
Length: 0.26 miles
Directions: N-S, SW-NE
Address range: 1300 to 1599
Directions: N-S, SW-NE
Address range: 1300 to 1599
Culver Dr (Emmett St)
Length: 0.25 miles
Direction: N-S
Address range: 1294 to 1591
Direction: N-S
Address range: 1294 to 1591
S Elliott St
Length: 0.20 miles
Direction: N-S
Address range: 1260 to 1499
Direction: N-S
Address range: 1260 to 1499
SE 2nd St
Length: 0.20 miles
Directions: E-W, SE-NW
Address range: 1300 to 1499
Directions: E-W, SE-NW
Address range: 1300 to 1499
Covert Ave
Length: 0.17 miles
Direction: E-W
Address range: 400 to 599
Direction: E-W
Address range: 400 to 599
Howard St
Length: 0.17 miles
Directions: N-S, SW-NE
Address range: 1400 to 1699
Directions: N-S, SW-NE
Address range: 1400 to 1699
Judson St
Length: 0.17 miles
Directions: E-W, N-S, SE-NW
Address range: 1300 to 1549
Directions: E-W, N-S, SE-NW
Address range: 1300 to 1549
Venice St
Length: 0.15 miles
Direction: N-S
Address range: 1400 to 1499
Direction: N-S
Address range: 1400 to 1499
SE 1st St
Length: 0.12 miles
Directions: N-S, SW-NE
Address range: 1300 to 1499
Directions: N-S, SW-NE
Address range: 1300 to 1499
Jackson St
Length: 0.05 miles
Direction: E-W
Address range: 1 to 99
Direction: E-W
Address range: 1 to 99