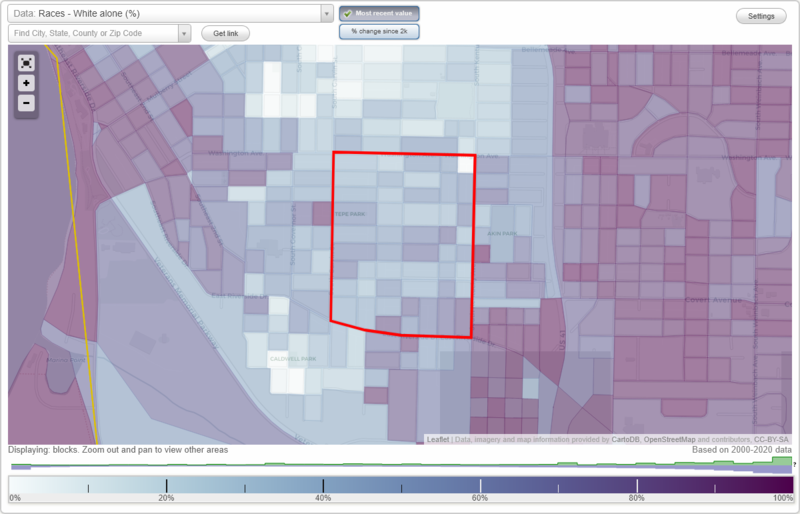
Tepe Park neighborhood in Evansville, Indiana (IN), 47713 detailed profile
Settings
X

Business Search - 14 Million verified businesses
Area: 0.311 square miles
Population: 2,162
Population density:
| Tepe Park: | 6,952 people per square mile |
| Evansville: | 2,912 people per square mile |

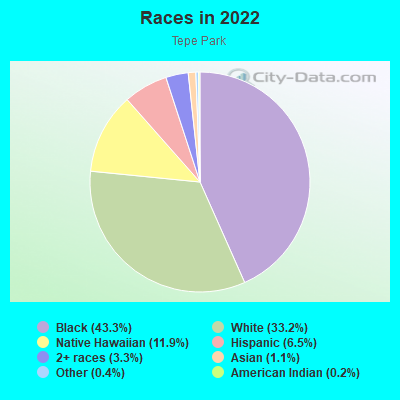
- 98843.3%Black
- 75733.2%White
- 27111.9%Native Hawaiian and Other
Pacific Islander - 1496.5%Hispanic or Latino
- 763.3%Two or more races
- 261.1%Asian
- 100.4%Some other race
- 40.2%American Indian
Median household income in 2022:
| Tepe Park: | $40,715 |
| Evansville: | $48,127 |
Distribution of median household income
![Distribution of median household income]()
- 50Less than $10,000
- 188$10,000 to $19,999
- 231$20,000 to $29,999
- 102$30,000 to $39,999
- 119$40,000 to $49,999
- 119$50,000 to $59,999
- 235$60,000 to $74,999
- 50$75,000 to $99,999
- 34$100,000 to $124,999
- 50$125,000 to $149,999

Distribution of owner-occupied house/condo value
![Distribution of owner-occupied house/condo value]()
- 236Less than $50,000
- 662$50,000 to $99,999
- 56$100,000 to $149,999
- 44$150,000 to $199,999
- 27$200,000 to $249,999

Distribution of rent paid by renters
![Distribution of rent paid by renters]()
- 118$200 to $299
- 35$300 to $399
- 68$400 to $499
- 29$500 to $599
- 107$600 to $699
- 80$700 to $799
- 40$800 to $899
- 18$1,000 to $1,249

| Males: | 926 |
| Females: | 1,235 |
Males:
| This neighborhood: | 35.6 years |
| Whole city: | 36.6 years |
| This neighborhood: | 50.1 years |
| Whole city: | 38.9 years |
Average household size:
| Tepe Park: | 1.9 people |
| Evansville: | 2.1 people |
Percentage of family households:
| Tepe Park: | 36.9% |
| Evansville: | 38.3% |
| Here: | 25.6% |
| Evansville: | 33.7% |
Percentage of married-couple families with children (among all households):
| Tepe Park: | 21.0% |
| Evansville: | 25.3% |
Percentage of single-mother households (among all households):
| Tepe Park: | 24.0% |
| Evansville: | 15.6% |
Percentage of never married males 15 years old and over:
Percentage of never married females 15 years old and over:
| Tepe Park: | 15.8% |
| Evansville: | 19.5% |
Percentage of never married females 15 years old and over:
| Tepe Park: | 25.8% |
| city: | 17.0% |
Percentage of people that speak English not well or not at all:
| Tepe Park: | 0.5% |
| Evansville: | 0.7% |
Percentage of people born in this state:
Percentage of people born in another U.S. state:
Percentage of native residents but born outside the U.S.:
Percentage of foreign born residents:
| Here: | 65.7% |
| Evansville: | 70.5% |
Percentage of people born in another U.S. state:
| Tepe Park: | 20.6% |
| Evansville: | 25.5% |
Percentage of native residents but born outside the U.S.:
| Here: | 0.2% |
| city: | 0.8% |
Percentage of foreign born residents:
| Here: | 13.5% |
| Evansville: | 3.2% |
Owner-occupied
Renter-occupied

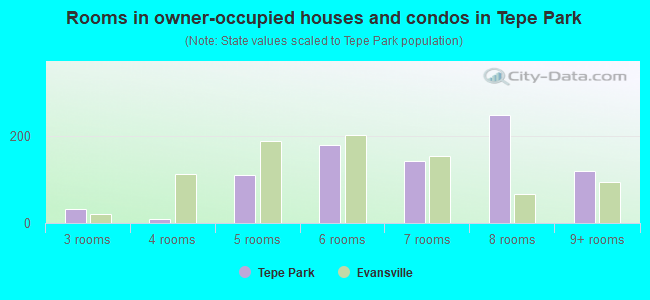
- Rooms in owner-occupied houses and condos in Tepe Park
- 01 room
- 02 rooms
- 323 rooms
- 104 rooms
- 1105 rooms
- 1806 rooms
- 1447 rooms
- 2498 rooms
- 1219+ rooms
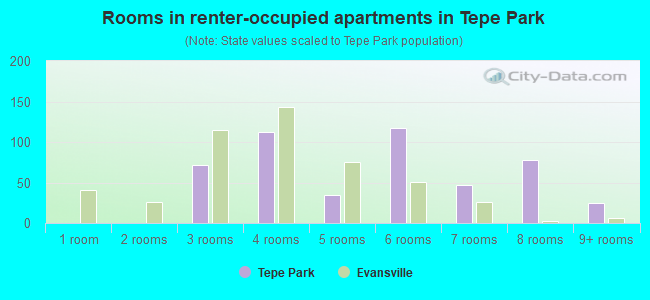
- Rooms in renter-occupied apartments in Tepe Park
- 01 room
- 02 rooms
- 713 rooms
- 1124 rooms
- 345 rooms
- 1176 rooms
- 477 rooms
- 788 rooms
- 259+ rooms
Owner-occupied
Renter-occupied
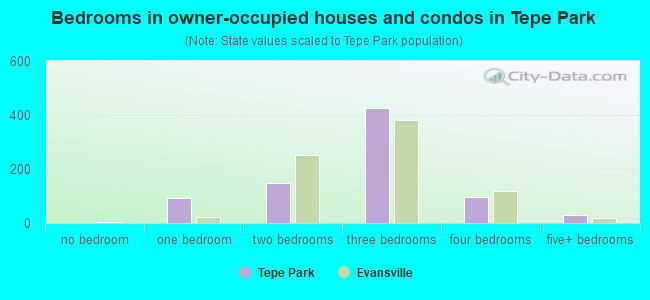
- Bedrooms in owner-occupied houses and condos in Tepe Park
- 0no bedroom
- 911 bedroom
- 1502 bedrooms
- 4273 bedrooms
- 984 bedrooms
- 305+ bedrooms
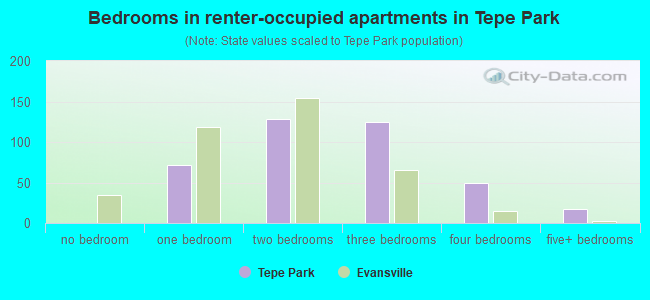
- Bedrooms in renter-occupied apartments in Tepe Park
- 0no bedroom
- 711 bedroom
- 1282 bedrooms
- 1253 bedrooms
- 494 bedrooms
- 175+ bedrooms
Average number of cars or other vehicles available in houses/condos:
Average number of cars or other vehicles available in apartments:
| This neighborhood: | 1.9 |
| Evansville: | 1.8 |
Average number of cars or other vehicles available in apartments:
| Here: | 0.6 |
| city: | 1.1 |
Percentage of units with a mortgage:
| Tepe Park: | 66.1% |
| Evansville: | 58.5% |
Average estimated value of detached houses in 2022 (83.3% of all units):
| Tepe Park: | $74,062 |
| Indiana: | $257,916 |
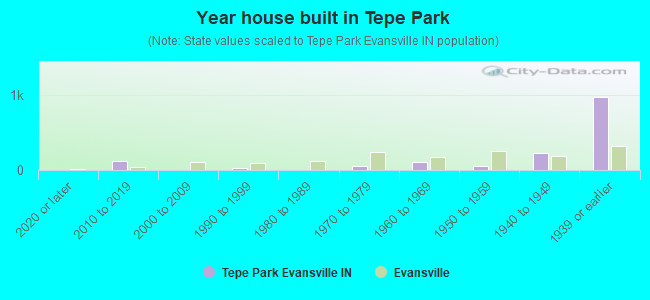
- Year house built in Tepe Park
- 02020 or later
- 1172010 to 2019
- 02000 to 2009
- 321990 to 1999
- 01980 to 1989
- 501970 to 1979
- 1001960 to 1969
- 571950 to 1959
- 2301940 to 1949
- 9631939 or earlier
City-data.com crime index for city in 2020 (higher means more crime):
| City: | 440.8 |
| U.S. average: | 219.5 |
Travel time to work (commute)
![Travel time to work (commute)]()
- 167Less than 5 minutes
- 255 to 9 minutes
- 8310 to 14 minutes
- 14915 to 19 minutes
- 12120 to 24 minutes
- 2825 to 29 minutes
- 5630 to 34 minutes
- 3435 to 39 minutes
- 2740 to 44 minutes
- 2745 to 59 minutes
- 10590 or more minutes

Means of transportation to work
![Means of transportation to work]()
- 79.8%749Drove a car alone
- 9.6%90Carpooled
- 9.9%93Bus
- 2.8%26Other means
- 2.2%21Worked at home

Time leaving home to go to work
![Time leaving home to go to work]()
- 11812:00 a.m. to 4:59 a.m.
- 475:00 a.m. to 5:29 a.m.
- 455:30 a.m. to 5:59 a.m.
- 436:00 a.m. to 6:29 a.m.
- 126:30 a.m. to 6:59 a.m.
- 327:00 a.m. to 7:29 a.m.
- 277:30 a.m. to 7:59 a.m.
- 568:00 a.m. to 8:29 a.m.
- 38:30 a.m. to 8:59 a.m.
- 239:00 a.m. to 9:59 a.m.
- 15010:00 a.m. to 10:59 a.m.
- 4611:00 a.m. to 11:59 a.m.
- 11512:00 p.m. to 3:59 p.m.
- 1014:00 p.m. to 11:59 p.m.

Occupations of males:
- Percentage of males in management occupations (except farmers):
Here: 4.1% city: 8.4%
- Percentage of males in business and financial operations occupations:
Here: 1.6% city: 3.1%
- Percentage of males in computer and mathematical occupations:
Here: 5.7% city: 3.0%
- Percentage of males in education, training, and library occupations:
Here: 4.9% city: 2.7%
- Percentage of males in arts, design, entertainment, sports, and media occupations:
Here: 1.6% city: 1.4%
- Percentage of males in healthcare practitioners and technical occupations:
Here: 7.0% city: 2.1%
- Percentage of males in service occupations:
Here: 12.9% city: 15.9%
- Percentage of males in sales and office occupations:
Here: 5.0% city: 14.7%
- Percentage of males in construction, extraction, and maintenance occupations:
Here: 1.9% city: 7.3%
- Percentage of males in production occupations:
Here: 30.9% city: 14.9%
- Percentage of males in transportation occupations:
Here: 18.1% city: 7.3%
- Percentage of males in material moving occupations:
Here: 6.3% city: 8.2%
Occupations of females:
- Percentage of females in business and financial operations occupations:
Here: 3.7% city: 4.6%
- Percentage of females in life, physical, and social science occupations:
Here: 2.8% city: 0.6%
- Percentage of females in education, training, and library occupations:
Here: 2.8% city: 5.7%
- Percentage of females in healthcare practitioners and technical occupations:
Here: 6.2% city: 8.9%
- Percentage of females in service occupations:
Here: 54.1% city: 26.1%
- Percentage of females in sales and office occupations:
Here: 20.7% city: 30.9%
- Percentage of females in production occupations:
Here: 7.2% city: 5.3%
- Percentage of females in material moving occupations:
Here: 2.5% city: 3.1%
Education in this neighborhood (subdivision or community):
- Percentage of people 3 years and older in K-12 schools:
Tepe Park: 23.3% Evansville: 15.5%
- Percentage of people 3 years and older in undergraduate colleges:
Tepe Park: 2.0% Evansville: 5.1%
- Percentage of people 3 years and older in grad. or professional schools:
Tepe Park: 0.0% Evansville: 0.8%
- Percentage of students K-12 enrolled in private schools:
Tepe Park: 0.0% Evansville: 15.2%
Percentage of population below poverty level:
| Tepe Park: | 28.2% |
| Evansville: | 19.3% |
Median year owner moved in (as recorded in 2022):
Median year renter moved in (as recorded in 2022):
| Tepe Park: | 1990 |
| Evansville: | 2011 |
Median year renter moved in (as recorded in 2022):
| Tepe Park: | 2013 |
| Evansville: | 2020 |
Percentage of married-couple families with both working:
| Tepe Park: | 92.9% |
| Evansville: | 71.5% |

- 83.4%Utility gas
- 12.5%Electricity
- 3.2%Bottled, tank, or LP gas
- 0.9%No fuel used
Roads and streets:
S Bedford Ave
Length: 0.61 miles
Direction: N-S
Address range: 1052 to 1699
Direction: N-S
Address range: 1052 to 1699
S Evans Ave
Length: 0.61 miles
Direction: N-S
Address range: 1048 to 1699
Direction: N-S
Address range: 1048 to 1699
S Grand Ave
Length: 0.61 miles
Direction: N-S
Address range: 1050 to 1699
Direction: N-S
Address range: 1050 to 1699
S Linwood Ave
Length: 0.59 miles
Direction: N-S
Address range: 1052 to 1699
Direction: N-S
Address range: 1052 to 1699
Madison Ave
Length: 0.59 miles
Direction: E-W
Address range: 622 to 999
Direction: E-W
Address range: 622 to 999
S Kentucky Ave
Length: 0.52 miles
Direction: N-S
Address range: 1150 to 1699
Direction: N-S
Address range: 1150 to 1699
Taylor Ave
Length: 0.51 miles
Direction: E-W
Address range: 650 to 999
Direction: E-W
Address range: 650 to 999
Covert Ave
Length: 0.51 miles
Direction: E-W
Address range: 650 to 999
Direction: E-W
Address range: 650 to 999
Ravenswood Dr
Length: 0.51 miles
Direction: E-W
Address range: 652 to 999
Direction: E-W
Address range: 652 to 999
Monroe Ave
Length: 0.47 miles
Direction: E-W
Address range: 680 to 999
Direction: E-W
Address range: 680 to 999
Jackson Ave (Jackson St)
Length: 0.47 miles
Direction: E-W
Address range: 680 to 999
Direction: E-W
Address range: 680 to 999
Adams Ave
Length: 0.43 miles
Direction: E-W
Address range: 700 to 999
Direction: E-W
Address range: 700 to 999
E Riverside Dr
Length: 0.36 miles
Direction: E-W
Address range: 630 to 999
Direction: E-W
Address range: 630 to 999
Jefferson Ave
Length: 0.32 miles
Direction: E-W
Address range: 680 to 899
Direction: E-W
Address range: 680 to 899
S Morton Ave
Length: 0.23 miles
Direction: N-S
Address range: 1500 to 1699
Direction: N-S
Address range: 1500 to 1699
Waggoner Ave
Length: 0.19 miles
Direction: E-W
Address range: 700 to 899
Direction: E-W
Address range: 700 to 899
Shadewood
Length: 0.14 miles
Direction: N-S
Address range: 1600 to 1699
Direction: N-S
Address range: 1600 to 1699