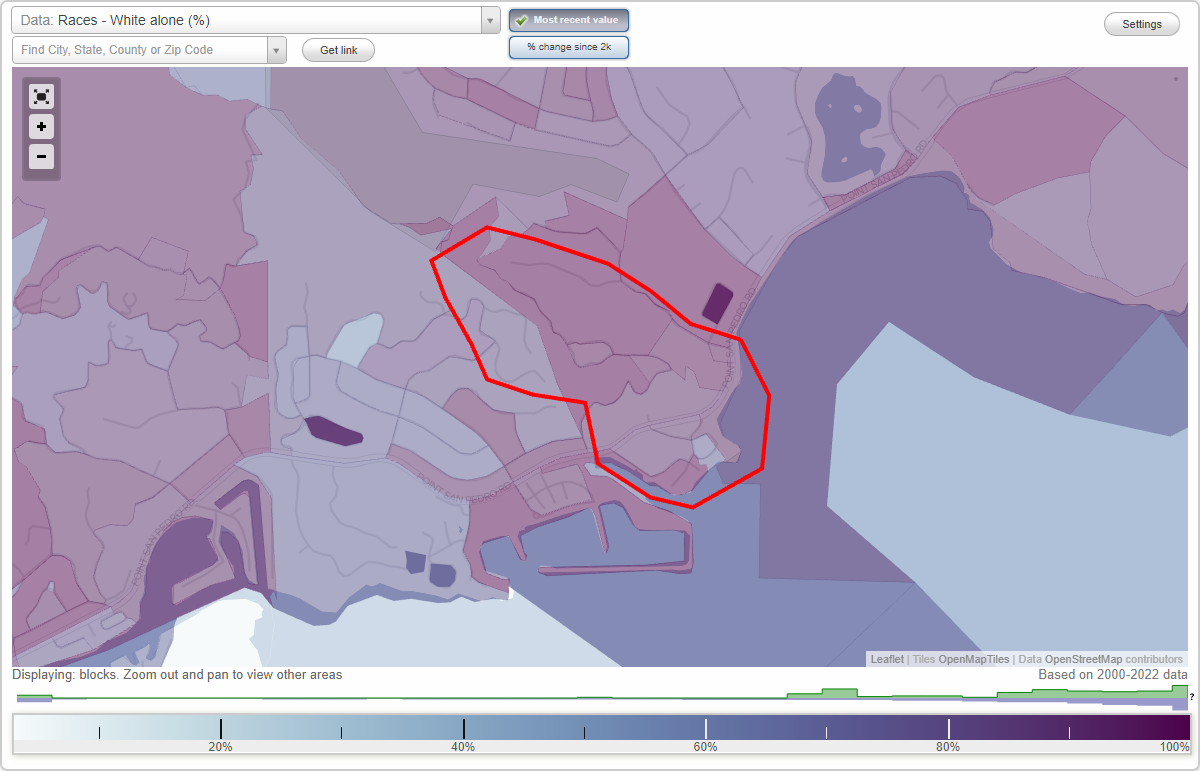
Bayside Acres neighborhood in San Rafael, California (CA), 94901 detailed profile
Settings
X

Business Search - 14 Million verified businesses
Area: 0.279 square miles
Population: 299
Population density:
| Bayside Acres: | 1,070 people per square mile |
| San Rafael: | 3,670 people per square mile |

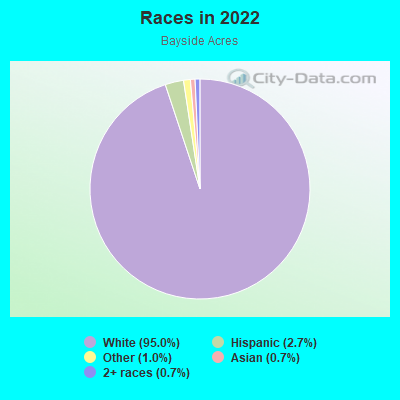
- 28695.0%White
- 82.7%Hispanic or Latino
- 31.0%Some other race
- 20.7%Asian
- 20.7%Two or more races
Median household income in 2022:
| Bayside Acres: | $230,866 |
| San Rafael: | $113,839 |
Distribution of median household income
![Distribution of median household income]()
- 6Less than $10,000
- 10$10,000 to $19,999
- 2$20,000 to $29,999
- 4$30,000 to $39,999
- 8$40,000 to $49,999
- 1$50,000 to $59,999
- 1$60,000 to $74,999
- 7$75,000 to $99,999
- 3$100,000 to $124,999
- 19$125,000 to $149,999
- 11$150,000 to $199,999
- 69$200,000 or more

Distribution of owner-occupied house/condo value
![Distribution of owner-occupied house/condo value]()
- 3Less than $50,000
- 4$100,000 to $149,999
- 1$150,000 to $199,999
- 1$200,000 to $249,999
- 3$300,000 to $399,999
- 12$750,000 to $999,999
- 91$1,000,000 or more

Distribution of rent paid by renters
![Distribution of rent paid by renters]()
- 19$2,000 or more

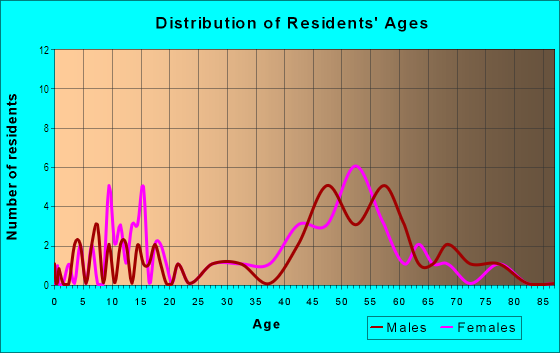
| Males: | 120 |
| Females: | 178 |
Males:
| This neighborhood: | 58.9 years |
| Whole city: | 40.6 years |
| This neighborhood: | 55.1 years |
| Whole city: | 47.6 years |
Average household size:
| Bayside Acres: | 2.5 people |
| San Rafael: | 2.5 people |
Percentage of family households:
| Bayside Acres: | 45.4% |
| San Rafael: | 41.8% |
| Here: | 62.0% |
| San Rafael: | 46.3% |
Percentage of married-couple families with children (among all households):
| Bayside Acres: | 39.8% |
| San Rafael: | 30.4% |
Percentage of single-mother households (among all households):
| Bayside Acres: | 1.2% |
| San Rafael: | 5.4% |
Percentage of never married males 15 years old and over:
Percentage of never married females 15 years old and over:
| Bayside Acres: | 10.9% |
| San Rafael: | 17.7% |
Percentage of never married females 15 years old and over:
| Bayside Acres: | 16.6% |
| city: | 16.3% |
Percentage of people that speak English not well or not at all:
| Bayside Acres: | 0.3% |
| San Rafael: | 10.4% |
Percentage of people born in this state:
Percentage of people born in another U.S. state:
Percentage of native residents but born outside the U.S.:
Percentage of foreign born residents:
| Here: | 55.6% |
| San Rafael: | 47.7% |
Percentage of people born in another U.S. state:
| Bayside Acres: | 30.0% |
| San Rafael: | 23.8% |
Percentage of native residents but born outside the U.S.:
| Here: | 1.3% |
| city: | 1.7% |
Percentage of foreign born residents:
| Here: | 13.2% |
| San Rafael: | 26.8% |
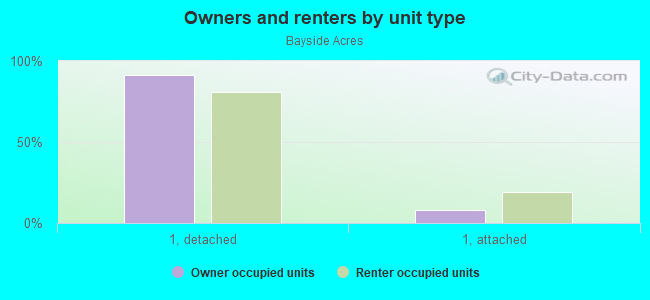
Owner-occupied
Renter-occupied

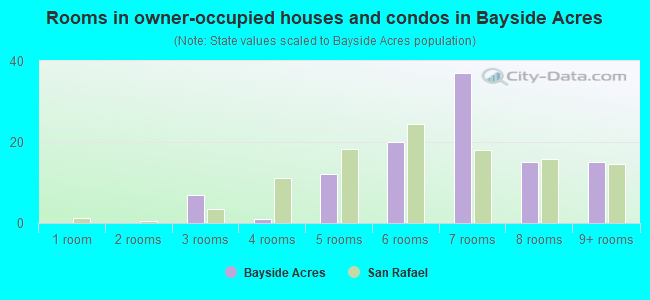
- Rooms in owner-occupied houses and condos in Bayside Acres
- 01 room
- 02 rooms
- 73 rooms
- 14 rooms
- 125 rooms
- 206 rooms
- 377 rooms
- 158 rooms
- 159+ rooms
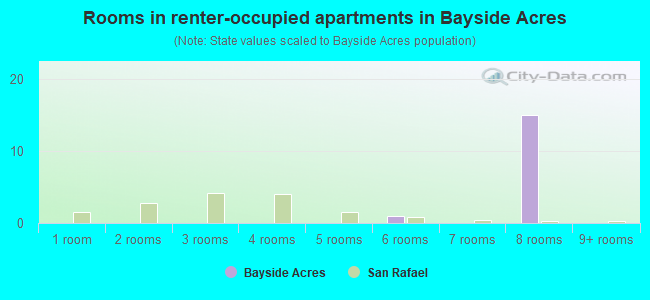
- Rooms in renter-occupied apartments in Bayside Acres
- 01 room
- 02 rooms
- 03 rooms
- 04 rooms
- 05 rooms
- 16 rooms
- 07 rooms
- 158 rooms
- 09+ rooms
Owner-occupied
Renter-occupied
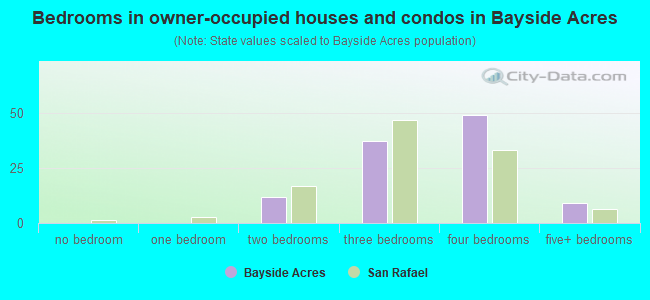
- Bedrooms in owner-occupied houses and condos in Bayside Acres
- 0no bedroom
- 01 bedroom
- 122 bedrooms
- 373 bedrooms
- 494 bedrooms
- 95+ bedrooms
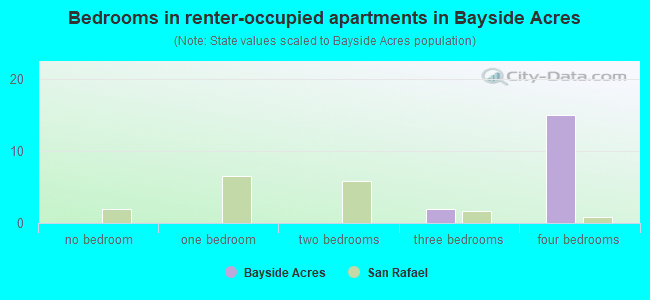
- Bedrooms in renter-occupied apartments in Bayside Acres
- 0no bedroom
- 01 bedroom
- 02 bedrooms
- 23 bedrooms
- 154 bedrooms
- 05+ bedrooms
Average number of cars or other vehicles available in houses/condos:
Average number of cars or other vehicles available in apartments:
| This neighborhood: | 0.4 |
| San Rafael: | 2.0 |
Average number of cars or other vehicles available in apartments:
| Here: | |
| city: |
Percentage of units with a mortgage:
| Bayside Acres: | 62.6% |
| San Rafael: | 66.6% |
Average estimated value of detached houses in 2022 (95.2% of all units):
| Bayside Acres: | $1,650,543 |
| California: | $988,808 |
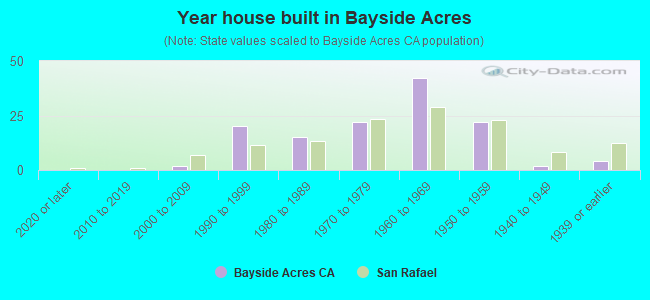
- Year house built in Bayside Acres
- 02020 or later
- 02010 to 2019
- 22000 to 2009
- 201990 to 1999
- 151980 to 1989
- 221970 to 1979
- 421960 to 1969
- 221950 to 1959
- 21940 to 1949
- 41939 or earlier
City-data.com crime index for city in 2020 (higher means more crime):
| City: | 294.6 |
| U.S. average: | 219.5 |
Travel time to work (commute)
![Travel time to work (commute)]()
- 35 to 9 minutes
- 1310 to 14 minutes
- 2415 to 19 minutes
- 1420 to 24 minutes
- 530 to 34 minutes
- 235 to 39 minutes
- 640 to 44 minutes
- 645 to 59 minutes
- 1160 to 89 minutes
- 690 or more minutes

Means of transportation to work
![Means of transportation to work]()
- 61.8%97Drove a car alone
- 0.6%1Carpooled
- 1.9%3Bus
- 0.6%1Long-distance train or commuter rail
- 36.9%58Worked at home

Time leaving home to go to work
![Time leaving home to go to work]()
- 55:00 a.m. to 5:29 a.m.
- 106:00 a.m. to 6:29 a.m.
- 176:30 a.m. to 6:59 a.m.
- 197:00 a.m. to 7:29 a.m.
- 77:30 a.m. to 7:59 a.m.
- 108:00 a.m. to 8:29 a.m.
- 38:30 a.m. to 8:59 a.m.
- 199:00 a.m. to 9:59 a.m.
- 410:00 a.m. to 10:59 a.m.
- 112:00 p.m. to 3:59 p.m.

Occupations of males:
- Percentage of males in management occupations (except farmers):
Here: 28.3% city: 14.6%
- Percentage of males in business and financial operations occupations:
Here: 6.0% city: 5.8%
- Percentage of males in architecture and engineering occupations:
Here: 2.4% city: 2.2%
- Percentage of males in legal occupations:
Here: 4.0% city: 1.0%
- Percentage of males in education, training, and library occupations:
Here: 3.9% city: 3.9%
- Percentage of males in arts, design, entertainment, sports, and media occupations:
Here: 9.1% city: 5.0%
- Percentage of males in healthcare practitioners and technical occupations:
Here: 10.5% city: 2.9%
- Percentage of males in service occupations:
Here: 1.2% city: 14.5%
- Percentage of males in sales and office occupations:
Here: 20.9% city: 17.3%
- Percentage of males in construction, extraction, and maintenance occupations:
Here: 17.7% city: 13.3%
- Percentage of males in material moving occupations:
Here: 2.4% city: 2.7%
Occupations of females:
- Percentage of females in management occupations (except farmers):
Here: 37.3% city: 13.8%
- Percentage of females in business and financial operations occupations:
Here: 9.1% city: 5.9%
- Percentage of females in education, training, and library occupations:
Here: 9.5% city: 8.1%
- Percentage of females in arts, design, entertainment, sports, and media occupations:
Here: 6.2% city: 3.7%
- Percentage of females in healthcare practitioners and technical occupations:
Here: 30.2% city: 7.0%
- Percentage of females in service occupations:
Here: 4.6% city: 21.9%
- Percentage of females in sales and office occupations:
Here: 2.7% city: 25.2%
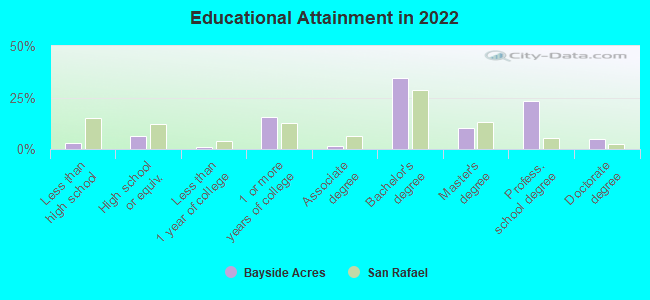
Education in this neighborhood (subdivision or community):
- Percentage of people 3 years and older in K-12 schools:
Bayside Acres: 31.4% San Rafael: 15.4%
- Percentage of people 3 years and older in undergraduate colleges:
Bayside Acres: 7.7% San Rafael: 6.4%
- Percentage of people 3 years and older in grad. or professional schools:
Bayside Acres: 0.0% San Rafael: 1.2%
- Percentage of students K-12 enrolled in private schools:
Bayside Acres: 23.4% San Rafael: 10.7%
Percentage of population below poverty level:
| Bayside Acres: | 2.6% |
| San Rafael: | 8.9% |
Median year owner moved in (as recorded in 2022):
| Bayside Acres: | 1997 |
| San Rafael: | 2005 |
Percentage of married-couple families with both working:
| Bayside Acres: | 83.5% |
| San Rafael: | 75.7% |
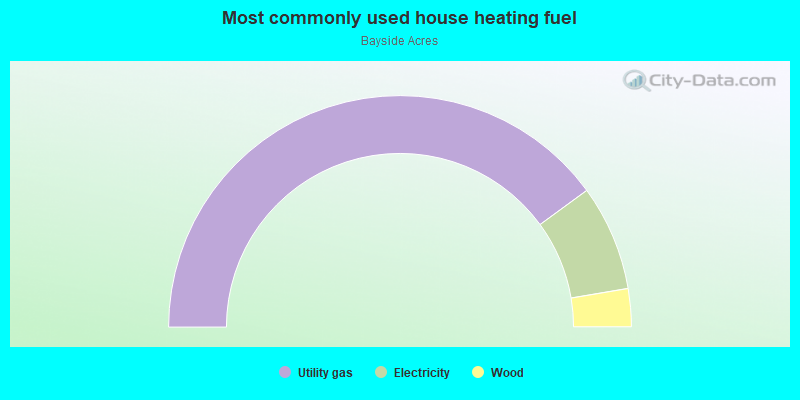
- 79.9%Utility gas
- 14.8%Electricity
- 5.3%Wood
Roads and streets:
Point San Pedro Rd
Length: 0.51 miles
Directions: E-W, N-S, SW-NE
Address range: 720 to 899
Directions: E-W, N-S, SW-NE
Address range: 720 to 899
Main Dr
Length: 0.50 miles
Directions: E-W, N-S, SE-NW, SW-NE
Address range: 1 to 199
Directions: E-W, N-S, SE-NW, SW-NE
Address range: 1 to 199
Manzanita Ave
Length: 0.34 miles
Directions: E-W, SE-NW
Address range: 1 to 99
Directions: E-W, SE-NW
Address range: 1 to 99
Oak Dr
Length: 0.31 miles
Directions: E-W, N-S, SE-NW, SW-NE
Address range: 100 to 199
Directions: E-W, N-S, SE-NW, SW-NE
Address range: 100 to 199
Beach Dr
Length: 0.30 miles
Directions: E-W, SE-NW, SW-NE
Address range: 1 to 99
Directions: E-W, SE-NW, SW-NE
Address range: 1 to 99
Lochness Ln
Length: 0.27 miles
Directions: E-W, N-S, SE-NW, SW-NE
Address range: 1 to 99
Directions: E-W, N-S, SE-NW, SW-NE
Address range: 1 to 99
Tweed Ter
Length: 0.22 miles
Directions: E-W, N-S, SE-NW, SW-NE
Address range: 1 to 99
Directions: E-W, N-S, SE-NW, SW-NE
Address range: 1 to 99
Marine Dr
Length: 0.21 miles
Directions: N-S, SE-NW, SW-NE
Address range: 1 to 99
Directions: N-S, SE-NW, SW-NE
Address range: 1 to 99
Manderly Rd
Length: 0.11 miles
Directions: E-W, N-S, SE-NW, SW-NE
Address range: 74 to 199
Directions: E-W, N-S, SE-NW, SW-NE
Address range: 74 to 199
Other features:
Bayview Dr
Length: 0.94 miles
Directions: E-W, N-S, SE-NW, SW-NE
Address range: 101 to 237
Directions: E-W, N-S, SE-NW, SW-NE
Address range: 101 to 237