Estimated zip code population in 2022: 40,587 Zip code population in 2010: 41,157 Zip code population in 2000: 40,221
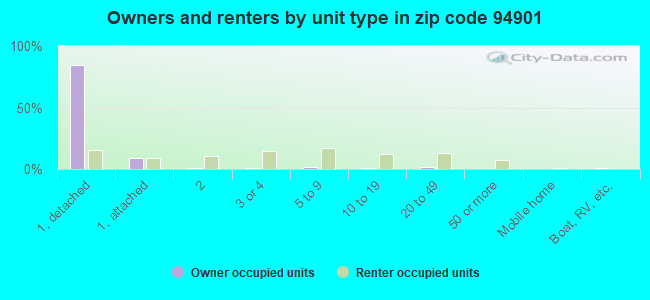
Houses and condos: 16,617 Renter-occupied apartments: 7,747
% of renters here:
49%
State:
44%
March 2022 cost of living index in zip code 94901: 133.4 (high, U.S. average is 100)
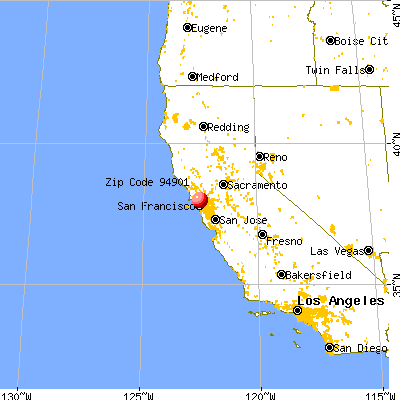
Land area: 13.2 sq. mi. Water area: 3.8 sq. mi.
Population density: 3,083 people per square mile
(average).
OSM Map
General Map
Google Map
MSN Map
OSM Map
General Map
Google Map
MSN Map
OSM Map
General Map
Google Map
MSN Map
OSM Map
General Map
Google Map
MSN Map
Please wait while loading the map...
Real estate property taxes paid for housing units in 2022:
This zip code:
0.7% ($10,292)
California:
0.7% ($4,831)
Median real estate property taxes paid for housing units with mortgages in 2022: $10,330 (0.7%) Median real estate property taxes paid for housing units with no mortgage in 2022: $8,318 (0.6%)
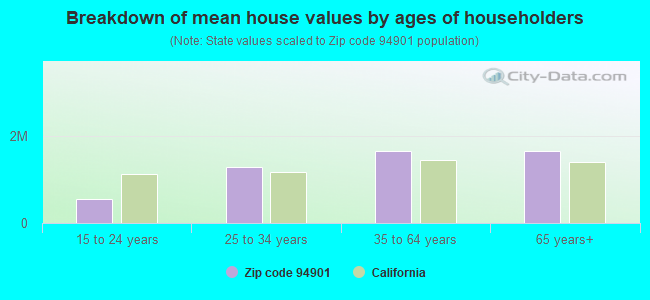
Estimated median house/condo value in 2022: $1,409,866
94901:
$1,409,866
California:
$715,900
According to our research of California and other state lists, there were 17 registered sex offenders living in 94901 zip code as of April 26, 2024. The ratio of all residents to sex offenders in zip code 94901 is 2,519 to 1. The ratio of registered sex offenders to all residents in this zip code is much lower than the state average.
Median resident age:
This zip code:
43.0 years
California median age:
37.9 years
Average household size:
This zip code:
2.5 people
California:
2.8 people
Averages for the 2020 tax year for zip code 94901, filed in 2021:
Average Adjusted Gross Income (AGI) in 2020: $161,068 (Individual Income Tax Returns)
Here:
$161,068
State:
$95,910
Salary/wage: $115,695 (reported on 72.3% of returns)
Here:
$115,695
State:
$77,331
(% of AGI for various income ranges: 1458.6% for AGIs below $25k, 4649.6% for AGIs $25k-50k, 8125.2% for AGIs $50k-75k, 11663.6% for AGIs $75k-100k, 19740.6% for AGIs $100k-200k, 143408.1% for AGIs over 200k)
Taxable interest for individuals: $4,737 (reported on 41.3% of returns)
This zip code:
$4,737
California:
$2,294
(% of AGI for various income ranges: 32.4% for AGIs below $25k, 65.5% for AGIs $25k-50k, 108.4% for AGIs $50k-75k, 199.1% for AGIs $75k-100k, 451.0% for AGIs $100k-200k, 3708.3% for AGIs over 200k)
Ordinary dividends: $26,941 (reported on 34.2% of returns)
Here:
$26,941
State:
$10,949
(% of AGI for various income ranges: 91.3% for AGIs below $25k, 144.3% for AGIs $25k-50k, 279.8% for AGIs $50k-75k, 710.3% for AGIs $75k-100k, 1506.2% for AGIs $100k-200k, 19722.7% for AGIs over 200k)
Net capital gain/loss in AGI: +$79,368 (reported on 32.5% of returns)
Here:
+$79,368
State:
+$49,306
(% of AGI for various income ranges: 45.7% for AGIs below $25k, 108.5% for AGIs $25k-50k, 209.7% for AGIs $50k-75k, 868.7% for AGIs $75k-100k, 1628.5% for AGIs $100k-200k, 63056.1% for AGIs over 200k)
Profit/loss from business: +$37,058 (reported on 27.3% of returns)
Here:
+$37,058
State:
+$15,671
(% of AGI for various income ranges: 676.9% for AGIs below $25k, 717.2% for AGIs $25k-50k, 743.6% for AGIs $50k-75k, 1392.3% for AGIs $75k-100k, 2857.4% for AGIs $100k-200k, 14965.5% for AGIs over 200k)
Taxable individual retirement arrangement distribution: $31,707 (reported on 10.3% of returns)
94901:
$31,707
California:
$23,505
(% of AGI for various income ranges: 68.0% for AGIs below $25k, 138.0% for AGIs $25k-50k, 264.8% for AGIs $50k-75k, 813.6% for AGIs $75k-100k, 1598.6% for AGIs $100k-200k, 4078.3% for AGIs over 200k)
Self-employed (Keogh) retirement plans: $32,863 (reported on 3.4% of returns)
94901:
$32,863
California:
$30,163
(% of AGI for various income ranges: 15.6% for AGIs $25k-50k, 22.0% for AGIs $50k-75k, 101.4% for AGIs $75k-100k, 309.0% for AGIs $100k-200k, 2226.2% for AGIs over 200k)
Total itemized deductions: $52,075 (reported on 22.7% of returns)
Here:
$52,075
State:
$39,517
(% of AGI for various income ranges: 235.0% for AGIs below $25k, 360.0% for AGIs $25k-50k, 703.5% for AGIs $50k-75k, 1685.3% for AGIs $75k-100k, 3293.5% for AGIs $100k-200k, 20961.8% for AGIs over 200k)
Charity contributions: $21,532 (reported on 18.8% of returns)
Here:
$21,532
State:
$12,598
(% of AGI for various income ranges: 10.2% for AGIs below $25k, 28.4% for AGIs $25k-50k, 52.8% for AGIs $50k-75k, 107.7% for AGIs $75k-100k, 342.9% for AGIs $100k-200k, 9682.7% for AGIs over 200k)
Taxes paid: $9,242 (reported on 22.7% of returns)
94901:
$9,242
State:
$8,807
(% of AGI for various income ranges: 47.7% for AGIs below $25k, 74.5% for AGIs $25k-50k, 180.7% for AGIs $50k-75k, 439.4% for AGIs $75k-100k, 861.1% for AGIs $100k-200k, 2985.2% for AGIs over 200k)
Earned income credit: $1,900 (reported on 8.2% of returns)
Here:
$1,900
State:
$2,074
(% of AGI for various income ranges: 79.1% for AGIs below $25k, 52.9% for AGIs $25k-50k)
Percentage of individuals using paid preparers for their 2020 taxes: 90.8%
Here:
91%
State:
92%
(% for various income ranges: 86.1% for AGIs below $25k, 89.7% for AGIs $25k-50k, 92.3% for AGIs $50k-75k, 91.4% for AGIs $75k-100k, 93.7% for AGIs $100k-200k, 95.5% for AGIs over 200k)
Averages for the 2012 tax year for zip code 94901, filed in 2013:
Average Adjusted Gross Income (AGI) in 2012: $126,818 (Individual Income Tax Returns)
Here:
$126,818
State:
$72,726
Salary/wage: $87,829 (reported on 75.0% of returns)
Here:
$87,829
State:
$59,079
(% of AGI for various income ranges: 69.1% for AGIs below $25k, 77.4% for AGIs $25k-50k, 67.9% for AGIs $50k-75k, 59.8% for AGIs $75k-100k, 61.3% for AGIs $100k-200k, 44.4% for AGIs over 200k)
Taxable interest for individuals: $4,687 (reported on 41.6% of returns)
This zip code:
$4,687
California:
$2,146
(% of AGI for various income ranges: 1.6% for AGIs below $25k, 1.1% for AGIs $25k-50k, 1.5% for AGIs $50k-75k, 1.3% for AGIs $75k-100k, 1.4% for AGIs $100k-200k, 1.6% for AGIs over 200k)
Ordinary dividends: $26,719 (reported on 32.4% of returns)
Here:
$26,719
State:
$9,308
(% of AGI for various income ranges: 3.3% for AGIs below $25k, 2.4% for AGIs $25k-50k, 3.6% for AGIs $50k-75k, 4.6% for AGIs $75k-100k, 4.3% for AGIs $100k-200k, 8.5% for AGIs over 200k)
Net capital gain/loss in AGI: +$43,357 (reported on 30.1% of returns)
Here:
+$43,357
State:
+$30,460
(% of AGI for various income ranges: 0.6% for AGIs $25k-50k, 1.1% for AGIs $50k-75k, 1.9% for AGIs $75k-100k, 2.8% for AGIs $100k-200k, 15.0% for AGIs over 200k)
Profit/loss from business: +$34,730 (reported on 26.6% of returns)
Here:
+$34,730
State:
+$17,064
(% of AGI for various income ranges: 20.4% for AGIs below $25k, 10.0% for AGIs $25k-50k, 10.0% for AGIs $50k-75k, 9.1% for AGIs $75k-100k, 9.7% for AGIs $100k-200k, 5.4% for AGIs over 200k)
Taxable individual retirement arrangement distribution: $32,777 (reported on 11.9% of returns)
94901:
$32,777
California:
$19,557
(% of AGI for various income ranges: 2.4% for AGIs below $25k, 2.1% for AGIs $25k-50k, 4.5% for AGIs $50k-75k, 4.9% for AGIs $75k-100k, 4.8% for AGIs $100k-200k, 2.5% for AGIs over 200k)
Self-employment retirement plans: $27,332 (reported on 3.8% of returns)
94901:
$27,332
California:
$24,530
(% of AGI for various income ranges: 0.3% for AGIs $25k-50k, 0.5% for AGIs $50k-75k, 0.6% for AGIs $75k-100k, 1.0% for AGIs $100k-200k, 0.9% for AGIs over 200k)
Total itemized deductions: $54,016 (20% of AGI, reported on 40.5% of returns)
Here:
$54,016
State:
$34,004
Here:
20.2% of AGI
State:
22.7% of AGI
(% of AGI for various income ranges: 14.2% for AGIs below $25k, 11.3% for AGIs $25k-50k, 17.6% for AGIs $50k-75k, 19.8% for AGIs $75k-100k, 21.4% for AGIs $100k-200k, 16.7% for AGIs over 200k)
Charity contributions: $6,735 (reported on 34.1% of returns)
Here:
$6,735
State:
$4,659
(% of AGI for various income ranges: 0.7% for AGIs below $25k, 0.8% for AGIs $25k-50k, 1.4% for AGIs $50k-75k, 1.2% for AGIs $75k-100k, 1.6% for AGIs $100k-200k, 2.1% for AGIs over 200k)
Taxes paid: $28,115 (reported on 40.3% of returns)
94901:
$28,115
State:
$14,448
(% of AGI for various income ranges: 3.7% for AGIs below $25k, 3.2% for AGIs $25k-50k, 5.3% for AGIs $50k-75k, 7.2% for AGIs $75k-100k, 8.9% for AGIs $100k-200k, 10.2% for AGIs over 200k)
Earned income credit: $1,860 (reported on 9.0% of returns)
Here:
$1,860
State:
$2,286
(% of AGI for various income ranges: 3.1% for AGIs below $25k, 0.5% for AGIs $25k-50k)
Percentage of individuals using paid preparers for their 2012 taxes: 66.6%
Here:
67%
State:
64%
(% for various income ranges: 63.1% for AGIs below $25k, 64.7% for AGIs $25k-50k, 63.5% for AGIs $50k-75k, 65.9% for AGIs $75k-100k, 69.4% for AGIs $100k-200k, 79.7% for AGIs over 200k)
Averages for the 2004 tax year for zip code 94901, filed in 2005:
Average Adjusted Gross Income (AGI) in 2004: $84,730 (Individual Income Tax Returns)
Here:
$84,730
State:
$58,600
Salary/wage: $52,777 (reported on 79.5% of returns)
Here:
$52,777
State:
$49,455
(% of AGI for various income ranges: 1082.8% for AGIs below $10k, 69.6% for AGIs $10k-25k, 74.1% for AGIs $25k-50k, 68.2% for AGIs $50k-75k, 62.1% for AGIs $75k-100k, 41.8% for AGIs over 100k)
Taxable interest for individuals: $4,411 (reported on 42.3% of returns)
This zip code:
$4,411
California:
$2,365
(% of AGI for various income ranges: 84.7% for AGIs below $10k, 3.2% for AGIs $10k-25k, 2.5% for AGIs $25k-50k, 2.3% for AGIs $50k-75k, 2.8% for AGIs $75k-100k, 1.9% for AGIs over 100k)
Taxable dividends: $10,067 (reported on 32.4% of returns)
Here:
$10,067
State:
$4,746
(% of AGI for various income ranges: 59.9% for AGIs below $10k, 4.0% for AGIs $10k-25k, 3.0% for AGIs $25k-50k, 3.4% for AGIs $50k-75k, 4.0% for AGIs $75k-100k, 3.9% for AGIs over 100k)
Net capital gain/loss: +$53,188 (reported on 28.6% of returns)
Here:
+$53,188
State:
+$23,418
(% of AGI for various income ranges: -9.5% for AGIs below $10k, 0.5% for AGIs $10k-25k, 0.9% for AGIs $25k-50k, 1.8% for AGIs $50k-75k, 2.5% for AGIs $75k-100k, 23.0% for AGIs over 100k)
Profit/loss from business: +$31,906 (reported on 20.5% of returns)
Here:
+$31,906
State:
+$16,826
(% of AGI for various income ranges: 40.6% for AGIs below $10k, 13.4% for AGIs $10k-25k, 10.7% for AGIs $25k-50k, 10.0% for AGIs $50k-75k, 11.6% for AGIs $75k-100k, 6.6% for AGIs over 100k)
IRA payment deduction: $3,497 (reported on 3.2% of returns)
94901:
$3,497
California:
$3,192
(% of AGI for various income ranges: 3.7% for AGIs below $10k, 0.4% for AGIs $10k-25k, 0.4% for AGIs $25k-50k, 0.3% for AGIs $50k-75k, 0.3% for AGIs $75k-100k, 0.1% for AGIs over 100k)
Self-employed pension: $20,093 (reported on 3.9% of returns)
Here:
$20,093
California:
$17,688
(% of AGI for various income ranges: 2.4% for AGIs below $10k, 0.4% for AGIs $10k-25k, 0.5% for AGIs $25k-50k, 0.9% for AGIs $50k-75k, 1.1% for AGIs $75k-100k, 1.0% for AGIs over 100k)
Total itemized deductions: $27,043 (19% of AGI, reported on 53.0% of returns)
Here:
$27,043
State:
$28,113
Here:
19.4% of AGI
State:
25.3% of AGI
(% of AGI for various income ranges: 560.0% for AGIs below $10k, 17.7% for AGIs $10k-25k, 16.8% for AGIs $25k-50k, 20.4% for AGIs $50k-75k, 23.0% for AGIs $75k-100k, 15.1% for AGIs over 100k)
Charity contributions deductions: $5,306 (2% of AGI, reported on 30.7% of returns)
Here:
$5,306
State:
$3,923
Here:
2.3% of AGI
State:
3.3% of AGI
(% of AGI for various income ranges: 4.8% for AGIs below $10k, 1.1% for AGIs $10k-25k, 1.3% for AGIs $25k-50k, 1.8% for AGIs $50k-75k, 1.7% for AGIs $75k-100k, 2.0% for AGIs over 100k)
Total tax: $22,484 (reported on 69.1% of returns)
94901:
$22,484
State:
$10,761
(% of AGI for various income ranges: 47.1% for AGIs below $10k, 5.5% for AGIs $10k-25k, 8.7% for AGIs $25k-50k, 11.7% for AGIs $50k-75k, 12.5% for AGIs $75k-100k, 20.8% for AGIs over 100k)
Earned income credit: $1,240 (reported on 6.2% of returns)
Here:
$1,240
State:
$1,763
Percentage of individuals using paid preparers for their 2004 taxes: 74.3%
Here:
74%
State:
66%
(% for various income ranges: 84.9% for AGIs below $10k, 67.9% for AGIs $10k-25k, 62.6% for AGIs $25k-50k, 65.1% for AGIs $50k-75k, 68.4% for AGIs $75k-100k, 77.7% for AGIs over 100k)
Likely homosexual households (counted as self-reported same-sex unmarried-partner households)
Lesbian couples: 0.1% of all households
Gay men: 0.1% of all households
Household received Food Stamps/SNAP in the past 12 months: 1,114 Household did not receive Food Stamps/SNAP in the past 12 months: 14,567
Women who had a birth in the past 12 months: 400 (241 now married, 159 unmarried) Women who did not have a birth in the past 12 months: 8,338 (3,293 now married, 5,045 unmarried)
Housing units in zip code 94901 with a mortgage: 5,550 (1,121 second mortgage, 122 home equity loan, 975 both second mortgage and home equity loan) Houses without a mortgage: 248
Median monthly owner costs for units with a mortgage: $3,876 Median monthly owner costs for units without a mortgage: $1,247
Residents with income below the poverty level in 2022:
This zip code:
9.6%
Whole state:
12.2%
Residents with income below 50% of the poverty level in 2022:
This zip code:
5.3%
Whole state:
6.2%
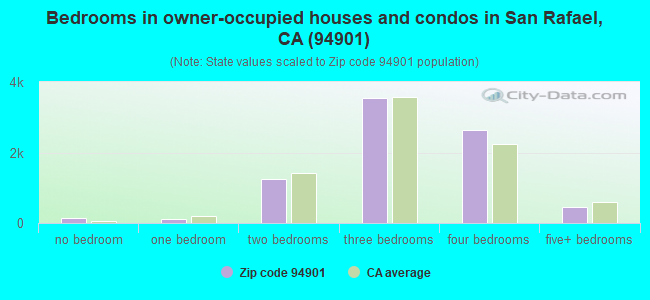
Median number of rooms in houses and condos:
Here:
6.5
State:
6.0
Median number of rooms in apartments:
Here:
3.4
State:
3.9
Notable locations in this zip code not listed on our city pages
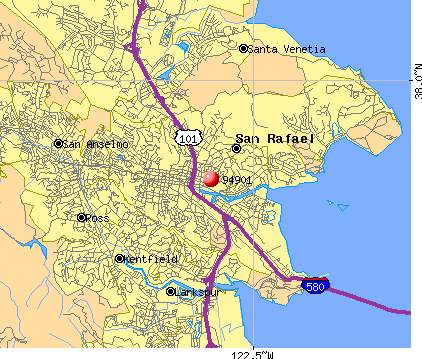
Notable locations in zip code 94901: China Camp (A), Marin Rod and Gun Club (B), Weber Point Picnic Area (C), China Camp Point Picnic Area (D), Buckeye Point Picnic Area (E), Back Ranch Meadows Campground (F), San Rafael Yacht Club (G), San Rafael Community Center (H), Falkirk Community Center (I), San Rafael Improvement Club (J), Peacock Gap Golf Country Club (K), San Rafael Public Library (L), San Rafael City Hall (M), Marin County Historical Society Museum (N), Marin County Historical Society Archives and Library (O), Forest Meadows Performing Arts Center (P), Saint Thomas Hall (Q), Marin County Courthouse (R), Guzman Hall (S), Foster Hall (T). Display/hide their locations on the map
Shopping Centers: Montecito Plaza Shopping Center (1), Marin Square Shopping Center (2), Harbor Shopping Center (3), Bellam Plaza Shopping Center (4). Display/hide their locations on the map
Churches in zip code 94901 include: Church of Christ (A), First Baptist Church (B), First Church of Christ Scientist (C), First Presbyterian Church (D), Saint Pauls Episcopal Church (E), Saint Raphaels Roman Catholic Church (F), San Rafael Methodist Church (G), Trinity Lutheran Church (H), Mission San Rafael Arcangel (I). Display/hide their locations on the map
Parks in zip code 94901 include: Albert Field (1), Mountain Park (2), China Camp State Park (3), Marin Islands National Wildlife Refuge (4), Boyd Memorial Park (5), Gerstle Park (6), Sun Valley Park (7), Beach Park (8), Bret Harte Park (9). Display/hide their locations on the map
5,356 married couples with children.
1,685 single-parent households (622 men, 1,063 women).
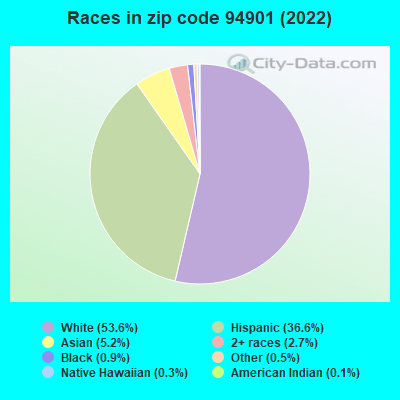
62.1% of residents of 94901 zip code speak English at home.
30.3% of residents speak Spanish at home (40% very well, 20% well, 27% not well, 13% not at all).
3.6% of residents speak other Indo-European language at home (83% very well, 15% well, 2% not well).
3.2% of residents speak Asian or Pacific Island language at home (52% very well, 28% well, 17% not well, 4% not at all).
0.8% of residents speak other language at home (57% very well, 41% well, 2% not well).
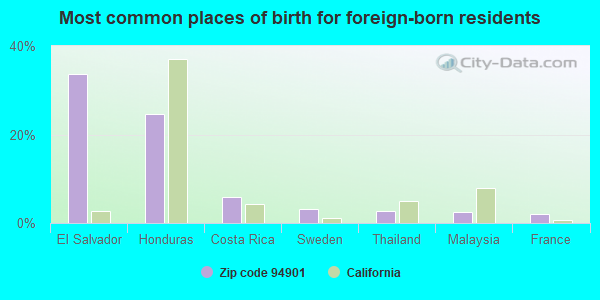
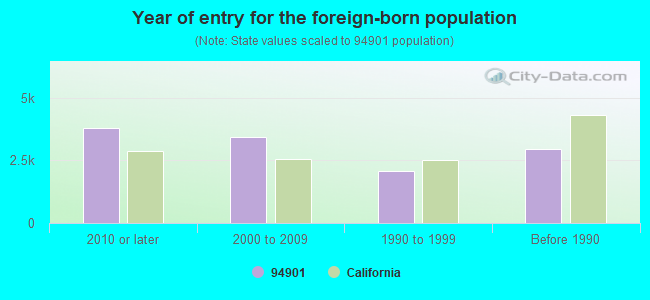
Foreign born population: 11,390 (28.1%) (32.4% of them are naturalized citizens)
Major facilities with environmental interests located in this zip code:
GOLDEN GATE BRIDGE AND TRANSIT DISTRICT (1011 ANDERSON DR in SAN RAFAEL, CA)
AIR MINOR (AIRS/AFS) STATE MASTER (California - Hazardous Waste Tracking) - HAZARDOU WASTE PROGRAM CRITERIA AND HAZARDOUS AIR POLLUTANT INVENTORY (Inventory of air pollution sources) Large Quantity Generators, more that 1000 kg of hazardous waste/month (Resource Conservation and Recovery Act (tracking hazardous waste)) Business SIC classification: LOCAL AND SUBURBAN TRANSIT; NONCLASSIFIABLE ESTABLISHMENTS Business NAICS classification: ALL OTHER TRANSIT AND GROUND PASSENGER TRANSPORTATION. Alternative names: GOLDEN GATE TRANSIT
GHILOTTI BROTHERS INC (525 JACOBY ST in SAN RAFAEL, CA)
STATE MASTER (California - Hazardous Waste Tracking) - HAZARDOU WASTE PROGRAM CRITERIA AND HAZARDOUS AIR POLLUTANT INVENTORY (Inventory of air pollution sources) Small Quantity Generators, between 100 kg and 1000 kg of hazardous waste/month (Resource Conservation and Recovery Act (tracking hazardous waste)) - notification Business SIC classification: CONSTRUCTION MACHINERY AND EQUIPMENT; REFUSE SYSTEMS Business NAICS classification: SOLID WASTE LANDFILL. Organizations: GHOLOTTI BROTHERS CONSTRUCTION INC (CONTACT/OWNER)
Alternative names: GHILOTTI BROTHERS CONSTRUCTION INC
ANTHONYS AUTO CRAFT INCORPORATED (103 VERDI STREET in SAN RAFAEL, CA)
STATE MASTER (California - Hazardous Waste Tracking) - HAZARDOU WASTE PROGRAM CRITERIA AND HAZARDOUS AIR POLLUTANT INVENTORY (Inventory of air pollution sources) Small Quantity Generators, between 100 kg and 1000 kg of hazardous waste/month (Resource Conservation and Recovery Act (tracking hazardous waste)) - notification Business SIC classification: TOP, BODY, AND UPHOLSTERY REPAIR SHOPS AND PAINT SHOPS Business NAICS classification: AUTOMOTIVE BODY, PAINT, AND INTERIOR REPAIR AND MAINTENANCE. Organizations: R CARNEVALE (CONTACT/OWNER)
MARIN SQUARE CLEANERS (55 BELLAM BLVD UNIT C in SAN RAFAEL, CA)
STATE MASTER (California - Hazardous Waste Tracking) - HAZARDOU WASTE PROGRAM CRITERIA AND HAZARDOUS AIR POLLUTANT INVENTORY (Inventory of air pollution sources) Small Quantity Generators, between 100 kg and 1000 kg of hazardous waste/month (Resource Conservation and Recovery Act (tracking hazardous waste)) - notification Business SIC classification: DRYCLEANING PLANTS, EXCEPT RUG CLEANING Organizations: KHAMIS ANTAR (CONTACT/OWNER)
MARIN ACADEMY (5TH AND COTTAGE in SAN RAFAEL, CA)
STATE MASTER (California - Hazardous Waste Tracking) - HAZARDOU WASTE PROGRAM COMPLIANCE ACTIVITY (Tracking inspections of insecticide, fungicide, and rodenticide, and toxic substances) Small Quantity Generators, between 100 kg and 1000 kg of hazardous waste/month (Resource Conservation and Recovery Act (tracking hazardous waste)) - notification
JACK L HUNT INC (1714 FOURTH STREET in SAN RAFAEL, CA)
STATE MASTER (California - Hazardous Waste Tracking) - HAZARDOU WASTE PROGRAM CRITERIA AND HAZARDOUS AIR POLLUTANT INVENTORY (Inventory of air pollution sources) Small Quantity Generators, between 100 kg and 1000 kg of hazardous waste/month (Resource Conservation and Recovery Act (tracking hazardous waste)) - notification Business SIC classification: TOP, BODY, AND UPHOLSTERY REPAIR SHOPS AND PAINT SHOPS Business NAICS classification: OTHER AUTOMOTIVE MECHANICAL AND ELECTRICAL REPAIR AND MAINTENANCE.
A AND C AUTO AIR AND RADIATOR (40 WOODLAND AVE in SAN RAFAEL, CA)
STATE MASTER (California - Hazardous Waste Tracking) - HAZARDOU WASTE PROGRAM Small Quantity Generators, between 100 kg and 1000 kg of hazardous waste/month (Resource Conservation and Recovery Act (tracking hazardous waste)) - notification Business NAICS classification: GENERAL AUTOMOTIVE REPAIR. Organizations: WAITER ECHO (CONTACT/OWNER)
JOHN IRISH JEEP EAGLE (475 FRANCISCO BLVD in SAN RAFAEL, CA)
STATE MASTER (California - Hazardous Waste Tracking) - HAZARDOU WASTE PROGRAM Small Quantity Generators, between 100 kg and 1000 kg of hazardous waste/month (Resource Conservation and Recovery Act (tracking hazardous waste)) - notification Alternative names: JOHN IRISH AUTO PLAZA
MARIN CLEANERS INC (700 A ST in SAN RAFAEL, CA)
STATE MASTER (California - Hazardous Waste Tracking) - HAZARDOU WASTE PROGRAM CRITERIA AND HAZARDOUS AIR POLLUTANT INVENTORY (Inventory of air pollution sources) Small Quantity Generators, between 100 kg and 1000 kg of hazardous waste/month (Resource Conservation and Recovery Act (tracking hazardous waste)) - notification Business SIC classification: DRYCLEANING PLANTS, EXCEPT RUG CLEANING Organizations: WILLIAM CASASSA (CONTACT/OWNER)
MARIN SAN SERV INC (1050 ANDERSON ST in SAN RAFAEL, CA)
STATE MASTER (California - Hazardous Waste Tracking) - HAZARDOU WASTE PROGRAM TRANSPORTER (Resource Conservation and Recovery Act (tracking hazardous waste)) Organizations: MARIN SANITARY SERVICE INC (CONTACT/OWNER)
Alternative names: MARIN SANITARY SERVICE INC
LUCASFILM LIMITED (3160 KERNER BOULEVARD in SAN RAFAEL, CA)
STATE MASTER (California - Hazardous Waste Tracking) - HAZARDOU WASTE PROGRAM CRITERIA AND HAZARDOUS AIR POLLUTANT INVENTORY (Inventory of air pollution sources) Small Quantity Generators, between 100 kg and 1000 kg of hazardous waste/month (Resource Conservation and Recovery Act (tracking hazardous waste)) Business SIC classification: MOTION PICTURE AND VIDEO TAPE PRODUCTION Alternative names: LUCAS DIGITAL LTD LLC, LUCAS FILM LTD
MAGNIFICENT CLEANERS (977 GRAND AVE in SAN RAFAEL, CA)
STATE MASTER (California - Hazardous Waste Tracking) - HAZARDOU WASTE PROGRAM CRITERIA AND HAZARDOUS AIR POLLUTANT INVENTORY (Inventory of air pollution sources) Small Quantity Generators, between 100 kg and 1000 kg of hazardous waste/month (Resource Conservation and Recovery Act (tracking hazardous waste)) - notification Business SIC classification: DRYCLEANING PLANTS, EXCEPT RUG CLEANING Organizations: VALENTINO (CONTACT/OWNER)
Alternative names: MAGNIFICIENT CLEANERS INC
MARIN VW REPAIR (400 IRWIN in SAN RAFAEL, CA)
STATE MASTER (California - Hazardous Waste Tracking) - HAZARDOU WASTE PROGRAM Small Quantity Generators, between 100 kg and 1000 kg of hazardous waste/month (Resource Conservation and Recovery Act (tracking hazardous waste)) - notification Organizations: DEBRA NILSEN (CONTACT/OWNER)
Alternative names: MARIN VEHICLE REPAIR INC
Housing units lacking complete plumbing facilities: 0.2% Housing units lacking complete kitchen facilities: 0.6%
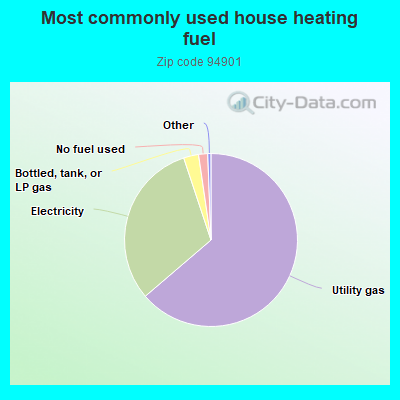
63.8%Utility gas
31.2%Electricity
2.8%Bottled, tank, or LP gas
1.7%No fuel used
Population in 1990: 41,550.
Place of birth for U.S.-born residents:
This state: 19,633
Northeast: 3,378
Midwest: 2,995
South: 1,317
West: 1,158
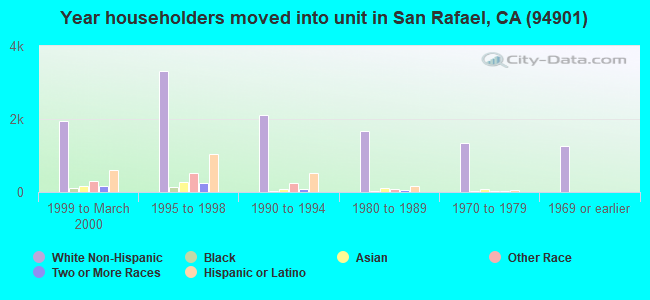
55% of the 94901 zip code residents lived in the same house 5 years ago. Out of people who lived in different houses, 61% lived in this county. Out of people who lived in different counties, 50% lived in California.
90% of the 94901 zip code residents lived in the same house 1 year ago. Out of people who lived in different houses, 49% moved from this county. Out of people who lived in different houses, 37% moved from different county within same state. Out of people who lived in different houses, 6% moved from different state. Out of people who lived in different houses, 9% moved from abroad.
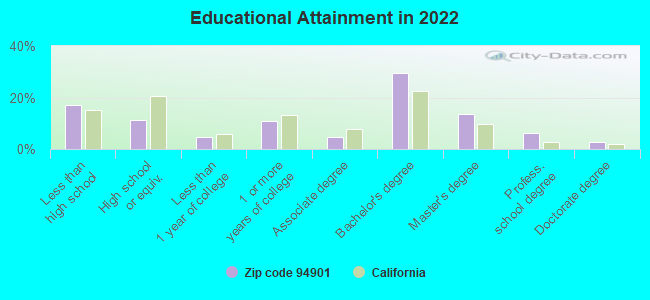
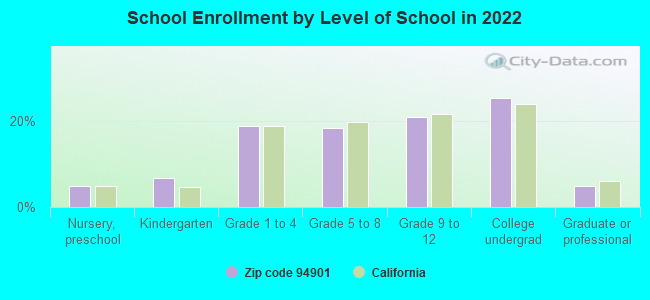
Private vs. public school enrollment:
Students in private schools in grades 1 to 8 (elementary and middle school): 598
Here:
16.1%
California:
10.5%
Students in private schools in grades 9 to 12 (high school): 129
Here:
6.2%
California:
8.5%
Students in private undergraduate colleges: 793
Here:
31.2%
California:
15.9%
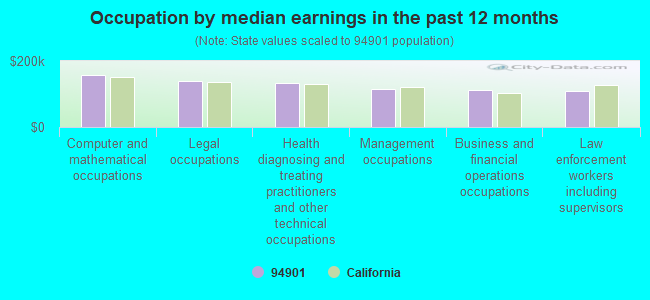
Occupation by median earnings in the past 12 months ($)
158,136Computer and mathematical occupations
138,958Legal occupations
133,993Health diagnosing and treating practitioners and other technical occupations
115,375Management occupations
111,023Business and financial operations occupations
108,265Law enforcement workers including supervisors
Companies with biggest federal contracts located in this zip code (SAN RAFAEL, CA):
DUTRA DREDGING CO , INC (1000 PT SAN PEDRO ROAD) : $91,321,134 in 98 contractsfrom 1999 to 2005
Contracts for Maintenance, Repair or Alteration of Real Property -- Other Non-Building Facilities, Construction of Structures and Facilities -- Dredging, Maintenance, Repair or Alteration of Real Property -- Dredging by U.S. Army Corps of Engineers - civil program financing only, Army Signed by year:2000: $7,473,896; 2001: $4,753,160; 2002: $22,207,504; 2003: $26,473,507; 2004: $25,418,061; 2005: $2,307,506; 2006: $0.
Biggest contracts:
$7,000,000 with U.S. Army Corps of Engineers - civil program financing only for Maintenance, Repair or Alteration of Real Property -- Other Non-Building Facilities. Signed on 2002-03-07. Completion date: 2003-05-22.
$4,800,000 with U.S. Army Corps of Engineers - civil program financing only for Construction of Structures and Facilities -- Dredging. Signed on 2000-09-26. Completion date: 2000-09-26.
$3,880,000 with U.S. Army Corps of Engineers - civil program financing only for Maintenance, Repair or Alteration of Real Property -- Other Non-Building Facilities. Signed on 2003-07-30. Completion date: 2003-10-14.
$3,699,000 with Army for Maintenance, Repair or Alteration of Real Property -- Other Non-Building Facilities. Signed on 2004-01-13. Completion date: 2004-01-13.
DUTRA CONSTRUCTION CO, INC (1000 POINT SAN PEDRO ROAD) : $25,518,971 in 27 contractsfrom 2001 to 2005
Contracts for Maintenance, Repair or Alteration of Real Property -- Highways, Roads, Streets, Bridges, and Railways (includes resurfacing), Construction of Structures and Facilities -- Other Non-Building Facilities, Maintenance, Repair or Alteration of Real Property -- Other Non-Building Facilities, Construction of Structures and Facilities -- Highways, Roads, Streets, Bridges, and Railways (includes resurfacing), and moreby United States Coast Guard (disused code: now 7008), U.S. Army Corps of Engineers - civil program financing only, Army Signed by year:2000: $0; 2001: $7,977,000; 2002: $102,105; 2003: $0; 2004: $16,701,266; 2005: $738,600; 2006: $0.
Biggest contracts:
$7,876,000 with United States Coast Guard (disused code: now 7008) for Maintenance, Repair or Alteration of Real Property -- Highways, Roads, Streets, Bridges, and Railways (includes resurfacing). Signed on 2001-04-15. Completion date: 2002-09-15.
$6,000,000 with U.S. Army Corps of Engineers - civil program financing only for Construction of Structures and Facilities -- Other Non-Building Facilities. Signed on 2004-03-09. Completion date: 2005-01-19.
$6,000,000 with Army for Construction of Structures and Facilities -- Other Non-Building Facilities. Signed on 2004-03-09. Completion date: 2005-01-19.
$2,706,000 with U.S. Army Corps of Engineers - civil program financing only for Maintenance, Repair or Alteration of Real Property -- Other Non-Building Facilities. Signed on 2004-07-15. Completion date: 2004-10-13.
DUTRA / MANSON ,JV (1000 POINT SAN PEDRO RD)
$1,491,955 with Army for Construction of Structures and Facilities -- Other Non-Building Facilities. Signed on 2005-10-25. Completion date: 2006-08-31.
CAL-BAY SYSTEMS, INC (3070 KERNER BLVD STE B; small business) : $656,489 in 22 contractsfrom 2005 to 2006
Contracts for ADP Input/Output and Storage Devices, Electrical and Electronic assemblies, Boards, Cards, and Associated Hardware by Army Signed by year:2000: $0; 2001: $0; 2002: $0; 2003: $0; 2004: $0; 2005: $564,669; 2006: $91,820.
Biggest contracts:
$478,092 with Army for ADP Input/Output and Storage Devices. Signed on 2005-09-15. Completion date: 2010-09-30.
$43,782, same as above.Signed on 2005-12-08. Completion date: 2006-02-09.
$29,555, same as above.Signed on 2005-12-08. Completion date: 2007-06-06.
$29,370, same as above.Signed on 2006-04-10. Completion date: 2006-05-15.
COMCAST CORPORATION (1111 ANDERSON DR) : $453,081 in 3 contractsfrom 2005 to 2006
$296,868 with Air Force for Communications Services. Signed on 2005-07-20. Completion date: 2006-03-31.
$155,034, same as above.Signed on 2006-03-15. Completion date: 2006-09-30.
$1,179 with National Oceanic and Atmospheric Administration/Under Secretary for Oceans and Atmosphere for Telephone and/or Communications Services (includes Telegraph, Telex, and Cablevision Services). Taking place in WA. Signed on 2006-02-06. Completion date: 2006-02-06.
ICECASTING, INC (20 WILSON COURT; small business) : $261,610 in 2 contractsfrom 1999 to 2000
$161,610 with Navy for Other Defense -- Basic Research (R&D). Signed on 1999-11-04. Completion date: 2001-12-31.
$100,000, same as above.Signed on 2000-10-10. Completion date: 2001-12-31.
GARDENERSGUILD, INC (2143 E FRANCISCO BLVD; small business)
$102,618 with Army for Landscaping/Groundskeeping Services. Signed on 2001-08-21. Completion date: 2001-09-01.
MARINE MECHANICAL INC (99 LOCH LOMOND DR; small business) : $82,866 in 2 contractsin 2004
$41,433 with U.S. Army Corps of Engineers - civil program financing only for Maintenance, Repair and Rebuilding of Equipment -- Engine Accessories. Signed on 2004-01-28. Completion date: 2003-11-28.
$41,433 with Army for Maintenance, Repair and Rebuilding of Equipment -- Engine Accessories. Signed on 2004-01-28. Completion date: 2003-11-28.
FRANZ GROUP, THE (27 SIMMS ST; small business) : $72,280 in 5 contractsfrom 2000 to 2006
Contracts for Office Furniture, Miscellaneous Items by Army, Navy, Department of State, Air Force, and others Signed by year:2000: $27,065; 2001: $0; 2002: $0; 2003: $0; 2004: $0; 2005: $19,208; 2006: $26,007.
Biggest contracts:
$27,065 with Army for Office Furniture. Taking place in KS. Signed on 2000-08-28. Completion date: 2000-09-30.
$26,007 with Navy for Office Furniture. Signed on 2006-05-19. Completion date: 2006-06-02.
$9,989 with Department of State for Miscellaneous Items. Signed on 2005-09-16. Completion date: 2005-11-07.
$9,219 with Air Force for Office Furniture. Signed on 2005-09-24. Completion date: 2005-11-23.
PSI MANAGEMENT TEAM INC (714 C ST STE 3) : $60,552 in 4 contractsfrom 2003 to 2005
$29,933 with Air Force for Maintenance, Repair and Rebuilding of Equipment -- Automatic Data Processing Equipment (Including Firmware), Software, Supplies and Support Equipment. Signed on 2003-05-23. Completion date: 2003-08-22.
$18,960 with Navy for Installation of Equipment -- Construction and Building Materials. Signed on 2004-12-15. Completion date: 2005-02-15.
$6,084 with Navy for Floor Coverings. Signed on 2005-05-06. Completion date: 2005-06-09.
$5,575 with Air Force for Floor Coverings. Signed on 2005-04-21. Completion date: 2005-06-03.
Top industries in this zip code by the number of employees in 2005:
2005 - 2018 National Fire Incident Reporting System (NFIRS) incidents
Based on the data from the years 2005 - 2018 the average number of fire incidents per year is 104. The highest number of fire incidents - 166 took place in 2013, and the least - 35 in 2009. The data has a rising trend.
When looking into fire subcategories, the most reports belonged to: Outside Fires (41.1%), and Structure Fires (37.5%).
Fire incident types reported to NFIRS in Zip Code 94901


 Nearest zip codes: 94964, 94925, 94939, 94957, 94904, 94903.


 Based on the data from the years 2005 - 2018 the average number of fire incidents per year is 104. The highest number of fire incidents - 166 took place in 2013, and the least - 35 in 2009. The data has a rising trend.
 When looking into fire subcategories, the most reports belonged to: Outside Fires (41.1%), and Structure Fires (37.5%).