Estimated zip code population in 2022: 7,425 Zip code population in 2010: 6,859 Zip code population in 2000: 6,766
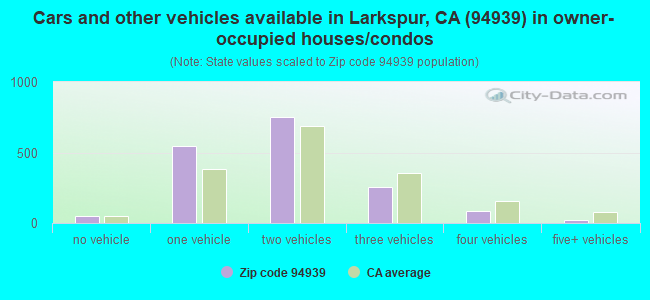
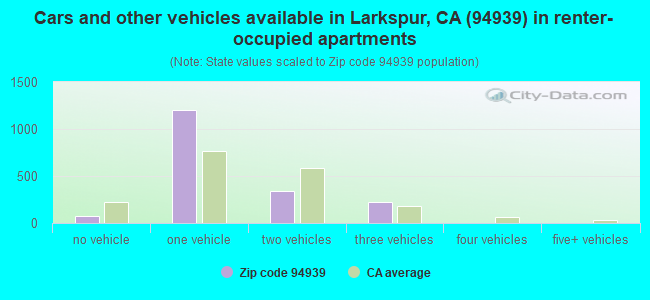
Houses and condos: 3,848 Renter-occupied apartments: 1,822
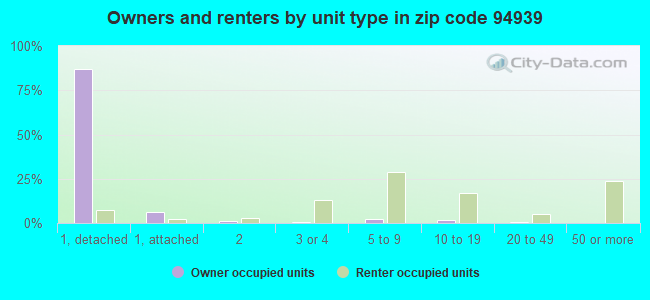
% of renters here:
52%
State:
44%
March 2022 cost of living index in zip code 94939: 136.8 (high, U.S. average is 100)
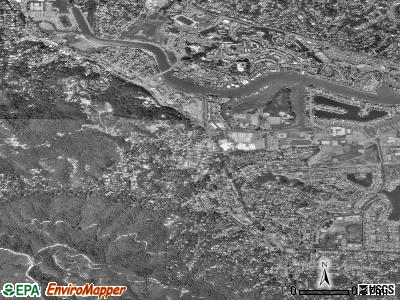
Land area: 2.1 sq. mi. Water area: 0.1 sq. mi.
Population density: 3,473 people per square mile
(average).
OSM Map
General Map
Google Map
MSN Map
OSM Map
General Map
Google Map
MSN Map
OSM Map
General Map
Google Map
MSN Map
OSM Map
General Map
Google Map
MSN Map
Please wait while loading the map...
Real estate property taxes paid for housing units in 2022:
This zip code:
0.5% ($10,292)
California:
0.7% ($4,831)
Median real estate property taxes paid for housing units with mortgages in 2022: $10,330 (0.5%) Median real estate property taxes paid for housing units with no mortgage in 2022: $9,867 (0.5%)
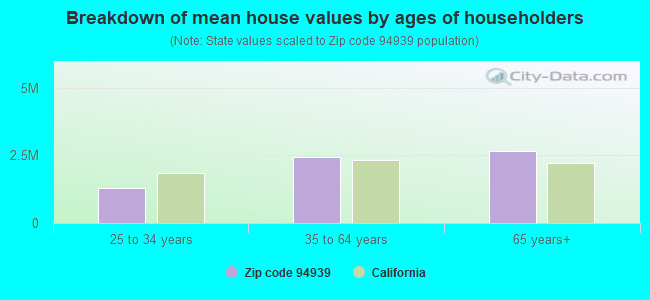
Estimated median house/condo value in 2022: $2,171,698
94939:
$2,171,698
California:
$715,900
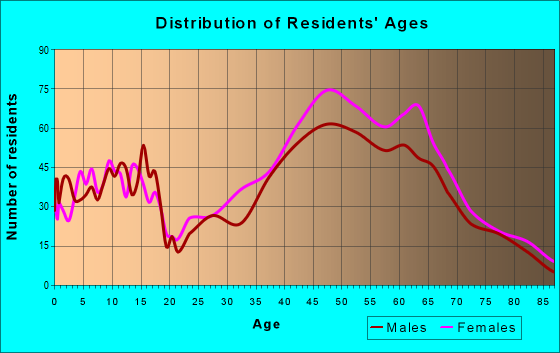
Median resident age:
This zip code:
47.0 years
California median age:
37.9 years
Average household size:
This zip code:
2.1 people
California:
2.8 people
Averages for the 2020 tax year for zip code 94939, filed in 2021:
Average Adjusted Gross Income (AGI) in 2020: $321,589 (Individual Income Tax Returns)
Here:
$321,589
State:
$95,910
Salary/wage: $242,193 (reported on 69.3% of returns)
Here:
$242,193
State:
$77,331
(% of AGI for various income ranges: 1057.1% for AGIs below $25k, 3687.7% for AGIs $25k-50k, 6930.0% for AGIs $50k-75k, 10747.9% for AGIs $75k-100k, 19911.9% for AGIs $100k-200k, 239263.6% for AGIs over 200k)
Taxable interest for individuals: $7,021 (reported on 59.2% of returns)
This zip code:
$7,021
California:
$2,294
(% of AGI for various income ranges: 67.1% for AGIs below $25k, 73.6% for AGIs $25k-50k, 111.6% for AGIs $50k-75k, 357.1% for AGIs $75k-100k, 479.1% for AGIs $100k-200k, 5895.9% for AGIs over 200k)
Ordinary dividends: $35,545 (reported on 55.2% of returns)
Here:
$35,545
State:
$10,949
(% of AGI for various income ranges: 219.4% for AGIs below $25k, 387.3% for AGIs $25k-50k, 618.4% for AGIs $50k-75k, 1344.3% for AGIs $75k-100k, 2061.2% for AGIs $100k-200k, 28360.9% for AGIs over 200k)
Net capital gain/loss in AGI: +$110,864 (reported on 53.1% of returns)
Here:
+$110,864
State:
+$49,306
(% of AGI for various income ranges: 88.1% for AGIs below $25k, 310.9% for AGIs $25k-50k, 377.4% for AGIs $50k-75k, 1285.7% for AGIs $75k-100k, 2205.3% for AGIs $100k-200k, 95494.5% for AGIs over 200k)
Profit/loss from business: +$48,026 (reported on 24.3% of returns)
Here:
+$48,026
State:
+$15,671
(% of AGI for various income ranges: 271.9% for AGIs below $25k, 895.9% for AGIs $25k-50k, 917.9% for AGIs $50k-75k, 1518.6% for AGIs $75k-100k, 1748.1% for AGIs $100k-200k, 14284.5% for AGIs over 200k)
Taxable individual retirement arrangement distribution: $40,937 (reported on 14.4% of returns)
94939:
$40,937
California:
$23,505
(% of AGI for various income ranges: 158.7% for AGIs below $25k, 240.9% for AGIs $25k-50k, 372.1% for AGIs $50k-75k, 980.0% for AGIs $75k-100k, 1945.3% for AGIs $100k-200k, 5809.1% for AGIs over 200k)
Self-employed (Keogh) retirement plans: $41,881 (reported on 5.6% of returns)
94939:
$41,881
California:
$30,163
(% of AGI for various income ranges: 165.3% for AGIs $50k-75k, 145.6% for AGIs $100k-200k, 3643.2% for AGIs over 200k)
Total itemized deductions: $57,550 (reported on 31.7% of returns)
Here:
$57,550
State:
$39,517
(% of AGI for various income ranges: 372.3% for AGIs below $25k, 847.7% for AGIs $25k-50k, 751.6% for AGIs $50k-75k, 1930.0% for AGIs $75k-100k, 2962.2% for AGIs $100k-200k, 23571.4% for AGIs over 200k)
Charity contributions: $23,314 (reported on 27.7% of returns)
Here:
$23,314
State:
$12,598
(% of AGI for various income ranges: 10.0% for AGIs below $25k, 66.4% for AGIs $25k-50k, 63.7% for AGIs $50k-75k, 209.3% for AGIs $75k-100k, 381.2% for AGIs $100k-200k, 10198.2% for AGIs over 200k)
Taxes paid: $9,292 (reported on 31.7% of returns)
94939:
$9,292
State:
$8,807
(% of AGI for various income ranges: 66.8% for AGIs below $25k, 162.7% for AGIs $25k-50k, 205.3% for AGIs $50k-75k, 449.3% for AGIs $75k-100k, 697.2% for AGIs $100k-200k, 3291.8% for AGIs over 200k)
Earned income credit: $1,169 (reported on 3.5% of returns)
Here:
$1,169
State:
$2,074
(% of AGI for various income ranges: 27.7% for AGIs below $25k, 30.0% for AGIs $25k-50k)
Percentage of individuals using paid preparers for their 2020 taxes: 92.5%
Here:
93%
State:
92%
(% for various income ranges: 91.3% for AGIs below $25k, 90.5% for AGIs $25k-50k, 89.2% for AGIs $50k-75k, 93.9% for AGIs $75k-100k, 92.2% for AGIs $100k-200k, 94.9% for AGIs over 200k)
Averages for the 2012 tax year for zip code 94939, filed in 2013:
Average Adjusted Gross Income (AGI) in 2012: $200,555 (Individual Income Tax Returns)
Here:
$200,555
State:
$72,726
Salary/wage: $149,595 (reported on 70.0% of returns)
Here:
$149,595
State:
$59,079
(% of AGI for various income ranges: 62.1% for AGIs below $25k, 57.4% for AGIs $25k-50k, 62.8% for AGIs $50k-75k, 57.6% for AGIs $75k-100k, 62.2% for AGIs $100k-200k, 49.2% for AGIs over 200k)
Taxable interest for individuals: $4,670 (reported on 58.3% of returns)
This zip code:
$4,670
California:
$2,146
(% of AGI for various income ranges: 3.3% for AGIs below $25k, 2.1% for AGIs $25k-50k, 1.7% for AGIs $50k-75k, 1.5% for AGIs $75k-100k, 1.6% for AGIs $100k-200k, 1.2% for AGIs over 200k)
Ordinary dividends: $39,507 (reported on 49.3% of returns)
Here:
$39,507
State:
$9,308
(% of AGI for various income ranges: 8.9% for AGIs below $25k, 4.8% for AGIs $25k-50k, 4.5% for AGIs $50k-75k, 6.3% for AGIs $75k-100k, 5.6% for AGIs $100k-200k, 11.1% for AGIs over 200k)
Net capital gain/loss in AGI: +$49,883 (reported on 48.5% of returns)
Here:
+$49,883
State:
+$30,460
(% of AGI for various income ranges: 0.1% for AGIs below $25k, 1.2% for AGIs $25k-50k, 1.0% for AGIs $50k-75k, 1.5% for AGIs $75k-100k, 2.9% for AGIs $100k-200k, 15.5% for AGIs over 200k)
Profit/loss from business: +$56,529 (reported on 28.3% of returns)
Here:
+$56,529
State:
+$17,064
(% of AGI for various income ranges: 23.3% for AGIs below $25k, 15.7% for AGIs $25k-50k, 9.0% for AGIs $50k-75k, 9.3% for AGIs $75k-100k, 7.7% for AGIs $100k-200k, 7.4% for AGIs over 200k)
Taxable individual retirement arrangement distribution: $27,935 (reported on 18.2% of returns)
94939:
$27,935
California:
$19,557
(% of AGI for various income ranges: 7.8% for AGIs below $25k, 4.5% for AGIs $25k-50k, 5.1% for AGIs $50k-75k, 5.3% for AGIs $75k-100k, 4.9% for AGIs $100k-200k, 1.7% for AGIs over 200k)
Self-employment retirement plans: $30,823 (reported on 6.2% of returns)
94939:
$30,823
California:
$24,530
(% of AGI for various income ranges: 2.5% for AGIs $50k-75k, 0.7% for AGIs $100k-200k, 1.0% for AGIs over 200k)
Total itemized deductions: $65,321 (21% of AGI, reported on 58.0% of returns)
Here:
$65,321
State:
$34,004
Here:
20.6% of AGI
State:
22.7% of AGI
(% of AGI for various income ranges: 37.3% for AGIs below $25k, 17.6% for AGIs $25k-50k, 15.4% for AGIs $50k-75k, 20.2% for AGIs $75k-100k, 20.9% for AGIs $100k-200k, 18.4% for AGIs over 200k)
Charity contributions: $8,724 (reported on 50.1% of returns)
Here:
$8,724
State:
$4,659
(% of AGI for various income ranges: 1.8% for AGIs below $25k, 1.1% for AGIs $25k-50k, 1.5% for AGIs $50k-75k, 1.2% for AGIs $75k-100k, 1.7% for AGIs $100k-200k, 2.4% for AGIs over 200k)
Taxes paid: $35,173 (reported on 58.0% of returns)
94939:
$35,173
State:
$14,448
(% of AGI for various income ranges: 7.1% for AGIs below $25k, 4.4% for AGIs $25k-50k, 4.9% for AGIs $50k-75k, 7.2% for AGIs $75k-100k, 9.2% for AGIs $100k-200k, 11.0% for AGIs over 200k)
Earned income credit: $1,338 (reported on 4.5% of returns)
Here:
$1,338
State:
$2,286
(% of AGI for various income ranges: 1.9% for AGIs below $25k, 0.3% for AGIs $25k-50k)
Percentage of individuals using paid preparers for their 2012 taxes: 65.0%
Here:
65%
State:
64%
(% for various income ranges: 57.0% for AGIs below $25k, 54.9% for AGIs $25k-50k, 56.1% for AGIs $50k-75k, 68.6% for AGIs $75k-100k, 67.6% for AGIs $100k-200k, 80.0% for AGIs over 200k)
Averages for the 2004 tax year for zip code 94939, filed in 2005:
Average Adjusted Gross Income (AGI) in 2004: $145,700 (Individual Income Tax Returns)
Here:
$145,700
State:
$58,600
Salary/wage: $114,408 (reported on 70.4% of returns)
Here:
$114,408
State:
$49,455
(% of AGI for various income ranges: 56.7% for AGIs $10k-25k, 66.5% for AGIs $25k-50k, 64.3% for AGIs $50k-75k, 62.8% for AGIs $75k-100k, 52.6% for AGIs over 100k)
Taxable interest for individuals: $4,940 (reported on 63.8% of returns)
This zip code:
$4,940
California:
$2,365
(% of AGI for various income ranges: 7.4% for AGIs $10k-25k, 3.7% for AGIs $25k-50k, 3.1% for AGIs $50k-75k, 3.3% for AGIs $75k-100k, 1.7% for AGIs over 100k)
Taxable dividends: $11,235 (reported on 54.4% of returns)
Here:
$11,235
State:
$4,746
(% of AGI for various income ranges: 7.3% for AGIs $10k-25k, 4.0% for AGIs $25k-50k, 3.7% for AGIs $50k-75k, 3.5% for AGIs $75k-100k, 4.1% for AGIs over 100k)
Net capital gain/loss: +$41,451 (reported on 49.7% of returns)
Here:
+$41,451
State:
+$23,418
(% of AGI for various income ranges: 2.2% for AGIs $10k-25k, 1.4% for AGIs $25k-50k, 2.4% for AGIs $50k-75k, 3.3% for AGIs $75k-100k, 16.7% for AGIs over 100k)
Profit/loss from business: +$38,827 (reported on 27.3% of returns)
Here:
+$38,827
State:
+$16,826
(% of AGI for various income ranges: 16.4% for AGIs $10k-25k, 12.3% for AGIs $25k-50k, 8.4% for AGIs $50k-75k, 9.4% for AGIs $75k-100k, 6.5% for AGIs over 100k)
IRA payment deduction: $3,304 (reported on 4.9% of returns)
94939:
$3,304
California:
$3,192
(% of AGI for various income ranges: 1.0% for AGIs $10k-25k, 0.5% for AGIs $25k-50k, 0.3% for AGIs $50k-75k, 0.2% for AGIs $75k-100k, 0.0% for AGIs over 100k)
Self-employed pension: $24,363 (reported on 7.2% of returns)
Here:
$24,363
California:
$17,688
(% of AGI for various income ranges: 0.6% for AGIs $10k-25k, 0.6% for AGIs $25k-50k, 0.8% for AGIs $50k-75k, 1.1% for AGIs $75k-100k, 1.3% for AGIs over 100k)
Total itemized deductions: $44,457 (18% of AGI, reported on 53.0% of returns)
Here:
$44,457
State:
$28,113
Here:
18.0% of AGI
State:
25.3% of AGI
(% of AGI for various income ranges: 25.9% for AGIs $10k-25k, 16.8% for AGIs $25k-50k, 17.8% for AGIs $50k-75k, 20.3% for AGIs $75k-100k, 15.2% for AGIs over 100k)
Charity contributions deductions: $6,251 (2% of AGI, reported on 47.9% of returns)
Here:
$6,251
State:
$3,923
Here:
2.3% of AGI
State:
3.3% of AGI
(% of AGI for various income ranges: 1.2% for AGIs $10k-25k, 1.3% for AGIs $25k-50k, 1.7% for AGIs $50k-75k, 2.0% for AGIs $75k-100k, 2.1% for AGIs over 100k)
Total tax: $35,523 (reported on 87.4% of returns)
94939:
$35,523
State:
$10,761
(% of AGI for various income ranges: 7.0% for AGIs $10k-25k, 10.7% for AGIs $25k-50k, 12.5% for AGIs $50k-75k, 13.5% for AGIs $75k-100k, 23.2% for AGIs over 100k)
Earned income credit: $670 (reported on 3.3% of returns)
Here:
$670
State:
$1,763
Percentage of individuals using paid preparers for their 2004 taxes: 63.5%
Here:
64%
State:
66%
(% for various income ranges: 60.3% for AGIs below $10k, 55.4% for AGIs $10k-25k, 54.2% for AGIs $25k-50k, 62.0% for AGIs $50k-75k, 64.0% for AGIs $75k-100k, 75.5% for AGIs over 100k)
Household received Food Stamps/SNAP in the past 12 months: 32 Household did not receive Food Stamps/SNAP in the past 12 months: 3,403
Women who had a birth in the past 12 months: 59 (42 now married, 17 unmarried) Women who did not have a birth in the past 12 months: 1,491 (525 now married, 968 unmarried)
Housing units in zip code 94939 with a mortgage: 1,192 (145 second mortgage, 135 both second mortgage and home equity loan) Houses without a mortgage: 17
Median monthly owner costs for units with a mortgage: $3,876 Median monthly owner costs for units without a mortgage: $1,440
Residents with income below the poverty level in 2022:
This zip code:
6.9%
Whole state:
12.2%
Residents with income below 50% of the poverty level in 2022:
This zip code:
4.9%
Whole state:
6.2%
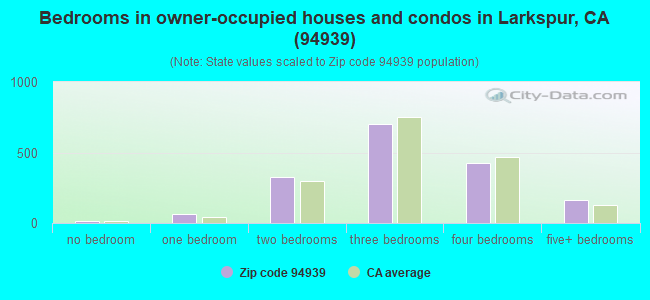
Median number of rooms in houses and condos:
Here:
6.3
State:
6.0
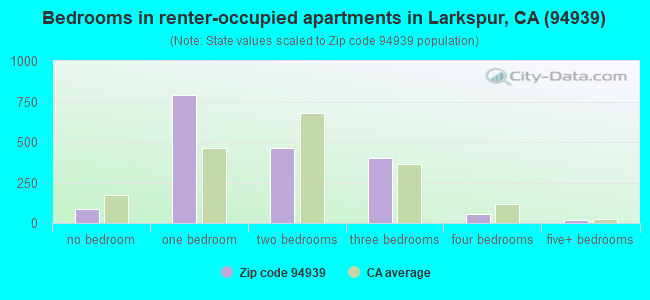
Median number of rooms in apartments:
Here:
3.8
State:
3.9
Notable locations in this zip code not listed on our city pages
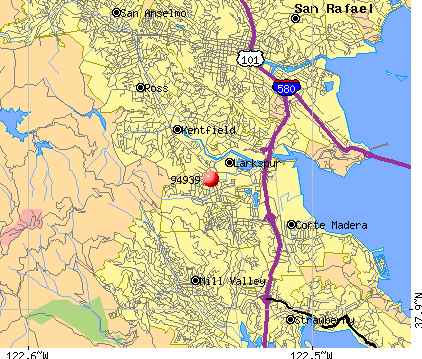
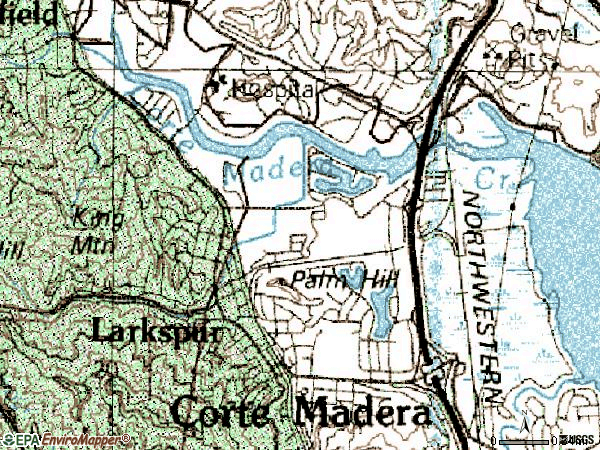
Notable locations in zip code 94939: Higgins Landing Small Craft Dock (A), Larkspur Public Library (B), Larkspur City Hall (C), City of Larkspur Fire Department (D). Display/hide their locations on the map
Churches in zip code 94939 include: Calvary Baptist Church (A), Redwoods Presbyterian Church (B), Saint Patricks Catholic Church (C). Display/hide their locations on the map
Parks in zip code 94939 include: Dolliver Park (1), Heatherwood Park (2), Magnolia Park (3), Piper Park (4), Blithdale Summit Preserve (5), King Mountain Preserve (6). Display/hide their locations on the map
In group quarters: 25 (-1 institutionalized population)
Size of family households: 761 2-persons, 550 3-persons, 416 4-persons, 100 5-persons, 13 6-persons
Size of nonfamily households: 1,450 1-person, 251 2-persons
1,097 married couples with children.
311 single-parent households (45 men, 266 women).
87.5% of residents of 94939 zip code speak English at home.
2.3% of residents speak Spanish at home (46% very well, 22% well, 6% not well, 27% not at all).
8.0% of residents speak other Indo-European language at home (72% very well, 17% well, 7% not well, 4% not at all).
1.2% of residents speak Asian or Pacific Island language at home (19% very well, 79% well, 2% not well).
0.8% of residents speak other language at home (56% very well, 44% well).
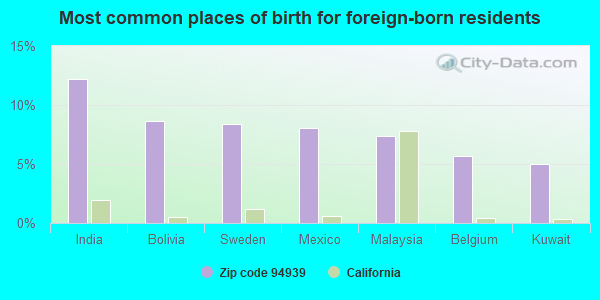
Foreign born population: 1,039 (14.0%) (49.4% of them are naturalized citizens)
This zip code:
14.0%
Whole state:
26.7%
12%India
9%Bolivia
8%Sweden
8%Mexico
7%Malaysia
6%Belgium
5%Kuwait
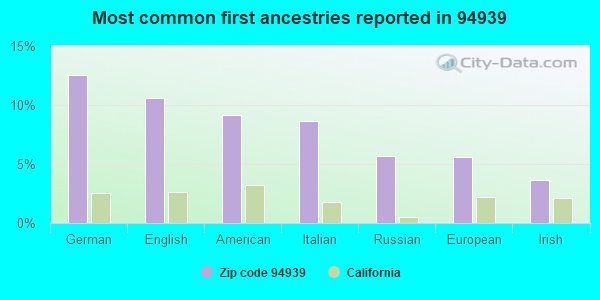
13%German
11%English
9%American
9%Italian
6%Russian
6%European
4%Irish
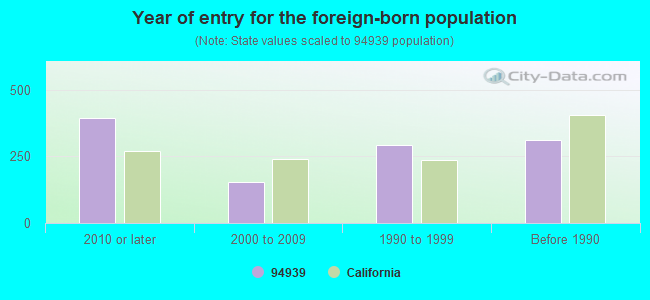
Year of entry for the foreign-born population
3952010 or later
1542000 to 2009
2951990 to 1999
311Before 1990
Facilities with environmental interests located in this zip code:
MAXWELL THE CLEANER (1401 LARKSPUR LANDING CIRCL in LARKSPUR, CA)
STATE MASTER (California - Hazardous Waste Tracking) - HAZARDOU WASTE PROGRAM CRITERIA AND HAZARDOUS AIR POLLUTANT INVENTORY (Inventory of air pollution sources) Small Quantity Generators, between 100 kg and 1000 kg of hazardous waste/month (Resource Conservation and Recovery Act (tracking hazardous waste)) - notification Business SIC classification: DRYCLEANING PLANTS, EXCEPT RUG CLEANING Organizations: BARBARA OWENS (CONTACT/OWNER)
NIVEN COMPANY (#2 WARD STREET in LARKSPUR, CA)
STATE MASTER (California - Hazardous Waste Tracking) - HAZARDOU WASTE PROGRAM Small Quantity Generators, between 100 kg and 1000 kg of hazardous waste/month (Resource Conservation and Recovery Act (tracking hazardous waste)) - notification Organizations: L NIVEN OR C NIVEN (CONTACT/OWNER)
HALL MIDDLE (200 DOHERTY DR. in LARKSPUR, CA)
(National Center for Education Statistics) - STATE ID-6024350 Organizations: LARKSPUR ELEMENTARY (SCHOOL DISTRICT)
LARKSPUR FERRY CHANNEL (EAST OF LARKSPUR (APPROX 0.5 MILES OFF SHORE) in LARKSPUR, CA)
(Integrated Compliance Information System) - ICIS-09-2003-0191, FORMAL ENFORCEMENT ACTION Business SIC classification: HEAVY CONSTRUCTION
MARIN CLEANERS (590 MAGNOLIA STREET in LARKSPUR, CA)
CRITERIA AND HAZARDOUS AIR POLLUTANT INVENTORY (Inventory of air pollution sources) Small Quantity Generators, between 100 kg and 1000 kg of hazardous waste/month (Resource Conservation and Recovery Act (tracking hazardous waste)) Business SIC classification: DRYCLEANING PLANTS, EXCEPT RUG CLEANING Organizations: KOO JA SANG (CONTACT/OWNER)
Alternative names: LARKSPUR CLEANERS
LIFESOURCE INC (900 LARKSPUR LANDING CIR #250 in LARKSPUR, CA)
Small Quantity Generators, between 100 kg and 1000 kg of hazardous waste/month (Resource Conservation and Recovery Act (tracking hazardous waste)) - notification Organizations: NORMAN C PLUMMER (CONTACT/OWNER)
LARKSPUR SCHOOL DISTRICT (18 MAGNOLIA AVE in LARKSPUR, CA)
COMPLIANCE ACTIVITY (Tracking inspections of insecticide, fungicide, and rodenticide, and toxic substances)
MARIN MEDICAL LABORATORIES (2 BON AIR RD STE 120 in LARKSPUR, CA)
Small Quantity Generators, between 100 kg and 1000 kg of hazardous waste/month (Resource Conservation and Recovery Act (tracking hazardous waste)) - notification Business NAICS classification: MEDICAL LABORATORIES. Organizations: BON AIR ASSOCIATES (CONTACT/OWNER)
MARTIN MOBILE OUTPATIENT SVC (5 BON AIR RD STE 121 in LARKSPUR, CA)
Small Quantity Generators, between 100 kg and 1000 kg of hazardous waste/month (Resource Conservation and Recovery Act (tracking hazardous waste)) - notification Organizations: GEORGE CAGLE (CONTACT/OWNER)
FLANAGAN FOWLERS PARTNERS,LLC (80 E SIR FRANCIS DRAKE BLVD,STE 3B in LARKSPUR, CA)
COMPLIANCE ACTIVITY (Tracking inspections of insecticide, fungicide, and rodenticide, and toxic substances)
J R MUGGS (1801 LARKSPUR LANDING in LARKSPUR, CA)
CRITERIA AND HAZARDOUS AIR POLLUTANT INVENTORY (Inventory of air pollution sources) Business SIC classification: ROASTED COFFEE
MARIN PRIMARY (20 MAGNOLIA AVE in LARKSPUR, CA)
COMPLIANCE ACTIVITY (Tracking inspections of insecticide, fungicide, and rodenticide, and toxic substances)
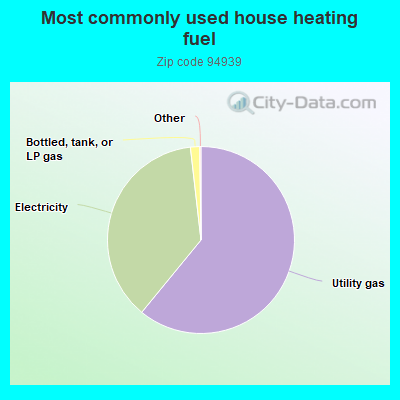
61.0%Utility gas
37.3%Electricity
1.6%Bottled, tank, or LP gas
Population in 1990: 5,884. Population change in the 1990s: +882 (+15.0%).
Place of birth for U.S.-born residents:
This state: 3,747
Northeast: 1,234
Midwest: 546
South: 373
West: 354
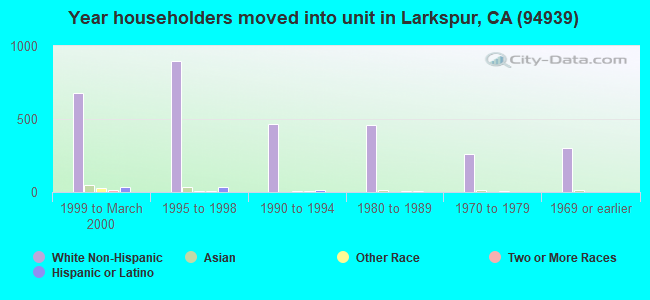
57% of the 94939 zip code residents lived in the same house 5 years ago. Out of people who lived in different houses, 45% lived in this county. Out of people who lived in different counties, 50% lived in California.
86% of the 94939 zip code residents lived in the same house 1 year ago. Out of people who lived in different houses, 44% moved from this county. Out of people who lived in different houses, 43% moved from different county within same state. Out of people who lived in different houses, 10% moved from different state. Out of people who lived in different houses, 2% moved from abroad.
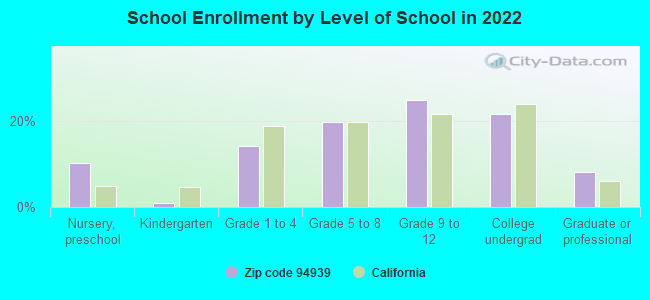
Private vs. public school enrollment:
Students in private schools in grades 1 to 8 (elementary and middle school): 166
Here:
28.4%
California:
10.5%
Students in private schools in grades 9 to 12 (high school): 70
Here:
16.6%
California:
8.5%
Students in private undergraduate colleges: 61
Here:
16.6%
California:
15.9%
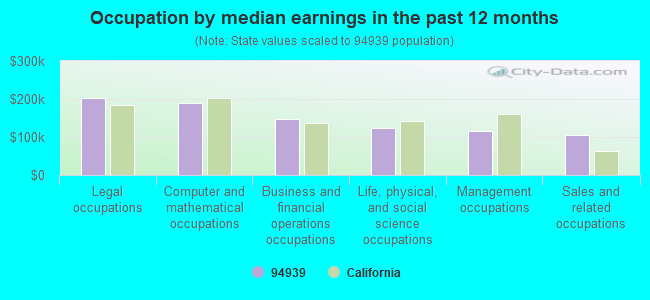
Occupation by median earnings in the past 12 months ($)
203,420Legal occupations
188,332Computer and mathematical occupations
147,334Business and financial operations occupations
124,119Life, physical, and social science occupations
116,651Management occupations
104,962Sales and related occupations
Companies with federal contracts located in this zip code (LARKSPUR, CA):
POLYNESIA LINE LTD (700 LARKSPUR LANDING CIRCL; small business) : $30,338,443 in 13 contractsfrom 2001 to 2006
Contracts for Other Cargo and Freight Services, Vessel Freight by Army Signed by year:2000: $0; 2001: $28,673,277; 2002: $0; 2003: $217,593; 2004: $644,332; 2005: $800,841; 2006: $2,400.
Biggest contracts:
$28,571,427 with Army for Other Cargo and Freight Services. Signed on 2001-09-01. Completion date: 2002-08-31.
$644,332 with Army for Vessel Freight. Signed on 2004-02-26. Completion date: 2005-02-28.
$491,841, same as above.Signed on 2005-03-01. Completion date: 2005-09-30.
$217,593, same as above.Signed on 2003-04-02. Completion date: 2004-02-29.
GAGE-BABCOCK & ASSOCIATES, INC (100 LARKSPUR LANDING CIRCL) : $183,524 in 51 contractsfrom 2000 to 2003
Contracts for Architect - Engineer Services (including landscaping, interior layout, and designing), Other Architect and Engineering Services, Other Buildings by Navy Signed by year:2000: $131,168; 2001: $56,379; 2002: -$1,239; 2003: -$2,784; 2004: $0; 2005: $0; 2006: $0.
Biggest contracts:
$31,311 with Navy for Architect - Engineer Services (including landscaping, interior layout, and designing). Signed on 2001-06-26. Completion date: 2002-03-01.
$12,285, same as above.Signed on 2001-08-13. Completion date: 2003-03-01.
$11,294, same as above.Signed on 2000-08-31. Completion date: 2000-06-05.
$10,711, same as above.Signed on 2000-03-06. Completion date: 2000-03-06.
O'ROURKE, MARIA HLTH CARE MGT (30 PALM AVE STE 300; small business) : $69,620 in 6 contractsfrom 2004 to 2006
Contracts for Training/Curriculum Development, Educational Services, Lectures For Training, Other Administrative Support Services by Army Signed by year:2000: $0; 2001: $0; 2002: $0; 2003: $0; 2004: $17,650; 2005: $48,470; 2006: $3,500.
Biggest contracts:
$25,970 with Army for Training/Curriculum Development. Signed on 2005-08-25. Completion date: 2005-10-21.
$12,500 with Army for Educational Services. Taking place in GA. Signed on 2005-06-02. Completion date: 2005-06-24.
$12,500, same as above.Signed on 2004-05-14. Completion date: 2004-06-12.
$10,000 with Army for Educational Services. Signed on 2005-08-31. Completion date: 2005-09-22.
MINDJET, LLC (125 E SIR FRANCIS DR; small business)
$8,036 with Army for Maintenance, Repair and Rebuilding of Equipment -- Automatic Data Processing Equipment (Including Firmware), Software, Supplies and Support Equipment. Signed on 2005-04-25. Completion date: 2005-05-02.
Top industries in this zip code by the number of employees in 2005:
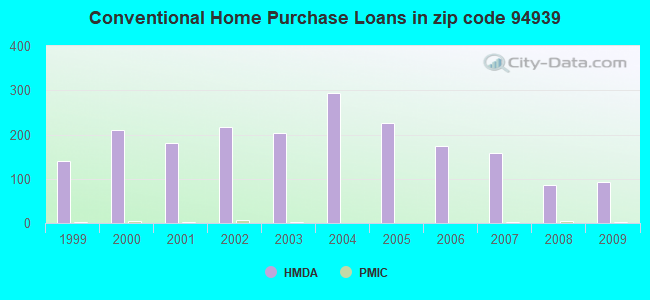
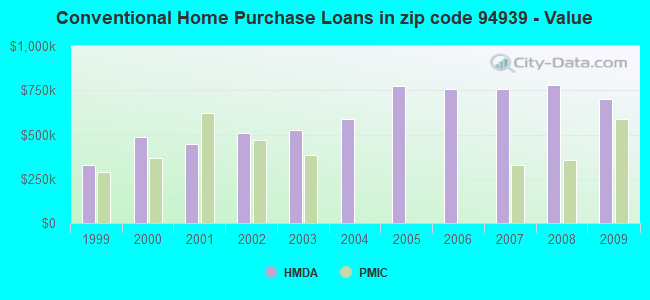
Detailed PMIC statistics for the following Tracts:1200.00
, 1212.00
2002 - 2018 National Fire Incident Reporting System (NFIRS) incidents
Based on the data from the years 2002 - 2018 the average number of fires per year is 18. The highest number of fires - 37 took place in 2015, and the least - 0 in 2003. The data has a dropping trend.
When looking into fire subcategories, the most reports belonged to: Structure Fires (62.1%), and Outside Fires (25.1%).
Fire incident types reported to NFIRS in Zip Code 94939
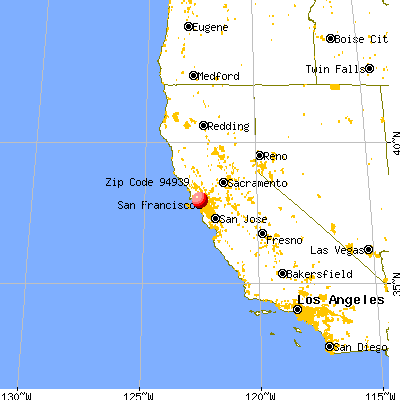


 Nearest zip codes: 94925, 94904, 94957, 94964, 94941, 94901.
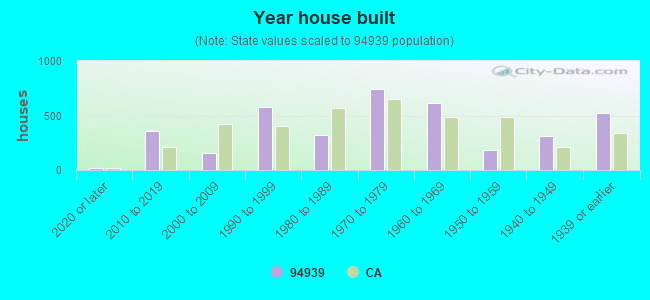


 Based on the data from the years 2002 - 2018 the average number of fires per year is 18. The highest number of fires - 37 took place in 2015, and the least - 0 in 2003. The data has a dropping trend.
 When looking into fire subcategories, the most reports belonged to: Structure Fires (62.1%), and Outside Fires (25.1%).