Estimated zip code population in 2022: 31,922 Zip code population in 2010: 30,496 Zip code population in 2000: 28,718
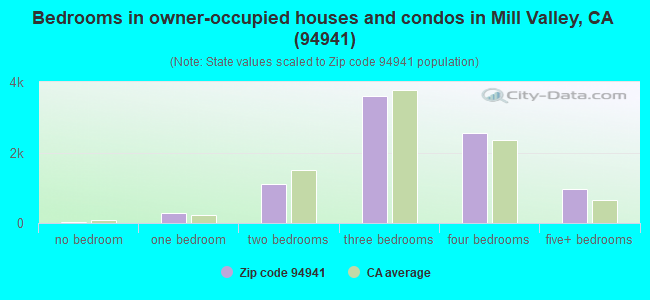
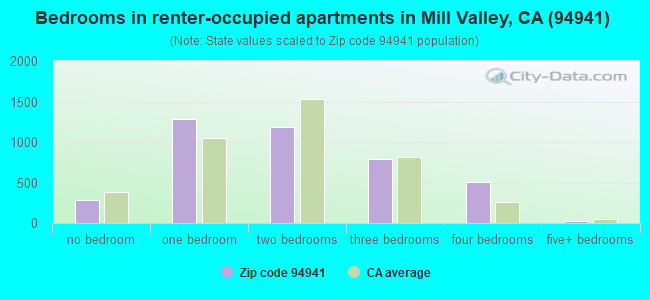
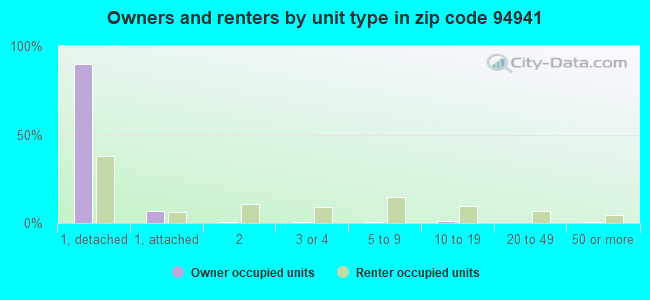
Houses and condos: 13,813 Renter-occupied apartments: 4,090
% of renters here:
32%
State:
44%
March 2022 cost of living index in zip code 94941: 131.3 (high, U.S. average is 100)
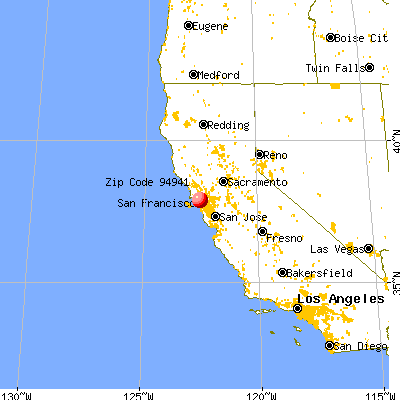
Land area: 22.2 sq. mi. Water area: 0.7 sq. mi.
Population density: 1,436 people per square mile
(low).
OSM Map
General Map
Google Map
MSN Map
OSM Map
General Map
Google Map
MSN Map
OSM Map
General Map
Google Map
MSN Map
OSM Map
General Map
Google Map
MSN Map
Please wait while loading the map...
Real estate property taxes paid for housing units in 2022:
This zip code:
0.5% ($10,292)
California:
0.7% ($4,831)
Median real estate property taxes paid for housing units with mortgages in 2022: $10,330 (0.5%) Median real estate property taxes paid for housing units with no mortgage in 2022: $10,572 (0.6%)
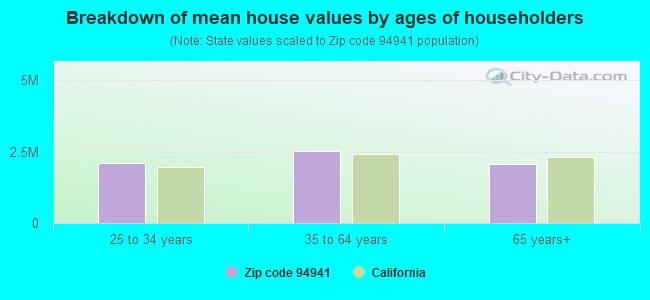
Estimated median house/condo value in 2022: $1,952,464
94941:
$1,952,464
California:
$715,900
According to our research of California and other state lists, there were 4 registered sex offenders living in 94941 zip code as of April 27, 2024. The ratio of all residents to sex offenders in zip code 94941 is 7,900 to 1. The ratio of registered sex offenders to all residents in this zip code is much lower than the state average.
Median resident age:
This zip code:
46.7 years
California median age:
37.9 years
Average household size:
This zip code:
2.5 people
California:
2.8 people
Averages for the 2020 tax year for zip code 94941, filed in 2021:
Average Adjusted Gross Income (AGI) in 2020: $332,161 (Individual Income Tax Returns)
Here:
$332,161
State:
$95,910
Salary/wage: $239,424 (reported on 67.5% of returns)
Here:
$239,424
State:
$77,331
(% of AGI for various income ranges: 1163.4% for AGIs below $25k, 3957.6% for AGIs $25k-50k, 6749.7% for AGIs $50k-75k, 10437.8% for AGIs $75k-100k, 19538.9% for AGIs $100k-200k, 204737.5% for AGIs over 200k)
Taxable interest for individuals: $5,905 (reported on 62.5% of returns)
This zip code:
$5,905
California:
$2,294
(% of AGI for various income ranges: 78.6% for AGIs below $25k, 238.2% for AGIs $25k-50k, 225.5% for AGIs $50k-75k, 309.0% for AGIs $75k-100k, 451.2% for AGIs $100k-200k, 4420.5% for AGIs over 200k)
Ordinary dividends: $26,066 (reported on 58.5% of returns)
Here:
$26,066
State:
$10,949
(% of AGI for various income ranges: 264.6% for AGIs below $25k, 583.2% for AGIs $25k-50k, 800.8% for AGIs $50k-75k, 1329.2% for AGIs $75k-100k, 2151.3% for AGIs $100k-200k, 18380.8% for AGIs over 200k)
Net capital gain/loss in AGI: +$127,030 (reported on 57.1% of returns)
Here:
+$127,030
State:
+$49,306
(% of AGI for various income ranges: 154.5% for AGIs below $25k, 410.0% for AGIs $25k-50k, 638.9% for AGIs $50k-75k, 1043.8% for AGIs $75k-100k, 2343.7% for AGIs $100k-200k, 103627.5% for AGIs over 200k)
Profit/loss from business: +$57,796 (reported on 28.0% of returns)
Here:
+$57,796
State:
+$15,671
(% of AGI for various income ranges: 380.2% for AGIs below $25k, 944.2% for AGIs $25k-50k, 1118.6% for AGIs $50k-75k, 1658.2% for AGIs $75k-100k, 3307.4% for AGIs $100k-200k, 17731.7% for AGIs over 200k)
Taxable individual retirement arrangement distribution: $40,874 (reported on 14.5% of returns)
94941:
$40,874
California:
$23,505
(% of AGI for various income ranges: 140.4% for AGIs below $25k, 394.3% for AGIs $25k-50k, 600.2% for AGIs $50k-75k, 1000.2% for AGIs $75k-100k, 2191.0% for AGIs $100k-200k, 5042.9% for AGIs over 200k)
Self-employed (Keogh) retirement plans: $38,359 (reported on 7.3% of returns)
94941:
$38,359
California:
$30,163
(% of AGI for various income ranges: 86.8% for AGIs $25k-50k, 73.3% for AGIs $50k-75k, 149.0% for AGIs $75k-100k, 439.1% for AGIs $100k-200k, 3508.7% for AGIs over 200k)
Total itemized deductions: $56,287 (reported on 37.8% of returns)
Here:
$56,287
State:
$39,517
(% of AGI for various income ranges: 486.4% for AGIs below $25k, 1161.8% for AGIs $25k-50k, 1524.8% for AGIs $50k-75k, 2256.4% for AGIs $75k-100k, 3886.8% for AGIs $100k-200k, 23853.9% for AGIs over 200k)
Charity contributions: $21,854 (reported on 32.5% of returns)
Here:
$21,854
State:
$12,598
(% of AGI for various income ranges: 21.4% for AGIs below $25k, 78.1% for AGIs $25k-50k, 145.0% for AGIs $50k-75k, 197.6% for AGIs $75k-100k, 514.7% for AGIs $100k-200k, 9704.0% for AGIs over 200k)
Taxes paid: $9,355 (reported on 37.6% of returns)
94941:
$9,355
State:
$8,807
(% of AGI for various income ranges: 112.7% for AGIs below $25k, 233.5% for AGIs $25k-50k, 341.8% for AGIs $50k-75k, 543.2% for AGIs $75k-100k, 996.2% for AGIs $100k-200k, 3337.4% for AGIs over 200k)
Earned income credit: $1,294 (reported on 3.3% of returns)
Here:
$1,294
State:
$2,074
(% of AGI for various income ranges: 34.9% for AGIs below $25k, 31.8% for AGIs $25k-50k)
Percentage of individuals using paid preparers for their 2020 taxes: 92.6%
Here:
93%
State:
92%
(% for various income ranges: 89.7% for AGIs below $25k, 89.6% for AGIs $25k-50k, 91.2% for AGIs $50k-75k, 93.2% for AGIs $75k-100k, 92.7% for AGIs $100k-200k, 95.4% for AGIs over 200k)
Averages for the 2012 tax year for zip code 94941, filed in 2013:
Average Adjusted Gross Income (AGI) in 2012: $225,024 (Individual Income Tax Returns)
Here:
$225,024
State:
$72,726
Salary/wage: $161,991 (reported on 68.3% of returns)
Here:
$161,991
State:
$59,079
(% of AGI for various income ranges: 54.9% for AGIs below $25k, 57.7% for AGIs $25k-50k, 52.2% for AGIs $50k-75k, 54.1% for AGIs $75k-100k, 58.5% for AGIs $100k-200k, 47.1% for AGIs over 200k)
Taxable interest for individuals: $4,931 (reported on 61.8% of returns)
This zip code:
$4,931
California:
$2,146
(% of AGI for various income ranges: 3.9% for AGIs below $25k, 2.0% for AGIs $25k-50k, 2.3% for AGIs $50k-75k, 1.9% for AGIs $75k-100k, 1.3% for AGIs $100k-200k, 1.2% for AGIs over 200k)
Ordinary dividends: $20,543 (reported on 53.7% of returns)
Here:
$20,543
State:
$9,308
(% of AGI for various income ranges: 10.4% for AGIs below $25k, 5.6% for AGIs $25k-50k, 5.3% for AGIs $50k-75k, 5.5% for AGIs $75k-100k, 5.0% for AGIs $100k-200k, 4.8% for AGIs over 200k)
Net capital gain/loss in AGI: +$77,963 (reported on 50.7% of returns)
Here:
+$77,963
State:
+$30,460
(% of AGI for various income ranges: 1.4% for AGIs below $25k, 2.0% for AGIs $25k-50k, 2.0% for AGIs $50k-75k, 2.7% for AGIs $75k-100k, 3.9% for AGIs $100k-200k, 21.6% for AGIs over 200k)
Profit/loss from business: +$45,283 (reported on 31.2% of returns)
Here:
+$45,283
State:
+$17,064
(% of AGI for various income ranges: 23.4% for AGIs below $25k, 14.8% for AGIs $25k-50k, 12.7% for AGIs $50k-75k, 10.5% for AGIs $75k-100k, 10.3% for AGIs $100k-200k, 4.7% for AGIs over 200k)
Taxable individual retirement arrangement distribution: $29,191 (reported on 18.1% of returns)
94941:
$29,191
California:
$19,557
(% of AGI for various income ranges: 7.2% for AGIs below $25k, 4.9% for AGIs $25k-50k, 6.5% for AGIs $50k-75k, 5.9% for AGIs $75k-100k, 5.4% for AGIs $100k-200k, 1.4% for AGIs over 200k)
Self-employment retirement plans: $30,070 (reported on 7.7% of returns)
94941:
$30,070
California:
$24,530
(% of AGI for various income ranges: 0.4% for AGIs below $25k, 0.5% for AGIs $25k-50k, 0.9% for AGIs $50k-75k, 0.8% for AGIs $75k-100k, 1.4% for AGIs $100k-200k, 1.0% for AGIs over 200k)
Total itemized deductions: $67,770 (20% of AGI, reported on 60.9% of returns)
Here:
$67,770
State:
$34,004
Here:
19.6% of AGI
State:
22.7% of AGI
(% of AGI for various income ranges: 35.2% for AGIs below $25k, 21.4% for AGIs $25k-50k, 19.8% for AGIs $50k-75k, 21.3% for AGIs $75k-100k, 22.9% for AGIs $100k-200k, 17.1% for AGIs over 200k)
Charity contributions: $9,921 (reported on 53.5% of returns)
Here:
$9,921
State:
$4,659
(% of AGI for various income ranges: 1.6% for AGIs below $25k, 1.4% for AGIs $25k-50k, 1.6% for AGIs $50k-75k, 1.7% for AGIs $75k-100k, 1.9% for AGIs $100k-200k, 2.5% for AGIs over 200k)
Taxes paid: $36,752 (reported on 60.8% of returns)
94941:
$36,752
State:
$14,448
(% of AGI for various income ranges: 8.7% for AGIs below $25k, 6.1% for AGIs $25k-50k, 6.3% for AGIs $50k-75k, 8.1% for AGIs $75k-100k, 9.8% for AGIs $100k-200k, 10.3% for AGIs over 200k)
Earned income credit: $1,350 (reported on 4.6% of returns)
Here:
$1,350
State:
$2,286
(% of AGI for various income ranges: 2.0% for AGIs below $25k, 0.2% for AGIs $25k-50k)
Percentage of individuals using paid preparers for their 2012 taxes: 66.8%
Here:
67%
State:
64%
(% for various income ranges: 56.4% for AGIs below $25k, 57.4% for AGIs $25k-50k, 61.7% for AGIs $50k-75k, 67.2% for AGIs $75k-100k, 70.9% for AGIs $100k-200k, 80.8% for AGIs over 200k)
Averages for the 2004 tax year for zip code 94941, filed in 2005:
Average Adjusted Gross Income (AGI) in 2004: $150,522 (Individual Income Tax Returns)
Here:
$150,522
State:
$58,600
Salary/wage: $115,907 (reported on 67.1% of returns)
Here:
$115,907
State:
$49,455
(% of AGI for various income ranges: 48.1% for AGIs $10k-25k, 59.8% for AGIs $25k-50k, 59.5% for AGIs $50k-75k, 61.2% for AGIs $75k-100k, 49.2% for AGIs over 100k)
Taxable interest for individuals: $5,917 (reported on 67.9% of returns)
This zip code:
$5,917
California:
$2,365
(% of AGI for various income ranges: 6.3% for AGIs $10k-25k, 3.8% for AGIs $25k-50k, 3.1% for AGIs $50k-75k, 3.0% for AGIs $75k-100k, 2.3% for AGIs over 100k)
Taxable dividends: $11,102 (reported on 58.1% of returns)
Here:
$11,102
State:
$4,746
(% of AGI for various income ranges: 8.0% for AGIs $10k-25k, 4.6% for AGIs $25k-50k, 4.7% for AGIs $50k-75k, 4.1% for AGIs $75k-100k, 4.0% for AGIs over 100k)
Net capital gain/loss: +$53,952 (reported on 52.8% of returns)
Here:
+$53,952
State:
+$23,418
(% of AGI for various income ranges: 2.2% for AGIs $10k-25k, 1.4% for AGIs $25k-50k, 2.3% for AGIs $50k-75k, 2.6% for AGIs $75k-100k, 21.5% for AGIs over 100k)
Profit/loss from business: +$36,407 (reported on 31.9% of returns)
Here:
+$36,407
State:
+$16,826
(% of AGI for various income ranges: 22.0% for AGIs $10k-25k, 15.2% for AGIs $25k-50k, 12.1% for AGIs $50k-75k, 11.3% for AGIs $75k-100k, 6.5% for AGIs over 100k)
IRA payment deduction: $3,363 (reported on 4.2% of returns)
94941:
$3,363
California:
$3,192
(% of AGI for various income ranges: 0.6% for AGIs $10k-25k, 0.5% for AGIs $25k-50k, 0.3% for AGIs $50k-75k, 0.3% for AGIs $75k-100k, 0.0% for AGIs over 100k)
Self-employed pension: $22,527 (reported on 8.5% of returns)
Here:
$22,527
California:
$17,688
(% of AGI for various income ranges: 0.8% for AGIs $10k-25k, 1.0% for AGIs $25k-50k, 1.0% for AGIs $50k-75k, 1.2% for AGIs $75k-100k, 1.3% for AGIs over 100k)
Total itemized deductions: $52,183 (21% of AGI, reported on 57.5% of returns)
Here:
$52,183
State:
$28,113
Here:
21.3% of AGI
State:
25.3% of AGI
(% of AGI for various income ranges: 32.5% for AGIs $10k-25k, 22.8% for AGIs $25k-50k, 23.5% for AGIs $50k-75k, 26.7% for AGIs $75k-100k, 18.5% for AGIs over 100k)
Charity contributions deductions: $10,075 (4% of AGI, reported on 52.5% of returns)
Here:
$10,075
State:
$3,923
Here:
3.9% of AGI
State:
3.3% of AGI
(% of AGI for various income ranges: 2.1% for AGIs $10k-25k, 1.8% for AGIs $25k-50k, 2.2% for AGIs $50k-75k, 2.4% for AGIs $75k-100k, 3.7% for AGIs over 100k)
Total tax: $34,826 (reported on 85.2% of returns)
94941:
$34,826
State:
$10,761
(% of AGI for various income ranges: 7.3% for AGIs $10k-25k, 9.8% for AGIs $25k-50k, 11.8% for AGIs $50k-75k, 12.2% for AGIs $75k-100k, 20.9% for AGIs over 100k)
Earned income credit: $968 (reported on 4.0% of returns)
Here:
$968
State:
$1,763
Percentage of individuals using paid preparers for their 2004 taxes: 67.3%
Here:
67%
State:
66%
(% for various income ranges: 61.1% for AGIs below $10k, 60.7% for AGIs $10k-25k, 59.1% for AGIs $25k-50k, 63.8% for AGIs $50k-75k, 69.1% for AGIs $75k-100k, 77.9% for AGIs over 100k)
Likely homosexual households (counted as self-reported same-sex unmarried-partner households)
Lesbian couples: 0.2% of all households
Gay men: 0.1% of all households
Household received Food Stamps/SNAP in the past 12 months: 278 Household did not receive Food Stamps/SNAP in the past 12 months: 12,045
Women who had a birth in the past 12 months: 237 (186 now married, 51 unmarried) Women who did not have a birth in the past 12 months: 6,677 (3,104 now married, 3,553 unmarried)
Housing units in zip code 94941 with a mortgage: 6,263 (1,179 second mortgage, 23 home equity loan, 1,086 both second mortgage and home equity loan) Houses without a mortgage: 74
Median monthly owner costs for units with a mortgage: $3,876 Median monthly owner costs for units without a mortgage: $1,556
Residents with income below the poverty level in 2022:
This zip code:
5.5%
Whole state:
12.2%
Residents with income below 50% of the poverty level in 2022:
This zip code:
2.7%
Whole state:
6.2%
Median number of rooms in houses and condos:
Here:
6.5
State:
6.0
Median number of rooms in apartments:
Here:
4.0
State:
3.9
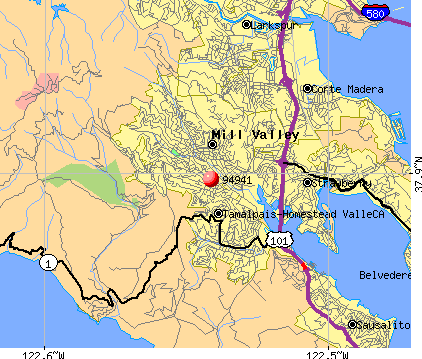
Notable locations in this zip code not listed on our city pages
Notable locations in zip code 94941: Camp Eastwood (A), Van Wyck Camp (B), Pan Toll Ranger Station (C), Mountain Theater (D), North Knee (E), Lee Shansky Camp (F), Four Corners (G), Scott Valley Swim and Tennis Club (H), Mill Valley Golf Course (I), Harbor Point Racquet and Beach Club (J), Bootjack Camp (K), Mill Valley Public Library (L), Mill Valley Youth Center (M), Mill Valley City Hall (N), Muir Beach Volunteer Fire Department (O), Mill Valley Fire Department Station 6 (P), Mill Valley Fire Department Station 7 Headquarters (Q), Southern Marin Fire Protection District Station 4 Tamalpais Valley (R), Southern Marin Fire Protection District Station 9 Headquarters (S), Marin County Fire Department Throckmorton Ridge (T). Display/hide their locations on the map
Shopping Centers: Tamalpais Junction Shopping Center (1), Strawberry Village Shopping Center (2), Mill Valley Shopping Center (3). Display/hide their locations on the map
Churches in zip code 94941 include: Church of Our Lady of Mount Carmel (A), Church of Our Savior (B), Federated Community Church of Mill Valley (C), First Church of Christ Scientist (D). Display/hide their locations on the map
Streams, rivers, and creeks: Bootjack Creek (A), Cascade Creek (B), Coyote Creek (C), Fern Creek (D), Laguna Creek (E), Spike Buck Creek (F), Galena Creek (G), Kent Creek (H), Arroyo Corte Madera Del Presidio (I). Display/hide their locations on the map
Parks in zip code 94941 include: Mount Tamalpais State Park (1), Muir Woods National Monument (2), Alto Bowl Preserve (3), Bayfront Park (4), Blithdale Park (5), Bothin Marsh Preserve (6), Brickyard Park (7), Camino Alto Preserve (8), Cascade Park (9). Display/hide their locations on the map
6,007 married couples with children.
1,049 single-parent households (322 men, 727 women).
86.2% of residents of 94941 zip code speak English at home.
3.7% of residents speak Spanish at home (86% very well, 11% well, 3% not well).
7.4% of residents speak other Indo-European language at home (86% very well, 11% well, 4% not well).
2.4% of residents speak Asian or Pacific Island language at home (46% very well, 47% well, 7% not well).
0.2% of residents speak other language at home (64% very well, 36% well).
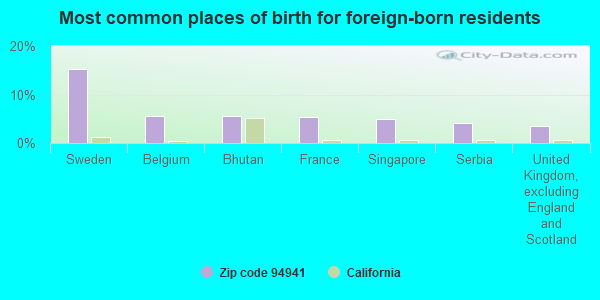
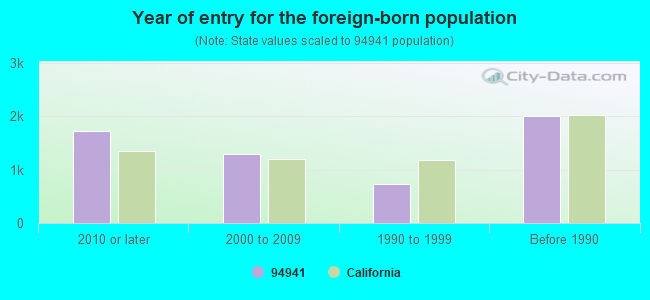
Foreign born population: 4,850 (15.2%) (67.5% of them are naturalized citizens)
This zip code:
15.2%
Whole state:
26.7%
15%Sweden
6%Belgium
5%Bhutan
5%France
5%Singapore
4%Serbia
4%United Kingdom, excluding England and Scotland
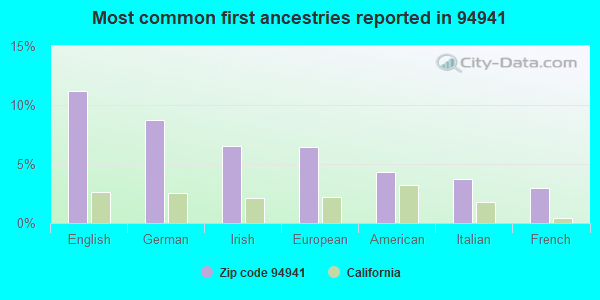
11%English
9%German
6%Irish
6%European
4%American
4%Italian
3%French
Year of entry for the foreign-born population
1,7212010 or later
1,2912000 to 2009
7231990 to 1999
2,015Before 1990
Major facilities with environmental interests located in this zip code:
EQUILON ENTERPRISES (798 REDWOOD HWY in MILL VALLEY, CA) . Federal Facility
STATE MASTER (California - Hazardous Waste Tracking) - HAZARDOU WASTE PROGRAM HAZARDOUS WASTE BIENNIAL REPORTER (Resource Conservation and Recovery Act (tracking hazardous waste)) Small Quantity Generators, between 100 kg and 1000 kg of hazardous waste/month (Resource Conservation and Recovery Act (tracking hazardous waste)) - notification Organizations: EQUILON ENTERPRISES L L C (CONTACT/OWNER)
Alternative names: SHELL OIL CO
EUROPEAN TAILORING & CLEANERS (237 SHORELINE HIGHWAY in MILL VALLEY, CA)
STATE MASTER (California - Hazardous Waste Tracking) - HAZARDOU WASTE PROGRAM CRITERIA AND HAZARDOUS AIR POLLUTANT INVENTORY (Inventory of air pollution sources) Small Quantity Generators, between 100 kg and 1000 kg of hazardous waste/month (Resource Conservation and Recovery Act (tracking hazardous waste)) - notification Business SIC classification: DRYCLEANING PLANTS, EXCEPT RUG CLEANING Organizations: MOHAMMAD KESMATYAR (CONTACT/OWNER)
Alternative names: EUROPEAN CLEANERS
CHEVRON STATION NO 90024 (204 FLAMINGO RD in MILL VALLEY, CA)
STATE MASTER (California - Hazardous Waste Tracking) - HAZARDOU WASTE PROGRAM Small Quantity Generators, between 100 kg and 1000 kg of hazardous waste/month (Resource Conservation and Recovery Act (tracking hazardous waste)) - notification Organizations: CHEVRON PRODUCTS CO (CONTACT/OWNER)
CHEVRON STATION NO 94390 (105 TIBURON BLVD in MILL VALLEY, CA)
STATE MASTER (California - Hazardous Waste Tracking) - HAZARDOU WASTE PROGRAM Small Quantity Generators, between 100 kg and 1000 kg of hazardous waste/month (Resource Conservation and Recovery Act (tracking hazardous waste)) - notification Organizations: CHEVRON PRODUCTS CO (CONTACT/OWNER)
MAGUIRE (EDNA) ELEMENTARY (80 LOMITA DR. in MILL VALLEY, CA)
(National Center for Education Statistics) - STATE ID-6024418 Organizations: MILL VALLEY ELEMENTARY (SCHOOL DISTRICT)
MILL VALLEY MIDDLE (425 SYCAMORE in MILL VALLEY, CA)
(National Center for Education Statistics) - STATE ID-6085187 Organizations: MILL VALLEY ELEMENTARY (SCHOOL DISTRICT)
EXXON CO. USA #77132 (595 REDWOOD HIGHWAY in MILL VALLEY, CA)
(Resource Conservation and Recovery Act (tracking hazardous waste))
MARIN AUTO BODY (489 MILLER AVE in MILL VALLEY, CA)
Small Quantity Generators, between 100 kg and 1000 kg of hazardous waste/month (Resource Conservation and Recovery Act (tracking hazardous waste)) - notification Organizations: MARIN AUTO CRAFTS INC (CONTACT/OWNER)
MILL VALLEY MOTORS (433 MILLER AVE in MILL VALLEY, CA)
Small Quantity Generators, between 100 kg and 1000 kg of hazardous waste/month (Resource Conservation and Recovery Act (tracking hazardous waste)) - notification Organizations: SHENSON LOCKSHEN (CONTACT/OWNER)
CALTRANS DISTRICT 4 (40 SHORELINE HWY in MILL VALLEY, CA)
Small Quantity Generators, between 100 kg and 1000 kg of hazardous waste/month (Resource Conservation and Recovery Act (tracking hazardous waste)) Organizations: CALIFORNIA DEPT OF TRANSPORTATION (CONTACT/OWNER)
EXPRESS 1 HOUR PHOTO (769 E BLITHEDALE AVE in MILL VALLEY, CA)
Small Quantity Generators, between 100 kg and 1000 kg of hazardous waste/month (Resource Conservation and Recovery Act (tracking hazardous waste)) - notification
FERRARI OF SAN FRANCISCO (595 REDWOOD HWY in MILL VALLEY, CA)
Small Quantity Generators, between 100 kg and 1000 kg of hazardous waste/month (Resource Conservation and Recovery Act (tracking hazardous waste)) - notification Organizations: FERRARI OF N AMERICA (CONTACT/OWNER)
FOTOMAT CORP EB804 (161 LOMITA DR in MILL VALLEY, CA)
Small Quantity Generators, between 100 kg and 1000 kg of hazardous waste/month (Resource Conservation and Recovery Act (tracking hazardous waste)) - notification Organizations: FOTOMAT CORPORATION (CONTACT/OWNER)
Housing units lacking complete plumbing facilities: 0.5% Housing units lacking complete kitchen facilities: 2.1%
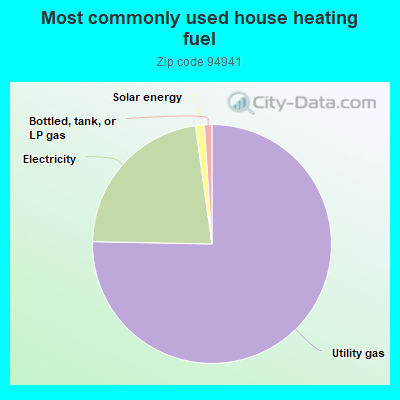
75.1%Utility gas
22.4%Electricity
1.2%Solar energy
1.0%Bottled, tank, or LP gas
Population in 1990: 27,746. Population change in the 1990s: +972 (+3.5%).
Place of birth for U.S.-born residents:
This state: 14,748
Northeast: 5,135
Midwest: 3,074
South: 1,848
West: 1,238
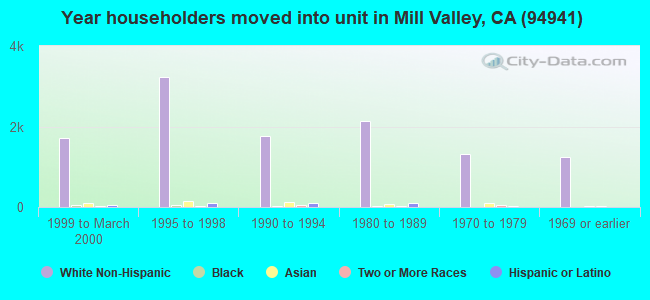
60% of the 94941 zip code residents lived in the same house 5 years ago. Out of people who lived in different houses, 42% lived in this county. Out of people who lived in different counties, 50% lived in California.
88% of the 94941 zip code residents lived in the same house 1 year ago. Out of people who lived in different houses, 33% moved from this county. Out of people who lived in different houses, 47% moved from different county within same state. Out of people who lived in different houses, 17% moved from different state. Out of people who lived in different houses, 5% moved from abroad.
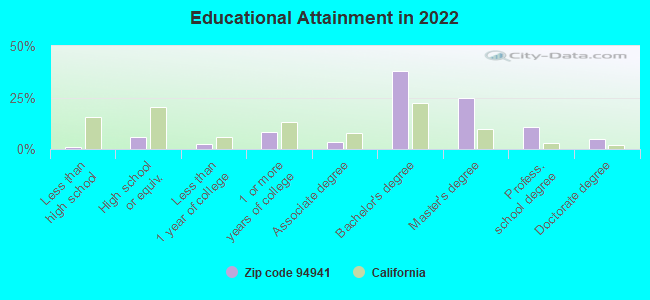
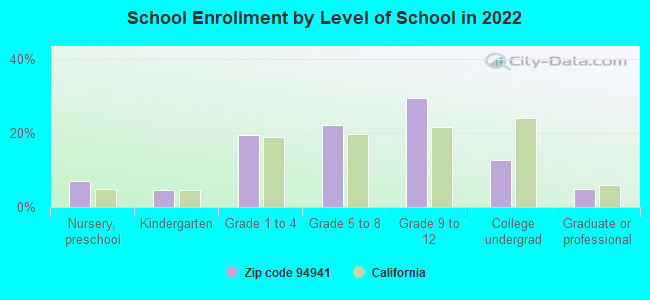
Private vs. public school enrollment:
Students in private schools in grades 1 to 8 (elementary and middle school): 835
Here:
24.9%
California:
10.5%
Students in private schools in grades 9 to 12 (high school): 691
Here:
29.3%
California:
8.5%
Students in private undergraduate colleges: 293
Here:
28.8%
California:
15.9%
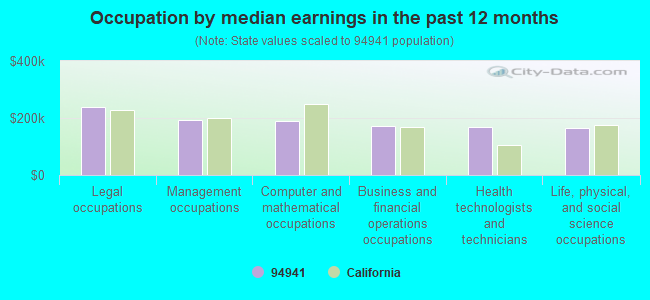
Occupation by median earnings in the past 12 months ($)
237,352Legal occupations
193,150Management occupations
190,946Computer and mathematical occupations
171,378Business and financial operations occupations
167,697Health technologists and technicians
165,100Life, physical, and social science occupations
Companies with federal contracts located in this zip code (MILL VALLEY, CA):
FESCO AGENCIES N A INC (655 REDWOOD HWY STE 332)
$16,666,667 with Army for Other Cargo and Freight Services. Taking place in VA. Signed on 2000-06-01. Completion date: 2001-02-28.
AMERICAN CONSTRUCTION AND SUPP (1038 REDWOOD HIGHWAY, SUIT; small business) : $3,802,315 in 31 contractsfrom 2000 to 2004
Contracts for Construction of Structures and Facilities -- Miscellaneous Buildings, Maintenance, Repair or Alteration of Real Property -- Other Non-Building Facilities, Construction of Structures and Facilities -- Fuel Storage Buildings by Navy Signed by year:2000: $1,673,939; 2001: $1,397,485; 2002: $390,384; 2003: $191,454; 2004: $149,053; 2005: $0; 2006: $0.
Biggest contracts:
$974,443 with Navy for Construction of Structures and Facilities -- Miscellaneous Buildings. Signed on 2000-08-21. Completion date: 2001-12-14.
$682,370, same as above.Signed on 2001-06-28. Completion date: 2001-06-30.
$388,578 with Navy for Construction of Structures and Facilities -- Miscellaneous Buildings. Taking place in ID. Signed on 2000-01-10. Completion date: 2000-07-23.
$315,757 with Navy for Construction of Structures and Facilities -- Miscellaneous Buildings. Signed on 2001-06-28. Completion date: 2001-09-30.
SCHUERHOFF, CHARLES (102 E BLITHEDALE AVE; small business)
$37,260 with Department of Defense for Miscellaneous Items. Taking place in MA. Signed on 2000-01-24. Completion date: 2000-02-15.
STALKER SOFTWARE INC (655 REDWOOD HWY STE 275; small business) : $6,070 in 2 contractsfrom 2004 to 2005
$4,000 with Navy for Other Defense -- Applied Research and Exploratory Development (R&D). Taking place in DC. Signed on 2004-12-27. Completion date: 2005-12-31.
$2,070 with Department of Defense for ADP Data Entry Services. Taking place in AL. Signed on 2005-04-04. Completion date: 2006-08-08.
MARKETTOOLS INC (1 BELVEDERE PLACE) : $4,599 in 2 contractsfrom 2005 to 2006
$4,000 with Army for ADP Software. Taking place in VA. Signed on 2006-03-16. Completion date: 2007-02-28.
$599 with Small Business Administration for Other Management Support Services. Taking place in DC. Signed on 2005-10-21. Completion date: 2005-11-21.
Top industries in this zip code by the number of employees in 2005:
2002 - 2018 National Fire Incident Reporting System (NFIRS) incidents
Based on the data from the years 2002 - 2018 the average number of fires per year is 68. The highest number of fires - 126 took place in 2008, and the least - 0 in 2003. The data has a growing trend.
When looking into fire subcategories, the most reports belonged to: Structure Fires (52.7%), and Outside Fires (26.4%).
Fire incident types reported to NFIRS in Zip Code 94941


 Nearest zip codes: 94965, 94904, 94939, 94925, 94957, 94930.


 . Federal Facility
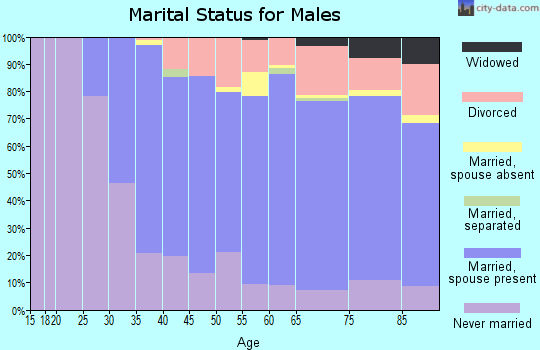

 Based on the data from the years 2002 - 2018 the average number of fires per year is 68. The highest number of fires - 126 took place in 2008, and the least - 0 in 2003. The data has a growing trend.
 When looking into fire subcategories, the most reports belonged to: Structure Fires (52.7%), and Outside Fires (26.4%).