Estimated zip code population in 2022: 13,022 Zip code population in 2010: 11,995 Zip code population in 2000: 11,999
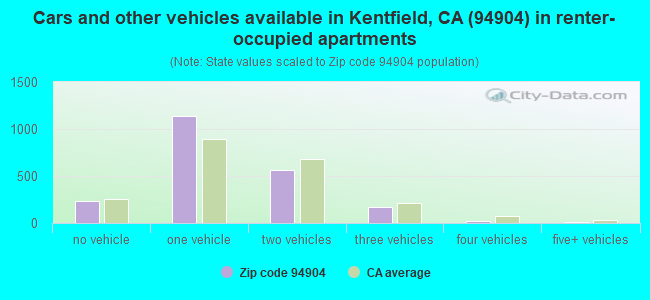
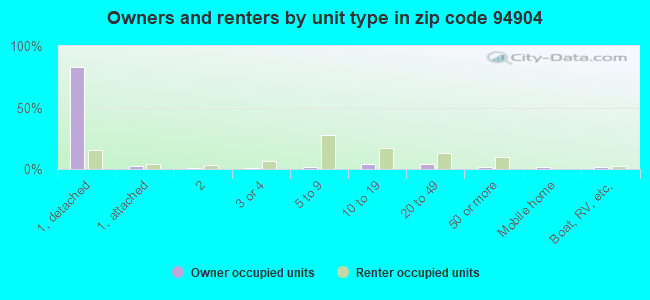
Houses and condos: 5,993 Renter-occupied apartments: 2,135
% of renters here:
37%
State:
44%
March 2022 cost of living index in zip code 94904: 135.4 (high, U.S. average is 100)
Land area: 7.2 sq. mi. Water area: 0.2 sq. mi.
Population density: 1,797 people per square mile
(low).
OSM Map
General Map
Google Map
MSN Map
OSM Map
General Map
Google Map
MSN Map
OSM Map
General Map
Google Map
MSN Map
OSM Map
General Map
Google Map
MSN Map
Please wait while loading the map...
Real estate property taxes paid for housing units in 2022:
This zip code:
0.5% ($10,292)
California:
0.7% ($4,831)
Median real estate property taxes paid for housing units with mortgages in 2022: $10,330 (0.5%) Median real estate property taxes paid for housing units with no mortgage in 2022: $7,067 (0.5%)
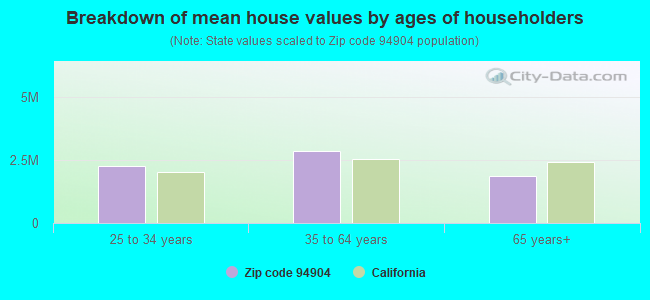
Estimated median house/condo value in 2022: $2,106,438
94904:
$2,106,438
California:
$715,900
According to our research of California and other state lists, there was 1 registered sex offender living in 94904 zip code as of April 27, 2024. The ratio of all residents to sex offenders in zip code 94904 is 12,637 to 1. The ratio of registered sex offenders to all residents in this zip code is much lower than the state average.
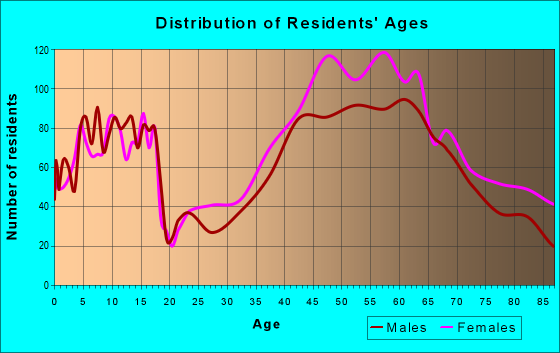
Median resident age:
This zip code:
51.3 years
California median age:
37.9 years
Average household size:
This zip code:
2.2 people
California:
2.8 people
Averages for the 2020 tax year for zip code 94904, filed in 2021:
Average Adjusted Gross Income (AGI) in 2020: $438,582 (Individual Income Tax Returns)
Here:
$438,582
State:
$95,910
Salary/wage: $266,035 (reported on 66.3% of returns)
Here:
$266,035
State:
$77,331
(% of AGI for various income ranges: 1262.2% for AGIs below $25k, 3998.9% for AGIs $25k-50k, 7056.8% for AGIs $50k-75k, 10455.9% for AGIs $75k-100k, 19862.8% for AGIs $100k-200k, 246731.1% for AGIs over 200k)
Taxable interest for individuals: $9,122 (reported on 60.9% of returns)
This zip code:
$9,122
California:
$2,294
(% of AGI for various income ranges: 74.7% for AGIs below $25k, 130.6% for AGIs $25k-50k, 191.9% for AGIs $50k-75k, 239.1% for AGIs $75k-100k, 715.6% for AGIs $100k-200k, 7708.2% for AGIs over 200k)
Ordinary dividends: $37,807 (reported on 57.5% of returns)
Here:
$37,807
State:
$10,949
(% of AGI for various income ranges: 249.4% for AGIs below $25k, 507.7% for AGIs $25k-50k, 743.9% for AGIs $50k-75k, 1073.2% for AGIs $75k-100k, 3063.1% for AGIs $100k-200k, 29860.5% for AGIs over 200k)
Net capital gain/loss in AGI: +$167,623 (reported on 55.9% of returns)
Here:
+$167,623
State:
+$49,306
(% of AGI for various income ranges: 182.4% for AGIs below $25k, 386.6% for AGIs $25k-50k, 562.9% for AGIs $50k-75k, 674.1% for AGIs $75k-100k, 2879.2% for AGIs $100k-200k, 146464.5% for AGIs over 200k)
Profit/loss from business: +$68,366 (reported on 26.6% of returns)
Here:
+$68,366
State:
+$15,671
(% of AGI for various income ranges: 395.9% for AGIs below $25k, 976.6% for AGIs $25k-50k, 839.0% for AGIs $50k-75k, 1688.2% for AGIs $75k-100k, 2744.6% for AGIs $100k-200k, 23436.8% for AGIs over 200k)
Taxable individual retirement arrangement distribution: $43,305 (reported on 15.0% of returns)
94904:
$43,305
California:
$23,505
(% of AGI for various income ranges: 112.0% for AGIs below $25k, 240.0% for AGIs $25k-50k, 642.6% for AGIs $50k-75k, 1048.2% for AGIs $75k-100k, 2505.9% for AGIs $100k-200k, 6416.1% for AGIs over 200k)
Self-employed (Keogh) retirement plans: $43,707 (reported on 7.4% of returns)
94904:
$43,707
California:
$30,163
(% of AGI for various income ranges: 131.4% for AGIs $25k-50k, 172.7% for AGIs $75k-100k, 412.1% for AGIs $100k-200k, 4531.8% for AGIs over 200k)
Total itemized deductions: $68,104 (reported on 38.1% of returns)
Here:
$68,104
State:
$39,517
(% of AGI for various income ranges: 574.5% for AGIs below $25k, 903.1% for AGIs $25k-50k, 1457.7% for AGIs $50k-75k, 1897.7% for AGIs $75k-100k, 4629.7% for AGIs $100k-200k, 33146.6% for AGIs over 200k)
Charity contributions: $36,452 (reported on 33.0% of returns)
Here:
$36,452
State:
$12,598
(% of AGI for various income ranges: 19.6% for AGIs below $25k, 43.1% for AGIs $25k-50k, 125.8% for AGIs $50k-75k, 264.5% for AGIs $75k-100k, 609.7% for AGIs $100k-200k, 18430.8% for AGIs over 200k)
Taxes paid: $9,031 (reported on 37.7% of returns)
94904:
$9,031
State:
$8,807
(% of AGI for various income ranges: 101.2% for AGIs below $25k, 172.6% for AGIs $25k-50k, 246.5% for AGIs $50k-75k, 425.5% for AGIs $75k-100k, 1039.0% for AGIs $100k-200k, 3686.6% for AGIs over 200k)
Earned income credit: $1,455 (reported on 3.6% of returns)
Here:
$1,455
State:
$2,074
(% of AGI for various income ranges: 41.8% for AGIs below $25k, 32.9% for AGIs $25k-50k)
Percentage of individuals using paid preparers for their 2020 taxes: 92.8%
Here:
93%
State:
92%
(% for various income ranges: 89.0% for AGIs below $25k, 90.3% for AGIs $25k-50k, 90.5% for AGIs $50k-75k, 95.8% for AGIs $75k-100k, 93.6% for AGIs $100k-200k, 95.5% for AGIs over 200k)
Averages for the 2012 tax year for zip code 94904, filed in 2013:
Average Adjusted Gross Income (AGI) in 2012: $257,388 (Individual Income Tax Returns)
Here:
$257,388
State:
$72,726
Salary/wage: $165,856 (reported on 65.7% of returns)
Here:
$165,856
State:
$59,079
(% of AGI for various income ranges: 54.3% for AGIs below $25k, 59.4% for AGIs $25k-50k, 54.4% for AGIs $50k-75k, 52.5% for AGIs $75k-100k, 51.1% for AGIs $100k-200k, 40.0% for AGIs over 200k)
Taxable interest for individuals: $9,666 (reported on 61.7% of returns)
This zip code:
$9,666
California:
$2,146
(% of AGI for various income ranges: 4.4% for AGIs below $25k, 1.9% for AGIs $25k-50k, 2.1% for AGIs $50k-75k, 3.0% for AGIs $75k-100k, 2.0% for AGIs $100k-200k, 2.3% for AGIs over 200k)
Ordinary dividends: $31,573 (reported on 55.0% of returns)
Here:
$31,573
State:
$9,308
(% of AGI for various income ranges: 11.3% for AGIs below $25k, 7.7% for AGIs $25k-50k, 6.9% for AGIs $50k-75k, 7.0% for AGIs $75k-100k, 7.3% for AGIs $100k-200k, 6.6% for AGIs over 200k)
Net capital gain/loss in AGI: +$94,620 (reported on 52.5% of returns)
Here:
+$94,620
State:
+$30,460
(% of AGI for various income ranges: 0.7% for AGIs $25k-50k, 1.5% for AGIs $50k-75k, 2.9% for AGIs $75k-100k, 3.7% for AGIs $100k-200k, 23.0% for AGIs over 200k)
Profit/loss from business: +$51,532 (reported on 26.3% of returns)
Here:
+$51,532
State:
+$17,064
(% of AGI for various income ranges: 19.5% for AGIs below $25k, 13.1% for AGIs $25k-50k, 9.4% for AGIs $50k-75k, 7.7% for AGIs $75k-100k, 9.3% for AGIs $100k-200k, 4.2% for AGIs over 200k)
Taxable individual retirement arrangement distribution: $38,042 (reported on 20.7% of returns)
94904:
$38,042
California:
$19,557
(% of AGI for various income ranges: 8.0% for AGIs below $25k, 5.4% for AGIs $25k-50k, 5.4% for AGIs $50k-75k, 7.2% for AGIs $75k-100k, 7.7% for AGIs $100k-200k, 2.2% for AGIs over 200k)
Self-employment retirement plans: $30,573 (reported on 6.9% of returns)
94904:
$30,573
California:
$24,530
(% of AGI for various income ranges: 1.4% for AGIs below $25k, 1.3% for AGIs $50k-75k, 1.1% for AGIs $100k-200k, 0.8% for AGIs over 200k)
Total itemized deductions: $79,911 (20% of AGI, reported on 60.5% of returns)
Here:
$79,911
State:
$34,004
Here:
19.9% of AGI
State:
22.7% of AGI
(% of AGI for various income ranges: 35.0% for AGIs below $25k, 20.7% for AGIs $25k-50k, 19.2% for AGIs $50k-75k, 23.5% for AGIs $75k-100k, 23.4% for AGIs $100k-200k, 17.8% for AGIs over 200k)
Charity contributions: $15,850 (reported on 53.7% of returns)
Here:
$15,850
State:
$4,659
(% of AGI for various income ranges: 1.8% for AGIs below $25k, 1.3% for AGIs $25k-50k, 1.4% for AGIs $50k-75k, 1.9% for AGIs $75k-100k, 2.1% for AGIs $100k-200k, 3.6% for AGIs over 200k)
Taxes paid: $42,209 (reported on 60.2% of returns)
94904:
$42,209
State:
$14,448
(% of AGI for various income ranges: 7.6% for AGIs below $25k, 4.8% for AGIs $25k-50k, 5.1% for AGIs $50k-75k, 7.5% for AGIs $75k-100k, 9.4% for AGIs $100k-200k, 10.3% for AGIs over 200k)
Earned income credit: $1,230 (reported on 5.0% of returns)
Here:
$1,230
State:
$2,286
(% of AGI for various income ranges: 2.1% for AGIs below $25k, 0.2% for AGIs $25k-50k)
Percentage of individuals using paid preparers for their 2012 taxes: 68.9%
Here:
69%
State:
64%
(% for various income ranges: 59.4% for AGIs below $25k, 60.0% for AGIs $25k-50k, 64.2% for AGIs $50k-75k, 65.4% for AGIs $75k-100k, 73.1% for AGIs $100k-200k, 82.9% for AGIs over 200k)
Averages for the 2004 tax year for zip code 94904, filed in 2005:
Average Adjusted Gross Income (AGI) in 2004: $176,023 (Individual Income Tax Returns)
Here:
$176,023
State:
$58,600
Salary/wage: $123,039 (reported on 61.8% of returns)
Here:
$123,039
State:
$49,455
(% of AGI for various income ranges: 47.9% for AGIs $10k-25k, 57.3% for AGIs $25k-50k, 56.4% for AGIs $50k-75k, 52.4% for AGIs $75k-100k, 40.7% for AGIs over 100k)
Taxable interest for individuals: $8,384 (reported on 70.7% of returns)
This zip code:
$8,384
California:
$2,365
(% of AGI for various income ranges: 8.4% for AGIs $10k-25k, 5.2% for AGIs $25k-50k, 3.8% for AGIs $50k-75k, 4.1% for AGIs $75k-100k, 3.0% for AGIs over 100k)
Taxable dividends: $14,578 (reported on 62.4% of returns)
Here:
$14,578
State:
$4,746
(% of AGI for various income ranges: 10.5% for AGIs $10k-25k, 6.2% for AGIs $25k-50k, 5.8% for AGIs $50k-75k, 6.7% for AGIs $75k-100k, 4.8% for AGIs over 100k)
Net capital gain/loss: +$65,762 (reported on 57.1% of returns)
Here:
+$65,762
State:
+$23,418
(% of AGI for various income ranges: 2.9% for AGIs $10k-25k, 1.9% for AGIs $25k-50k, 2.4% for AGIs $50k-75k, 2.5% for AGIs $75k-100k, 23.9% for AGIs over 100k)
Profit/loss from business: +$41,887 (reported on 25.4% of returns)
Here:
+$41,887
State:
+$16,826
(% of AGI for various income ranges: 16.9% for AGIs $10k-25k, 10.2% for AGIs $25k-50k, 7.3% for AGIs $50k-75k, 9.7% for AGIs $75k-100k, 5.5% for AGIs over 100k)
IRA payment deduction: $3,562 (reported on 3.9% of returns)
94904:
$3,562
California:
$3,192
(% of AGI for various income ranges: 0.6% for AGIs $10k-25k, 0.4% for AGIs $25k-50k, 0.2% for AGIs $50k-75k, 0.3% for AGIs $75k-100k, 0.0% for AGIs over 100k)
Self-employed pension: $25,094 (reported on 7.4% of returns)
Here:
$25,094
California:
$17,688
(% of AGI for various income ranges: 0.9% for AGIs $25k-50k, 0.6% for AGIs $50k-75k, 0.8% for AGIs $75k-100k, 1.1% for AGIs over 100k)
Total itemized deductions: $57,108 (20% of AGI, reported on 57.6% of returns)
Here:
$57,108
State:
$28,113
Here:
19.8% of AGI
State:
25.3% of AGI
(% of AGI for various income ranges: 35.2% for AGIs $10k-25k, 21.8% for AGIs $25k-50k, 22.1% for AGIs $50k-75k, 24.9% for AGIs $75k-100k, 17.5% for AGIs over 100k)
Charity contributions deductions: $8,168 (3% of AGI, reported on 53.2% of returns)
Here:
$8,168
State:
$3,923
Here:
2.7% of AGI
State:
3.3% of AGI
(% of AGI for various income ranges: 1.8% for AGIs $10k-25k, 1.9% for AGIs $25k-50k, 2.5% for AGIs $50k-75k, 2.4% for AGIs $75k-100k, 2.5% for AGIs over 100k)
Total tax: $43,032 (reported on 84.5% of returns)
94904:
$43,032
State:
$10,761
(% of AGI for various income ranges: 6.6% for AGIs $10k-25k, 9.4% for AGIs $25k-50k, 11.5% for AGIs $50k-75k, 12.5% for AGIs $75k-100k, 21.8% for AGIs over 100k)
Earned income credit: $949 (reported on 3.6% of returns)
Here:
$949
State:
$1,763
Percentage of individuals using paid preparers for their 2004 taxes: 71.6%
Here:
72%
State:
66%
(% for various income ranges: 66.9% for AGIs below $10k, 67.0% for AGIs $10k-25k, 63.8% for AGIs $25k-50k, 69.4% for AGIs $50k-75k, 69.7% for AGIs $75k-100k, 80.7% for AGIs over 100k)
Likely homosexual households (counted as self-reported same-sex unmarried-partner households)
Lesbian couples: 0.0% of all households
Gay men: 0.1% of all households
Household received Food Stamps/SNAP in the past 12 months: 179 Household did not receive Food Stamps/SNAP in the past 12 months: 5,476
Women who had a birth in the past 12 months: 97 (82 now married, 15 unmarried) Women who did not have a birth in the past 12 months: 2,212 (1,019 now married, 1,187 unmarried)
Housing units in zip code 94904 with a mortgage: 2,426 (353 second mortgage, 341 both second mortgage and home equity loan) Houses without a mortgage: 24
Median monthly owner costs for units with a mortgage: $3,876 Median monthly owner costs for units without a mortgage: $1,148
Residents with income below the poverty level in 2022:
This zip code:
5.4%
Whole state:
12.2%
Residents with income below 50% of the poverty level in 2022:
This zip code:
2.8%
Whole state:
6.2%
Median number of rooms in houses and condos:
Here:
7.0
State:
6.0
Median number of rooms in apartments:
Here:
3.5
State:
3.9
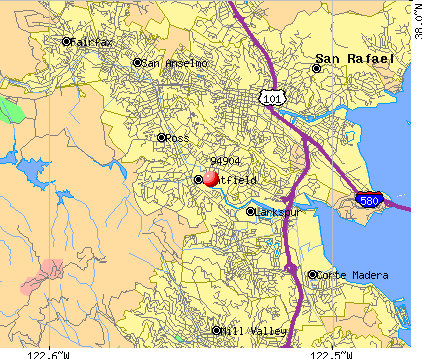
Notable locations in this zip code not listed on our city pages
Notable locations in zip code 94904: Tuckers Camp (A), Inspiration Point (B), Eckerts Camp (C), Bay Tree Junction (D), Marin Art and Garden Center (E), Harlan Hall (F), Kentfield Fire Protection District (G). Display/hide their locations on the map
Creeks: East Fork Lagunitas Creek (A), Middle Fork Lagunitas Creek (B), West Fork Lagunitas Creek (C), Phoenix Creek (D), Bill Williams Creek (E). Display/hide their locations on the map
Parks in zip code 94904 include: Mount Tamalpais Game Refuge (1), Baltimore Canyon Preserve (2), Bon Air Landing Park (3), Creekside Park (4), Hamilton Park (5), Niven Park (6). Display/hide their locations on the map
In group quarters: 152 (-1 institutionalized population)
Size of family households: 1,823 2-persons, 724 3-persons, 726 4-persons, 255 5-persons, 54 6-persons
Size of nonfamily households: 1,888 1-person, 324 2-persons
2,194 married couples with children.
414 single-parent households (126 men, 288 women).
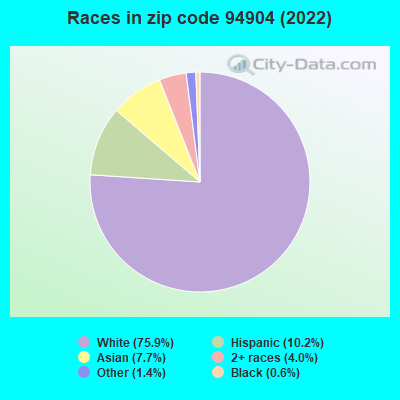
79.7% of residents of 94904 zip code speak English at home.
6.8% of residents speak Spanish at home (77% very well, 7% well, 11% not well, 6% not at all).
7.5% of residents speak other Indo-European language at home (72% very well, 25% well, 3% not well).
5.3% of residents speak Asian or Pacific Island language at home (59% very well, 31% well, 10% not well).
1.1% of residents speak other language at home (65% very well, 11% well, 23% not well).
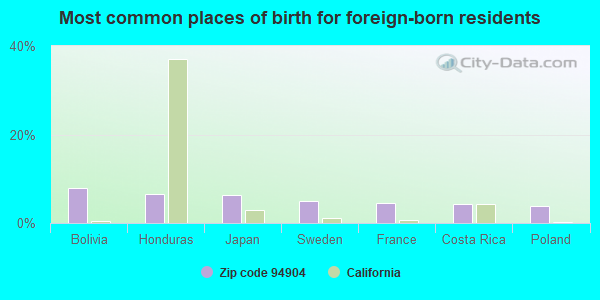
Foreign born population: 2,149 (16.5%) (57.0% of them are naturalized citizens)
This zip code:
16.5%
Whole state:
26.7%
8%Bolivia
7%Honduras
6%Japan
5%Sweden
4%France
4%Costa Rica
4%Poland
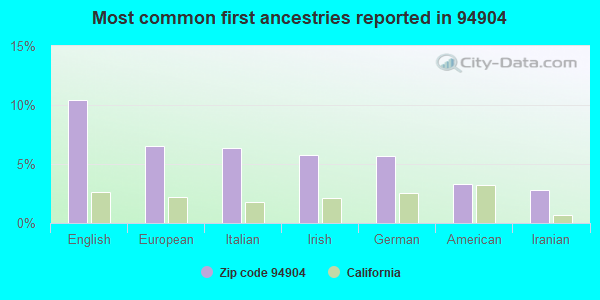
10%English
7%European
6%Italian
6%Irish
6%German
3%American
3%Iranian
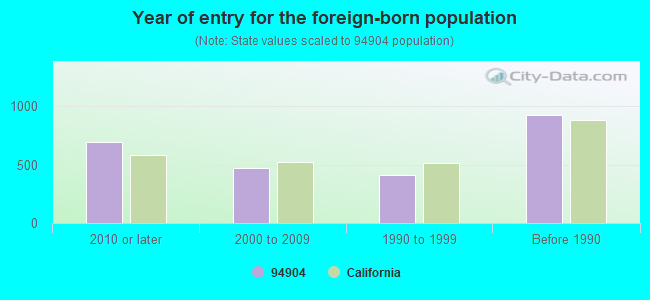
Year of entry for the foreign-born population
6892010 or later
4722000 to 2009
4121990 to 1999
924Before 1990
Facilities with environmental interests located in this zip code:
ADALINE E KENT MIDDLE SCHOOL (250 STADIUM WAY in KENTFIELD, CA)
(Geographic Names Information System) STATE MASTER (California - Hazardous Waste Tracking) - HAZARDOU WASTE PROGRAM (National Center for Education Statistics) - STATE ID-6068308 Small Quantity Generators, between 100 kg and 1000 kg of hazardous waste/month (Resource Conservation and Recovery Act (tracking hazardous waste)) Organizations: KENTFIELD ELEMENTARY (SCHOOL DISTRICT)
Alternative names: A E KENT MIDDLE SCHOOL, KENT (ADALINE E.) MIDDLE
CHEVRON STATION NO 98933 (301 SIR FRANCIS DRAKE BLVD in GREENBRAE, CA)
STATE MASTER (California - Hazardous Waste Tracking) - HAZARDOU WASTE PROGRAM Large Quantity Generators, more that 1000 kg of hazardous waste/month (Resource Conservation and Recovery Act (tracking hazardous waste)) Organizations: CHEVRON PRODUCTS CO. (CONTACT/OPERATOR)
ANTHONY G BACICH ELEMENTARY SCHOOL (25 MCALLISTER AVE. in KENTFIELD, CA)
(Geographic Names Information System) (National Center for Education Statistics) - STATE ID-6024319 Organizations: KENTFIELD ELEMENTARY (SCHOOL DISTRICT)
Alternative names: BACICH (ANTHONY G.) ELEMENTARY
GREENBRAE AUTOMOTIVE (27 INDUSTRIAL WY in GREENBRAE, CA)
STATE MASTER (California - Hazardous Waste Tracking) - HAZARDOU WASTE PROGRAM Small Quantity Generators, between 100 kg and 1000 kg of hazardous waste/month (Resource Conservation and Recovery Act (tracking hazardous waste)) - notification Business NAICS classification: GENERAL AUTOMOTIVE REPAIR.
KENTFIELD FIRE PROTECTION DIST (1004 SIR FRANCIS DRAKE BLVD in KENTFIELD, CA)
STATE MASTER (California - Hazardous Waste Tracking) - HAZARDOU WASTE PROGRAM Small Quantity Generators, between 100 kg and 1000 kg of hazardous waste/month (Resource Conservation and Recovery Act (tracking hazardous waste)) - notification Organizations: KENTFIELD FIRE PROTECTION DIST. (CONTACT/OWNER)
EXPRESS ONE HOUR PHOTO (290 BON AIR CTR in GREENBRAE, CA)
STATE MASTER (California - Hazardous Waste Tracking) - HAZARDOU WASTE PROGRAM Small Quantity Generators, between 100 kg and 1000 kg of hazardous waste/month (Resource Conservation and Recovery Act (tracking hazardous waste)) - notification Organizations: VICTOR YEE (CONTACT/OWNER)
MELLOW MOTOR INC (34 RICH ST in GREENBRAE, CA)
STATE MASTER (California - Hazardous Waste Tracking) - HAZARDOU WASTE PROGRAM Small Quantity Generators, between 100 kg and 1000 kg of hazardous waste/month (Resource Conservation and Recovery Act (tracking hazardous waste)) - notification Organizations: RIC KELLEN (CONTACT/OWNER)
GREENHOUSE AUTOMOTIVE (46 INDUSTRIAL WAY in GREENBRAE, CA)
(Resource Conservation and Recovery Act (tracking hazardous waste)) Organizations: TIM OCONNELL (CONTACT/OWNER)
HULTER TRUCKING (25 CORTE LODATO in GREENBRAE, CA)
KENTFIELD MEDICAL HOSPITAL (1125-B SIR FRANCIS DRAKE BLVD in KENTFIELD, CA)
Small Quantity Generators, between 100 kg and 1000 kg of hazardous waste/month (Resource Conservation and Recovery Act (tracking hazardous waste)) - notification Organizations: KENTFIELD HOSPITAL CORP (CONTACT/OWNER)
MEADERS CLEANERS (220 BON AIR SHOPPING CENTER in GREENBRAE, CA)
Small Quantity Generators, between 100 kg and 1000 kg of hazardous waste/month (Resource Conservation and Recovery Act (tracking hazardous waste)) Organizations: CASASSA ROBERT OWNER (CONTACT/OWNER)
MARIN GENERAL HOSPITAL (250 BONAIR ROAD in GREENBRAE, CA)
CRITERIA AND HAZARDOUS AIR POLLUTANT INVENTORY (Inventory of air pollution sources) Business SIC classification: GENERAL MEDICAL AND SURGICAL HOSPITALS
Housing units lacking complete plumbing facilities: 0.5% Housing units lacking complete kitchen facilities: 1.7%
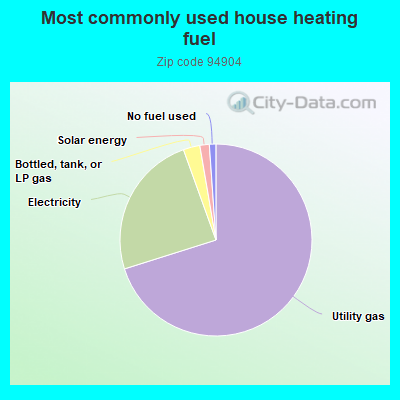
70.2%Utility gas
24.4%Electricity
2.8%Bottled, tank, or LP gas
1.6%Solar energy
1.1%No fuel used
Population in 1990: 11,820. Population change in the 1990s: +179 (+1.5%).
Place of birth for U.S.-born residents:
This state: 5,818
Northeast: 1,872
Midwest: 1,420
South: 761
West: 577
60% of the 94904 zip code residents lived in the same house 5 years ago. Out of people who lived in different houses, 54% lived in this county. Out of people who lived in different counties, 50% lived in California.
91% of the 94904 zip code residents lived in the same house 1 year ago. Out of people who lived in different houses, 45% moved from this county. Out of people who lived in different houses, 35% moved from different county within same state. Out of people who lived in different houses, 12% moved from different state. Out of people who lived in different houses, 9% moved from abroad.
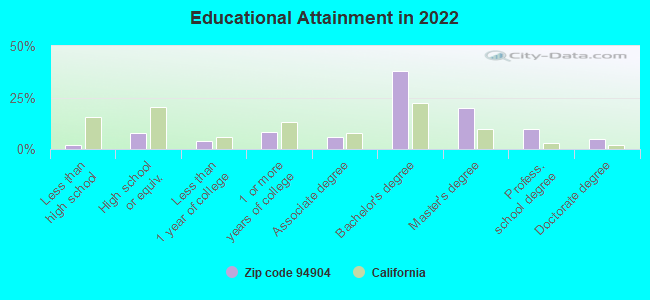
Private vs. public school enrollment:
Students in private schools in grades 1 to 8 (elementary and middle school): 219
Here:
17.8%
California:
10.5%
Students in private schools in grades 9 to 12 (high school): 160
Here:
21.9%
California:
8.5%
Students in private undergraduate colleges: 141
Here:
19.6%
California:
15.9%
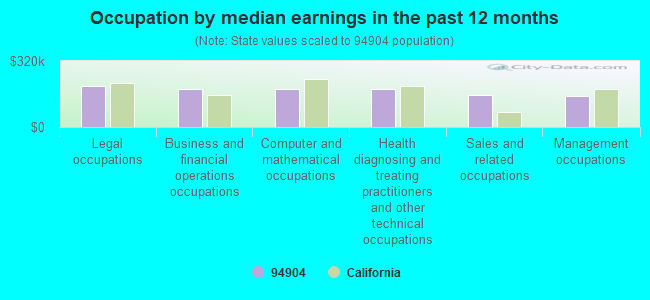
Occupation by median earnings in the past 12 months ($)
199,883Legal occupations
185,175Business and financial operations occupations
184,397Computer and mathematical occupations
183,352Health diagnosing and treating practitioners and other technical occupations
154,535Sales and related occupations
149,908Management occupations
Companies with federal contracts located in this zip code:
vincent e. obrien (Marin Economic Research Institute in Greenbrae, ca) : $252,870 in 3 contractsin 2003
$220,070 with Offices, Boards and Divisions (includes Attorney General, Deputy Attorney General, etc.) for Expert Witness. Taking place in DC. Signed on 2003-06-15. Completion date: 2003-06-15.
$32,800, same as above.Signed on 2003-12-08. Completion date: 2003-12-30.
$0, same as above.Signed on 2003-12-08. Completion date: 2003-12-30.
COLEMAN CONSULTING GROUP, INC (300 DRAKES LANDING ROAD, S in GREENBRAE, CA; small business)
$99,000 with U.S. Army Corps of Engineers - civil program financing only for Policy Review/Development Services. Taking place in MI. Signed on 2001-01-09. Completion date: 2002-01-09.
Top industries in this zip code by the number of employees in 2005:
Health Care and Social Assistance: General Medical and Surgical Hospitals (over 1000 employees: 1 establishment)
Health Care and Social Assistance: Offices of Physicians (except Mental Health Specialists) (20-49: 3, 10-19: 11, 5-9: 15, 1-4: 54)
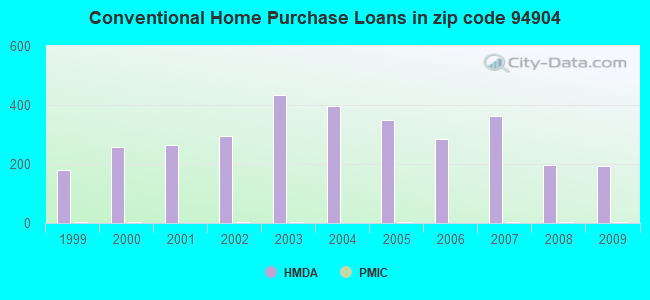
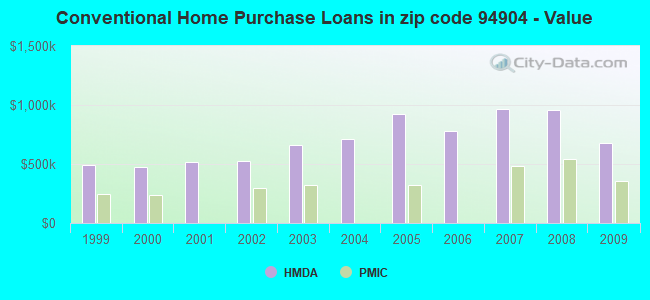
Detailed PMIC statistics for the following Tracts:1191.00
, 1192.00
2002 - 2018 National Fire Incident Reporting System (NFIRS) incidents
Based on the data from the years 2002 - 2018 the average number of fires per year is 20. The highest number of fires - 45 took place in 2017, and the least - 0 in 2004. The data has a growing trend.
When looking into fire subcategories, the most reports belonged to: Structure Fires (45.8%), and Outside Fires (33.6%).
Fire incident types reported to NFIRS in Zip Code 94904


 Nearest zip codes: 94957, 94939, 94941, 94960, 94925, 94930.


 Based on the data from the years 2002 - 2018 the average number of fires per year is 20. The highest number of fires - 45 took place in 2017, and the least - 0 in 2004. The data has a growing trend.
 When looking into fire subcategories, the most reports belonged to: Structure Fires (45.8%), and Outside Fires (33.6%).