Bostonia neighborhood in El Cajon, California (CA), 92021 detailed profile
Settings
X

Business Search - 14 Million verified businesses
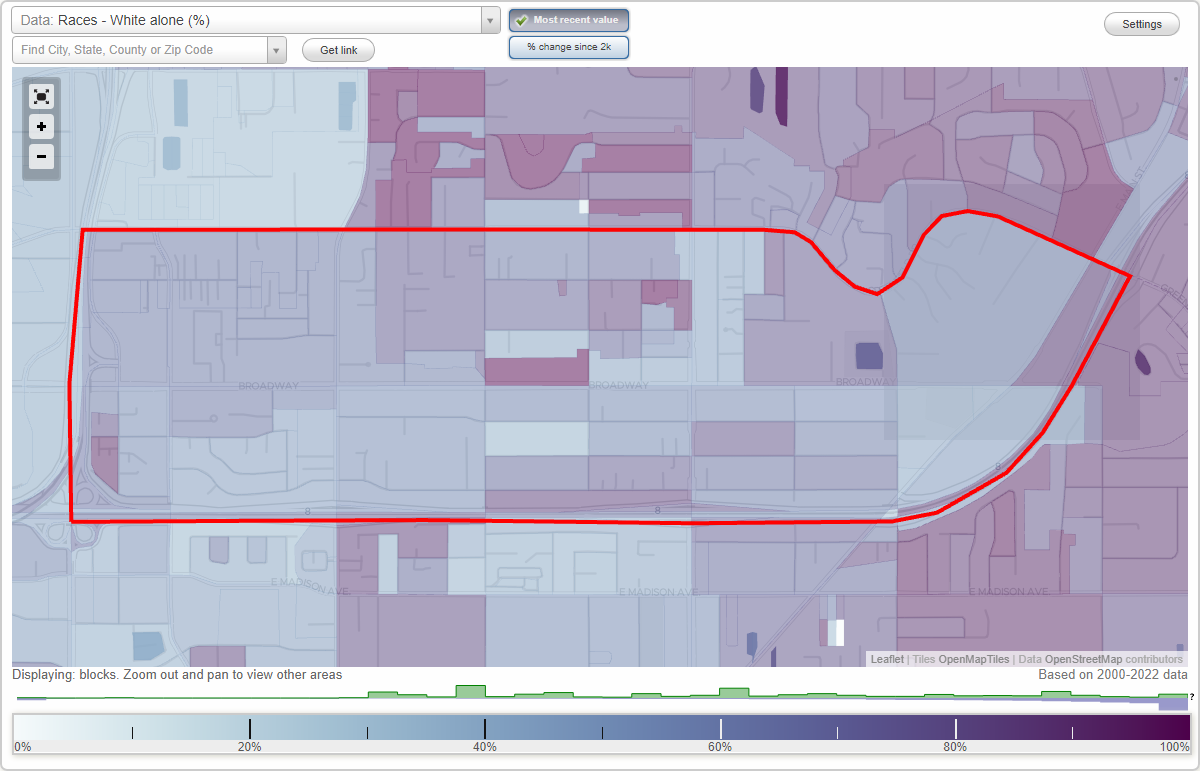
Area: 1.758 square miles
Population: 15,138
Population density:
| Bostonia: | 8,613 people per square mile |
| El Cajon: | 7,166 people per square mile |

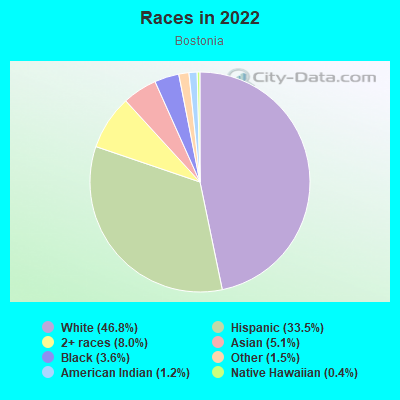
- 7,32846.8%White
- 5,25033.5%Hispanic or Latino
- 1,2518.0%Two or more races
- 7925.1%Asian
- 5703.6%Black
- 2351.5%Some other race
- 1851.2%American Indian
- 630.4%Native Hawaiian and Other
Pacific Islander
Median household income in 2022:
| Bostonia: | $69,550 |
| El Cajon: | $66,045 |
Distribution of median household income
![Distribution of median household income]()
- 509Less than $10,000
- 966$10,000 to $19,999
- 653$20,000 to $29,999
- 639$30,000 to $39,999
- 397$40,000 to $49,999
- 481$50,000 to $59,999
- 455$60,000 to $74,999
- 675$75,000 to $99,999
- 406$100,000 to $124,999
- 252$125,000 to $149,999
- 474$150,000 to $199,999
- 178$200,000 or more

Distribution of owner-occupied house/condo value
![Distribution of owner-occupied house/condo value]()
- 365Less than $50,000
- 252$50,000 to $99,999
- 136$100,000 to $149,999
- 99$150,000 to $199,999
- 156$200,000 to $249,999
- 313$250,000 to $299,999
- 325$300,000 to $399,999
- 264$400,000 to $499,999
- 852$500,000 to $749,999
- 110$750,000 to $999,999
- 41$1,000,000 or more

Distribution of rent paid by renters
![Distribution of rent paid by renters]()
- 127Less than $100
- 64$100 to $199
- 417$200 to $299
- 396$300 to $399
- 19$400 to $499
- 143$500 to $599
- 50$600 to $699
- 397$700 to $799
- 841$800 to $899
- 382$900 to $999
- 605$1,000 to $1,249
- 528$1,250 to $1,499
- 1,064$1,500 to $1,999
- 1,167$2,000 or more

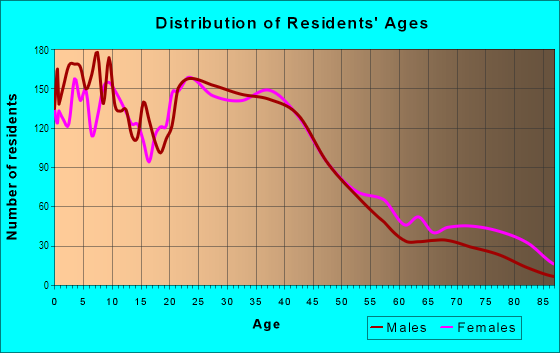
| Males: | 6,481 |
| Females: | 8,657 |
Males:
| This neighborhood: | 33.5 years |
| Whole city: | 39.4 years |
| This neighborhood: | 35.8 years |
| Whole city: | 35.9 years |
Average household size:
| Bostonia: | 4.0 people |
| El Cajon: | 3.0 people |
Percentage of family households:
| Bostonia: | 57.9% |
| El Cajon: | 51.3% |
| Here: | 40.4% |
| El Cajon: | 52.4% |
Percentage of married-couple families with children (among all households):
| Bostonia: | 18.5% |
| El Cajon: | 25.7% |
Percentage of single-mother households (among all households):
| Bostonia: | 10.1% |
| El Cajon: | 4.7% |
Percentage of never married males 15 years old and over:
Percentage of never married females 15 years old and over:
| Bostonia: | 17.0% |
| El Cajon: | 16.2% |
Percentage of never married females 15 years old and over:
| Bostonia: | 19.8% |
| city: | 15.9% |
Percentage of people that speak English not well or not at all:
| Bostonia: | 7.4% |
| El Cajon: | 10.7% |
Percentage of people born in this state:
Percentage of people born in another U.S. state:
Percentage of native residents but born outside the U.S.:
Percentage of foreign born residents:
| Here: | 53.3% |
| El Cajon: | 52.5% |
Percentage of people born in another U.S. state:
| Bostonia: | 15.9% |
| El Cajon: | 17.7% |
Percentage of native residents but born outside the U.S.:
| Here: | 3.8% |
| city: | 1.9% |
Percentage of foreign born residents:
| Here: | 27.0% |
| El Cajon: | 27.9% |
Owner-occupied
Renter-occupied

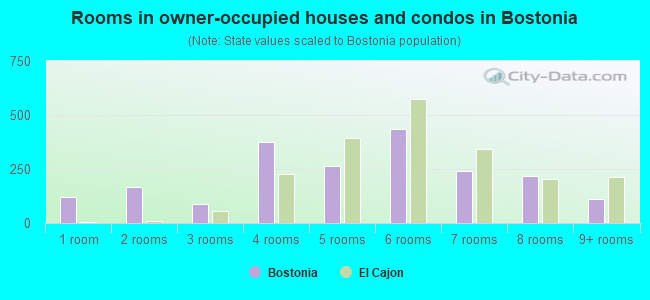
- Rooms in owner-occupied houses and condos in Bostonia
- 1191 room
- 1672 rooms
- 903 rooms
- 3754 rooms
- 2625 rooms
- 4366 rooms
- 2407 rooms
- 2188 rooms
- 1099+ rooms
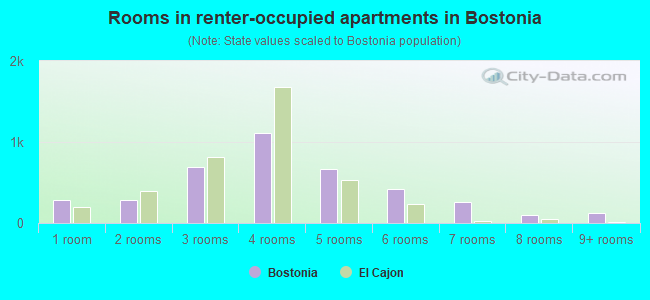
- Rooms in renter-occupied apartments in Bostonia
- 2781 room
- 2812 rooms
- 6893 rooms
- 1,1144 rooms
- 6665 rooms
- 4246 rooms
- 2607 rooms
- 1038 rooms
- 1269+ rooms
Owner-occupied
Renter-occupied
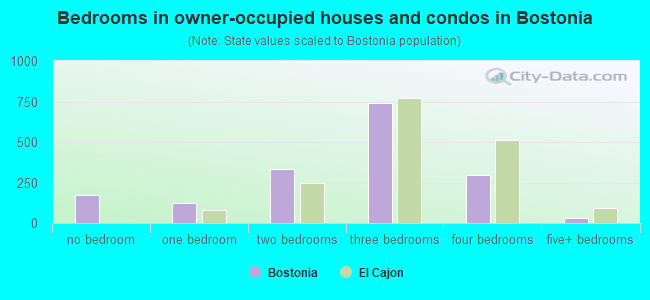
- Bedrooms in owner-occupied houses and condos in Bostonia
- 175no bedroom
- 1231 bedroom
- 3342 bedrooms
- 7413 bedrooms
- 2994 bedrooms
- 325+ bedrooms
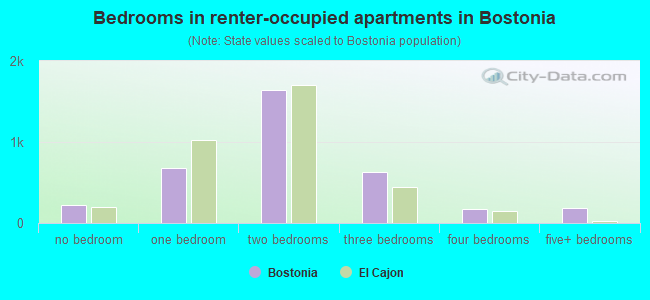
- Bedrooms in renter-occupied apartments in Bostonia
- 225no bedroom
- 6771 bedroom
- 1,6472 bedrooms
- 6283 bedrooms
- 1774 bedrooms
- 1825+ bedrooms
Average number of cars or other vehicles available in houses/condos:
Average number of cars or other vehicles available in apartments:
| This neighborhood: | 2.2 |
| El Cajon: | 2.2 |
Average number of cars or other vehicles available in apartments:
| Here: | 1.6 |
| city: | 1.5 |
Percentage of units with a mortgage:
| Bostonia: | 66.7% |
| El Cajon: | 70.7% |
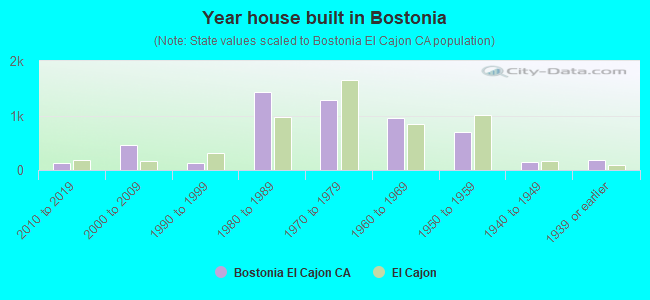
- Year house built in Bostonia
- 02020 or later
- 1222010 to 2019
- 4562000 to 2009
- 1371990 to 1999
- 1,4271980 to 1989
- 1,2871970 to 1979
- 9481960 to 1969
- 7061950 to 1959
- 1391940 to 1949
- 1781939 or earlier
City-data.com crime index for city in 2020 (higher means more crime):
| City: | 232.1 |
| U.S. average: | 219.5 |
Travel time to work (commute)
![Travel time to work (commute)]()
- 143Less than 5 minutes
- 6495 to 9 minutes
- 1,25210 to 14 minutes
- 1,16115 to 19 minutes
- 1,38420 to 24 minutes
- 78825 to 29 minutes
- 1,52530 to 34 minutes
- 38935 to 39 minutes
- 35440 to 44 minutes
- 74845 to 59 minutes
- 16960 to 89 minutes
- 17890 or more minutes

Means of transportation to work
![Means of transportation to work]()
- 73.0%4,870Drove a car alone
- 14.0%934Carpooled
- 1.8%122Bus
- 1.6%109Subway or elevated rail
- 1.7%111Light rail, streetcar or trolley
- 5.5%370Taxi
- 1.0%67Motorcycle
- 5.8%387Bicycle
- 9.5%633Walked
- 3.1%204Other means
- 5.6%375Worked at home

Time leaving home to go to work
![Time leaving home to go to work]()
- 65212:00 a.m. to 4:59 a.m.
- 3485:00 a.m. to 5:29 a.m.
- 4445:30 a.m. to 5:59 a.m.
- 7216:00 a.m. to 6:29 a.m.
- 6986:30 a.m. to 6:59 a.m.
- 8607:00 a.m. to 7:29 a.m.
- 9137:30 a.m. to 7:59 a.m.
- 9578:00 a.m. to 8:29 a.m.
- 3948:30 a.m. to 8:59 a.m.
- 5629:00 a.m. to 9:59 a.m.
- 30110:00 a.m. to 10:59 a.m.
- 14211:00 a.m. to 11:59 a.m.
- 55712:00 p.m. to 3:59 p.m.
- 9884:00 p.m. to 11:59 p.m.

Occupations of males:
- Percentage of males in management occupations (except farmers):
Here: 5.7% city: 8.3%
- Percentage of males in business and financial operations occupations:
Here: 2.7% city: 3.7%
- Percentage of males in computer and mathematical occupations:
Here: 3.4% city: 3.4%
- Percentage of males in life, physical, and social science occupations:
Here: 1.0% city: 0.6%
- Percentage of males in community and social services occupations:
Here: 2.3% city: 1.0%
- Percentage of males in education, training, and library occupations:
Here: 3.0% city: 2.8%
- Percentage of males in arts, design, entertainment, sports, and media occupations:
Here: 1.1% city: 1.4%
- Percentage of males in healthcare practitioners and technical occupations:
Here: 1.0% city: 1.4%
- Percentage of males in service occupations:
Here: 28.9% city: 18.3%
- Percentage of males in sales and office occupations:
Here: 12.4% city: 18.4%
- Percentage of males in construction, extraction, and maintenance occupations:
Here: 10.4% city: 11.6%
- Percentage of males in production occupations:
Here: 8.9% city: 7.4%
- Percentage of males in transportation occupations:
Here: 8.1% city: 8.2%
- Percentage of males in material moving occupations:
Here: 8.8% city: 6.1%
Occupations of females:
- Percentage of females in management occupations (except farmers):
Here: 7.1% city: 11.0%
- Percentage of females in business and financial operations occupations:
Here: 1.1% city: 4.3%
- Percentage of females in community and social services occupations:
Here: 2.5% city: 3.6%
- Percentage of females in legal occupations:
Here: 1.2% city: 1.1%
- Percentage of females in education, training, and library occupations:
Here: 4.8% city: 8.1%
- Percentage of females in arts, design, entertainment, sports, and media occupations:
Here: 1.1% city: 1.2%
- Percentage of females in healthcare practitioners and technical occupations:
Here: 3.2% city: 5.0%
- Percentage of females in service occupations:
Here: 22.9% city: 24.5%
- Percentage of females in sales and office occupations:
Here: 42.9% city: 31.3%
- Percentage of females in production occupations:
Here: 1.3% city: 1.8%
- Percentage of females in material moving occupations:
Here: 8.8% city: 2.5%
Percentage of people 16-64 in Armed Forces:
| Bostonia: | 1.6% |
| El Cajon: | 1.0% |
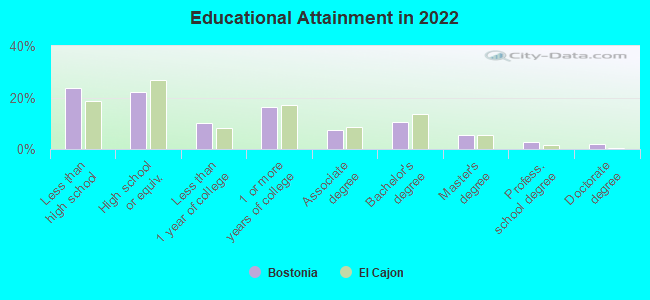
Education in this neighborhood (subdivision or community):
- Percentage of people 3 years and older in K-12 schools:
Bostonia: 21.4% El Cajon: 19.4%
- Percentage of people 3 years and older in undergraduate colleges:
Bostonia: 10.6% El Cajon: 6.5%
- Percentage of people 3 years and older in grad. or professional schools:
Bostonia: 1.6% El Cajon: 1.2%
- Percentage of students K-12 enrolled in private schools:
Bostonia: 88.0% El Cajon: 15.9%
Percentage of population below poverty level:
| Bostonia: | 22.0% |
| El Cajon: | 22.7% |
Median year renter moved in (as recorded in 2022):
| Bostonia: | 2012 |
| El Cajon: | 2018 |
Percentage of married-couple families with both working:
| Bostonia: | 57.7% |
| El Cajon: | 57.8% |
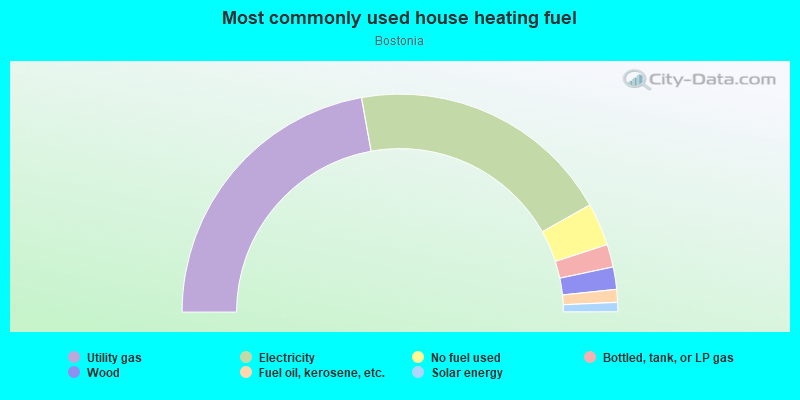
- 44.3%Utility gas
- 39.3%Electricity
- 6.3%No fuel used
- 3.4%Bottled, tank, or LP gas
- 3.3%Wood
- 1.9%Fuel oil, kerosene, etc.
- 1.4%Solar energy
Limited-access highways (interstate or state) in this neighborhood:
I- 8
Length: 6.13 miles
Directions: E-W, SW-NE
Directions: E-W, SW-NE
San Vicente Fwy (Hwy 67, State Hwy 67)
Length: 0.55 miles
Direction: N-S
Direction: N-S
Roads and streets:
Broadway
Length: 2.93 miles
Direction: E-W
Address range: 100 to 1656
Direction: E-W
Address range: 100 to 1656
Naranca Ave
Length: 1.66 miles
Directions: E-W, SE-NW
Address range: 900 to 1499
Directions: E-W, SE-NW
Address range: 900 to 1499
Peach Ave
Length: 1.66 miles
Direction: E-W
Address range: 900 to 1499
Direction: E-W
Address range: 900 to 1499
Marline Ave
Length: 1.22 miles
Direction: E-W
Address range: 1101 to 1499
Direction: E-W
Address range: 1101 to 1499
Sumner Ave
Length: 0.85 miles
Direction: E-W
Address range: 1000 to 1299
Direction: E-W
Address range: 1000 to 1299
Ballantyne St
Length: 0.61 miles
Directions: E-W, N-S, SE-NW
Address range: 603 to 1137
Directions: E-W, N-S, SE-NW
Address range: 603 to 1137
N 1st St
Length: 0.59 miles
Direction: N-S
Address range: 616 to 1199
Direction: N-S
Address range: 616 to 1199
N 2nd St
Length: 0.59 miles
Direction: N-S
Address range: 652 to 1199
Direction: N-S
Address range: 652 to 1199
Persimmon Ave
Length: 0.58 miles
Direction: E-W
Address range: 1100 to 1298
Direction: E-W
Address range: 1100 to 1298
Cedar St
Length: 0.58 miles
Direction: E-W
Address range: 100 to 749
Direction: E-W
Address range: 100 to 749
Graves Ave
Length: 0.56 miles
Directions: N-S, SE-NW
Address range: 650 to 999
Directions: N-S, SE-NW
Address range: 650 to 999
Oro St
Length: 0.52 miles
Direction: N-S
Address range: 700 to 1199
Direction: N-S
Address range: 700 to 1199
Sandalwood Dr
Length: 0.52 miles
Directions: E-W, SE-NW, SW-NE
Address range: 400 to 899
Directions: E-W, SE-NW, SW-NE
Address range: 400 to 899
E Main St
Length: 0.50 miles
Direction: SW-NE
Address range: 1480 to 1598
Direction: SW-NE
Address range: 1480 to 1598
N Mollison Ave
Length: 0.45 miles
Direction: N-S
Address range: 625 to 1005
Direction: N-S
Address range: 625 to 1005
Hart Dr
Length: 0.44 miles
Direction: E-W
Address range: 100 to 599
Direction: E-W
Address range: 100 to 599
N 3rd St
Length: 0.36 miles
Direction: N-S
Address range: 650 to 999
Direction: N-S
Address range: 650 to 999
Valley Village Dr
Length: 0.33 miles
Direction: E-W
Address range: 550 to 898
Direction: E-W
Address range: 550 to 898
Crosby St
Length: 0.32 miles
Directions: E-W, N-S
Address range: 900 to 1199
Directions: E-W, N-S
Address range: 900 to 1199
Farview St (Farview Ct)
Length: 0.31 miles
Directions: E-W, N-S, SW-NE
Address range: 600 to 1199
Directions: E-W, N-S, SW-NE
Address range: 600 to 1199
Grape St
Length: 0.29 miles
Direction: N-S
Address range: 650 to 899
Direction: N-S
Address range: 650 to 899
Brockwood Dr
Length: 0.28 miles
Directions: E-W, N-S, SE-NW
Address range: 500 to 721
Directions: E-W, N-S, SE-NW
Address range: 500 to 721
Rex Hall St
Length: 0.28 miles
Directions: N-S, SE-NW
Address range: 700 to 899
Directions: N-S, SE-NW
Address range: 700 to 899
Bostonia St
Length: 0.27 miles
Direction: N-S
Address range: 900 to 1244
Direction: N-S
Address range: 900 to 1244
N Anza St
Length: 0.25 miles
Direction: N-S
Address range: 900 to 1199
Direction: N-S
Address range: 900 to 1199
Cherrywood Way
Length: 0.22 miles
Directions: E-W, N-S
Address range: 800 to 899
Directions: E-W, N-S
Address range: 800 to 899
Coker Way
Length: 0.19 miles
Directions: E-W, N-S
Address range: 1345 to 1448
Directions: E-W, N-S
Address range: 1345 to 1448
Victor St (Victor Ave)
Length: 0.19 miles
Direction: N-S
Address range: 1000 to 1199
Direction: N-S
Address range: 1000 to 1199
Wayside Ave
Length: 0.16 miles
Direction: N-S
Address range: 1047 to 1227
Direction: N-S
Address range: 1047 to 1227
Lloyd St
Length: 0.15 miles
Directions: E-W, SE-NW
Address range: 200 to 399
Directions: E-W, SE-NW
Address range: 200 to 399
Applewood Dr
Length: 0.15 miles
Direction: N-S
Address range: 700 to 799
Direction: N-S
Address range: 700 to 799
Clarendon St
Length: 0.15 miles
Direction: E-W
Address range: 1200 to 1299
Direction: E-W
Address range: 1200 to 1299
Mascari Ct
Length: 0.14 miles
Directions: E-W, N-S, SW-NE
Address range: 1000 to 1099
Directions: E-W, N-S, SW-NE
Address range: 1000 to 1099
Latisha Pl
Length: 0.13 miles
Direction: N-S
Address range: 700 to 850
Direction: N-S
Address range: 700 to 850
Savin Dr
Length: 0.13 miles
Directions: E-W, SE-NW
Address range: 1513 to 1599
Directions: E-W, SE-NW
Address range: 1513 to 1599
Luke Ln
Length: 0.12 miles
Direction: E-W
Address range: 1500 to 1557
Direction: E-W
Address range: 1500 to 1557
Bluebell Way
Length: 0.12 miles
Direction: E-W
Address range: 1348 to 1399
Direction: E-W
Address range: 1348 to 1399
Persimmon Ct
Length: 0.12 miles
Direction: N-S
Address range: 1100 to 1199
Direction: N-S
Address range: 1100 to 1199
Coleen Ct
Length: 0.11 miles
Direction: N-S
Address range: 900 to 1099
Direction: N-S
Address range: 900 to 1099
Carnelian St
Length: 0.10 miles
Directions: N-S, SE-NW
Address range: 1100 to 1199
Directions: N-S, SE-NW
Address range: 1100 to 1199
Jacqueline Ct
Length: 0.10 miles
Directions: E-W, N-S, SE-NW
Address range: 1000 to 1099
Directions: E-W, N-S, SE-NW
Address range: 1000 to 1099
Greenfield Dr
Length: 0.10 miles
Direction: SE-NW
Address range: 1400 to 1454
Direction: SE-NW
Address range: 1400 to 1454
Stoney's Ln
Length: 0.10 miles
Directions: E-W, N-S
Directions: E-W, N-S
Opal St
Length: 0.08 miles
Direction: E-W
Direction: E-W
Mc Clure St
Length: 0.08 miles
Direction: N-S
Address range: 700 to 799
Direction: N-S
Address range: 700 to 799
Sumner Pl
Length: 0.07 miles
Direction: N-S
Address range: 1000 to 1099
Direction: N-S
Address range: 1000 to 1099
Conn Pl
Length: 0.07 miles
Direction: N-S
Address range: 700 to 799
Direction: N-S
Address range: 700 to 799
Wendell Cutting
Length: 0.06 miles
Directions: E-W, SE-NW
Directions: E-W, SE-NW
Persimmon Way
Length: 0.06 miles
Direction: N-S
Address range: 1200 to 1299
Direction: N-S
Address range: 1200 to 1299
Tangerine St
Length: 0.06 miles
Direction: N-S
Address range: 1140 to 1184
Direction: N-S
Address range: 1140 to 1184
Bethany Pl
Length: 0.06 miles
Direction: E-W
Address range: 1300 to 1399
Direction: E-W
Address range: 1300 to 1399
Beanie Ln
Length: 0.06 miles
Directions: E-W, SE-NW
Address range: 1200 to 1299
Directions: E-W, SE-NW
Address range: 1200 to 1299
Sumner Ct
Length: 0.05 miles
Direction: N-S
Address range: 1000 to 1099
Direction: N-S
Address range: 1000 to 1099
Treetop Ln
Length: 0.05 miles
Direction: N-S
Address range: 700 to 799
Direction: N-S
Address range: 700 to 799
Jeannine Ln
Length: 0.05 miles
Direction: N-S
Address range: 1200 to 1299
Direction: N-S
Address range: 1200 to 1299
Tucson St (Tucson Ct)
Length: 0.05 miles
Direction: SE-NW
Address range: 1100 to 1199
Direction: SE-NW
Address range: 1100 to 1199
Mayberry Ln
Length: 0.05 miles
Direction: E-W
Address range: 700 to 799
Direction: E-W
Address range: 700 to 799
Laurelwood Way
Length: 0.05 miles
Direction: N-S
Address range: 756 to 799
Direction: N-S
Address range: 756 to 799
Peach Ct
Length: 0.04 miles
Direction: N-S
Address range: 800 to 1099
Direction: N-S
Address range: 800 to 1099
Maplewood Way
Length: 0.04 miles
Direction: N-S
Address range: 757 to 799
Direction: N-S
Address range: 757 to 799
Oakwood Way
Length: 0.03 miles
Direction: SW-NE
Address range: 600 to 641
Direction: SW-NE
Address range: 600 to 641
Rydell Pl
Length: 0.03 miles
Direction: E-W
Address range: 800 to 899
Direction: E-W
Address range: 800 to 899
Mazzola St
Length: 0.03 miles
Direction: E-W
Direction: E-W
Catalpa Way
Length: 0.03 miles
Direction: N-S
Address range: 740 to 799
Direction: N-S
Address range: 740 to 799
Edgeland St
Length: 0.03 miles
Direction: E-W
Address range: 770 to 799
Direction: E-W
Address range: 770 to 799
Fletcher Pkwy
Length: 0.01 miles
Direction: E-W
Direction: E-W