Estimated zip code population in 2022: 69,059 Zip code population in 2010: 65,068 Zip code population in 2000: 61,868
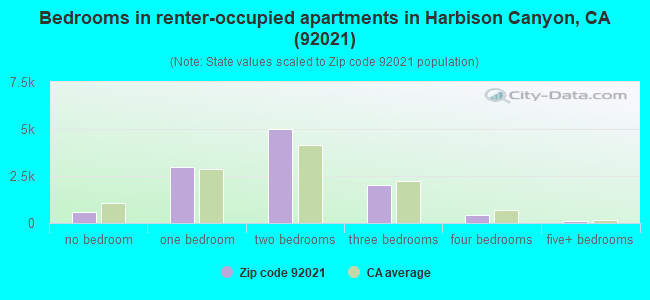
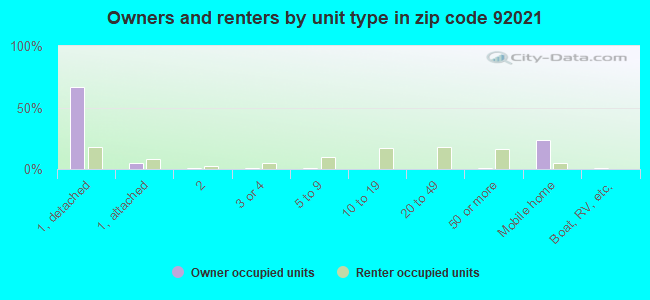
Houses and condos: 23,960 Renter-occupied apartments: 11,162
% of renters here:
48%
State:
44%
March 2022 cost of living index in zip code 92021: 122.8 (high, U.S. average is 100)
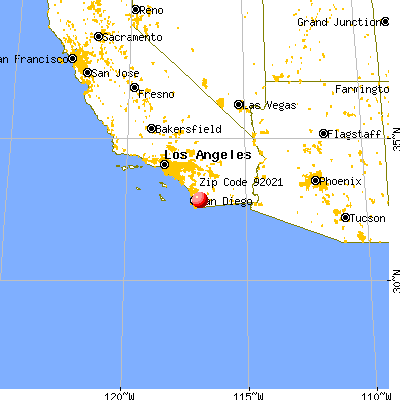
Land area: 29.8 sq. mi. Water area: 0.2 sq. mi.
Population density: 2,315 people per square mile
(low).
OSM Map
General Map
Google Map
MSN Map
OSM Map
General Map
Google Map
MSN Map
OSM Map
General Map
Google Map
MSN Map
OSM Map
General Map
Google Map
MSN Map
Please wait while loading the map...
Real estate property taxes paid for housing units in 2022:
This zip code:
0.6% ($3,693)
California:
0.7% ($4,831)
Median real estate property taxes paid for housing units with mortgages in 2022: $4,682 (0.7%) Median real estate property taxes paid for housing units with no mortgage in 2022: $1,826 (0.6%)
Averages for the 2020 tax year for zip code 92021, filed in 2021:
Average Adjusted Gross Income (AGI) in 2020: $57,988 (Individual Income Tax Returns)
Here:
$57,988
State:
$95,910
Salary/wage: $50,111 (reported on 82.9% of returns)
Here:
$50,111
State:
$77,331
(% of AGI for various income ranges: 1182.7% for AGIs below $25k, 3747.6% for AGIs $25k-50k, 7057.6% for AGIs $50k-75k, 10269.4% for AGIs $75k-100k, 19392.7% for AGIs $100k-200k, 70580.4% for AGIs over 200k)
Taxable interest for individuals: $855 (reported on 26.1% of returns)
This zip code:
$855
California:
$2,294
(% of AGI for various income ranges: 7.5% for AGIs below $25k, 9.9% for AGIs $25k-50k, 24.0% for AGIs $50k-75k, 38.1% for AGIs $75k-100k, 88.3% for AGIs $100k-200k, 1031.9% for AGIs over 200k)
Ordinary dividends: $4,760 (reported on 9.9% of returns)
Here:
$4,760
State:
$10,949
(% of AGI for various income ranges: 13.9% for AGIs below $25k, 15.3% for AGIs $25k-50k, 37.7% for AGIs $50k-75k, 80.5% for AGIs $75k-100k, 140.0% for AGIs $100k-200k, 2927.3% for AGIs over 200k)
Net capital gain/loss in AGI: +$16,146 (reported on 10.4% of returns)
Here:
+$16,146
State:
+$49,306
(% of AGI for various income ranges: 2.5% for AGIs below $25k, 16.7% for AGIs $25k-50k, 50.2% for AGIs $50k-75k, 106.9% for AGIs $75k-100k, 357.9% for AGIs $100k-200k, 16259.2% for AGIs over 200k)
Profit/loss from business: +$8,698 (reported on 15.9% of returns)
Here:
+$8,698
State:
+$15,671
(% of AGI for various income ranges: 137.9% for AGIs below $25k, 130.1% for AGIs $25k-50k, 164.7% for AGIs $50k-75k, 211.4% for AGIs $75k-100k, 461.1% for AGIs $100k-200k, 2441.9% for AGIs over 200k)
Taxable individual retirement arrangement distribution: $17,096 (reported on 5.2% of returns)
92021:
$17,096
California:
$23,505
(% of AGI for various income ranges: 26.0% for AGIs below $25k, 45.0% for AGIs $25k-50k, 115.1% for AGIs $50k-75k, 244.1% for AGIs $75k-100k, 469.6% for AGIs $100k-200k, 2206.9% for AGIs over 200k)
Self-employed (Keogh) retirement plans: $15,080 (reported on 0.2% of returns)
92021:
$15,080
California:
$30,163
(% of AGI for various income ranges: 36.6% for AGIs $100k-200k)
Total itemized deductions: $31,360 (reported on 11.6% of returns)
Here:
$31,360
State:
$39,517
(% of AGI for various income ranges: 49.5% for AGIs below $25k, 134.8% for AGIs $25k-50k, 430.5% for AGIs $50k-75k, 1039.8% for AGIs $75k-100k, 2228.4% for AGIs $100k-200k, 10107.7% for AGIs over 200k)
Charity contributions: $6,453 (reported on 9.0% of returns)
Here:
$6,453
State:
$12,598
(% of AGI for various income ranges: 3.0% for AGIs below $25k, 14.2% for AGIs $25k-50k, 40.0% for AGIs $50k-75k, 121.0% for AGIs $75k-100k, 326.0% for AGIs $100k-200k, 2901.2% for AGIs over 200k)
Taxes paid: $8,306 (reported on 11.6% of returns)
92021:
$8,306
State:
$8,807
(% of AGI for various income ranges: 10.9% for AGIs below $25k, 29.5% for AGIs $25k-50k, 117.0% for AGIs $50k-75k, 296.3% for AGIs $75k-100k, 665.1% for AGIs $100k-200k, 2098.5% for AGIs over 200k)
Earned income credit: $2,359 (reported on 20.0% of returns)
Here:
$2,359
State:
$2,074
(% of AGI for various income ranges: 122.1% for AGIs below $25k, 83.6% for AGIs $25k-50k, 1.7% for AGIs $50k-75k)
Percentage of individuals using paid preparers for their 2020 taxes: 94.0%
Here:
94%
State:
92%
(% for various income ranges: 93.0% for AGIs below $25k, 94.9% for AGIs $25k-50k, 93.9% for AGIs $50k-75k, 94.0% for AGIs $75k-100k, 95.1% for AGIs $100k-200k, 93.5% for AGIs over 200k)
Averages for the 2012 tax year for zip code 92021, filed in 2013:
Average Adjusted Gross Income (AGI) in 2012: $46,708 (Individual Income Tax Returns)
Here:
$46,708
State:
$72,726
Salary/wage: $41,567 (reported on 85.1% of returns)
Here:
$41,567
State:
$59,079
(% of AGI for various income ranges: 76.5% for AGIs below $25k, 81.9% for AGIs $25k-50k, 78.9% for AGIs $50k-75k, 78.6% for AGIs $75k-100k, 76.6% for AGIs $100k-200k, 54.2% for AGIs over 200k)
Taxable interest for individuals: $956 (reported on 26.9% of returns)
This zip code:
$956
California:
$2,146
(% of AGI for various income ranges: 0.7% for AGIs below $25k, 0.3% for AGIs $25k-50k, 0.4% for AGIs $50k-75k, 0.3% for AGIs $75k-100k, 0.4% for AGIs $100k-200k, 1.6% for AGIs over 200k)
Ordinary dividends: $3,889 (reported on 10.9% of returns)
Here:
$3,889
State:
$9,308
(% of AGI for various income ranges: 0.8% for AGIs below $25k, 0.5% for AGIs $25k-50k, 0.6% for AGIs $50k-75k, 0.6% for AGIs $75k-100k, 0.6% for AGIs $100k-200k, 3.3% for AGIs over 200k)
Net capital gain/loss in AGI: +$4,566 (reported on 8.7% of returns)
Here:
+$4,566
State:
+$30,460
(% of AGI for various income ranges: 0.3% for AGIs $50k-75k, 0.4% for AGIs $75k-100k, 0.8% for AGIs $100k-200k, 4.8% for AGIs over 200k)
Profit/loss from business: +$11,592 (reported on 14.4% of returns)
Here:
+$11,592
State:
+$17,064
(% of AGI for various income ranges: 9.2% for AGIs below $25k, 3.2% for AGIs $25k-50k, 2.5% for AGIs $50k-75k, 2.3% for AGIs $75k-100k, 2.4% for AGIs $100k-200k, 4.2% for AGIs over 200k)
Taxable individual retirement arrangement distribution: $13,584 (reported on 6.4% of returns)
92021:
$13,584
California:
$19,557
(% of AGI for various income ranges: 1.6% for AGIs below $25k, 1.4% for AGIs $25k-50k, 2.0% for AGIs $50k-75k, 2.2% for AGIs $75k-100k, 1.9% for AGIs $100k-200k, 2.1% for AGIs over 200k)
Self-employment retirement plans: $18,743 (reported on 0.2% of returns)
92021:
$18,743
California:
$24,530
Total itemized deductions: $25,417 (27% of AGI, reported on 27.4% of returns)
Here:
$25,417
State:
$34,004
Here:
26.9% of AGI
State:
22.7% of AGI
(% of AGI for various income ranges: 6.6% for AGIs below $25k, 9.5% for AGIs $25k-50k, 14.4% for AGIs $50k-75k, 17.6% for AGIs $75k-100k, 20.5% for AGIs $100k-200k, 18.1% for AGIs over 200k)
Charity contributions: $2,936 (reported on 22.3% of returns)
Here:
$2,936
State:
$4,659
(% of AGI for various income ranges: 0.4% for AGIs below $25k, 0.8% for AGIs $25k-50k, 1.3% for AGIs $50k-75k, 1.7% for AGIs $75k-100k, 2.0% for AGIs $100k-200k, 2.0% for AGIs over 200k)
Taxes paid: $8,233 (reported on 27.4% of returns)
92021:
$8,233
State:
$14,448
(% of AGI for various income ranges: 1.2% for AGIs below $25k, 2.1% for AGIs $25k-50k, 3.7% for AGIs $50k-75k, 5.3% for AGIs $75k-100k, 7.1% for AGIs $100k-200k, 9.4% for AGIs over 200k)
Earned income credit: $2,352 (reported on 24.4% of returns)
Here:
$2,352
State:
$2,286
(% of AGI for various income ranges: 8.2% for AGIs below $25k, 1.3% for AGIs $25k-50k)
Percentage of individuals using paid preparers for their 2012 taxes: 60.1%
Here:
60%
State:
64%
(% for various income ranges: 58.2% for AGIs below $25k, 58.2% for AGIs $25k-50k, 60.4% for AGIs $50k-75k, 64.8% for AGIs $75k-100k, 66.5% for AGIs $100k-200k, 79.1% for AGIs over 200k)
Averages for the 2004 tax year for zip code 92021, filed in 2005:
Average Adjusted Gross Income (AGI) in 2004: $43,247 (Individual Income Tax Returns)
Here:
$43,247
State:
$58,600
Salary/wage: $38,723 (reported on 86.3% of returns)
Here:
$38,723
State:
$49,455
(% of AGI for various income ranges: 184.6% for AGIs below $10k, 80.5% for AGIs $10k-25k, 84.7% for AGIs $25k-50k, 83.4% for AGIs $50k-75k, 83.1% for AGIs $75k-100k, 60.5% for AGIs over 100k)
Taxable interest for individuals: $1,180 (reported on 38.0% of returns)
This zip code:
$1,180
California:
$2,365
(% of AGI for various income ranges: 7.5% for AGIs below $10k, 1.2% for AGIs $10k-25k, 0.7% for AGIs $25k-50k, 0.8% for AGIs $50k-75k, 0.8% for AGIs $75k-100k, 1.3% for AGIs over 100k)
Taxable dividends: $1,802 (reported on 14.5% of returns)
Here:
$1,802
State:
$4,746
(% of AGI for various income ranges: 4.1% for AGIs below $10k, 0.7% for AGIs $10k-25k, 0.5% for AGIs $25k-50k, 0.4% for AGIs $50k-75k, 0.5% for AGIs $75k-100k, 0.8% for AGIs over 100k)
Net capital gain/loss: +$7,989 (reported on 12.0% of returns)
Here:
+$7,989
State:
+$23,418
(% of AGI for various income ranges: -2.6% for AGIs below $10k, 0.3% for AGIs $10k-25k, 0.2% for AGIs $25k-50k, 0.6% for AGIs $50k-75k, 0.9% for AGIs $75k-100k, 6.2% for AGIs over 100k)
Profit/loss from business: +$11,551 (reported on 13.5% of returns)
Here:
+$11,551
State:
+$16,826
(% of AGI for various income ranges: 6.3% for AGIs below $10k, 5.1% for AGIs $10k-25k, 3.3% for AGIs $25k-50k, 3.0% for AGIs $50k-75k, 3.3% for AGIs $75k-100k, 3.8% for AGIs over 100k)
IRA payment deduction: $3,011 (reported on 2.1% of returns)
92021:
$3,011
California:
$3,192
(% of AGI for various income ranges: 0.3% for AGIs below $10k, 0.1% for AGIs $10k-25k, 0.2% for AGIs $25k-50k, 0.1% for AGIs $50k-75k, 0.1% for AGIs $75k-100k, 0.1% for AGIs over 100k)
Self-employed pension: $12,817 (reported on 0.5% of returns)
Here:
$12,817
California:
$17,688
(% of AGI for various income ranges: 0.4% for AGIs below $10k, 0.0% for AGIs $25k-50k, 0.1% for AGIs $50k-75k, 0.1% for AGIs $75k-100k, 0.3% for AGIs over 100k)
Total itemized deductions: $23,875 (28% of AGI, reported on 31.3% of returns)
Here:
$23,875
State:
$28,113
Here:
28.2% of AGI
State:
25.3% of AGI
(% of AGI for various income ranges: 28.4% for AGIs below $10k, 8.7% for AGIs $10k-25k, 11.7% for AGIs $25k-50k, 19.9% for AGIs $50k-75k, 24.2% for AGIs $75k-100k, 19.2% for AGIs over 100k)
Charity contributions deductions: $2,838 (3% of AGI, reported on 27.3% of returns)
Here:
$2,838
State:
$3,923
Here:
3.2% of AGI
State:
3.3% of AGI
(% of AGI for various income ranges: 1.2% for AGIs below $10k, 0.7% for AGIs $10k-25k, 1.1% for AGIs $25k-50k, 2.0% for AGIs $50k-75k, 2.3% for AGIs $75k-100k, 2.3% for AGIs over 100k)
Total tax: $6,111 (reported on 75.0% of returns)
92021:
$6,111
State:
$10,761
(% of AGI for various income ranges: 5.9% for AGIs below $10k, 4.1% for AGIs $10k-25k, 6.8% for AGIs $25k-50k, 8.2% for AGIs $50k-75k, 9.2% for AGIs $75k-100k, 18.2% for AGIs over 100k)
Earned income credit: $1,703 (reported on 17.9% of returns)
Here:
$1,703
State:
$1,763
Percentage of individuals using paid preparers for their 2004 taxes: 62.9%
Here:
63%
State:
66%
(% for various income ranges: 54.4% for AGIs below $10k, 63.1% for AGIs $10k-25k, 61.1% for AGIs $25k-50k, 66.4% for AGIs $50k-75k, 68.4% for AGIs $75k-100k, 77.2% for AGIs over 100k)
Likely homosexual households (counted as self-reported same-sex unmarried-partner households)
Lesbian couples: 0.1% of all households
Gay men: 0.1% of all households
Household received Food Stamps/SNAP in the past 12 months: 5,582 Household did not receive Food Stamps/SNAP in the past 12 months: 18,254
Women who had a birth in the past 12 months: 1,440 (891 now married, 550 unmarried) Women who did not have a birth in the past 12 months: 14,710 (6,385 now married, 8,301 unmarried)
Housing units in zip code 92021 with a mortgage: 7,304 (599 second mortgage, 556 both second mortgage and home equity loan) Houses without a mortgage: 107
Median monthly owner costs for units with a mortgage: $2,566 Median monthly owner costs for units without a mortgage: $700
Residents with income below the poverty level in 2022:
This zip code:
17.5%
Whole state:
12.2%
Residents with income below 50% of the poverty level in 2022:
This zip code:
8.9%
Whole state:
6.2%
Median number of rooms in houses and condos:
Here:
5.8
State:
6.0
Median number of rooms in apartments:
Here:
4.0
State:
3.9
Notable locations in this zip code not listed on our city pages
Notable locations in zip code 92021: Flinn Springs Fire Control Station (A), Cornelius Ranch (B), Reynon Ranch (C), McClain Ranch (D), Crest Branch San Diego County Library (E), Balboa Ambulance (F), Lakeside Fire Protection District Station 3 (G), Lakeside Fire Protection District Station 26 (H), San Miguel Consolidated Fire Protection District Station 18 (I), San Miguel Consolidated Fire Protection District Station 19 (J), California Department of Forestry and Fire Protection Station 21 - Flinn Springs (K). Display/hide their locations on the map
Shopping Centers: Town and Country Village Shopping Center (1), Safari Shopping Center (2), Mollway Mart Shopping Center (3), Main Street Shopping Center (4), Madison Plaza Shopping Center (5), Los Coches Village Shopping Center (6), Cajon Shopping Center (7), Bostonia Shoppers Mart Shopping Center (8), Broadway Plaza Shopping Center (9). Display/hide their locations on the map
Churches in zip code 92021 include: Iglesia Pentecostal el Buen Pastor (A), Iglesia de Cristo Ministerios de El Cajon (B), Victory Chapel Foursquare Church (C), Teaching of the Inner Christ Church (D), Saint Louise de Marillac Catholic Church (E), Saint Kierans Catholic Church (F), Rancho Santa Marta Church (G), El Cajon Church of the Nazarene (H), El Cajon Alliance Church (I). Display/hide their locations on the map
Parks in zip code 92021 include: Nancy Jane County Park (1), Flinn Springs County Park (2), Wells Park (3), Bostonia Park (4), Marshal Scottys Playland (5), Van Zanten Park (6), South Lane Park (7). Display/hide their locations on the map
9,867 married couples with children.
4,786 single-parent households (1,467 men, 3,319 women).
65.6% of residents of 92021 zip code speak English at home.
19.1% of residents speak Spanish at home (65% very well, 20% well, 11% not well, 4% not at all).
2.3% of residents speak other Indo-European language at home (59% very well, 23% well, 16% not well, 2% not at all).
3.1% of residents speak Asian or Pacific Island language at home (61% very well, 22% well, 15% not well, 2% not at all).
9.6% of residents speak other language at home (44% very well, 31% well, 18% not well, 8% not at all).
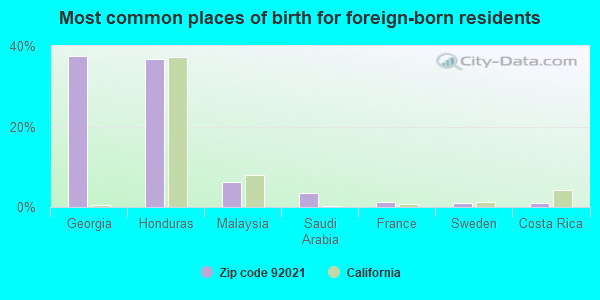
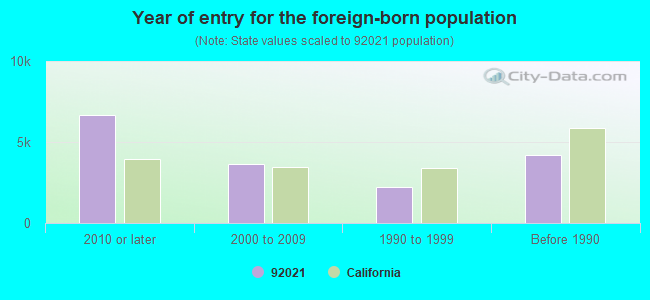
Foreign born population: 14,398 (20.8%) (51.8% of them are naturalized citizens)
Major facilities with environmental interests located in this zip code:
C W MCGRATH INC (13080 OLD HWY 8 in EL CAJON, CA) . Federal Facility
STATE MASTER (California - Hazardous Waste Tracking) - HAZARDOU WASTE PROGRAM CRITERIA AND HAZARDOUS AIR POLLUTANT INVENTORY (Inventory of air pollution sources) Small Quantity Generators, between 100 kg and 1000 kg of hazardous waste/month (Resource Conservation and Recovery Act (tracking hazardous waste)) - notification Business SIC classification: TOP, BODY, AND UPHOLSTERY REPAIR SHOPS AND PAINT SHOPS Organizations: C W MC GRATH INC (CONTACT/OWNER)
FIRESTONE STORE #2254 (435 N 2ND ST in EL CAJON, CA)
Small Quantity Generators, between 100 kg and 1000 kg of hazardous waste/month (Resource Conservation and Recovery Act (tracking hazardous waste)) STATE MASTER (California - Used Oil Recycling System ) - USED OIL RECYCLING Organizations: GEO F KENNEDY (CONTACT/OWNER)
Alternative names: KENNEDYS FIRESTONE
ARCO #640 (593 MOLLISON AVENUE NORTH in EL CAJON, CA)
STATE MASTER (California - Hazardous Waste Tracking) - HAZARDOU WASTE PROGRAM CRITERIA AND HAZARDOUS AIR POLLUTANT INVENTORY (Inventory of air pollution sources) Small Quantity Generators, between 100 kg and 1000 kg of hazardous waste/month (Resource Conservation and Recovery Act (tracking hazardous waste)) - notification Business SIC classification: GASOLINE SERVICE STATIONS Organizations: B P WEST COAST PRODUCTS LLC (CONTACT/OWNER)
Alternative names: ARCO FACILITY NO 06061, BP WEST COAST PRODUCTS LLC 6061, PRESTIGE STATIONS INC NO 0640
JAMACHA CLEANERS (544 JAMACHA RD in EL CAJON, CA)
STATE MASTER (California - Hazardous Waste Tracking) - HAZARDOU WASTE PROGRAM CRITERIA AND HAZARDOUS AIR POLLUTANT INVENTORY (Inventory of air pollution sources) Small Quantity Generators, between 100 kg and 1000 kg of hazardous waste/month (Resource Conservation and Recovery Act (tracking hazardous waste)) Business SIC classification: DRYCLEANING PLANTS, EXCEPT RUG CLEANING
MARCK MOTORS BODY SHOP INCORPORATED (791 GREENFIELD DRIVE SUITE E in EL CAJON, CA)
STATE MASTER (California - Hazardous Waste Tracking) - HAZARDOU WASTE PROGRAM CRITERIA AND HAZARDOUS AIR POLLUTANT INVENTORY (Inventory of air pollution sources) Small Quantity Generators, between 100 kg and 1000 kg of hazardous waste/month (Resource Conservation and Recovery Act (tracking hazardous waste)) Business SIC classification: TOP, BODY, AND UPHOLSTERY REPAIR SHOPS AND PAINT SHOPS Business NAICS classification: AUTOMOTIVE BODY, PAINT, AND INTERIOR REPAIR AND MAINTENANCE.
FLETCHER HILLS TIRE & BRAKE INC (500 N SECOND ST in EL CAJON, CA)
STATE MASTER (California - Hazardous Waste Tracking) - HAZARDOU WASTE PROGRAM Small Quantity Generators, between 100 kg and 1000 kg of hazardous waste/month (Resource Conservation and Recovery Act (tracking hazardous waste))
EAST CO URGENT CARE (1625 E MAIN ST 100 in EL CAJON, CA)
STATE MASTER (California - Hazardous Waste Tracking) - HAZARDOU WASTE PROGRAM Small Quantity Generators, between 100 kg and 1000 kg of hazardous waste/month (Resource Conservation and Recovery Act (tracking hazardous waste)) - notification Organizations: GARDEN OAKS ASSOC (CONTACT/OWNER)
HALL (W. D.) ELEMENTARY (1374 PEPPER DR. in EL CAJON, CA)
(National Center for Education Statistics) - STATE ID-6037741 Organizations: CAJON VALLEY UNION ELEMENTARY (SCHOOL DISTRICT)
CAJON VALLEY COMMUNITY DAY (189 ROANOKE ROAD in EL CAJON, CA)
(National Center for Education Statistics) - STATE ID-6117295 Organizations: CAJON VALLEY UNION ELEMENTARY (SCHOOL DISTRICT)
EL CAJON VALLEY HIGH (1035 E. MADISON AVE. in EL CAJON, CA)
(National Center for Education Statistics) - STATE ID-3731692 Organizations: GROSSMONT UNION HIGH (SCHOOL DISTRICT)
NARANCA ELEMENTARY (1030 NARANCA ST. in EL CAJON, CA)
(National Center for Education Statistics) - STATE ID-6037725 Organizations: CAJON VALLEY UNION ELEMENTARY (SCHOOL DISTRICT)
GREENFIELD MIDDLE (1495 GREENFIELD DR. in EL CAJON, CA)
(National Center for Education Statistics) - STATE ID-6037659 Organizations: CAJON VALLEY UNION ELEMENTARY (SCHOOL DISTRICT)
MAGNOLIA ELEMENTARY (650 GREENFIELD DR. in EL CAJON, CA)
(National Center for Education Statistics) - STATE ID-6037709 Organizations: CAJON VALLEY UNION ELEMENTARY (SCHOOL DISTRICT)
Housing units lacking complete plumbing facilities: 0.6% Housing units lacking complete kitchen facilities: 1.3%
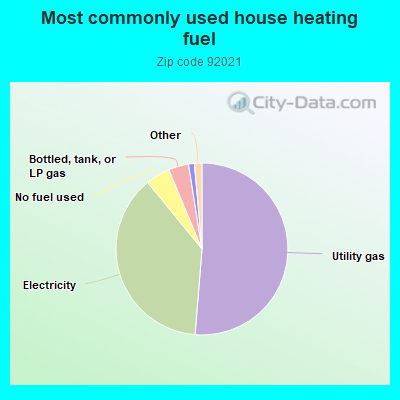
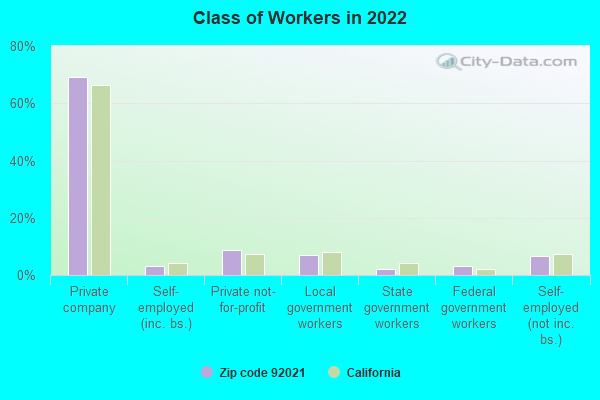
51.3%Utility gas
37.8%Electricity
4.6%No fuel used
3.8%Bottled, tank, or LP gas
1.1%Solar energy
0.7%Wood
0.6%Other fuel
Population in 1990: 51,773. Population change in the 1990s: +10,095 (+19.5%).
Place of birth for U.S.-born residents:
This state: 40,046
Northeast: 3,014
Midwest: 4,031
South: 3,174
West: 2,506
45% of the 92021 zip code residents lived in the same house 5 years ago. Out of people who lived in different houses, 80% lived in this county. Out of people who lived in different counties, 50% lived in California.
87% of the 92021 zip code residents lived in the same house 1 year ago. Out of people who lived in different houses, 73% moved from this county. Out of people who lived in different houses, 5% moved from different county within same state. Out of people who lived in different houses, 17% moved from different state. Out of people who lived in different houses, 2% moved from abroad.
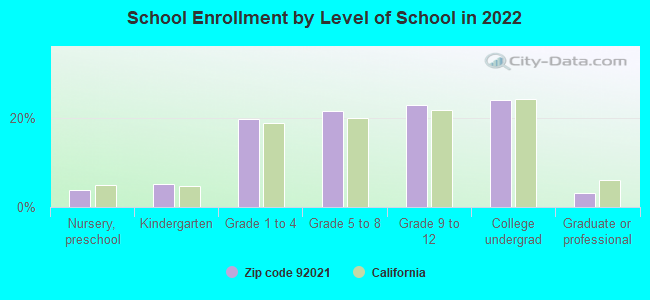
Private vs. public school enrollment:
Students in private schools in grades 1 to 8 (elementary and middle school): 754
Here:
10.0%
California:
10.5%
Students in private schools in grades 9 to 12 (high school): 355
Here:
8.4%
California:
8.5%
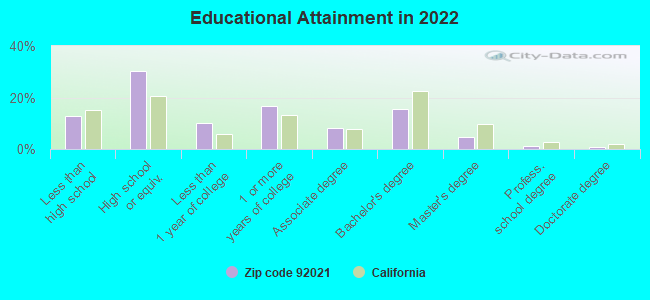
Students in private undergraduate colleges: 476
Here:
10.8%
California:
15.9%
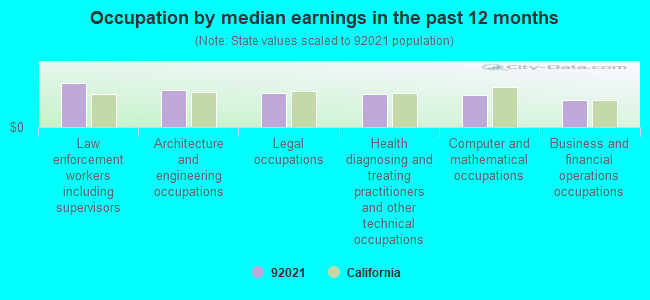
Occupation by median earnings in the past 12 months ($)
127,533Law enforcement workers including supervisors
106,905Architecture and engineering occupations
97,376Legal occupations
95,082Health diagnosing and treating practitioners and other technical occupations
94,084Computer and mathematical occupations
77,683Business and financial operations occupations
Companies with biggest federal contracts located in this zip code (EL CAJON, CA):
INNOVASYSTEMS INTERNATIONAL, L (13465 CAMINO CANADA 106-50; small business) : $58,116,339 in 20 contractsfrom 2001 to 2006
Contracts for Other Defense -- Engineering Development (R&D), Engineering and Technical Services, Other ADP and Telecommunications Services (includes data storage on tapes, compact disks, etc.), Other Research and Development -- Operational Systems Development (R&D), and moreby Navy Signed by year:2000: $0; 2001: $5,066,765; 2002: $6,758,982; 2003: $10,524,506; 2004: $6,755,433; 2005: $15,149,821; 2006: $13,860,832.
Biggest contracts:
$9,444,289 with Navy for Other Defense -- Engineering Development (R&D). Signed on 2006-06-01. Completion date: 2007-05-31.
$8,796,107, same as above.Signed on 2005-08-26. Completion date: 2006-08-25.
$6,755,433 with Navy for Engineering and Technical Services. Signed on 2004-07-16. Completion date: 2005-06-26.
$5,800,354, same as above.Signed on 2002-06-27. Completion date: 2003-06-26.
EDDY PUMP CORPORATION (15405 OLDE HIGHWAY 80; small business) : $7,207,663 in 90 contractsfrom 2000 to 2006
Contracts for Power and Hand Pumps, Electrical Control Equipment, Non-nuclear Ship Repair (East) Ship repair (including overhauls and conversions) performed on non-nuclear propelled and nonpropelled ships east of the 108th meridian, Compressors and Vacuum Pumps, and moreby Defense Logistics Agency, Navy Signed by year:2000: $3,144,639; 2001: $218,849; 2002: $1,042,381; 2003: $1,056,835; 2004: $1,309,060; 2005: $341,089; 2006: $94,810.
Biggest contracts:
$1,968,324 with Defense Logistics Agency for Power and Hand Pumps. Signed on 2000-12-12. Completion date: 2001-03-16.
$425,096 with Navy for Electrical Control Equipment. Signed on 2004-09-30. Completion date: 2005-04-15.
$396,270 with Navy for Power and Hand Pumps. Taking place in MA. Signed on 2003-11-26. Completion date: 2004-02-22.
$261,600 with Navy for Power and Hand Pumps. Taking place in VA. Signed on 2003-05-16. Completion date: 2003-09-12.
DIGITAL WEST IMAGING (450 MOUNTAIN VIEW RD; small business) : $2,393,430 in 4 contractsfrom 2002 to 2005
$2,227,665 with Army for Cameras, Still Picture. Signed on 2005-02-22. Completion date: 2005-05-12.
$89,950, same as above.Signed on 2004-09-20. Completion date: 2004-11-14.
$46,075 with Army for Medical and Surgical Instruments, Equipment, and Supplies. Signed on 2003-08-18. Completion date: 2003-10-22.
$29,740 with Army for Photographic Equipment and Accessories. Signed on 2002-09-09. Completion date: 2002-10-12.
G E T ENGINEERING CORP (9350 BOND AVE; small business) : $2,253,623 in 42 contractsfrom 2000 to 2006
Contracts for Electronic Modules, Switches, ADP Input/Output and Storage Devices, Miscellaneous Electrical and Electronic Components, and moreby Navy Signed by year:2000: $894,039; 2001: $550,461; 2002: $236,265; 2003: $20,060; 2004: $359,443; 2005: $128,540; 2006: $64,815.
Biggest contracts:
$298,500 with Navy for Electronic Modules. Taking place in MD. Signed on 2004-06-01. Completion date: 2004-06-01.
$283,548 with Navy for Switches. Signed on 2000-03-24. Completion date: 2000-09-24.
$283,548, same as above.Signed on 2000-08-08. Completion date: 2000-03-24.
$212,806 with Navy for ADP Input/Output and Storage Devices. Signed on 2000-10-16. Completion date: 2001-02-07.
DV ASSOCIATES INC (13283 HIGHWAY 8 BUSINESS; small business) : $1,008,179 in 22 contractsfrom 2000 to 2005
Contracts for Construction of Structures and Facilities -- Miscellaneous Buildings, Maintenance, Repair or Alteration of Real Property -- Other Non-Building Facilities, Construction of Structures and Facilities -- Other Non-Building Facilities, Construction of Structures and Facilities -- Other Utilities by Navy Signed by year:2000: $96,852; 2001: $371,930; 2002: $260,859; 2003: $143,624; 2004: $129,780; 2005: $5,134; 2006: $0.
Biggest contracts:
$261,541 with Navy for Construction of Structures and Facilities -- Miscellaneous Buildings. Taking place in FL. Signed on 2001-06-07. Completion date: 2002-02-22.
$223,454, same as above.Signed on 2002-09-30. Completion date: 2003-01-08.
$143,624 with Navy for Maintenance, Repair or Alteration of Real Property -- Other Non-Building Facilities. Signed on 2003-06-24. Completion date: 2003-12-12.
$104,780 with Navy for Construction of Structures and Facilities -- Other Non-Building Facilities. Taking place in AZ. Signed on 2004-06-22. Completion date: 2005-01-10.
P A WILSON INC (1150 N 2ND ST; small business) : $640,818 in 14 contractsfrom 2004 to 2006
Contracts for Safety and Rescue Equipment, Electric Portable and Hand Lighting Equipment by Defense Logistics Agency Signed by year:2000: $0; 2001: $0; 2002: $0; 2003: $0; 2004: $426,710; 2005: $137,916; 2006: $76,192.
Biggest contracts:
$91,213 with Defense Logistics Agency for Safety and Rescue Equipment. Signed on 2004-07-09. Completion date: 2004-08-09.
$78,896 with Defense Logistics Agency for Electric Portable and Hand Lighting Equipment. Signed on 2004-03-28. Completion date: 2004-04-27.
$73,680 with Defense Logistics Agency for Safety and Rescue Equipment. Signed on 2006-01-18. Completion date: 2006-02-18.
$69,914, same as above.Signed on 2004-06-01. Completion date: 2004-06-30.
LONESTAR DEVELOPMENT CORP (1014 BROADWAY STE B; small business) : $494,397 in 7 contractsfrom 2004 to 2006
Contracts for Installation of Equipment -- Miscellaneous, Prefabricated and Portable Buildings by Army Signed by year:2000: $0; 2001: $0; 2002: $0; 2003: $0; 2004: $13,567; 2005: $473,830; 2006: $7,000.
Biggest contracts:
$289,930 with Army for Installation of Equipment -- Miscellaneous. Taking place in HI. Signed on 2005-10-07. Completion date: 2005-12-14.
$89,864, same as above.Signed on 2005-12-21. Completion date: 2005-12-14.
$67,221, same as above.Signed on 2005-07-30. Completion date: 2005-08-15.
$20,215, same as above.Signed on 2005-10-20. Completion date: 2005-12-14.
C W MCGRATH INC (13080 OLD HIGHWAY 80; small business) : $227,360 in 3 contractsin 2005
$131,800 with Navy for Mineral Construction Materials, Bulk. Signed on 2005-07-21. Completion date: 2005-07-25.
$86,720, same as above.Signed on 2005-04-21. Completion date: 2005-04-28.
$8,840, same as above.Signed on 2005-05-17. Completion date: 2005-04-28.
LEWIS, LUCILLE (320 SHADEY LN 27; small business) : $177,760 in 2 contractsfrom 2001 to 2002
$170,000 with Public Buildings Service for Quality Control Services -- Construction, Mining, Excavating, and Highway Maintenance Equipment. Signed on 2001-10-15. Completion date: 2001-11-15.
$7,760 with Navy for Maintenance, Repair or Alteration of Real Property -- Other Administrative Facilities and Service Buildings. Signed on 2002-09-12. Completion date: 2002-10-12.
PACIFIC REFRIGERATION INC (1440 BROADWAY; small business) : $93,406 in 6 contractsfrom 2004 to 2005
Contracts for Technical Representation Services -- Refrigeration, Air Conditioning, and Air Circulating Equipment, Maintenance, Repair or Alteration of Real Property -- Hospitals and Infirmaries, Refrigeration Equipment, Refrigeration and Air Conditioning Components by Department of Veterans Affairs, Navy Signed by year:2000: $0; 2001: $0; 2002: $0; 2003: $0; 2004: $43,888; 2005: $49,518; 2006: $0.
Biggest contracts:
$43,888 with Department of Veterans Affairs for Technical Representation Services -- Refrigeration, Air Conditioning, and Air Circulating Equipment. Signed on 2004-04-20. Completion date: 2004-05-11.
$35,238 with Department of Veterans Affairs for Maintenance, Repair or Alteration of Real Property -- Hospitals and Infirmaries. Signed on 2005-01-12. Completion date: 2005-03-16.
$6,220 with Navy for Refrigeration Equipment. Signed on 2005-01-12. Completion date: 2005-02-10.
$4,740 with Navy for Refrigeration and Air Conditioning Components. Signed on 2005-02-02. Completion date: 2005-03-23.
Top industries in this zip code by the number of employees in 2005:
2005 - 2018 National Fire Incident Reporting System (NFIRS) incidents
According to the data from the years 2005 - 2018 the average number of fires per year is 83. The highest number of reported fire incidents - 178 took place in 2013, and the least - 11 in 2011. The data has an increasing trend.
When looking into fire subcategories, the most reports belonged to: Outside Fires (44.6%), and Structure Fires (31.4%).
Fire incident types reported to NFIRS in Zip Code 92021


 Nearest zip codes: 92019, 92040, 92020, 92071, 91978, 91935.


 . Federal Facility
 According to the data from the years 2005 - 2018 the average number of fires per year is 83. The highest number of reported fire incidents - 178 took place in 2013, and the least - 11 in 2011. The data has an increasing trend.
 When looking into fire subcategories, the most reports belonged to: Outside Fires (44.6%), and Structure Fires (31.4%).