Estimated zip code population in 2022: 45,524 Zip code population in 2010: 41,281 Zip code population in 2000: 42,267
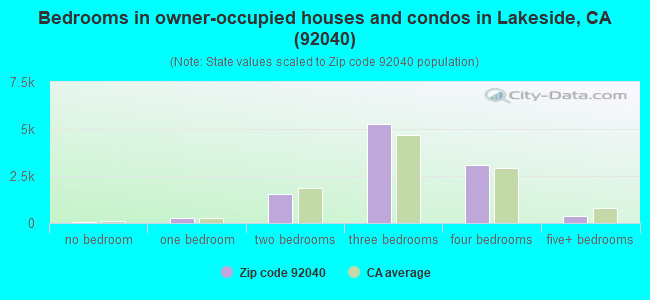
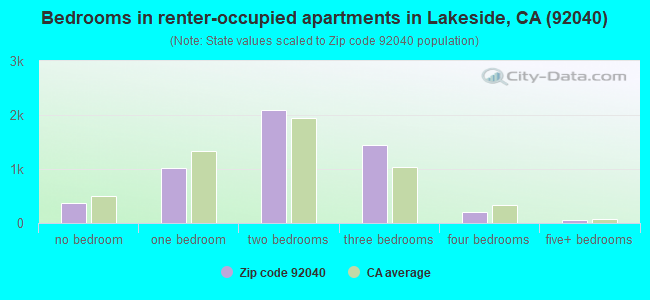
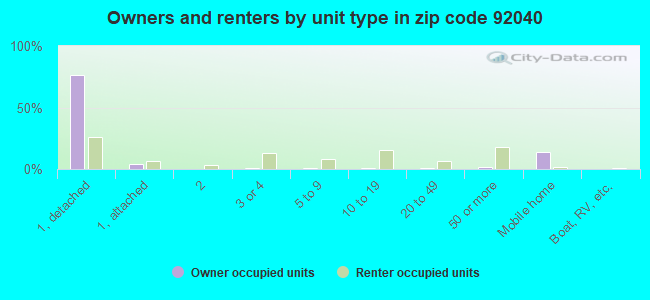
Houses and condos: 16,590 Renter-occupied apartments: 5,197
% of renters here:
33%
State:
44%
March 2022 cost of living index in zip code 92040: 120.7 (high, U.S. average is 100)
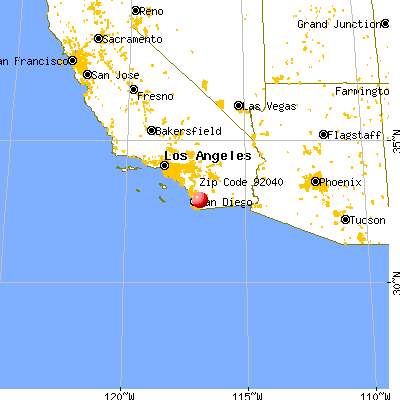
Land area: 64.2 sq. mi. Water area: 2.5 sq. mi.
Population density: 709 people per square mile
(low).
OSM Map
General Map
Google Map
MSN Map
OSM Map
General Map
Google Map
MSN Map
OSM Map
General Map
Google Map
MSN Map
OSM Map
General Map
Google Map
MSN Map
Please wait while loading the map...
Real estate property taxes paid for housing units in 2022:
This zip code:
0.6% ($4,315)
California:
0.7% ($4,831)
Median real estate property taxes paid for housing units with mortgages in 2022: $5,202 (0.7%) Median real estate property taxes paid for housing units with no mortgage in 2022: $3,170 (0.6%)
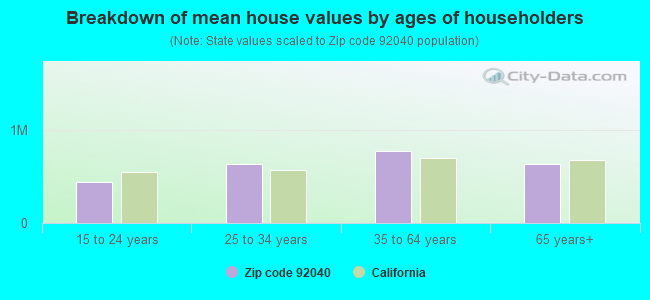
Estimated median house/condo value in 2022: $666,168
92040:
$666,168
California:
$715,900
According to our research of California and other state lists, there were 58 registered sex offenders living in 92040 zip code as of April 27, 2024. The ratio of all residents to sex offenders in zip code 92040 is 755 to 1. The ratio of registered sex offenders to all residents in this zip code is near the state average.
Median resident age:
This zip code:
39.8 years
California median age:
37.9 years
Average household size:
This zip code:
2.9 people
California:
2.8 people
Averages for the 2020 tax year for zip code 92040, filed in 2021:
Average Adjusted Gross Income (AGI) in 2020: $70,941 (Individual Income Tax Returns)
Here:
$70,941
State:
$95,910
Salary/wage: $61,251 (reported on 80.5% of returns)
Here:
$61,251
State:
$77,331
(% of AGI for various income ranges: 1140.3% for AGIs below $25k, 3718.4% for AGIs $25k-50k, 6766.8% for AGIs $50k-75k, 9738.9% for AGIs $75k-100k, 17652.8% for AGIs $100k-200k, 57095.7% for AGIs over 200k)
Taxable interest for individuals: $1,010 (reported on 35.7% of returns)
This zip code:
$1,010
California:
$2,294
(% of AGI for various income ranges: 11.6% for AGIs below $25k, 17.1% for AGIs $25k-50k, 31.1% for AGIs $50k-75k, 45.5% for AGIs $75k-100k, 67.3% for AGIs $100k-200k, 1242.7% for AGIs over 200k)
Ordinary dividends: $2,766 (reported on 15.2% of returns)
Here:
$2,766
State:
$10,949
(% of AGI for various income ranges: 21.8% for AGIs below $25k, 27.8% for AGIs $25k-50k, 41.3% for AGIs $50k-75k, 73.2% for AGIs $75k-100k, 139.5% for AGIs $100k-200k, 633.3% for AGIs over 200k)
Net capital gain/loss in AGI: +$12,757 (reported on 13.6% of returns)
Here:
+$12,757
State:
+$49,306
(% of AGI for various income ranges: 10.9% for AGIs below $25k, 16.5% for AGIs $25k-50k, 43.1% for AGIs $50k-75k, 81.9% for AGIs $75k-100k, 355.1% for AGIs $100k-200k, 8654.0% for AGIs over 200k)
Profit/loss from business: +$9,110 (reported on 14.5% of returns)
Here:
+$9,110
State:
+$15,671
(% of AGI for various income ranges: 115.4% for AGIs below $25k, 120.4% for AGIs $25k-50k, 187.8% for AGIs $50k-75k, 275.7% for AGIs $75k-100k, 301.4% for AGIs $100k-200k, 1338.3% for AGIs over 200k)
Taxable individual retirement arrangement distribution: $17,412 (reported on 7.4% of returns)
92040:
$17,412
California:
$23,505
(% of AGI for various income ranges: 50.3% for AGIs below $25k, 79.1% for AGIs $25k-50k, 145.6% for AGIs $50k-75k, 286.8% for AGIs $75k-100k, 377.8% for AGIs $100k-200k, 2118.0% for AGIs over 200k)
Self-employed (Keogh) retirement plans: $13,500 (reported on 0.3% of returns)
92040:
$13,500
California:
$30,163
(% of AGI for various income ranges: 35.8% for AGIs $100k-200k)
Total itemized deductions: $32,832 (reported on 16.2% of returns)
Here:
$32,832
State:
$39,517
(% of AGI for various income ranges: 85.2% for AGIs below $25k, 172.2% for AGIs $25k-50k, 538.9% for AGIs $50k-75k, 1013.4% for AGIs $75k-100k, 2140.4% for AGIs $100k-200k, 9541.0% for AGIs over 200k)
Charity contributions: $5,697 (reported on 12.7% of returns)
Here:
$5,697
State:
$12,598
(% of AGI for various income ranges: 3.7% for AGIs below $25k, 18.1% for AGIs $25k-50k, 46.8% for AGIs $50k-75k, 116.4% for AGIs $75k-100k, 299.3% for AGIs $100k-200k, 1719.3% for AGIs over 200k)
Taxes paid: $8,486 (reported on 16.1% of returns)
92040:
$8,486
State:
$8,807
(% of AGI for various income ranges: 16.8% for AGIs below $25k, 34.1% for AGIs $25k-50k, 146.4% for AGIs $50k-75k, 300.8% for AGIs $75k-100k, 646.3% for AGIs $100k-200k, 1669.3% for AGIs over 200k)
Earned income credit: $1,943 (reported on 13.2% of returns)
Here:
$1,943
State:
$2,074
(% of AGI for various income ranges: 73.2% for AGIs below $25k, 65.9% for AGIs $25k-50k, 1.6% for AGIs $50k-75k)
Percentage of individuals using paid preparers for their 2020 taxes: 93.7%
Here:
94%
State:
92%
(% for various income ranges: 91.9% for AGIs below $25k, 93.9% for AGIs $25k-50k, 94.5% for AGIs $50k-75k, 94.2% for AGIs $75k-100k, 94.5% for AGIs $100k-200k, 95.6% for AGIs over 200k)
Averages for the 2012 tax year for zip code 92040, filed in 2013:
Average Adjusted Gross Income (AGI) in 2012: $56,678 (Individual Income Tax Returns)
Here:
$56,678
State:
$72,726
Salary/wage: $49,057 (reported on 82.8% of returns)
Here:
$49,057
State:
$59,079
(% of AGI for various income ranges: 72.4% for AGIs below $25k, 79.7% for AGIs $25k-50k, 74.8% for AGIs $50k-75k, 77.0% for AGIs $75k-100k, 74.7% for AGIs $100k-200k, 42.7% for AGIs over 200k)
Taxable interest for individuals: $815 (reported on 35.6% of returns)
This zip code:
$815
California:
$2,146
(% of AGI for various income ranges: 0.9% for AGIs below $25k, 0.4% for AGIs $25k-50k, 0.6% for AGIs $50k-75k, 0.4% for AGIs $75k-100k, 0.4% for AGIs $100k-200k, 0.8% for AGIs over 200k)
Ordinary dividends: $2,357 (reported on 14.4% of returns)
Here:
$2,357
State:
$9,308
(% of AGI for various income ranges: 1.1% for AGIs below $25k, 0.4% for AGIs $25k-50k, 0.8% for AGIs $50k-75k, 0.7% for AGIs $75k-100k, 0.5% for AGIs $100k-200k, 0.5% for AGIs over 200k)
Net capital gain/loss in AGI: +$5,960 (reported on 11.2% of returns)
Here:
+$5,960
State:
+$30,460
(% of AGI for various income ranges: 0.5% for AGIs $75k-100k, 0.7% for AGIs $100k-200k, 7.2% for AGIs over 200k)
Profit/loss from business: +$11,225 (reported on 14.0% of returns)
Here:
+$11,225
State:
+$17,064
(% of AGI for various income ranges: 8.1% for AGIs below $25k, 3.4% for AGIs $25k-50k, 2.5% for AGIs $50k-75k, 2.6% for AGIs $75k-100k, 1.5% for AGIs $100k-200k, 2.7% for AGIs over 200k)
Taxable individual retirement arrangement distribution: $13,866 (reported on 8.2% of returns)
92040:
$13,866
California:
$19,557
(% of AGI for various income ranges: 2.3% for AGIs below $25k, 2.2% for AGIs $25k-50k, 2.1% for AGIs $50k-75k, 2.2% for AGIs $75k-100k, 1.7% for AGIs $100k-200k, 2.1% for AGIs over 200k)
Self-employment retirement plans: $11,233 (reported on 0.3% of returns)
92040:
$11,233
California:
$24,530
Total itemized deductions: $25,404 (26% of AGI, reported on 35.5% of returns)
Here:
$25,404
State:
$34,004
Here:
25.8% of AGI
State:
22.7% of AGI
(% of AGI for various income ranges: 10.2% for AGIs below $25k, 10.5% for AGIs $25k-50k, 15.1% for AGIs $50k-75k, 18.0% for AGIs $75k-100k, 18.8% for AGIs $100k-200k, 17.5% for AGIs over 200k)
Charity contributions: $2,816 (reported on 29.2% of returns)
Here:
$2,816
State:
$4,659
(% of AGI for various income ranges: 0.6% for AGIs below $25k, 0.9% for AGIs $25k-50k, 1.4% for AGIs $50k-75k, 1.7% for AGIs $75k-100k, 1.9% for AGIs $100k-200k, 1.3% for AGIs over 200k)
Taxes paid: $8,208 (reported on 35.4% of returns)
92040:
$8,208
State:
$14,448
(% of AGI for various income ranges: 1.9% for AGIs below $25k, 2.2% for AGIs $25k-50k, 4.0% for AGIs $50k-75k, 5.6% for AGIs $75k-100k, 6.7% for AGIs $100k-200k, 7.6% for AGIs over 200k)
Earned income credit: $2,110 (reported on 17.3% of returns)
Here:
$2,110
State:
$2,286
(% of AGI for various income ranges: 5.7% for AGIs below $25k, 1.2% for AGIs $25k-50k)
Percentage of individuals using paid preparers for their 2012 taxes: 56.3%
Here:
56%
State:
64%
(% for various income ranges: 49.2% for AGIs below $25k, 52.4% for AGIs $25k-50k, 60.1% for AGIs $50k-75k, 63.6% for AGIs $75k-100k, 68.3% for AGIs $100k-200k, 80.0% for AGIs over 200k)
Averages for the 2004 tax year for zip code 92040, filed in 2005:
Average Adjusted Gross Income (AGI) in 2004: $48,481 (Individual Income Tax Returns)
Here:
$48,481
State:
$58,600
Salary/wage: $43,669 (reported on 84.4% of returns)
Here:
$43,669
State:
$49,455
(% of AGI for various income ranges: 263.6% for AGIs below $10k, 75.4% for AGIs $10k-25k, 81.3% for AGIs $25k-50k, 81.7% for AGIs $50k-75k, 84.9% for AGIs $75k-100k, 62.4% for AGIs over 100k)
Taxable interest for individuals: $976 (reported on 46.6% of returns)
This zip code:
$976
California:
$2,365
(% of AGI for various income ranges: 11.5% for AGIs below $10k, 1.8% for AGIs $10k-25k, 1.0% for AGIs $25k-50k, 0.7% for AGIs $50k-75k, 0.6% for AGIs $75k-100k, 0.8% for AGIs over 100k)
Taxable dividends: $1,589 (reported on 18.5% of returns)
Here:
$1,589
State:
$4,746
(% of AGI for various income ranges: 7.2% for AGIs below $10k, 1.0% for AGIs $10k-25k, 0.7% for AGIs $25k-50k, 0.6% for AGIs $50k-75k, 0.4% for AGIs $75k-100k, 0.5% for AGIs over 100k)
Net capital gain/loss: +$7,551 (reported on 14.9% of returns)
Here:
+$7,551
State:
+$23,418
(% of AGI for various income ranges: -3.6% for AGIs below $10k, 0.2% for AGIs $10k-25k, 0.4% for AGIs $25k-50k, 0.7% for AGIs $50k-75k, 1.4% for AGIs $75k-100k, 5.4% for AGIs over 100k)
Profit/loss from business: +$11,370 (reported on 14.8% of returns)
Here:
+$11,370
State:
+$16,826
(% of AGI for various income ranges: 7.6% for AGIs below $10k, 6.1% for AGIs $10k-25k, 3.8% for AGIs $25k-50k, 3.6% for AGIs $50k-75k, 2.7% for AGIs $75k-100k, 2.9% for AGIs over 100k)
IRA payment deduction: $3,106 (reported on 2.7% of returns)
92040:
$3,106
California:
$3,192
(% of AGI for various income ranges: 0.7% for AGIs below $10k, 0.2% for AGIs $10k-25k, 0.2% for AGIs $25k-50k, 0.2% for AGIs $50k-75k, 0.2% for AGIs $75k-100k, 0.1% for AGIs over 100k)
Self-employed pension: $9,946 (reported on 0.6% of returns)
Here:
$9,946
California:
$17,688
(% of AGI for various income ranges: 0.6% for AGIs below $10k, 0.1% for AGIs $25k-50k, 0.1% for AGIs $50k-75k, 0.1% for AGIs $75k-100k, 0.2% for AGIs over 100k)
Total itemized deductions: $22,969 (29% of AGI, reported on 40.0% of returns)
Here:
$22,969
State:
$28,113
Here:
28.6% of AGI
State:
25.3% of AGI
(% of AGI for various income ranges: 44.1% for AGIs below $10k, 10.9% for AGIs $10k-25k, 15.6% for AGIs $25k-50k, 20.9% for AGIs $50k-75k, 23.2% for AGIs $75k-100k, 19.0% for AGIs over 100k)
Charity contributions deductions: $2,934 (4% of AGI, reported on 35.1% of returns)
Here:
$2,934
State:
$3,923
Here:
3.5% of AGI
State:
3.3% of AGI
(% of AGI for various income ranges: 2.2% for AGIs below $10k, 0.9% for AGIs $10k-25k, 1.5% for AGIs $25k-50k, 2.0% for AGIs $50k-75k, 2.4% for AGIs $75k-100k, 2.7% for AGIs over 100k)
Total tax: $6,365 (reported on 79.8% of returns)
92040:
$6,365
State:
$10,761
(% of AGI for various income ranges: 9.0% for AGIs below $10k, 4.7% for AGIs $10k-25k, 7.0% for AGIs $25k-50k, 8.3% for AGIs $50k-75k, 9.2% for AGIs $75k-100k, 15.8% for AGIs over 100k)
Earned income credit: $1,535 (reported on 11.8% of returns)
Here:
$1,535
State:
$1,763
Percentage of individuals using paid preparers for their 2004 taxes: 61.2%
Here:
61%
State:
66%
(% for various income ranges: 47.8% for AGIs below $10k, 58.9% for AGIs $10k-25k, 59.7% for AGIs $25k-50k, 67.0% for AGIs $50k-75k, 69.5% for AGIs $75k-100k, 73.6% for AGIs over 100k)
Likely homosexual households (counted as self-reported same-sex unmarried-partner households)
Lesbian couples: 0.0% of all households
Gay men: 0.2% of all households
Household received Food Stamps/SNAP in the past 12 months: 1,987 Household did not receive Food Stamps/SNAP in the past 12 months: 13,787
Women who had a birth in the past 12 months: 606 (537 now married, 66 unmarried) Women who did not have a birth in the past 12 months: 9,752 (4,484 now married, 5,242 unmarried)
Housing units in zip code 92040 with a mortgage: 7,159 (706 second mortgage, 9 home equity loan, 567 both second mortgage and home equity loan) Houses without a mortgage: 20
Median monthly owner costs for units with a mortgage: $2,762 Median monthly owner costs for units without a mortgage: $820
Residents with income below the poverty level in 2022:
This zip code:
7.6%
Whole state:
12.2%
Residents with income below 50% of the poverty level in 2022:
This zip code:
3.7%
Whole state:
6.2%
Median number of rooms in houses and condos:
Here:
6.0
State:
6.0
Median number of rooms in apartments:
Here:
4.1
State:
3.9
Notable locations in this zip code not listed on our city pages
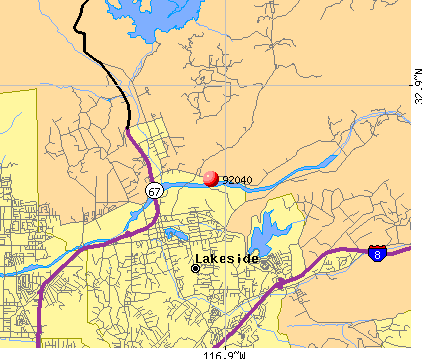
Notable locations in zip code 92040: El Monte County Park Picnic Site (A), Grable Ranch (B), Featherstone Ranch (C), Maniscalcos Cactus Farm (D), El Monte Park (E), Los Coches Monument (F), Lakeside Community Center (G), Helix Water District Filtration Plant (H), Lakeside Boys and Girls Club (I), Lakeside Golf Course (J), Home for Guiding Hands (K), Lakeside Branch San Diego County Library (L), Lakeside Historical Society (M), Lakeside Chamber of Commerce (N), Barona Fire Protection District Station 27 (O), Lakeside Fire Protection District Station 2 (P), Lakeside Fire Protection District Station 1 (Q), Lakeside Branch Library San Diego County Public Library (R). Display/hide their locations on the map
Shopping Centers: Rocky Home Plaza Shopping Center (1), River Shopping Center (2), Lakeside Village Shopping Center (3). Display/hide their locations on the map
Churches in zip code 92040 include: Lakeside Community Presbyterian Church (A), Lakeside Community Church of the Nazarene (B), Lakeside Christian Church (C), Islamic Center of Lakeside (D), Hosanna Christian Fellowship Church (E), Wesleyan Church of Lakeside (F), Tekakwitcha Church (G), Our Lady of Perpetual Help Catholic Church (H), Morning Star Lutheran Church (I). Display/hide their locations on the map
Parks in zip code 92040 include: Lake Jennings Park (1), Lindo Lake Park (2), Lakeside County Park (3), Louis A Stelzer County Park (4), Oak Oasis County Park (5), River View Park (6), Cactus County Park (7). Display/hide their locations on the map
5,990 married couples with children.
2,450 single-parent households (293 men, 2,157 women).
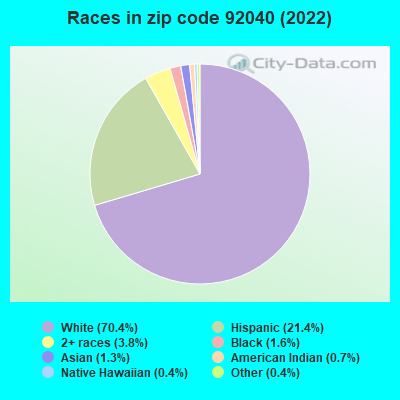
85.8% of residents of 92040 zip code speak English at home.
10.6% of residents speak Spanish at home (72% very well, 12% well, 16% not well).
0.9% of residents speak other Indo-European language at home (30% very well, 40% well, 16% not well, 14% not at all).
1.1% of residents speak Asian or Pacific Island language at home (70% very well, 20% well, 9% not well).
1.3% of residents speak other language at home (86% very well, 8% well, 5% not well, 1% not at all).
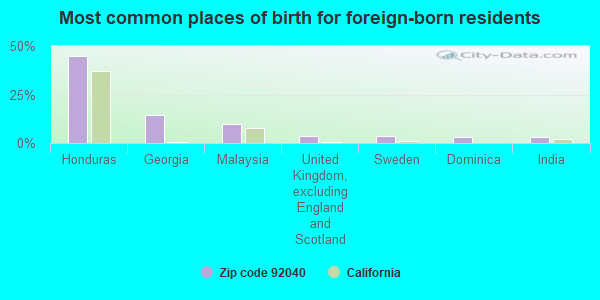
Foreign born population: 3,178 (7.0%) (64.6% of them are naturalized citizens)
This zip code:
7.0%
Whole state:
26.7%
45%Honduras
14%Georgia
10%Malaysia
4%United Kingdom, excluding England and Scotland
4%Sweden
3%Dominica
3%India
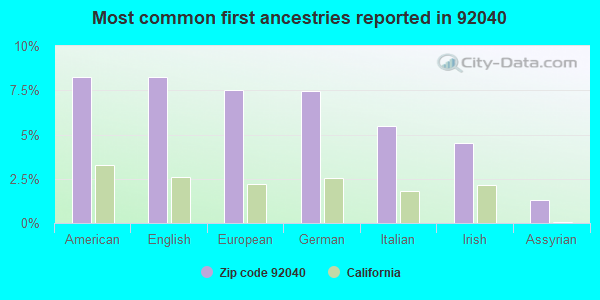
8%American
8%English
7%European
7%German
5%Italian
5%Irish
1%Assyrian
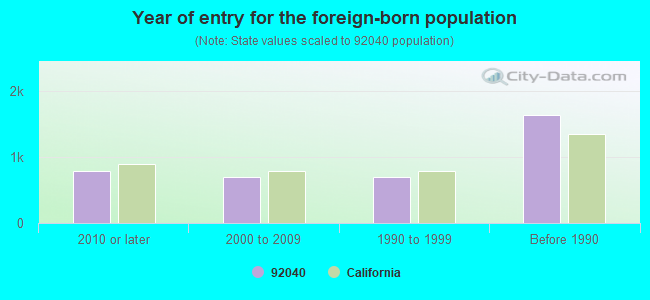
Year of entry for the foreign-born population
7842010 or later
6922000 to 2009
6931990 to 1999
1,631Before 1990
Major facilities with environmental interests located in this zip code:
LAKESIDE UNSD WINTER GARDENS SCHOOL (8501 PUEBLO RD in LAKESIDE, CA)
(Geographic Names Information System) STATE MASTER (California - Hazardous Waste Tracking) - HAZARDOU WASTE PROGRAM (National Center for Education Statistics) - STATE ID-6038392 Small Quantity Generators, between 100 kg and 1000 kg of hazardous waste/month (Resource Conservation and Recovery Act (tracking hazardous waste)) - notification Organizations: LAKESIDE UNION SCHOOL (CONTACT/OWNER)
, LAKESIDE UNION ELEMENTARY (SCHOOL DISTRICT)
Alternative names: WINTER GARDENS ELEMENTARY, WINTER GARDENS ELEMENTARY SCHOOL
LAKESIDE UNSD LINDO PARK SCH (12824 LAKESHORE DR in LAKESIDE, CA)
STATE MASTER (California - Hazardous Waste Tracking) - HAZARDOU WASTE PROGRAM (Resource Conservation and Recovery Act (tracking hazardous waste)) Organizations: LAKESIDE UNION (CONTACT/OWNER)
ANDERSON DRILLING (10273 CHANNEL RD in LAKESIDE, CA)
STATE MASTER (California - Hazardous Waste Tracking) - HAZARDOU WASTE PROGRAM Small Quantity Generators, between 100 kg and 1000 kg of hazardous waste/month (Resource Conservation and Recovery Act (tracking hazardous waste)) - notification Organizations: STANLEY J ANDERSON (CONTACT/OWNER)
Alternative names: ANDERSON MANUFACTURING
STATE MASTER (California - Hazardous Waste Tracking) - HAZARDOU WASTE PROGRAM Small Quantity Generators, between 100 kg and 1000 kg of hazardous waste/month (Resource Conservation and Recovery Act (tracking hazardous waste)) - notification Organizations: LAKE SIDE UNION SCH DT (CONTACT/OWNER)
HELIX WATER DIST TREATMENT PLT (9550 LAKE JENNING PARK RD in LAKESIDE, CA)
STATE MASTER (California - Hazardous Waste Tracking) - HAZARDOU WASTE PROGRAM Small Quantity Generators, between 100 kg and 1000 kg of hazardous waste/month (Resource Conservation and Recovery Act (tracking hazardous waste)) - notification Organizations: HELIX WATER DISTRICT (CONTACT/OWNER)
LAKESIDE UNSD EUCALYPTUS HILLS SCH (11838 VALLE VISTA RD in LAKESIDE, CA)
STATE MASTER (California - Hazardous Waste Tracking) - HAZARDOU WASTE PROGRAM Small Quantity Generators, between 100 kg and 1000 kg of hazardous waste/month (Resource Conservation and Recovery Act (tracking hazardous waste)) - notification Organizations: LAKESIDE UNION SCH DT (CONTACT/OWNER)
LAKESIDE UNION SD LAKEVIEW SCHOOL (9205 LAKEVIEW RD in LAKESIDE, CA)
STATE MASTER (California - Hazardous Waste Tracking) - HAZARDOU WASTE PROGRAM Small Quantity Generators, between 100 kg and 1000 kg of hazardous waste/month (Resource Conservation and Recovery Act (tracking hazardous waste)) - notification Organizations: LAKESIDE UNION SCH DT (CONTACT/OWNER)
LAKESIDE UNION SD (11833 WOODSIDE AVE in LAKESIDE, CA)
STATE MASTER (California - Hazardous Waste Tracking) - HAZARDOU WASTE PROGRAM Small Quantity Generators, between 100 kg and 1000 kg of hazardous waste/month (Resource Conservation and Recovery Act (tracking hazardous waste)) - notification
LAKESIDE UN SCH DT TIERRA SOL MIDDLE SCH (9611 PETITE LN in LAKESIDE, CA)
STATE MASTER (California - Hazardous Waste Tracking) - HAZARDOU WASTE PROGRAM Small Quantity Generators, between 100 kg and 1000 kg of hazardous waste/month (Resource Conservation and Recovery Act (tracking hazardous waste)) - notification Organizations: LAKESIDE UNION SD (CONTACT/OWNER)
Alternative names: TIERRA DEL SOL MIDDLE
CHEVRON STATION NO 94273 (12402 WOODSIDE AVE in LAKESIDE, CA)
STATE MASTER (California - Hazardous Waste Tracking) - HAZARDOU WASTE PROGRAM CRITERIA AND HAZARDOUS AIR POLLUTANT INVENTORY (Inventory of air pollution sources) Small Quantity Generators, between 100 kg and 1000 kg of hazardous waste/month (Resource Conservation and Recovery Act (tracking hazardous waste)) - notification Business SIC classification: GASOLINE SERVICE STATIONS Organizations: CHEVRON PRODUCTS CO (CONTACT/OWNER)
LAKESIDE UNSD RIVERVIEW SCHOOL (9308 WINTER GARDENS BLVD in LAKESIDE, CA)
STATE MASTER (California - Hazardous Waste Tracking) - HAZARDOU WASTE PROGRAM Small Quantity Generators, between 100 kg and 1000 kg of hazardous waste/month (Resource Conservation and Recovery Act (tracking hazardous waste)) - notification Organizations: LAKESIDE UNION SD (CONTACT/OWNER)
HAWTHORNE RENT IT SERVICE (12329 MAPLEVIEW ST in LAKESIDE, CA)
STATE MASTER (California - Hazardous Waste Tracking) - HAZARDOU WASTE PROGRAM Small Quantity Generators, between 100 kg and 1000 kg of hazardous waste/month (Resource Conservation and Recovery Act (tracking hazardous waste)) - notification Business NAICS classification: CONSTRUCTION, MINING, AND FORESTRY MACHINERY AND EQUIPMENT RENTAL AND LEASING. Organizations: HAWTHORNE MACHINERY (CONTACT/OWNER)
LAKESIDE UNION SCHOOL DISTRICT (12335 WOODSIDE AVE in LAKESIDE, CA)
STATE MASTER (California - Hazardous Waste Tracking) - HAZARDOU WASTE PROGRAM Small Quantity Generators, between 100 kg and 1000 kg of hazardous waste/month (Resource Conservation and Recovery Act (tracking hazardous waste))
Housing units lacking complete plumbing facilities: 0.7% Housing units lacking complete kitchen facilities: 1.1%
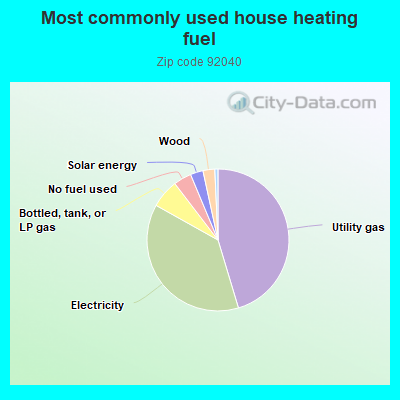
45.4%Utility gas
37.8%Electricity
6.5%Bottled, tank, or LP gas
4.1%No fuel used
2.9%Solar energy
2.7%Wood
0.7%Other fuel
Population in 1990: 41,054. Population change in the 1990s: +1,213 (+3.0%).
Place of birth for U.S.-born residents:
This state: 31,556
Northeast: 2,073
Midwest: 3,681
South: 2,675
West: 1,528
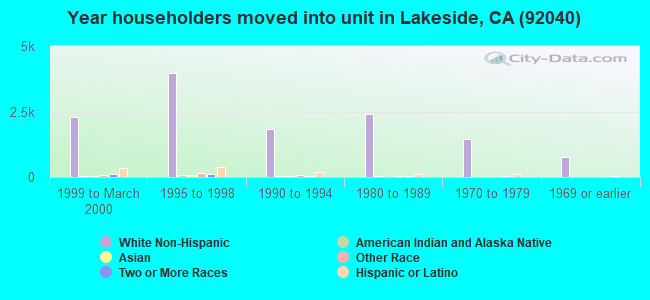
53% of the 92040 zip code residents lived in the same house 5 years ago. Out of people who lived in different houses, 78% lived in this county. Out of people who lived in different counties, 50% lived in California.
92% of the 92040 zip code residents lived in the same house 1 year ago. Out of people who lived in different houses, 80% moved from this county. Out of people who lived in different houses, 3% moved from different county within same state. Out of people who lived in different houses, 13% moved from different state. Out of people who lived in different houses, 3% moved from abroad.
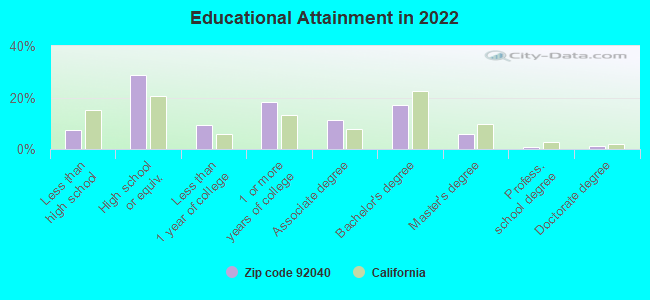
Private vs. public school enrollment:
Students in private schools in grades 1 to 8 (elementary and middle school): 229
Here:
5.9%
California:
10.5%
Students in private schools in grades 9 to 12 (high school): 248
Here:
8.8%
California:
8.5%
Students in private undergraduate colleges: 348
Here:
17.6%
California:
15.9%
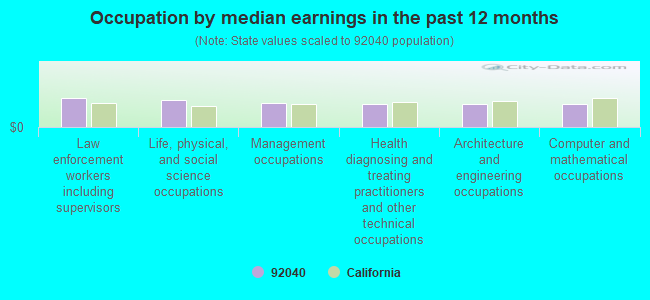
Occupation by median earnings in the past 12 months ($)
107,252Law enforcement workers including supervisors
100,184Life, physical, and social science occupations
88,270Management occupations
85,751Health diagnosing and treating practitioners and other technical occupations
85,480Architecture and engineering occupations
83,209Computer and mathematical occupations
Companies with biggest federal contracts located in this zip code (LAKESIDE, CA):
ADAMO CONSTRUCTION, INC (11980 WOODSIDE AVE, SUITE; small business) : $1,024,435 in 16 contractsfrom 2001 to 2004
Contracts for Maintenance, Repair or Alteration of Real Property -- Office Buildings by Air Force Signed by year:2000: $0; 2001: $116,504; 2002: $310,432; 2003: $421,767; 2004: $175,732; 2005: $0; 2006: $0.
Biggest contracts:
$229,988 with Air Force for Maintenance, Repair or Alteration of Real Property -- Office Buildings. Signed on 2003-09-29. Completion date: 2003-04-30.
$160,246, same as above.Signed on 2002-09-20. Completion date: 2003-04-30.
$105,372, same as above.Signed on 2004-02-12. Completion date: 2004-04-30.
$100,790, same as above.Signed on 2003-04-28. Completion date: 2003-04-30.
M A S S H (8946 CREEKFORD DR; small business) : $538,049 in 58 contractsfrom 2002 to 2006
Contracts for Meat, Poultry, and Fish, Coffee, Tea, and Cocoa, Special Dietary Foods and Food Specialty Preparations, Sugar, Confectionery, and Nuts, and moreby Navy, Army Signed by year:2000: $0; 2001: $0; 2002: $38,334; 2003: $39,417; 2004: $97,323; 2005: $138,901; 2006: $224,074.
Biggest contracts:
$76,930 with Navy for Meat, Poultry, and Fish. Signed on 2006-04-03. Completion date: 2006-04-03.
$24,818, same as above.Signed on 2004-10-14. Completion date: 2004-10-22.
$23,858, same as above.Signed on 2004-11-17. Completion date: 2004-12-03.
$22,830, same as above.Signed on 2005-06-24. Completion date: 2005-07-11.
JB YOUNG & ASSOCIATES, LTD (11440 RIVERSIDE DRIVE; small business) : $403,849 in 35 contractsfrom 1999 to 2003
Contracts for Highways, Roads, Streets, Bridges, and Railways, Other Architect and Engineering Services by Navy Signed by year:2000: $247,667; 2001: $11,934; 2002: $3,776; 2003: $19,702; 2004: $0; 2005: $0; 2006: $0.
Biggest contracts:
$84,048 with Navy for Highways, Roads, Streets, Bridges, and Railways. Signed on 1999-12-28. Completion date: 2000-05-01.
$75,011, same as above.Signed on 2000-02-09. Completion date: 1999-12-14.
$39,039 with Navy for Other Architect and Engineering Services. Signed on 2000-02-09. Completion date: 1998-09-25.
$26,995 with Navy for Highways, Roads, Streets, Bridges, and Railways. Signed on 2000-03-14. Completion date: 1999-12-30.
BAY CITY ELECTRIC WORKS, INC (12208 INDUSTRY RD; small business) : $396,183 in 28 contractsfrom 2001 to 2006
Contracts for Generators and Generators Sets, Electrical, Lease or Rental of Equipment -- Electric Wire, and Power and Distribution Equipment, Non-nuclear Ship Repair (West) Ship repair (including overhauls and conversions) performed on. non-nuclear propelled and nonpropelled ships west of the 108th meridian, Electric Portable and Hand Lighting Equipment, and moreby Navy, Bureau of Reclamation, U.S. Customs Service Signed by year:2000: $0; 2001: $28,100; 2002: $0; 2003: $0; 2004: $146,517; 2005: $145,560; 2006: $76,006.
Biggest contracts:
$69,898 with Navy for Generators and Generators Sets, Electrical. Signed on 2004-01-05. Completion date: 2004-03-31.
$36,000 with Navy for Lease or Rental of Equipment -- Electric Wire, and Power and Distribution Equipment. Signed on 2006-02-22. Completion date: 2005-05-31.
$36,000, same as above.Signed on 2005-06-16. Completion date: 2005-05-31.
$35,250, same as above.Signed on 2004-11-24. Completion date: 2005-05-31.
WEST COAST AIR CONDITIONING CO (12365 MAPLEVIEW ST)
$263,109 with Navy for Maintenance, Repair or Alteration of Real Property -- Other Administrative Facilities and Service Buildings. Signed on 2002-09-28. Completion date: 2002-12-31.
ATLAS PORTABLE SERVICES, INC (12740 VIGILANTE ROAD; small business) : $156,081 in 13 contractsfrom 2000 to 2002
Contracts for Trash/Garbage Collection Services - Including Portable Sanitation Services, Miscellaneous Items, Maintenance, Repair or Alteration of Real Property -- Miscellaneous Buildings by Navy Signed by year:2000: $71,700; 2001: $83,901; 2002: $480; 2003: $0; 2004: $0; 2005: $0; 2006: $0.
Biggest contracts:
$59,107 with Navy for Trash/Garbage Collection Services - Including Portable Sanitation Services. Signed on 2001-09-01. Completion date: 2002-08-31.
$52,800 with Navy for Miscellaneous Items. Signed on 2000-08-16. Completion date: 2005-08-31.
$19,734 with Navy for Maintenance, Repair or Alteration of Real Property -- Miscellaneous Buildings. Signed on 2001-06-28. Completion date: 2001-06-30.
$17,940, same as above.Signed on 2000-06-26. Completion date: 2001-06-30.
BAXTER BLASTING CO (12485 HIGHWAY 67 NORTH; small business) : $99,475 in 2 contractsin 2006
$69,475 with Army for Well Drilling/Exploratory Services. Signed on 2006-02-10. Completion date: 2006-02-13.
$30,000, same as above.Signed on 2006-03-16. Completion date: 2006-02-13.
HI PERFORMANCE MACHINE & METAL (11976 WOODSIDE AVE; small business) : $73,376 in 15 contractsfrom 2004 to 2006
Contracts for Iron and Steel Primary and Semifinished Products, Metal Finishing Equipment, Structural Shapes, Nonferrous Base Metal, Bars and Rods, and moreby Navy Signed by year:2000: $0; 2001: $0; 2002: $0; 2003: $0; 2004: $48,446; 2005: $16,045; 2006: $8,885.
Biggest contracts:
$8,536 with Navy for Iron and Steel Primary and Semifinished Products. Signed on 2004-11-02. Completion date: 2004-11-02.
$7,857, same as above.Signed on 2004-12-15. Completion date: 2004-12-15.
$7,460, same as above.Signed on 2004-11-09. Completion date: 2004-11-09.
$7,350 with Navy for Metal Finishing Equipment. Signed on 2005-01-12. Completion date: 2005-01-25.
CABLE MECHANICAL, INC (12414 LAUREL STREET; small business) : $67,634 in 6 contractsfrom 2002 to 2004
Contracts for Air Conditioning Equipment, Miscellaneous Engine Accessories, Nonaircraft, Specialized Shipping and Storage Containers, Maintenance, Repair and Rebuilding of Equipment -- Miscellaneous by Navy Signed by year:2000: $0; 2001: $0; 2002: $38,734; 2003: $25,900; 2004: $3,000; 2005: $0; 2006: $0.
Biggest contracts:
$38,734 with Navy for Air Conditioning Equipment. Signed on 2002-02-27. Completion date: 2002-04-10.
$11,600 with Navy for Miscellaneous Engine Accessories, Nonaircraft. Signed on 2003-08-19. Completion date: 2003-10-02.
$11,300 with Navy for Specialized Shipping and Storage Containers. Signed on 2003-09-08. Completion date: 2003-10-10.
$3,000 with Navy for Maintenance, Repair and Rebuilding of Equipment -- Miscellaneous. Signed on 2004-09-30. Completion date: 2004-09-30.
WELDON TRANSPORT INC (9502 PALOMINO RIDGE DRIVE; small business) : $61,000 in 2 contractsin 2004
$47,000 with Navy for Earth Moving and Excavating Equipment. Signed on 2004-06-02. Completion date: 2004-06-18.
$14,000, same as above.Signed on 2004-11-24. Completion date: 2004-06-18.
Top industries in this zip code by the number of employees in 2005:
2005 - 2018 National Fire Incident Reporting System (NFIRS) incidents
According to the data from the years 2005 - 2018 the average number of fires per year is 53. The highest number of reported fire incidents - 120 took place in 2017, and the least - 7 in 2010. The data has an increasing trend.
When looking into fire subcategories, the most reports belonged to: Outside Fires (47.6%), and Structure Fires (33.2%).
Fire incident types reported to NFIRS in Zip Code 92040


 Nearest zip codes: 92021, 92071, 92145, 92019, 92020, 92064.


 According to the data from the years 2005 - 2018 the average number of fires per year is 53. The highest number of reported fire incidents - 120 took place in 2017, and the least - 7 in 2010. The data has an increasing trend.
 When looking into fire subcategories, the most reports belonged to: Outside Fires (47.6%), and Structure Fires (33.2%).