Estimated zip code population in 2022: 45,555 Zip code population in 2010: 42,598 Zip code population in 2000: 40,981
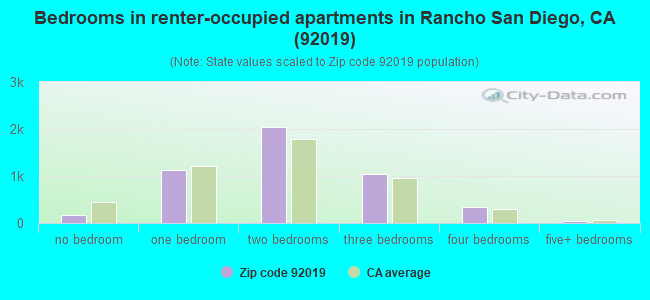
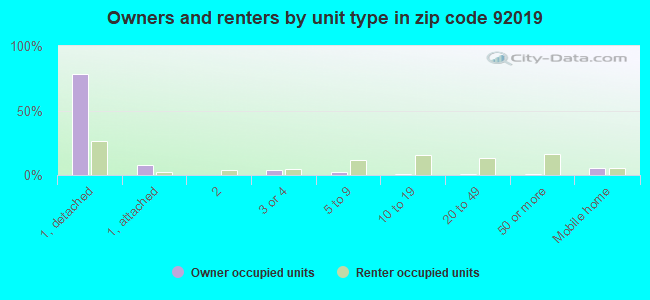
Houses and condos: 16,152 Renter-occupied apartments: 4,774
% of renters here:
31%
State:
44%
March 2022 cost of living index in zip code 92019: 122.3 (high, U.S. average is 100)
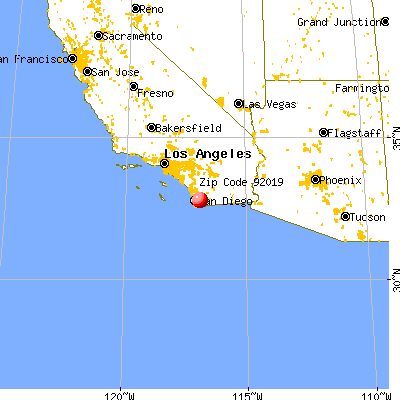
Land area: 26.8 sq. mi. Water area: 0.9 sq. mi.
Population density: 1,697 people per square mile
(low).
OSM Map
General Map
Google Map
MSN Map
OSM Map
General Map
Google Map
MSN Map
OSM Map
General Map
Google Map
MSN Map
OSM Map
General Map
Google Map
MSN Map
Please wait while loading the map...
Real estate property taxes paid for housing units in 2022:
This zip code:
0.7% ($4,838)
California:
0.7% ($4,831)
Median real estate property taxes paid for housing units with mortgages in 2022: $5,219 (0.7%) Median real estate property taxes paid for housing units with no mortgage in 2022: $3,846 (0.6%)
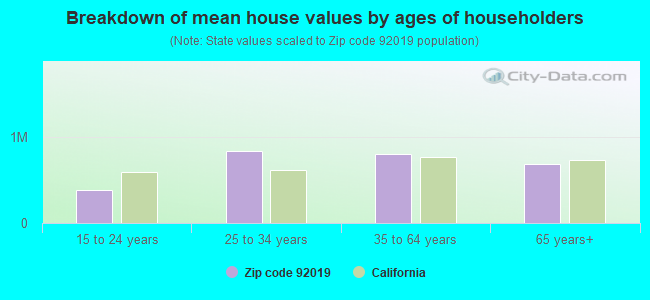
Estimated median house/condo value in 2022: $733,382
92019:
$733,382
California:
$715,900
According to our research of California and other state lists, there were 43 registered sex offenders living in 92019 zip code as of April 27, 2024. The ratio of all residents to sex offenders in zip code 92019 is 1,019 to 1. The ratio of registered sex offenders to all residents in this zip code is lower than the state average.
Median resident age:
This zip code:
39.9 years
California median age:
37.9 years
Average household size:
This zip code:
2.9 people
California:
2.8 people
Averages for the 2020 tax year for zip code 92019, filed in 2021:
Average Adjusted Gross Income (AGI) in 2020: $81,336 (Individual Income Tax Returns)
Here:
$81,336
State:
$95,910
Salary/wage: $61,902 (reported on 78.7% of returns)
Here:
$61,902
State:
$77,331
(% of AGI for various income ranges: 1212.9% for AGIs below $25k, 3651.6% for AGIs $25k-50k, 7065.4% for AGIs $50k-75k, 9674.4% for AGIs $75k-100k, 18442.5% for AGIs $100k-200k, 75841.7% for AGIs over 200k)
Taxable interest for individuals: $1,412 (reported on 37.4% of returns)
This zip code:
$1,412
California:
$2,294
(% of AGI for various income ranges: 12.0% for AGIs below $25k, 18.9% for AGIs $25k-50k, 49.2% for AGIs $50k-75k, 69.0% for AGIs $75k-100k, 164.3% for AGIs $100k-200k, 1475.6% for AGIs over 200k)
Ordinary dividends: $6,848 (reported on 17.6% of returns)
Here:
$6,848
State:
$10,949
(% of AGI for various income ranges: 26.4% for AGIs below $25k, 44.7% for AGIs $25k-50k, 92.3% for AGIs $50k-75k, 154.5% for AGIs $75k-100k, 306.9% for AGIs $100k-200k, 3817.8% for AGIs over 200k)
Net capital gain/loss in AGI: +$24,985 (reported on 18.2% of returns)
Here:
+$24,985
State:
+$49,306
(% of AGI for various income ranges: 8.4% for AGIs below $25k, 26.9% for AGIs $25k-50k, 75.5% for AGIs $50k-75k, 157.2% for AGIs $75k-100k, 656.0% for AGIs $100k-200k, 22191.7% for AGIs over 200k)
Profit/loss from business: +$13,067 (reported on 17.1% of returns)
Here:
+$13,067
State:
+$15,671
(% of AGI for various income ranges: 100.5% for AGIs below $25k, 154.0% for AGIs $25k-50k, 273.6% for AGIs $50k-75k, 337.8% for AGIs $75k-100k, 636.2% for AGIs $100k-200k, 4790.6% for AGIs over 200k)
Taxable individual retirement arrangement distribution: $21,876 (reported on 8.1% of returns)
92019:
$21,876
California:
$23,505
(% of AGI for various income ranges: 40.0% for AGIs below $25k, 75.2% for AGIs $25k-50k, 228.8% for AGIs $50k-75k, 361.9% for AGIs $75k-100k, 832.2% for AGIs $100k-200k, 2624.4% for AGIs over 200k)
Self-employed (Keogh) retirement plans: $24,956 (reported on 0.4% of returns)
92019:
$24,956
California:
$30,163
(% of AGI for various income ranges: 40.1% for AGIs $100k-200k, 422.5% for AGIs over 200k)
Total itemized deductions: $40,208 (reported on 19.3% of returns)
Here:
$40,208
State:
$39,517
(% of AGI for various income ranges: 96.7% for AGIs below $25k, 240.8% for AGIs $25k-50k, 796.7% for AGIs $50k-75k, 1357.5% for AGIs $75k-100k, 2838.8% for AGIs $100k-200k, 19067.5% for AGIs over 200k)
Charity contributions: $12,863 (reported on 15.8% of returns)
Here:
$12,863
State:
$12,598
(% of AGI for various income ranges: 4.5% for AGIs below $25k, 26.8% for AGIs $25k-50k, 83.2% for AGIs $50k-75k, 159.8% for AGIs $75k-100k, 421.7% for AGIs $100k-200k, 8583.1% for AGIs over 200k)
Taxes paid: $8,656 (reported on 19.2% of returns)
92019:
$8,656
State:
$8,807
(% of AGI for various income ranges: 17.9% for AGIs below $25k, 53.6% for AGIs $25k-50k, 206.6% for AGIs $50k-75k, 399.6% for AGIs $75k-100k, 821.0% for AGIs $100k-200k, 2476.9% for AGIs over 200k)
Earned income credit: $2,370 (reported on 14.6% of returns)
Here:
$2,370
State:
$2,074
(% of AGI for various income ranges: 108.6% for AGIs below $25k, 81.0% for AGIs $25k-50k, 2.2% for AGIs $50k-75k)
Percentage of individuals using paid preparers for their 2020 taxes: 94.0%
Here:
94%
State:
92%
(% for various income ranges: 93.5% for AGIs below $25k, 94.5% for AGIs $25k-50k, 94.2% for AGIs $50k-75k, 94.0% for AGIs $75k-100k, 94.0% for AGIs $100k-200k, 93.9% for AGIs over 200k)
Averages for the 2012 tax year for zip code 92019, filed in 2013:
Average Adjusted Gross Income (AGI) in 2012: $68,909 (Individual Income Tax Returns)
Here:
$68,909
State:
$72,726
Salary/wage: $54,413 (reported on 80.8% of returns)
Here:
$54,413
State:
$59,079
(% of AGI for various income ranges: 73.2% for AGIs below $25k, 75.3% for AGIs $25k-50k, 72.9% for AGIs $50k-75k, 71.1% for AGIs $75k-100k, 70.2% for AGIs $100k-200k, 42.0% for AGIs over 200k)
Taxable interest for individuals: $1,542 (reported on 40.8% of returns)
This zip code:
$1,542
California:
$2,146
(% of AGI for various income ranges: 1.1% for AGIs below $25k, 0.6% for AGIs $25k-50k, 0.8% for AGIs $50k-75k, 0.8% for AGIs $75k-100k, 0.8% for AGIs $100k-200k, 1.2% for AGIs over 200k)
Ordinary dividends: $5,721 (reported on 19.4% of returns)
Here:
$5,721
State:
$9,308
(% of AGI for various income ranges: 1.6% for AGIs below $25k, 1.0% for AGIs $25k-50k, 1.3% for AGIs $50k-75k, 1.2% for AGIs $75k-100k, 1.4% for AGIs $100k-200k, 2.5% for AGIs over 200k)
Net capital gain/loss in AGI: +$8,042 (reported on 16.9% of returns)
Here:
+$8,042
State:
+$30,460
(% of AGI for various income ranges: 0.3% for AGIs $25k-50k, 0.5% for AGIs $50k-75k, 0.6% for AGIs $75k-100k, 1.2% for AGIs $100k-200k, 5.4% for AGIs over 200k)
Profit/loss from business: +$16,728 (reported on 16.8% of returns)
Here:
+$16,728
State:
+$17,064
(% of AGI for various income ranges: 9.1% for AGIs below $25k, 5.1% for AGIs $25k-50k, 3.4% for AGIs $50k-75k, 3.3% for AGIs $75k-100k, 3.2% for AGIs $100k-200k, 4.2% for AGIs over 200k)
Taxable individual retirement arrangement distribution: $19,091 (reported on 9.1% of returns)
92019:
$19,091
California:
$19,557
(% of AGI for various income ranges: 2.1% for AGIs below $25k, 2.1% for AGIs $25k-50k, 2.9% for AGIs $50k-75k, 2.8% for AGIs $75k-100k, 2.8% for AGIs $100k-200k, 2.2% for AGIs over 200k)
Self-employment retirement plans: $17,492 (reported on 0.7% of returns)
92019:
$17,492
California:
$24,530
(% of AGI for various income ranges: 0.2% for AGIs below $25k, 0.1% for AGIs $75k-100k, 0.2% for AGIs $100k-200k, 0.4% for AGIs over 200k)
Total itemized deductions: $32,343 (27% of AGI, reported on 42.0% of returns)
Here:
$32,343
State:
$34,004
Here:
26.9% of AGI
State:
22.7% of AGI
(% of AGI for various income ranges: 12.0% for AGIs below $25k, 15.2% for AGIs $25k-50k, 18.0% for AGIs $50k-75k, 20.8% for AGIs $75k-100k, 21.4% for AGIs $100k-200k, 21.5% for AGIs over 200k)
Charity contributions: $3,979 (reported on 35.5% of returns)
Here:
$3,979
State:
$4,659
(% of AGI for various income ranges: 0.6% for AGIs below $25k, 1.2% for AGIs $25k-50k, 1.8% for AGIs $50k-75k, 2.0% for AGIs $75k-100k, 2.3% for AGIs $100k-200k, 2.5% for AGIs over 200k)
Taxes paid: $10,732 (reported on 41.7% of returns)
92019:
$10,732
State:
$14,448
(% of AGI for various income ranges: 2.2% for AGIs below $25k, 3.1% for AGIs $25k-50k, 4.7% for AGIs $50k-75k, 6.2% for AGIs $75k-100k, 7.6% for AGIs $100k-200k, 8.6% for AGIs over 200k)
Earned income credit: $2,179 (reported on 16.2% of returns)
Here:
$2,179
State:
$2,286
(% of AGI for various income ranges: 6.7% for AGIs below $25k, 0.9% for AGIs $25k-50k)
Percentage of individuals using paid preparers for their 2012 taxes: 62.7%
Here:
63%
State:
64%
(% for various income ranges: 57.6% for AGIs below $25k, 59.7% for AGIs $25k-50k, 64.5% for AGIs $50k-75k, 65.1% for AGIs $75k-100k, 69.4% for AGIs $100k-200k, 80.9% for AGIs over 200k)
Averages for the 2004 tax year for zip code 92019, filed in 2005:
Average Adjusted Gross Income (AGI) in 2004: $61,801 (Individual Income Tax Returns)
Here:
$61,801
State:
$58,600
Salary/wage: $50,172 (reported on 82.8% of returns)
Here:
$50,172
State:
$49,455
(% of AGI for various income ranges: 206.5% for AGIs below $10k, 74.4% for AGIs $10k-25k, 77.9% for AGIs $25k-50k, 76.9% for AGIs $50k-75k, 76.5% for AGIs $75k-100k, 56.8% for AGIs over 100k)
Taxable interest for individuals: $1,831 (reported on 52.9% of returns)
This zip code:
$1,831
California:
$2,365
(% of AGI for various income ranges: 12.2% for AGIs below $10k, 2.2% for AGIs $10k-25k, 1.5% for AGIs $25k-50k, 1.4% for AGIs $50k-75k, 1.1% for AGIs $75k-100k, 1.6% for AGIs over 100k)
Taxable dividends: $3,782 (reported on 24.6% of returns)
Here:
$3,782
State:
$4,746
(% of AGI for various income ranges: 6.6% for AGIs below $10k, 1.5% for AGIs $10k-25k, 1.1% for AGIs $25k-50k, 0.9% for AGIs $50k-75k, 1.0% for AGIs $75k-100k, 1.9% for AGIs over 100k)
Net capital gain/loss: +$23,662 (reported on 20.8% of returns)
Here:
+$23,662
State:
+$23,418
(% of AGI for various income ranges: -5.2% for AGIs below $10k, 0.6% for AGIs $10k-25k, 0.4% for AGIs $25k-50k, 0.6% for AGIs $50k-75k, 2.0% for AGIs $75k-100k, 14.6% for AGIs over 100k)
Profit/loss from business: +$19,119 (reported on 17.2% of returns)
Here:
+$19,119
State:
+$16,826
(% of AGI for various income ranges: 13.5% for AGIs below $10k, 7.9% for AGIs $10k-25k, 5.7% for AGIs $25k-50k, 5.8% for AGIs $50k-75k, 5.2% for AGIs $75k-100k, 4.8% for AGIs over 100k)
IRA payment deduction: $3,444 (reported on 3.1% of returns)
92019:
$3,444
California:
$3,192
(% of AGI for various income ranges: 0.7% for AGIs below $10k, 0.2% for AGIs $10k-25k, 0.2% for AGIs $25k-50k, 0.2% for AGIs $50k-75k, 0.2% for AGIs $75k-100k, 0.1% for AGIs over 100k)
Self-employed pension: $14,828 (reported on 1.5% of returns)
Here:
$14,828
California:
$17,688
(% of AGI for various income ranges: 0.1% for AGIs $10k-25k, 0.2% for AGIs $25k-50k, 0.2% for AGIs $50k-75k, 0.2% for AGIs $75k-100k, 0.5% for AGIs over 100k)
Total itemized deductions: $27,709 (26% of AGI, reported on 46.0% of returns)
Here:
$27,709
State:
$28,113
Here:
26.4% of AGI
State:
25.3% of AGI
(% of AGI for various income ranges: 40.5% for AGIs below $10k, 13.6% for AGIs $10k-25k, 19.1% for AGIs $25k-50k, 24.6% for AGIs $50k-75k, 25.8% for AGIs $75k-100k, 19.1% for AGIs over 100k)
Charity contributions deductions: $3,542 (3% of AGI, reported on 41.1% of returns)
Here:
$3,542
State:
$3,923
Here:
3.3% of AGI
State:
3.3% of AGI
(% of AGI for various income ranges: 1.8% for AGIs below $10k, 1.0% for AGIs $10k-25k, 1.8% for AGIs $25k-50k, 2.4% for AGIs $50k-75k, 2.8% for AGIs $75k-100k, 2.5% for AGIs over 100k)
Total tax: $9,797 (reported on 80.1% of returns)
92019:
$9,797
State:
$10,761
(% of AGI for various income ranges: 7.5% for AGIs below $10k, 4.9% for AGIs $10k-25k, 7.0% for AGIs $25k-50k, 8.4% for AGIs $50k-75k, 9.4% for AGIs $75k-100k, 17.2% for AGIs over 100k)
Earned income credit: $1,671 (reported on 10.4% of returns)
Here:
$1,671
State:
$1,763
Percentage of individuals using paid preparers for their 2004 taxes: 64.8%
Here:
65%
State:
66%
(% for various income ranges: 53.6% for AGIs below $10k, 61.9% for AGIs $10k-25k, 63.5% for AGIs $25k-50k, 68.5% for AGIs $50k-75k, 68.9% for AGIs $75k-100k, 76.5% for AGIs over 100k)
Likely homosexual households (counted as self-reported same-sex unmarried-partner households)
Lesbian couples: 0.0% of all households
Gay men: 0.2% of all households
Household received Food Stamps/SNAP in the past 12 months: 2,446 Household did not receive Food Stamps/SNAP in the past 12 months: 13,041
Women who had a birth in the past 12 months: 569 (517 now married, 49 unmarried) Women who did not have a birth in the past 12 months: 10,092 (4,131 now married, 5,955 unmarried)
Housing units in zip code 92019 with a mortgage: 7,440 (718 second mortgage, 15 home equity loan, 612 both second mortgage and home equity loan) Houses without a mortgage: 148
Median monthly owner costs for units with a mortgage: $2,799 Median monthly owner costs for units without a mortgage: $846
Residents with income below the poverty level in 2022:
This zip code:
9.3%
Whole state:
12.2%
Residents with income below 50% of the poverty level in 2022:
This zip code:
5.2%
Whole state:
6.2%
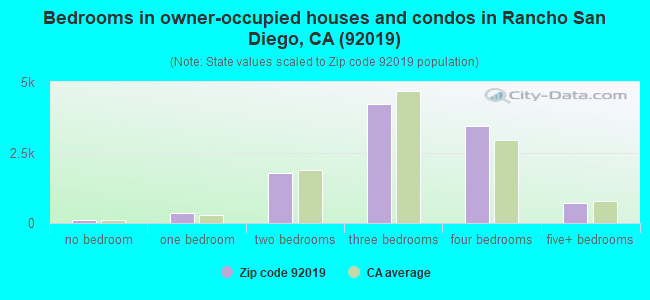
Median number of rooms in houses and condos:
Here:
6.3
State:
6.0
Median number of rooms in apartments:
Here:
4.2
State:
3.9
Notable locations in this zip code not listed on our city pages
Notable locations in zip code 92019: Monte Vista Ranch (A), Rancho San Diego Golf Course (B), Starr Park Ranch (C), Singing Hills Golf Course (D), Heritage of the Americas Musueum (E), Christian Heritage College Library (F), El Cajon Fire Department Station 8 (G), Sycuan Fire Department Station 1 (H), California Department of Forestry and Fire Protection Station 25 Dehesa (I), San Miguel Consolidated Fire Protection District Station 22 (J), San Miguel Consolidated Fire Protection District Station 23 (K), California Department of Forestry and Fire Protection Station 20 Monte Vista (L), California Department of Forestry and Fire Protection San Diego Unit Headquarters (M), Holy Trinity Youth Center (N), Chaldean Hall (O). Display/hide their locations on the map
Churches in zip code 92019 include: Saint Luke Church (A), Way of Life Church (B), Shadow Mountain Community Church (C), Rancho Hills Community Church of the Nazarene (D), Maranata Iglesia Cristiana (E), El Cajon Wesleyan Church (F), East Hills Christian Church (G), Community Covenant Church (H), Church of Saint Luke (I). Display/hide their locations on the map
Parks in zip code 92019 include: Old Ironsides County Park (1), John F Kennedy Park (2), Cottonwood One County Park (3), Cottonwood Two County Park (4), Damon Lane County Park (5), Cottonwood Three County Park (6), Steele Canyon County Park (7). Display/hide their locations on the map
7,708 married couples with children.
1,654 single-parent households (274 men, 1,380 women).
69.2% of residents of 92019 zip code speak English at home.
11.4% of residents speak Spanish at home (70% very well, 16% well, 11% not well, 3% not at all).
2.3% of residents speak other Indo-European language at home (77% very well, 16% well, 7% not well).
2.1% of residents speak Asian or Pacific Island language at home (63% very well, 29% well, 6% not well, 2% not at all).
15.6% of residents speak other language at home (58% very well, 21% well, 16% not well, 4% not at all).
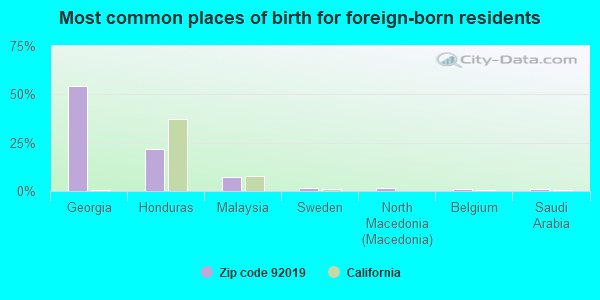
Foreign born population: 9,862 (21.6%) (78.6% of them are naturalized citizens)
This zip code:
21.6%
Whole state:
26.7%
54%Georgia
22%Honduras
7%Malaysia
1%Sweden
1%North Macedonia (Macedonia)
1%Belgium
1%Saudi Arabia
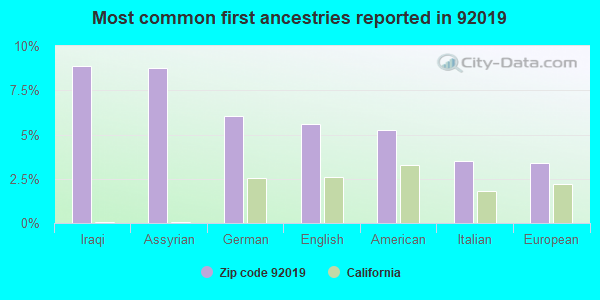
9%Iraqi
9%Assyrian
6%German
6%English
5%American
4%Italian
3%European
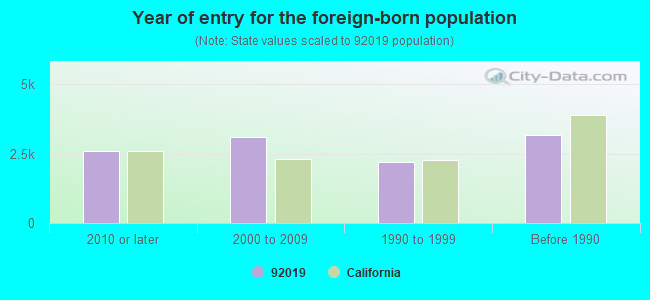
Year of entry for the foreign-born population
2,5752010 or later
3,1102000 to 2009
2,1971990 to 1999
3,149Before 1990
Major facilities with environmental interests located in this zip code:
MARTIN WOODWORKING (1903 FRIENDSHIP DRIVE in EL CAJON, CA)
STATE MASTER (California - Hazardous Waste Tracking) - HAZARDOU WASTE PROGRAM (Integrated Compliance Information System) - ICIS-09-1999-0190, FORMAL ENFORCEMENT ACTION CRITERIA AND HAZARDOUS AIR POLLUTANT INVENTORY (Inventory of air pollution sources) HAZARDOUS WASTE BIENNIAL REPORTER (Resource Conservation and Recovery Act (tracking hazardous waste)) Large Quantity Generators, more that 1000 kg of hazardous waste/month (Resource Conservation and Recovery Act (tracking hazardous waste)) Large Quantity Generators, more that 1000 kg of hazardous waste/month (Resource Conservation and Recovery Act (tracking hazardous waste)) TRI REPORTER (Tracking of toxic chemicals releasing facilities) Business SIC classification: WOOD OFFICE FURNITURE; SPECIAL INDUSTRY MACHINERY Business NAICS classification: ELECTROPLATING, PLATING, POLISHING, ANODIZING, AND COLORING. Organizations: OSCAR A MONTES (CONTACT/OPERATOR)
Alternative names: MARTIN FURNITURE, MONTES METAL FINISHING
ARCO #9572 (1484 EAST WASHINGTON AVENUE in EL CAJON, CA)
STATE MASTER (California - Hazardous Waste Tracking) - HAZARDOU WASTE PROGRAM CRITERIA AND HAZARDOUS AIR POLLUTANT INVENTORY (Inventory of air pollution sources) Small Quantity Generators, between 100 kg and 1000 kg of hazardous waste/month (Resource Conservation and Recovery Act (tracking hazardous waste)) - notification Business SIC classification: GASOLINE SERVICE STATIONS Organizations: B P WEST COAST PRODUCTS L L C (CONTACT/OWNER)
Alternative names: ARCO FACILITY NO 09572, BP WEST COAST PRODUCTS LLC 9572, PRESTIGE STATIONS INC NO 9572
GROSSMONT-CUYAMACA COMMUNITY COL DIST (900 RANCHO SAN DIEGO PKWY in EL CAJON, CA) . Federal Facility
STATE MASTER (California - Hazardous Waste Tracking) - HAZARDOU WASTE PROGRAM Small Quantity Generators, between 100 kg and 1000 kg of hazardous waste/month (Resource Conservation and Recovery Act (tracking hazardous waste)) - notification Organizations: CUYAMACA COM COL DIST (CONTACT/OWNER)
Alternative names: CUYAMACA COLLEGE
K MART NO 7497 (2398 JAMACHA in EL CAJON, CA)
STATE MASTER (California - Hazardous Waste Tracking) - HAZARDOU WASTE PROGRAM Small Quantity Generators, between 100 kg and 1000 kg of hazardous waste/month (Resource Conservation and Recovery Act (tracking hazardous waste)) - notification Organizations: K MART INTERNATIONAL HEADQUARTERS (CONTACT/OWNER)
Alternative names: KMART #7497
GRANITE HILLS HIGH (1719 E. MADISON AVE. in EL CAJON, CA)
(National Center for Education Statistics) - STATE ID-3732336 Organizations: GROSSMONT UNION HIGH (SCHOOL DISTRICT)
HILLSDALE MIDDLE (1301 BRABHAM ST. in EL CAJON, CA)
(National Center for Education Statistics) - STATE ID-6112890 Organizations: CAJON VALLEY UNION ELEMENTARY (SCHOOL DISTRICT)
JAMACHA ELEMENTARY (2962 JAMUL DR. in EL CAJON, CA)
(National Center for Education Statistics) - STATE ID-6110787 Organizations: CAJON VALLEY UNION ELEMENTARY (SCHOOL DISTRICT)
KETEMA / A & E DIV (790 GREENFIELD DR. in EL CAJON, CA)
(Integrated Compliance Information System) - ICIS-09-1996-0004, FORMAL ENFORCEMENT ACTION CRITERIA AND HAZARDOUS AIR POLLUTANT INVENTORY (Inventory of air pollution sources) Business SIC classification: ELECTROPLATING, PLATING, POLISHING, ANODIZING, AND COLORING
LEXINGTON ELEMENTARY (533 S. FIRST ST. in EL CAJON, CA)
(National Center for Education Statistics) - STATE ID-6037683 Organizations: CAJON VALLEY UNION ELEMENTARY (SCHOOL DISTRICT)
MADISON AVE. ELEMENTARY (1615 E. MADISON AVE. in EL CAJON, CA)
(National Center for Education Statistics) - STATE ID-6037691 Organizations: CAJON VALLEY UNION ELEMENTARY (SCHOOL DISTRICT)
MERIDIAN ELEMENTARY (651 S. THIRD ST. in EL CAJON, CA)
(National Center for Education Statistics) - STATE ID-6037717 Organizations: CAJON VALLEY UNION ELEMENTARY (SCHOOL DISTRICT)
MONTGOMERY MIDDLE (1570 MELODY LANE in EL CAJON, CA)
(National Center for Education Statistics) - STATE ID-6093207 Organizations: CAJON VALLEY UNION ELEMENTARY (SCHOOL DISTRICT)
IT CORP SAN DIEGO SVCS (1452 N. JOHNSON AVE in EL CAJON, CA)
TRANSPORTER (Resource Conservation and Recovery Act (tracking hazardous waste)) - notification Organizations: MICHAEL HOUSE (CONTACT/OWNER)
Housing units lacking complete plumbing facilities: 0.1% Housing units lacking complete kitchen facilities: 2.0%
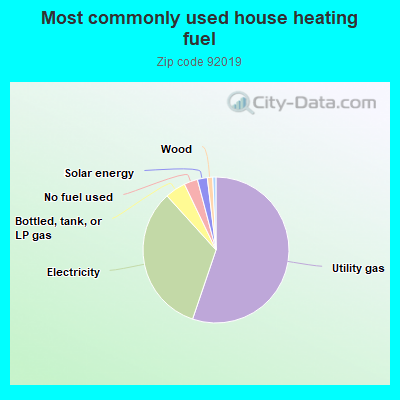
55.2%Utility gas
33.1%Electricity
4.6%Bottled, tank, or LP gas
3.0%No fuel used
2.2%Solar energy
1.2%Wood
0.7%Other fuel
Population in 1990: 35,425. Population change in the 1990s: +5,556 (+15.7%).
Place of birth for U.S.-born residents:
This state: 26,006
Northeast: 2,305
Midwest: 2,884
South: 1,775
West: 1,501
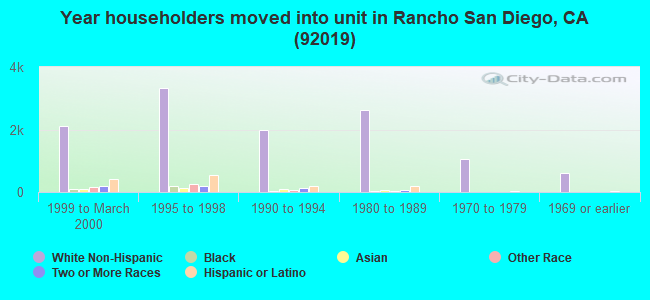
55% of the 92019 zip code residents lived in the same house 5 years ago. Out of people who lived in different houses, 78% lived in this county. Out of people who lived in different counties, 50% lived in California.
93% of the 92019 zip code residents lived in the same house 1 year ago. Out of people who lived in different houses, 82% moved from this county. Out of people who lived in different houses, 8% moved from different county within same state. Out of people who lived in different houses, 5% moved from different state. Out of people who lived in different houses, 5% moved from abroad.
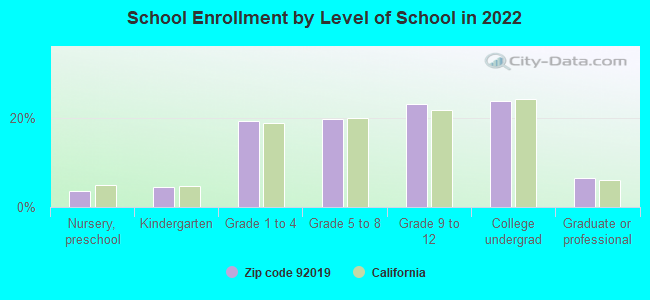
Private vs. public school enrollment:
Students in private schools in grades 1 to 8 (elementary and middle school): 935
Here:
20.2%
California:
10.5%
Students in private schools in grades 9 to 12 (high school): 325
Here:
12.0%
California:
8.5%
Students in private undergraduate colleges: 424
Here:
15.3%
California:
15.9%
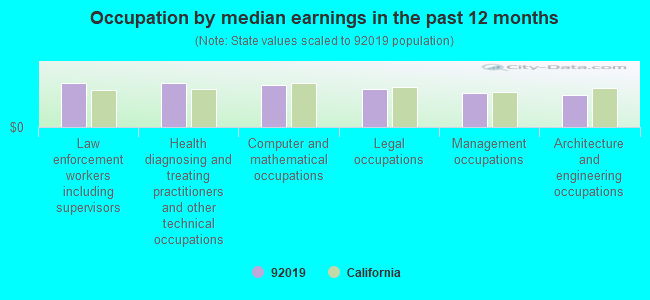
Occupation by median earnings in the past 12 months ($)
101,867Law enforcement workers including supervisors
101,698Health diagnosing and treating practitioners and other technical occupations
97,237Computer and mathematical occupations
87,721Legal occupations
77,835Management occupations
73,085Architecture and engineering occupations
Companies with biggest federal contracts located in this zip code (EL CAJON, CA):
HENRY R REDONDO (1814 E MADISON AVE; small business) : $22,179,731 in 74 contractsfrom 2000 to 2005
Contracts for Maintenance, Repair or Alteration of Real Property -- Other Utilities, Maintenance, Repair or Alteration of Real Property -- Other Non-Building Facilities, Maintenance, Repair or Alteration of Real Property -- Hospitals and Infirmaries, Maintenance, Repair or Alteration of Real Property -- EPG Facilities - Other, Including Transmission, and moreby Navy Signed by year:2000: $8,683; 2001: $4,045,093; 2002: $6,174,071; 2003: $11,499,545; 2004: $449,396; 2005: $2,943; 2006: $0.
Biggest contracts:
$4,921,295 with Navy for Maintenance, Repair or Alteration of Real Property -- Other Utilities. Signed on 2003-05-14. Completion date: 2004-06-10.
$4,823,000, same as above.Signed on 2003-08-08. Completion date: 2004-04-03.
$4,102,000, same as above.Signed on 2002-02-05. Completion date: 2002-07-15.
$2,872,131, same as above.Signed on 2001-12-03. Completion date: 2003-02-28.
MILPOWER (1303 HIDDEN PLATEAU CT; small business) : $3,321,253 in 18 contractsfrom 2000 to 2006
Contracts for Transformers: Distribution and Power Station, Miscellaneous Communication Equipment, ADPE System Configuration, Miscellaneous Electrical and Electronic Components, and moreby Air Force, Navy, Federal Technology Service Signed by year:2000: $1,522,000; 2001: $1,079,334; 2002: $48,000; 2003: $506,654; 2004: $61,263; 2005: $31,631; 2006: $72,371.
Biggest contracts:
$1,312,000 with Air Force for Transformers: Distribution and Power Station. Signed on 2000-11-24. Completion date: 2004-09-30.
$1,152,920, same as above.Signed on 2001-02-28. Completion date: 2001-10-01.
$399,412 with Navy for Miscellaneous Communication Equipment. Signed on 2003-02-12. Completion date: 2003-08-11.
$105,000 with Federal Technology Service for ADPE System Configuration. Signed on 2000-11-15. Completion date: 2000-12-15.
DMP SERVICES (2038 VISTA HERMOSA WAY; small business) : $1,357,198 in 10 contractsfrom 2003 to 2006
Contracts for Other Research and Development -- Operational Systems Development (R&D), Engineering -- Engineering Development (R&D), Engineering and Technical Services by Navy Signed by year:2000: $0; 2001: $0; 2002: $0; 2003: $322,664; 2004: $266,097; 2005: $698,556; 2006: $69,881.
Biggest contracts:
$335,874 with Navy for Other Research and Development -- Operational Systems Development (R&D). Signed on 2005-11-21. Completion date: 2006-09-30.
$222,664, same as above.Signed on 2003-12-30. Completion date: 2004-12-29.
$209,467, same as above.Signed on 2004-12-22. Completion date: 2005-09-30.
$111,958, same as above.Signed on 2005-09-27. Completion date: 2006-09-30.
DAINER,MICHAEL J,DO (14688 QUAIL HAVEN LANE; small business) : $933,537 in 6 contractsfrom 2001 to 2005
Contracts for Gynecology Services by Navy Signed by year:2000: $0; 2001: $199,999; 2002: $0; 2003: $0; 2004: $361,416; 2005: $372,122; 2006: $0.
Biggest contracts:
$372,122 with Navy for Gynecology Services. Signed on 2005-10-20. Completion date: 2005-09-30.
$361,416, same as above.Signed on 2004-10-22. Completion date: 2005-09-30.
$200,000, same as above.Signed on 2001-10-01. Completion date: 2002-09-30.
$0, same as above.Signed on 2004-10-22. Completion date: 2005-09-30.
DIGITAL CONNECTION INC (1886 VISTA DE LA MONTANA) : $184,232 in 11 contractsfrom 2003 to 2006
Contracts for ADP Components, Miscellaneous Communication Equipment, ADP Input/Output and Storage Devices, Electrical and Electronic assemblies, Boards, Cards, and Associated Hardware, and moreby Navy, Federal Technology Service Signed by year:2000: $0; 2001: $0; 2002: $0; 2003: $27,630; 2004: $133,927; 2005: $18,400; 2006: $4,275.
Biggest contracts:
$93,770 with Navy for ADP Components. Signed on 2004-11-16. Completion date: 2005-01-16.
$34,547, same as above.Signed on 2004-12-02. Completion date: 2005-02-02.
$9,600 with Navy for Miscellaneous Communication Equipment. Signed on 2004-10-07. Completion date: 2004-12-08.
$9,210 with Federal Technology Service for ADP Input/Output and Storage Devices. Signed on 2003-09-10. Completion date: 2003-11-15.
F H MC LAUGHLIN CO INC (2236 MONARCH RIDGE CIR) : $74,212 in 6 contractsfrom 2004 to 2006
Contracts for Building Components, Prefabricated, Non-nuclear Ship Repair (West) Ship repair (including overhauls and conversions) performed on. non-nuclear propelled and nonpropelled ships west of the 108th meridian, Airframe Structural Components by Navy Signed by year:2000: $0; 2001: $0; 2002: $0; 2003: $0; 2004: $6,536; 2005: $64,560; 2006: $3,116.
Biggest contracts:
$35,025 with Navy for Building Components, Prefabricated. Signed on 2005-03-22. Completion date: 2005-04-06.
$28,320 with Navy for Non-nuclear Ship Repair (West) Ship repair (including overhauls and conversions) performed on. non-nuclear propelled and nonpropelled ships west of the 108th meridian. Signed on 2005-08-26. Completion date: 2005-11-30.
$6,536, same as above.Signed on 2004-11-19. Completion date: 2004-12-23.
$3,116, same as above.Signed on 2006-02-10. Completion date: 2006-03-22.
THOMAS STONE (1325 GOLDEN HARVEST LN; small business)
$39,000 with Navy for Other Education and Training Services. Signed on 2005-12-30. Completion date: 2006-08-10.
WHARTON GENERAL CONTRACTORS (1347 DEHESA RANCH RD; small business) : $23,966 in 2 contractsin 2001
$23,318 with Navy for Maintenance, Repair or Alteration of Real Property -- Maintenance Buildings. Signed on 2001-09-17. Completion date: 2001-12-17.
$648, same as above.Signed on 2001-12-10. Completion date: 2001-12-17.
SAN DIEGO CHRISTIAN COLLEGE, I (2100 GREENFIELD DR) : $22,340 in 2 contractsin 2005
$14,840 with Air Force for Tuition, Registration, and Membership Fees. Signed on 2005-06-10. Completion date: 2005-09-30.
$7,500, same as above.Signed on 2005-10-19. Completion date: 2005-10-19.
INLAND WEST SYSTEMS, INC (5252 DEHESA ROAD; small business) : $14,075 in 2 contractsin 2000
$7,475 with Navy for Construction of Structures and Facilities -- Miscellaneous Buildings. Signed on 2000-03-30. Completion date: 2000-05-10.
$6,600 with Navy for Maintenance, Repair or Alteration of Real Property -- Miscellaneous Buildings. Signed on 2000-09-18. Completion date: 2000-10-30.
Top industries in this zip code by the number of employees in 2005:
2005 - 2018 National Fire Incident Reporting System (NFIRS) incidents
According to the data from the years 2005 - 2018 the average number of fires per year is 60. The highest number of reported fire incidents - 114 took place in 2006, and the least - 8 in 2012. The data has an increasing trend.
When looking into fire subcategories, the most reports belonged to: Outside Fires (42.6%), and Structure Fires (28.1%).
Fire incident types reported to NFIRS in Zip Code 92019


 Nearest zip codes: 92021, 91978, 92020, 91935, 91941, 91914.


 According to the data from the years 2005 - 2018 the average number of fires per year is 60. The highest number of reported fire incidents - 114 took place in 2006, and the least - 8 in 2012. The data has an increasing trend.
 When looking into fire subcategories, the most reports belonged to: Outside Fires (42.6%), and Structure Fires (28.1%).