Center City neighborhood in Salinas, California (CA), 93901 detailed profile
Settings
X


Business Search - 14 Million verified businesses
Area: 0.345 square miles
Population: 2,786
Population density:
| Center City: | 8,086 people per square mile |
| Salinas: | 8,472 people per square mile |

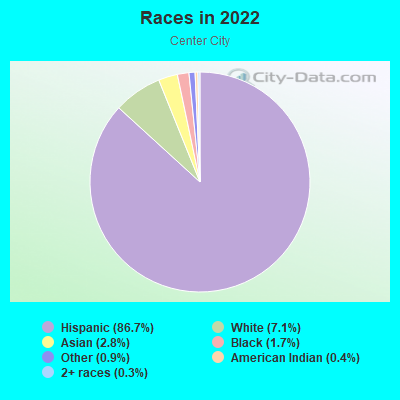
- 2,47986.7%Hispanic or Latino
- 2037.1%White
- 792.8%Asian
- 501.7%Black
- 260.9%Some other race
- 120.4%American Indian
- 100.3%Two or more races
- 10.03%Native Hawaiian and Other
Pacific Islander
Median household income in 2022:
| Center City: | $82,252 |
| Salinas: | $80,560 |
Distribution of median household income
![Distribution of median household income]()
- 62Less than $10,000
- 146$10,000 to $19,999
- 58$20,000 to $29,999
- 49$30,000 to $39,999
- 78$40,000 to $49,999
- 92$50,000 to $59,999
- 153$60,000 to $74,999
- 55$75,000 to $99,999
- 77$100,000 to $124,999
- 122$125,000 to $149,999
- 37$150,000 to $199,999
- 23$200,000 or more

Distribution of owner-occupied house/condo value
![Distribution of owner-occupied house/condo value]()
- 19Less than $50,000
- 42$150,000 to $199,999
- 55$250,000 to $299,999
- 40$300,000 to $399,999
- 23$400,000 to $499,999
- 31$500,000 to $749,999
- 282$750,000 to $999,999
- 35$1,000,000 or more

Distribution of rent paid by renters
![Distribution of rent paid by renters]()
- 63$200 to $299
- 79$300 to $399
- 80$400 to $499
- 78$500 to $599
- 33$600 to $699
- 36$700 to $799
- 84$800 to $899
- 9$900 to $999
- 49$1,000 to $1,249
- 107$1,250 to $1,499
- 160$1,500 to $1,999
- 344$2,000 or more

Median rent in 2022:
| Center City: | $1,621 |
| Salinas: | $1,713 |
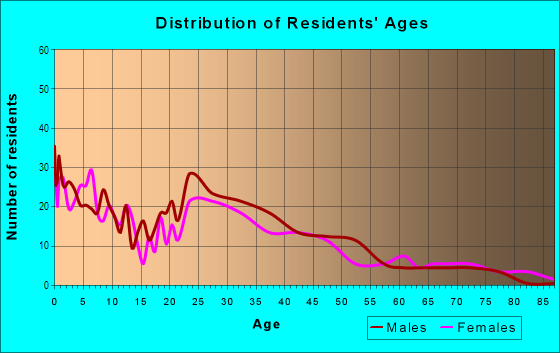
| Males: | 1,265 |
| Females: | 1,521 |
Males:
| This neighborhood: | 36.5 years |
| Whole city: | 33.7 years |
| This neighborhood: | 39.5 years |
| Whole city: | 33.8 years |
Average household size:
| Center City: | 2.8 people |
| Salinas: | 3.5 people |
Percentage of family households:
| Center City: | 59.0% |
| Salinas: | 58.3% |
| Here: | 29.5% |
| Salinas: | 48.7% |
Percentage of married-couple families with children (among all households):
| Center City: | 12.0% |
| Salinas: | 16.8% |
Percentage of single-mother households (among all households):
| Center City: | 16.9% |
| Salinas: | 8.2% |
Percentage of never married males 15 years old and over:
Percentage of never married females 15 years old and over:
| Center City: | 30.8% |
| Salinas: | 23.7% |
Percentage of never married females 15 years old and over:
| Center City: | 25.8% |
| city: | 20.8% |
Percentage of people that speak English not well or not at all:
| Center City: | 32.3% |
| Salinas: | 24.2% |
Percentage of people born in this state:
Percentage of people born in another U.S. state:
Percentage of native residents but born outside the U.S.:
Percentage of foreign born residents:
| Here: | 55.7% |
| Salinas: | 55.1% |
Percentage of people born in another U.S. state:
| Center City: | 4.4% |
| Salinas: | 5.9% |
Percentage of native residents but born outside the U.S.:
| Here: | 0.3% |
| city: | 1.3% |
Percentage of foreign born residents:
| Here: | 39.6% |
| Salinas: | 37.7% |
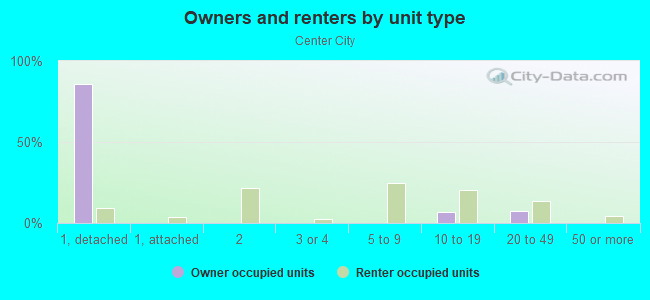
Owner-occupied
Renter-occupied

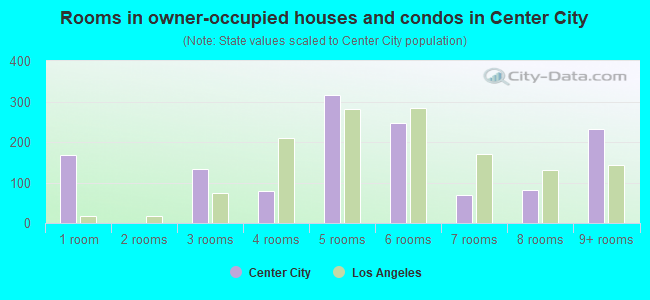
- Rooms in owner-occupied houses and condos in Center City
- 01 room
- 162 rooms
- 813 rooms
- 364 rooms
- 285 rooms
- 276 rooms
- 147 rooms
- 138 rooms
- 1779+ rooms
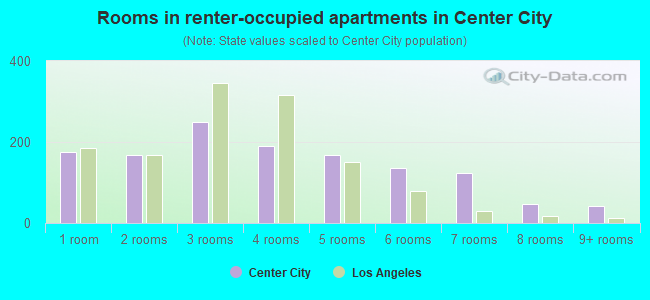
- Rooms in renter-occupied apartments in Center City
- 1091 room
- 1232 rooms
- 1393 rooms
- 2954 rooms
- 1295 rooms
- 776 rooms
- 127 rooms
- 138 rooms
- 109+ rooms
Owner-occupied
Renter-occupied
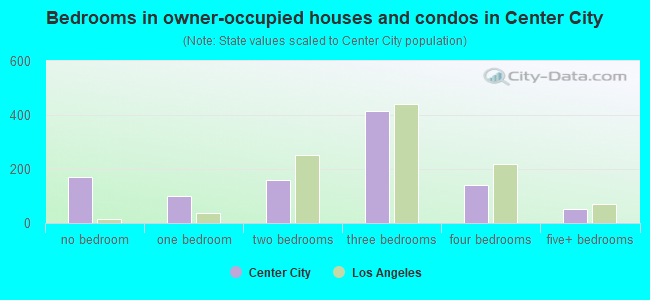
- Bedrooms in owner-occupied houses and condos in Center City
- 0no bedroom
- 631 bedroom
- 522 bedrooms
- 353 bedrooms
- 1214 bedrooms
- 1435+ bedrooms
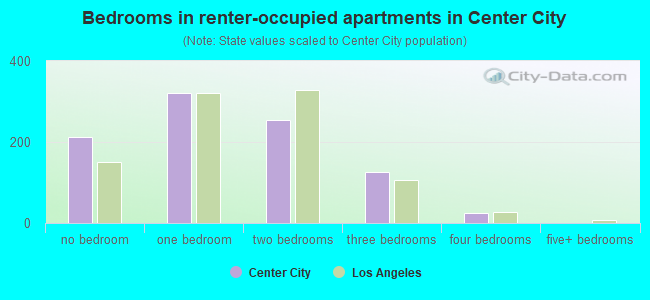
- Bedrooms in renter-occupied apartments in Center City
- 113no bedroom
- 1901 bedroom
- 2522 bedrooms
- 2363 bedrooms
- 564 bedrooms
- 105+ bedrooms
Average number of cars or other vehicles available in houses/condos:
Average number of cars or other vehicles available in apartments:
| This neighborhood: | 2.2 |
| Salinas: | 2.5 |
Average number of cars or other vehicles available in apartments:
| Here: | 1.8 |
| city: | 1.9 |
Percentage of units with a mortgage:
| Center City: | 70.0% |
| Salinas: | 61.3% |
Average estimated value of detached houses in 2022 (47.2% of all units):
| Center City: | $483,706 |
| California: | $988,808 |
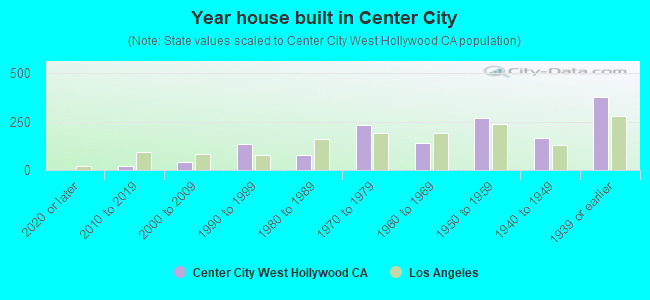
- Year house built in Center City
- 02020 or later
- 1442010 to 2019
- 1642000 to 2009
- 291990 to 1999
- 1701980 to 1989
- 741970 to 1979
- 1381960 to 1969
- 811950 to 1959
- 331940 to 1949
- 2701939 or earlier
City-data.com crime index for city in 2020 (higher means more crime):
| City: | 289.6 |
| U.S. average: | 219.5 |
Travel time to work (commute)
![Travel time to work (commute)]()
- 15Less than 5 minutes
- 655 to 9 minutes
- 19410 to 14 minutes
- 19515 to 19 minutes
- 42620 to 24 minutes
- 1125 to 29 minutes
- 23930 to 34 minutes
- 2835 to 39 minutes
- 2340 to 44 minutes
- 1545 to 59 minutes
- 2260 to 89 minutes
- 18890 or more minutes

Means of transportation to work
![Means of transportation to work]()
- 39.6%435Drove a car alone
- 34.2%376Carpooled
- 9.6%105Bus
- 1.3%14Bicycle
- 0.9%10Walked
- 28.7%315Other means
- 4.8%53Worked at home

Time leaving home to go to work
![Time leaving home to go to work]()
- 11312:00 a.m. to 4:59 a.m.
- 985:00 a.m. to 5:29 a.m.
- 3605:30 a.m. to 5:59 a.m.
- 2066:00 a.m. to 6:29 a.m.
- 1226:30 a.m. to 6:59 a.m.
- 2187:00 a.m. to 7:29 a.m.
- 1037:30 a.m. to 7:59 a.m.
- 448:00 a.m. to 8:29 a.m.
- 588:30 a.m. to 8:59 a.m.
- 549:00 a.m. to 9:59 a.m.
- 5710:00 a.m. to 10:59 a.m.
- 1511:00 a.m. to 11:59 a.m.
- 3012:00 p.m. to 3:59 p.m.
- 94:00 p.m. to 11:59 p.m.

Occupations of males:
- Percentage of males in management occupations (except farmers):
Here: 17.9% city: 5.9%
- Percentage of males in arts, design, entertainment, sports, and media occupations:
Here: 2.8% city: 1.0%
- Percentage of males in service occupations:
Here: 4.1% city: 16.5%
- Percentage of males in sales and office occupations:
Here: 14.0% city: 12.2%
- Percentage of males in farming, fishing, and forestry occupations:
Here: 33.4% city: 15.3%
- Percentage of males in construction, extraction, and maintenance occupations:
Here: 3.3% city: 11.6%
- Percentage of males in transportation occupations:
Here: 4.0% city: 6.6%
- Percentage of males in material moving occupations:
Here: 18.4% city: 9.3%
Occupations of females:
- Percentage of females in computer and mathematical occupations:
Here: 7.5% city: 0.8%
- Percentage of females in architecture and engineering occupations:
Here: 2.9% city: 0.6%
- Percentage of females in community and social services occupations:
Here: 3.1% city: 1.9%
- Percentage of females in service occupations:
Here: 27.1% city: 23.3%
- Percentage of females in sales and office occupations:
Here: 27.8% city: 28.4%
- Percentage of females in farming, fishing, and forestry occupations:
Here: 3.3% city: 11.0%
- Percentage of females in production occupations:
Here: 7.3% city: 2.5%
- Percentage of females in material moving occupations:
Here: 19.6% city: 5.0%
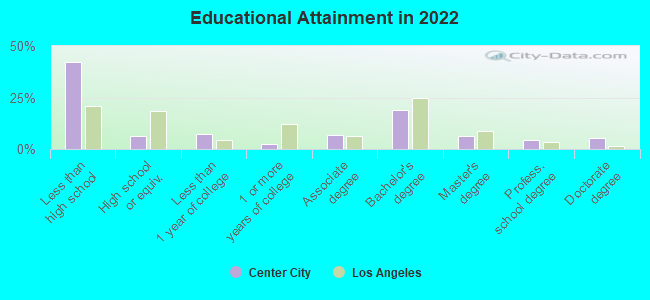
Education in this neighborhood (subdivision or community):
- Percentage of people 3 years and older in K-12 schools:
Center City: 20.6% Salinas: 20.2%
- Percentage of people 3 years and older in undergraduate colleges:
Center City: 10.1% Salinas: 4.8%
- Percentage of people 3 years and older in grad. or professional schools:
Center City: 2.6% Salinas: 0.8%
- Percentage of students K-12 enrolled in private schools:
Center City: 11.6% Salinas: 2.5%
Percentage of population below poverty level:
| Center City: | 22.0% |
| Salinas: | 12.6% |
Median year renter moved in (as recorded in 2022):
| Center City: | 2015 |
| Salinas: | 2018 |
Percentage of married-couple families with both working:
| Center City: | 99.7% |
| Salinas: | 70.1% |
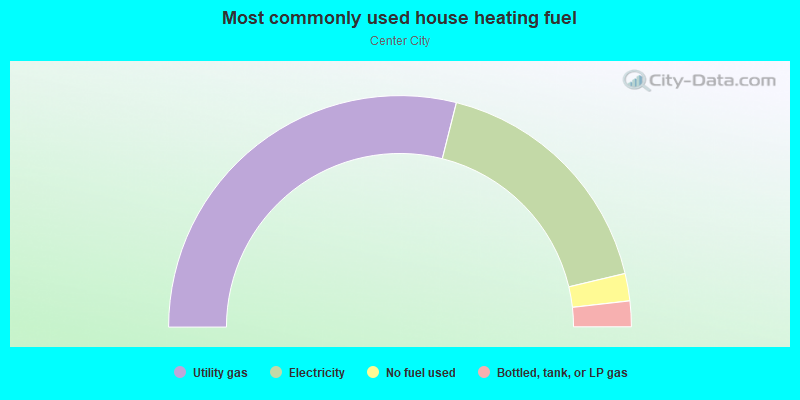
- 46.0%Utility gas
- 40.5%Electricity
- 8.4%No fuel used
- 2.2%Bottled, tank, or LP gas
- 1.9%Solar energy
- 1.0%Wood
Highways in this neighborhood:
John St (State Rte 68)
Length: 0.50 miles
Direction: E-W
Address range: 2 to 237
Direction: E-W
Address range: 2 to 237
State Rte 183 (W Market St)
Length: 0.11 miles
Direction: E-W
Address range: 1 to 51
Direction: E-W
Address range: 1 to 51
N Main St (State Rte 183)
Length: 0.11 miles
Direction: SW-NE
Address range: 1 to 17
Direction: SW-NE
Address range: 1 to 17
Roads and streets:
E Front St
Length: 0.59 miles
Directions: E-W, N-S, SE-NW
Directions: E-W, N-S, SE-NW
Monterey St
Length: 0.57 miles
Direction: N-S
Address range: 24 to 499
Direction: N-S
Address range: 24 to 499
E San Luis St
Length: 0.53 miles
Direction: E-W
Address range: 1 to 299
Direction: E-W
Address range: 1 to 299
Pajaro St
Length: 0.52 miles
Direction: N-S
Address range: 100 to 499
Direction: N-S
Address range: 100 to 499
Soledad St
Length: 0.47 miles
Direction: N-S
Address range: 100 to 499
Direction: N-S
Address range: 100 to 499
Lincoln Ave
Length: 0.46 miles
Directions: N-S, SE-NW, SW-NE
Address range: 1 to 399
Directions: N-S, SE-NW, SW-NE
Address range: 1 to 399
Salinas St
Length: 0.45 miles
Directions: N-S, SW-NE
Address range: 1 to 424
Directions: N-S, SW-NE
Address range: 1 to 424
California St
Length: 0.45 miles
Direction: N-S
Address range: 200 to 499
Direction: N-S
Address range: 200 to 499
S Main St (Main St)
Length: 0.40 miles
Direction: N-S
Address range: 100 to 499
Direction: N-S
Address range: 100 to 499
E Alisal St
Length: 0.40 miles
Direction: E-W
Address range: 1 to 229
Direction: E-W
Address range: 1 to 229
E Market St
Length: 0.40 miles
Directions: E-W, SE-NW
Address range: 1 to 99
Directions: E-W, SE-NW
Address range: 1 to 99
E Gabilan St
Length: 0.36 miles
Directions: E-W, SE-NW
Address range: 1 to 199
Directions: E-W, SE-NW
Address range: 1 to 199
Front St
Length: 0.35 miles
Direction: N-S
Address range: 300 to 499
Direction: N-S
Address range: 300 to 499
Melody Ln
Length: 0.35 miles
Direction: N-S
Address range: 100 to 399
Direction: N-S
Address range: 100 to 399
Summer St
Length: 0.17 miles
Direction: E-W
Address range: 1 to 99
Direction: E-W
Address range: 1 to 99
Central Ave
Length: 0.14 miles
Direction: E-W
Address range: 1 to 98
Direction: E-W
Address range: 1 to 98
W Alisal St
Length: 0.14 miles
Direction: E-W
Address range: 1 to 99
Direction: E-W
Address range: 1 to 99
W Gabilan St
Length: 0.14 miles
Direction: E-W
Address range: 1 to 31
Direction: E-W
Address range: 1 to 31
W San Luis St
Length: 0.14 miles
Direction: E-W
Address range: 1 to 99
Direction: E-W
Address range: 1 to 99
Midtown Ln
Length: 0.13 miles
Direction: E-W
Address range: 1 to 99
Direction: E-W
Address range: 1 to 99
Harmony Ln
Length: 0.13 miles
Direction: N-S
Direction: N-S
Spring St
Length: 0.10 miles
Direction: SE-NW
Address range: 1 to 35
Direction: SE-NW
Address range: 1 to 35
Lacey Ln
Length: 0.09 miles
Direction: N-S
Direction: N-S
Station Pl
Length: 0.06 miles
Direction: SW-NE
Address range: 1 to 99
Direction: SW-NE
Address range: 1 to 99
Howard St
Length: 0.06 miles
Direction: E-W
Address range: 1 to 199
Direction: E-W
Address range: 1 to 199
Abbott St
Length: 0.06 miles
Direction: SE-NW
Direction: SE-NW
Station Aly
Length: 0.04 miles
Direction: SE-NW
Direction: SE-NW
Railroad features:
Union Pacific RR
Length: 0.33 miles
Directions: E-W, SE-NW
Directions: E-W, SE-NW