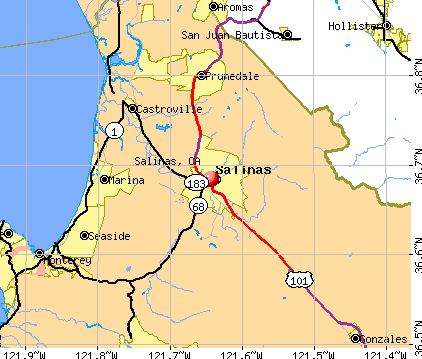
Salinas, California
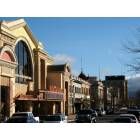
Salinas: Charming Downtown Salinas
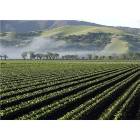
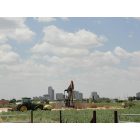
Salinas: Salinas Valley
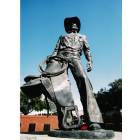
Salinas: Cowboy Statue
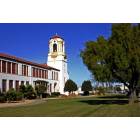
Salinas: Salinas High School
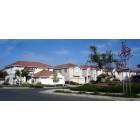
Salinas: Salinas
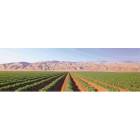
Salinas: lettuce filed
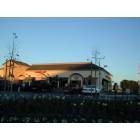
Salinas: Starbucks in Westdrige Shopping Center
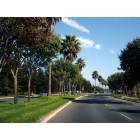
Salinas: Harden Parkway
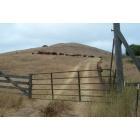
Salinas: Rural Salinas - Crazy Horse Canyon
Salinas
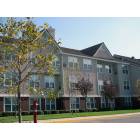
Salinas: The Salinas Marriot
- see
25
more - add
your
Submit your own pictures of this city and show them to the world
- OSM Map
- General Map
- Google Map
- MSN Map
Population change since 2000: +6.6%
 |
| Males: 80,127 | |
| Females: 80,893 |
| Median resident age: | 33.7 years |
| California median age: | 37.9 years |
| Salinas: | $80,560 |
| CA: | $91,551 |
Estimated per capita income in 2022: $26,250 (it was $14,495 in 2000)
Salinas city income, earnings, and wages data
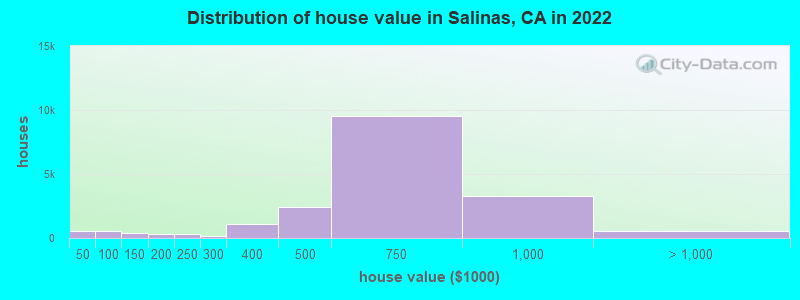
Estimated median house or condo value in 2022: $590,400 (it was $189,500 in 2000)
| Salinas: | $590,400 |
| CA: | $715,900 |
Mean prices in 2022: all housing units: $601,054; detached houses: $653,001; townhouses or other attached units: $487,288; in 3-to-4-unit structures: $445,078; in 5-or-more-unit structures: $296,430; mobile homes: $180,817
Median gross rent in 2022: $1,838.
(9.6% for White Non-Hispanic residents, 14.0% for Black residents, 13.7% for Hispanic or Latino residents, 10.0% for American Indian residents, 46.9% for Native Hawaiian and other Pacific Islander residents, 14.7% for other race residents, 8.9% for two or more races residents)
Detailed information about poverty and poor residents in Salinas, CA


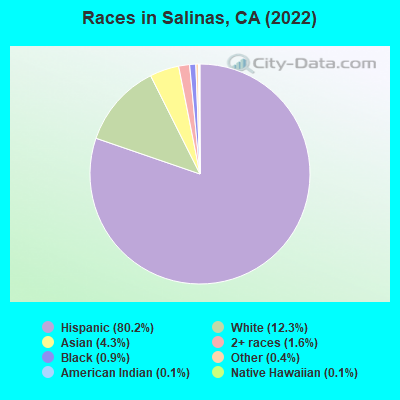
- 129,08580.2%Hispanic
- 19,84612.3%White alone
- 6,8714.3%Asian alone
- 2,6511.6%Two or more races
- 1,4960.9%Black alone
- 6860.4%Other race alone
- 1960.1%American Indian alone
- 1880.1%Native Hawaiian and Other
Pacific Islander alone
According to our research of California and other state lists, there were 326 registered sex offenders living in Salinas, California as of April 27, 2024.
The ratio of all residents to sex offenders in Salinas is 482 to 1.
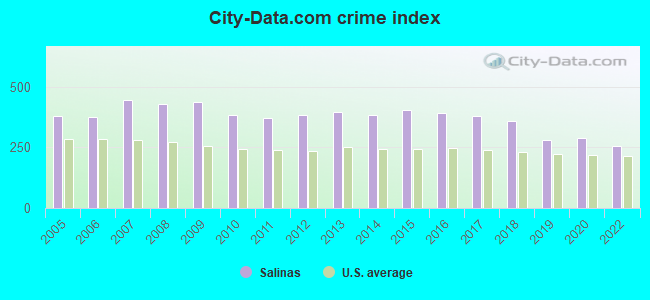
The City-Data.com crime index weighs serious crimes and violent crimes more heavily. Higher means more crime, U.S. average is 246.1. It adjusts for the number of visitors and daily workers commuting into cities.
- means the value is smaller than the state average.- means the value is about the same as the state average.
- means the value is bigger than the state average.
- means the value is much bigger than the state average.
Crime rate in Salinas detailed stats: murders, rapes, robberies, assaults, burglaries, thefts, arson
Full-time law enforcement employees in 2021, including police officers: 181 (142 officers - 128 male; 14 female).
| Officers per 1,000 residents here: | 0.91 |
| California average: | 2.30 |
 Recent articles from our blog. Our writers, many of them Ph.D. graduates or candidates, create easy-to-read articles on a wide variety of topics.

 | Allergies:Seaside vs Salinas (2 replies) |
| Potential Job in Salinas (7 replies) |
| The traffic from Salinas to Morgan Hill? (2 replies) |
| Commute from Prunedale to North Salinas (6 replies) |
| Any Monterey tennis enthusiasts out there? (4 replies) |
| Living in Monterey: COL, Crime, Elitism & Racial relations (27 replies) |
Latest news from Salinas, CA collected exclusively by city-data.com from local newspapers, TV, and radio stations
Ancestries: American (1.3%), English (1.2%).
Current Local Time: PST time zone
Elevation: 53 feet
Land area: 19.0 square miles.
Population density: 8,472 people per square mile (high).
59,267 residents are foreign born (33.1% Latin America).
| This city: | 36.8% |
| California: | 26.5% |
Median real estate property taxes paid for housing units with mortgages in 2022: $3,808 (0.6%)
Median real estate property taxes paid for housing units with no mortgage in 2022: $2,710 (0.5%)
Nearest city with pop. 200,000+: San Jose, CA  (44.7 miles , pop. 894,943).
Nearest city with pop. 1,000,000+: Los Angeles, CA (257.3 miles , pop. 3,694,820).
Nearest cities:
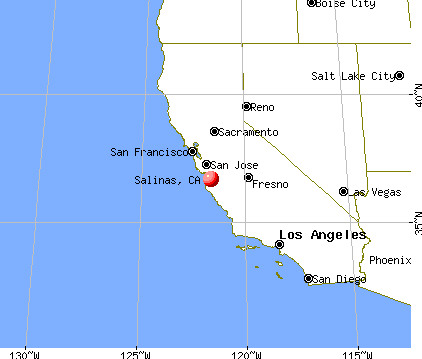
), ), ), )Latitude: 36.68 N, Longitude: 121.64 W
Daytime population change due to commuting: -16,836 (-10.5%)
Workers who live and work in this city: 30,279 (44.7%)
Area codes: 831, 408
Property values in Salinas, CA
Salinas tourist attractions:
Salinas, California accommodation & food services, waste management - Economy and Business Data
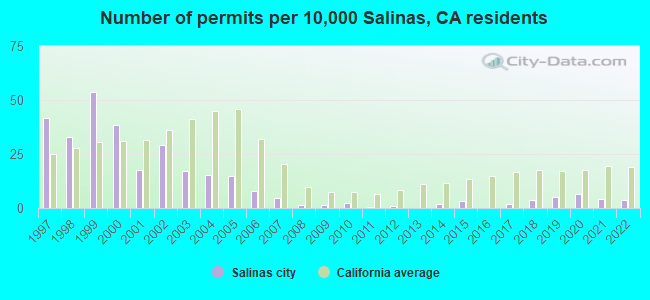
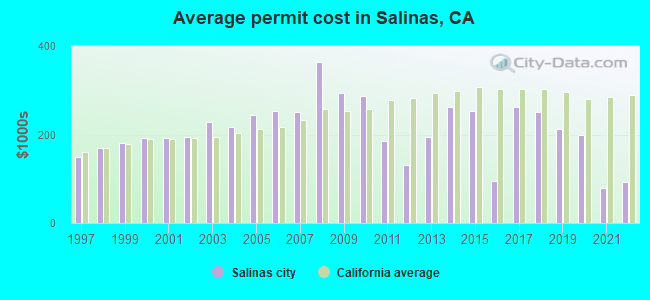
Single-family new house construction building permits:
- 2022: 59 buildings, average cost: $92,000
- 2021: 64 buildings, average cost: $80,400
- 2020: 96 buildings, average cost: $200,300
- 2019: 80 buildings, average cost: $211,800
- 2018: 57 buildings, average cost: $250,400
- 2017: 26 buildings, average cost: $261,700
- 2016: 2 buildings, average cost: $94,000
- 2015: 46 buildings, average cost: $253,600
- 2014: 30 buildings, average cost: $261,600
- 2013: 3 buildings, average cost: $195,300
- 2012: 11 buildings, average cost: $131,600
- 2011: 7 buildings, average cost: $184,900
- 2010: 35 buildings, average cost: $286,400
- 2009: 19 buildings, average cost: $293,200
- 2008: 24 buildings, average cost: $364,300
- 2007: 72 buildings, average cost: $250,000
- 2006: 119 buildings, average cost: $251,600
- 2005: 224 buildings, average cost: $245,400
- 2004: 231 buildings, average cost: $218,300
- 2003: 257 buildings, average cost: $228,700
- 2002: 442 buildings, average cost: $193,700
- 2001: 268 buildings, average cost: $190,500
- 2000: 579 buildings, average cost: $191,200
- 1999: 809 buildings, average cost: $179,600
- 1998: 500 buildings, average cost: $168,800
- 1997: 628 buildings, average cost: $148,900
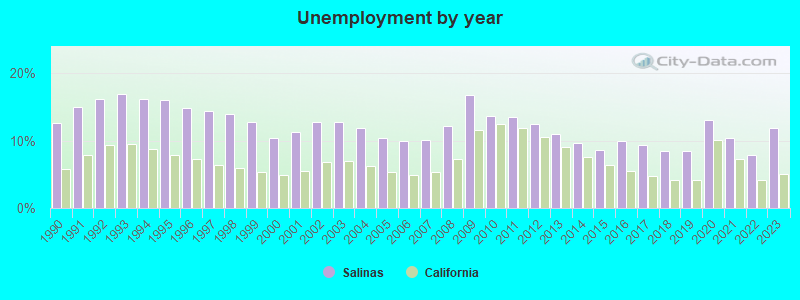
| Here: | 11.9% |
| California: | 5.1% |
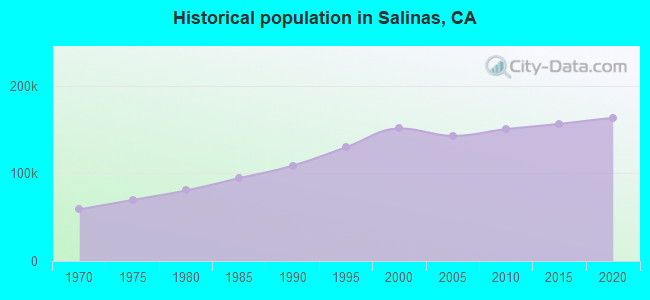
Population change in the 1990s: +42,240 (+38.8%).
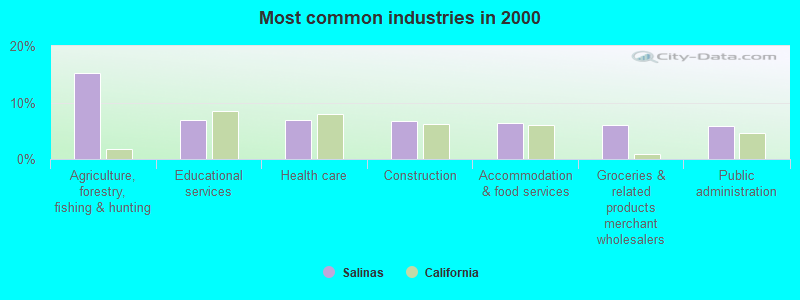
- Agriculture, forestry, fishing & hunting (15.2%)
- Educational services (6.9%)
- Health care (6.9%)
- Construction (6.6%)
- Accommodation & food services (6.3%)
- Groceries & related products merchant wholesalers (6.1%)
- Public administration (5.9%)
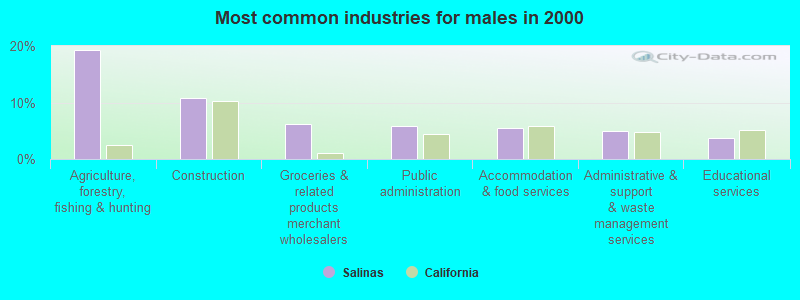
- Agriculture, forestry, fishing & hunting (19.3%)
- Construction (10.7%)
- Groceries & related products merchant wholesalers (6.1%)
- Public administration (5.9%)
- Accommodation & food services (5.5%)
- Administrative & support & waste management services (5.0%)
- Educational services (3.7%)
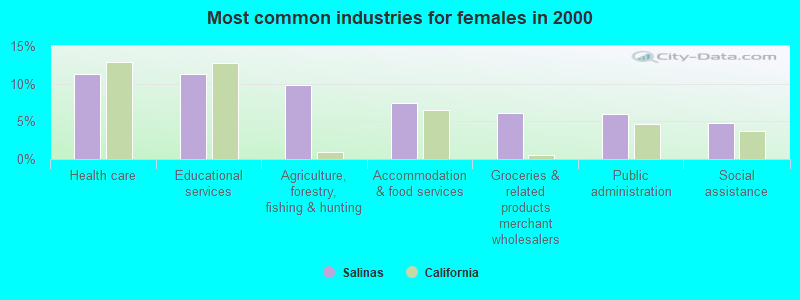
- Health care (11.3%)
- Educational services (11.3%)
- Agriculture, forestry, fishing & hunting (9.8%)
- Accommodation & food services (7.4%)
- Groceries & related products merchant wholesalers (6.1%)
- Public administration (6.0%)
- Social assistance (4.8%)
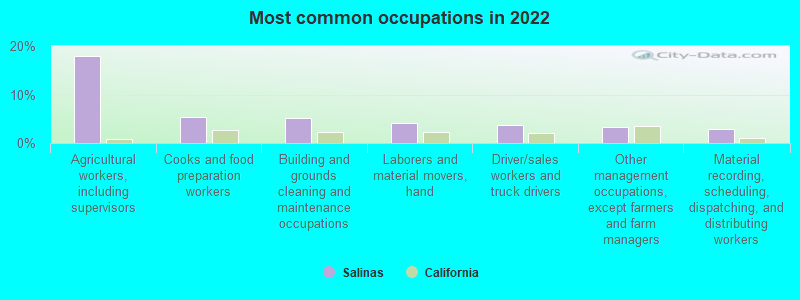
- Agricultural workers, including supervisors (17.9%)
- Cooks and food preparation workers (5.3%)
- Building and grounds cleaning and maintenance occupations (5.2%)
- Laborers and material movers, hand (4.2%)
- Driver/sales workers and truck drivers (3.6%)
- Other management occupations, except farmers and farm managers (3.2%)
- Material recording, scheduling, dispatching, and distributing workers (2.9%)
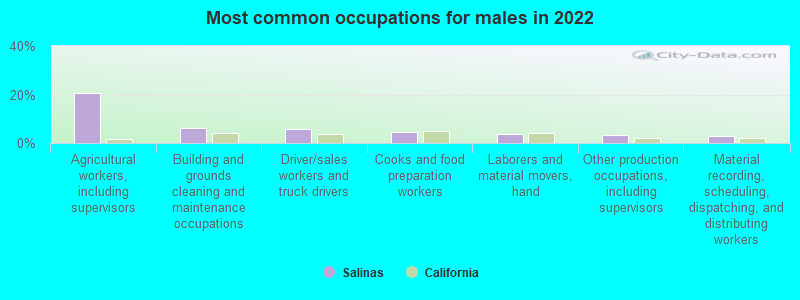
- Agricultural workers, including supervisors (20.7%)
- Building and grounds cleaning and maintenance occupations (6.4%)
- Driver/sales workers and truck drivers (5.9%)
- Cooks and food preparation workers (4.6%)
- Laborers and material movers, hand (3.9%)
- Other production occupations, including supervisors (3.4%)
- Material recording, scheduling, dispatching, and distributing workers (3.0%)
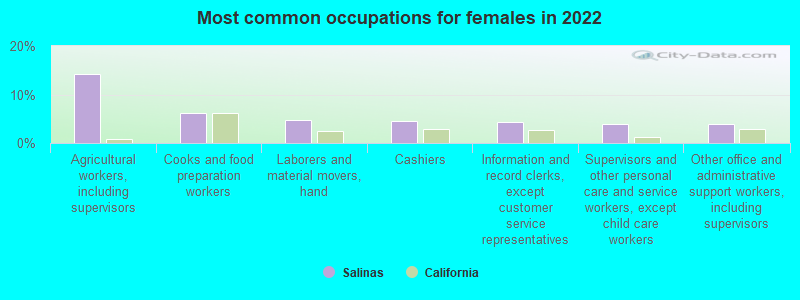
- Agricultural workers, including supervisors (14.3%)
- Cooks and food preparation workers (6.2%)
- Laborers and material movers, hand (4.7%)
- Cashiers (4.6%)
- Information and record clerks, except customer service representatives (4.4%)
- Supervisors and other personal care and service workers, except child care workers (3.9%)
- Other office and administrative support workers, including supervisors (3.8%)
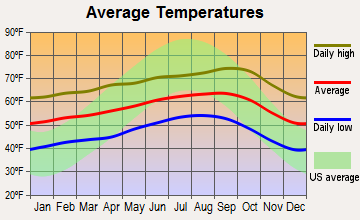
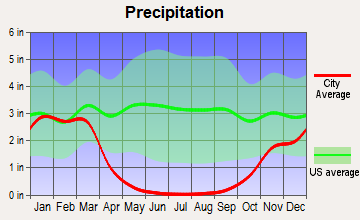
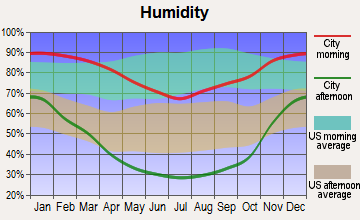
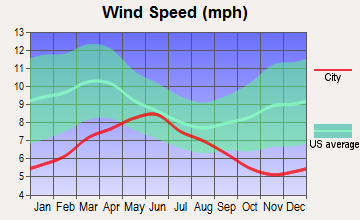
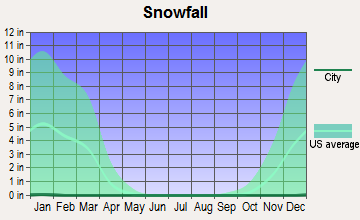
Average climate in Salinas, California
Based on data reported by over 4,000 weather stations


|
|

(lower is better)
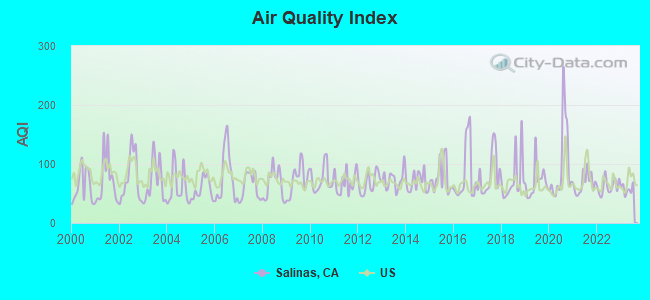
Air Quality Index (AQI) level in 2023 was 57.5. This is better than average.
| City: | 57.5 |
| U.S.: | 72.6 |
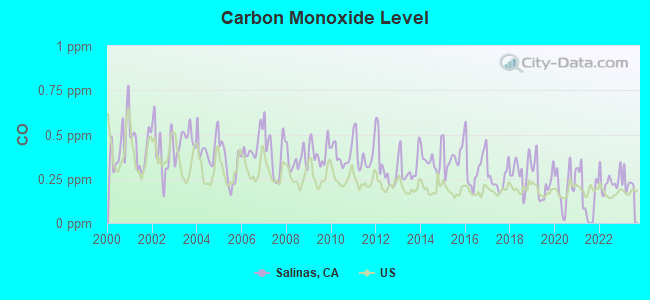
Carbon Monoxide (CO) [ppm] level in 2023 was 0.228. This is about average. Closest monitor was 0.7 miles away from the city center.
| City: | 0.228 |
| U.S.: | 0.251 |
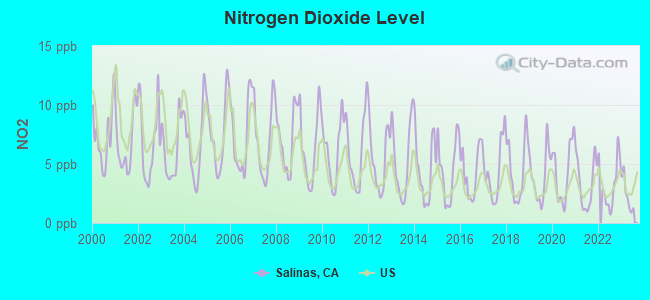
Nitrogen Dioxide (NO2) [ppb] level in 2023 was 2.40. This is significantly better than average. Closest monitor was 0.7 miles away from the city center.
| City: | 2.40 |
| U.S.: | 5.11 |
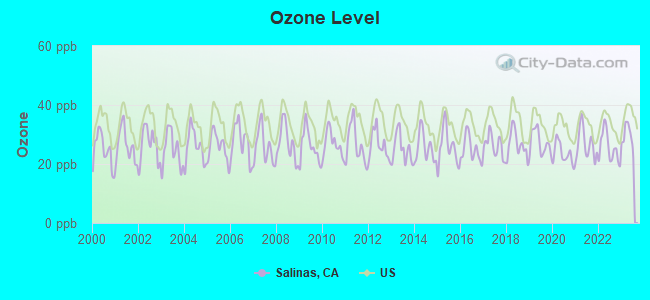
Ozone [ppb] level in 2023 was 29.4. This is about average. Closest monitor was 1.1 miles away from the city center.
| City: | 29.4 |
| U.S.: | 33.3 |
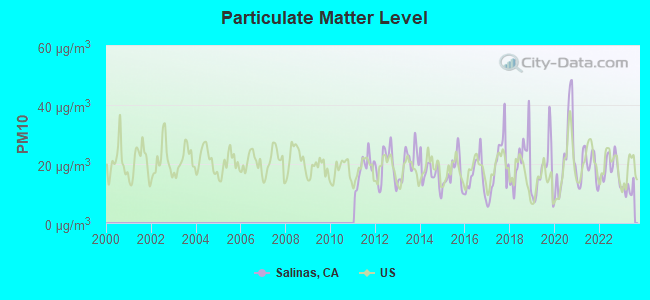
Particulate Matter (PM10) [µg/m3] level in 2023 was 11.6. This is significantly better than average. Closest monitor was 1.1 miles away from the city center.
| City: | 11.6 |
| U.S.: | 19.2 |
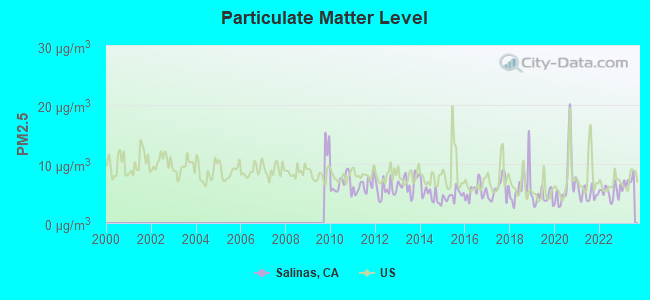
Particulate Matter (PM2.5) [µg/m3] level in 2023 was 6.97. This is about average. Closest monitor was 1.1 miles away from the city center.
| City: | 6.97 |
| U.S.: | 8.11 |
Earthquake activity:
Salinas-area historical earthquake activity is significantly above California state average. It is 7620% greater than the overall U.S. average.On 4/18/1906 at 13:12:21, a magnitude 7.9 (7.9 UK, Class: Major, Intensity: VIII - XII) earthquake occurred 117.7 miles away from Salinas center, causing $524,000,000 total damage
On 11/4/1927 at 13:51:53, a magnitude 7.5 (7.5 UK) earthquake occurred 127.1 miles away from the city center
On 10/18/1989 at 00:04:15, a magnitude 7.1 (6.5 MB, 7.1 MS, 6.9 MW, 7.0 ML) earthquake occurred 30.3 miles away from the city center, causing 62 deaths (62 shaking deaths) and 3757 injuries, causing $1,305,032,704 total damage
On 7/21/1952 at 11:52:14, a magnitude 7.7 (7.7 UK) earthquake occurred 188.5 miles away from Salinas center, causing $50,000,000 total damage
On 5/2/1983 at 23:42:37, a magnitude 6.7 (6.2 MB, 6.5 MS, 6.5 MW, 6.7 ML, Class: Strong, Intensity: VII - IX) earthquake occurred 81.2 miles away from the city center, causing $31,000,000 total damage
On 12/22/2003 at 19:15:56, a magnitude 6.6 (6.1 MB, 6.4 MS, 6.6 MW, 6.4 MW) earthquake occurred 80.2 miles away from Salinas center, causing 2 deaths (2 shaking deaths) and 40 injuries, causing $200,000,000 total damage
Magnitude types: body-wave magnitude (MB), local magnitude (ML), surface-wave magnitude (MS), moment magnitude (MW)
Natural disasters:
The number of natural disasters in Monterey County (23) is greater than the US average (15).Major Disasters (Presidential) Declared: 14
Emergencies Declared: 3
Causes of natural disasters: Floods: 12, Winter Storms: 7, Storms: 6, Fires: 4, Landslides: 4, Mudslides: 4, Freezes: 2, Drought: 1, Earthquake: 1, Hurricane: 1, Tornado: 1, Tsunami Wave: 1, Other: 1 (Note: some incidents may be assigned to more than one category).

Main business address for: MONTEREY GOURMET FOODS (MISCELLANEOUS FOOD PREPARATIONS & KINDRED PRODUCTS), CENTRAL COAST BANCORP (STATE COMMERCIAL BANKS).
Hospitals in Salinas:
- CENTRAL COAST VNA AND HOSPICE INC (6 QUAIL RUN CIRCLE, SUITE 101)
- COMMUNITY HOSPITAL OF SALINAS (970 CIRCLE DRIVE)
- NATIVIDAD MEDICAL CENTER (Government - Hospital District or Authority, 1441 CONSTITUTION BOULEVARD)
- SALINAS SURGERY CENTER (955A BLANCO CIRCLE)
- SALINAS VALLEY MEMORIAL HOSPITAL (Voluntary non-profit - Other, 450 EAST ROMIE LANE)
Nursing Homes in Salinas:
- KATHERINE HEALTHCARE (315 ALAMEDA AVENUE)
- KINDRED NURSING AND TRANSITIONAL CARE-PACIFIC COAS (720 EAST ROMIE LANE)
- WINDSOR GARDENS REHABILITATION CENTER OF SALINAS (637 EAST ROMIE LANE)
- WINDSOR SKYLINE CARE CENTER (348 IRIS DRIVE)
- WINDSOR THE RIDGE REHABILITATION CENTER (350 IRIS DRIVE)
Dialysis Facilities in Salinas:
Home Health Centers in Salinas:
Airports and heliports located in Salinas:
- Salinas Municipal Airport (SNS) (Runways: 3, Air Taxi Ops: 1,480, Itinerant Ops: 40,861, Local Ops: 35,000, Military Ops: 555)
- Natividad Medical Center Heliport (5CL4)
Amtrak station:
SALINAS (11 STATION PLACE) . Services: ticket office, partially wheelchair accessible, enclosed waiting area, public restrooms, public payphones, vending machines, free short-term parking, free long-term parking, call for car rental service, call for taxi service, public transit connection.Colleges/Universities in Salinas:
- Hartnell College (Full-time enrollment: 5,506; Location: 411 Central Avenue; Public; Website: www.hartnell.edu)
- Heald College-Salinas (Full-time enrollment: 1,293; Location: 1450 N Main St; Private, for-profit; Website: www.heald.edu)
- Central Coast College (Full-time enrollment: 141; Location: 480 S Main Street; Private, for-profit; Website: www.centralcoastcollege.edu)
- Salinas Beauty College Inc (Full-time enrollment: 83; Location: 916 South Main Street; Private, for-profit; Website: salinasbeautycollege.com)
- CET-Salinas (Full-time enrollment: 82; Location: 421 Monterey St; Private, not-for-profit; Website: cetweb.org)
- Waynes College of Beauty (Full-time enrollment: 37; Location: 1271 North Main Street; Private, for-profit; Website: www.waynescollegeofbeauty.com)
Other colleges/universities with over 2000 students near Salinas:
- California State University-Monterey Bay (about 9 miles; Seaside, CA; Full-time enrollment: 5,125)
- Naval Postgraduate School (about 15 miles; Monterey, CA; FT enrollment: 4,951)
- Monterey Peninsula College (about 15 miles; Monterey, CA; FT enrollment: 4,588)
- Gavilan College (about 21 miles; Gilroy, CA; FT enrollment: 3,327)
- Cabrillo College (about 27 miles; Aptos, CA; FT enrollment: 7,729)
- University of California-Santa Cruz (about 32 miles; Santa Cruz, CA; FT enrollment: 17,751)
- Evergreen Valley College (about 44 miles; San Jose, CA; FT enrollment: 5,539)
Biggest public high schools in Salinas:
- ALISAL HIGH (Students: 1,743, Location: 777 WILLIAMS RD., Grades: 9-12)
- SALINAS HIGH (Students: 1,698, Location: 726 S. MAIN ST., Grades: 9-12)
- EVERETT ALVAREZ HIGH (Students: 1,499, Location: 1900 INDEPENDENCE BLVD., Grades: 9-12)
- NORTH SALINAS HIGH (Students: 1,326, Location: 55 KIP DR., Grades: 9-12)
- MONTEREY COUNTY SPECIAL EDUCATION (Students: 439, Location: 901 BLANCO CIR., Grades: KG-12)
- MONTEREY COUNTY HOME CHARTER (Students: 211, Location: 901 BLANCO CIR., Grades: KG-12, Charter school)
- MOUNT TORO HIGH (Students: 107, Location: 10 SHERWOOD PL., Grades: 9-12)
- SALINAS COMMUNITY (Students: 92, Location: 1420 NATIVIDAD RD., Grades: 7-12)
- NORTH MONTEREY COUNTY CENTER FOR INDEPENDENT STUDY (Students: 67, Location: 17500 PESANTE RD., Grades: KG-12)
- CENTRAL BAY HIGH (CONTINUATION) (Students: 62, Location: 17500 PESANTE RD., Grades: 9-12)
Private high schools in Salinas:
Biggest public elementary/middle schools in Salinas:
- HARDEN MIDDLE (Students: 1,029, Location: 1561 MCKINNON ST., Grades: 7-8)
- GAVILAN VIEW MIDDLE (Students: 973, Location: 18250 VAB BUREN., Grades: 6-8)
- WASHINGTON MIDDLE (Students: 922, Location: 560 IVERSON ST., Grades: 7-8)
- LA PAZ MIDDLE (Students: 860, Location: 1300 N. SANBORN RD., Grades: 7-8)
- EL SAUSAL MIDDLE (Students: 768, Location: 1155 E. ALISAL ST., Grades: 7-8)
- BARDIN ELEMENTARY (Students: 534, Location: 425 BARDIN RD., Grades: KG-6)
- OSCAR F. LOYA ELEMENTARY (Students: 520, Location: 1505 COUGAR DR., Grades: KG-6)
- HENRY F. KAMMANN ELEMENTARY (Students: 507, Location: 521 ROCHEX ST., Grades: KG-6)
- SHERWOOD ELEMENTARY (Students: 500, Location: 110 S. WOOD ST., Grades: KG-6)
- CESAR E. CHAVEZ ELEMENTARY (Students: 497, Location: 1225 TOWT ST., Grades: KG-6)
Private elementary/middle schools in Salinas:
- SACRED HEART SCHOOL (Students: 276, Location: 123 W MARKET ST, Grades: KG-8)
- MADONNA DEL SASSO SCHOOL (Students: 275, Location: 20 SANTA TERESA WAY, Grades: PK-8)
- SALINAS CHRISTIAN SCHOOL (Students: 115, Location: 345 E ALVIN DR, Grades: PK-6)
- MONTESSORI LEARNING CENTER (Students: 111, Location: 30 HITCHCOCK RD, Grades: PK-8)
- PACIFIC COAST CHRISTIAN ACADEMY (Students: 103, Location: 381 SAN JUAN GRADE RD, Grades: PK-8)
User-submitted facts and corrections:
- I would like to add a new private christian elementary school to your list. Our Savior Lutheran School in Salinas. Kindergarden and 1st grade. 1230 Luther Way Salinas, CA (831) 422-6352 Off Blanco Rd. How do I submit this?
Points of interest:
Notable locations in Salinas: California Rodeo Grounds (A), Salinas Fairways Golf Course (B), Monterey County Public Works Center (C), Alisal Sanitary District Treatment Plant (D), Salinas Sewage Treatment Plant (E), Monterey County Parks and Flood Control Office (F), Salinas Civic Club (G), Salinas City Hall (H), Salinas Chamber of Commerce (I), Monterey County Law Library (J), Monterey County Courthouse (K), John Steinbeck Library (L), John B Lemos Memorial Student Union (M), Hartnell Community College Library (N), Council Rotunda (O), Salinas Conference Center (P), Monterey County Social Services (Q), Monterey County Jail (R), Monterey County Adult Detention Center (S), California Shock Trauma Air Rescue - CALSTAR 5 Air Ambulance Salinas (T). Display/hide their locations on the map
Shopping Centers: Salinas Shopping Center (1), Northridge Shopping Center (2), West Laurel Shopping Center (3), Sherwood Gardens Shopping Center (4), Laurel West Plaza Shopping Center (5), Harden Ranch Shopping Center (6), Alvin Square Shopping Center (7), Valley Center Shopping Center (8), Star Center Shopping Center (9). Display/hide their locations on the map
Main business address in Salinas include: MONTEREY GOURMET FOODS (A), CENTRAL COAST BANCORP (B). Display/hide their locations on the map
Churches in Salinas include: Calvary Evangelistic Church (A), The Church of Jesus Christ of Latter Day Saints (B), Filipino United Church (C), First Baptist Church (D), Lincoln Avenue Presbyterian Church (E), Sacred Heart Convent (F), Sacred Heart Roman Catholic Church (G), Salinas Confucius Church (H), Seventh Day Adventist Church (I). Display/hide their locations on the map
Cemeteries: Independent Order of Odd Fellows Cemetery (1), Monterey County Cemetery (2), Chinese Cemetery (3), Yamat Cemetery (4). Display/hide their locations on the map
Creeks: Natividad Creek (A), Gabilan Creek (B), Alisal Creek (C). Display/hide their locations on the map
Parks in Salinas include: Bataan Park (1), Clarmont Manor Park (2), Hebron Community Park (3), Loma Linda Park (4), Maple Playground (5), Mission Park (6), Urabe Park (7), Woodside Park (8), El Dorado Community Park (9). Display/hide their locations on the map
Tourist attractions: Boronda Adobe History Center (Museums; 333 Boronda Road), Bingo-Broadway Bingo (Amusement & Theme Parks; 19 West Bernal Drive), Aladdins's Castle (Amusement & Theme Parks; 1260 Northridge Shopping), American Carousel Amusements LLC (Amusement & Theme Parks; 796 Northridge Shopping).
Hotels: Adams Motel (2086 North Main Street), Appling Inn (1030 Fairview Avenue), Aloha Motel (235 Kern Street), Best 5 Motel (1010 Fairview Avenue), Best Inn (109 John Street), Best Western Salinas Valley In (187 Kern Street), Best Western Hanns Inn (175 Kern Street), Budget Inn Motel (219 John Street).
Birthplace of: John Steinbeck - (1902-1968), author, E.J. Rowland - College basketball player (St. Mary's (CA) Gaels).
Drinking water stations with addresses in Salinas and their reported violations in the past:
GONZALES 76 STATION WS (Population served: 200, Groundwater):Past health violations:BLUFFS WS (Population served: 172, Groundwater):Past monitoring violations:
- MCL, Single Sample - Between JAN-2014 and MAR-2014, Contaminant: Nitrate. Follow-up actions: St AO (w/o penalty) issued (DEC-03-2008), St Public Notif requested (JUL-10-2013)
- MCL, Single Sample - Between OCT-2013 and DEC-2013, Contaminant: Nitrate. Follow-up actions: St AO (w/o penalty) issued (DEC-03-2008), St Public Notif requested (JUL-10-2013)
- MCL, Single Sample - Between JUL-2013 and SEP-2013, Contaminant: Nitrate. Follow-up actions: St AO (w/o penalty) issued (DEC-03-2008)
- MCL, Single Sample - Between APR-2013 and JUN-2013, Contaminant: Nitrate. Follow-up actions: St AO (w/o penalty) issued (DEC-03-2008), St Public Notif requested (JUL-10-2013)
- MCL, Single Sample - Between JAN-2013 and MAR-2013, Contaminant: Nitrate. Follow-up actions: St AO (w/o penalty) issued (DEC-03-2008)
- MCL, Single Sample - Between OCT-2012 and DEC-2012, Contaminant: Nitrate. Follow-up actions: St AO (w/o penalty) issued (DEC-03-2008)
- 13 other older health violations
- Monitoring, Repeat Major (TCR) - In SEP-2008, Contaminant: Coliform (TCR). Follow-up actions: St Violation/Reminder Notice (OCT-27-2008), St Public Notif requested (OCT-27-2008)
- Monitoring, Check/Repeat/Confirmation - In SEP-2008, Contaminant: Nitrate. Follow-up actions: St AO (w/o penalty) issued (DEC-03-2008)
- Monitoring, Repeat Major (TCR) - In SEP-2008, Contaminant: Coliform (TCR). Follow-up actions: St Violation/Reminder Notice (OCT-27-2008), St Public Notif requested (OCT-27-2008)
- Monitoring, Repeat Major (TCR) - In NOV-2006, Contaminant: Coliform (TCR). Follow-up actions: St Violation/Reminder Notice (DEC-26-2006), St Public Notif requested (DEC-26-2006)
- Monitoring, Repeat Major (TCR) - In NOV-2006, Contaminant: Coliform (TCR). Follow-up actions: St Violation/Reminder Notice (DEC-26-2006), St Public Notif requested (DEC-26-2006)
- 9 routine major monitoring violations
- 2 other older monitoring violations
Past monitoring violations:ASSISI MWC (Population served: 126, Groundwater):
- 4 minor monitoring violations
Past health violations:EXXON STATION WS (Population served: 100, Groundwater):Past monitoring violations:
- MCL, Monthly (TCR) - In DEC-2013, Contaminant: Coliform. Follow-up actions: St Violation/Reminder Notice (FEB-22-2013), St Public Notif requested (FEB-22-2013)
- MCL, Monthly (TCR) - In MAY-2013, Contaminant: Coliform. Follow-up actions: St Violation/Reminder Notice (FEB-22-2013), St Public Notif requested (2 times from FEB-22-2013 to JUN-15-2013), St Public Notif received (JUL-10-2013), St Violation/Reminder Notice (JUL-17-2013)
- Monitoring, Repeat Major (TCR) - In FEB-2008, Contaminant: Coliform (TCR)
- Monitoring, Repeat Major (TCR) - In FEB-2008, Contaminant: Coliform (TCR). Follow-up actions: St Violation/Reminder Notice (APR-02-2008)
- 7 routine major monitoring violations
- 2 minor monitoring violations
Past health violations:FREE WILL BAPTIST CHURCH WS (Population served: 80, Groundwater):Past monitoring violations:
- MCL, Monthly (TCR) - In JAN-2011, Contaminant: Coliform. Follow-up actions: St Violation/Reminder Notice (JAN-25-2011), St Public Notif requested (JAN-25-2011)
- MCL, Monthly (TCR) - In DEC-2010, Contaminant: Coliform. Follow-up actions: St Violation/Reminder Notice (JAN-18-2011), St Public Notif requested (JAN-18-2011)
- MCL, Monthly (TCR) - In OCT-2010, Contaminant: Coliform. Follow-up actions: St Public Notif requested (NOV-28-2010)
- MCL, Monthly (TCR) - In DEC-2008, Contaminant: Coliform. Follow-up actions: St Violation/Reminder Notice (JAN-26-2009), St Public Notif requested (JAN-26-2009)
- MCL, Monthly (TCR) - In DEC-2008, Contaminant: Coliform. Follow-up actions: St Violation/Reminder Notice (JAN-26-2009), St Public Notif requested (JAN-26-2009)
- Monitoring, Repeat Major (TCR) - In OCT-2010, Contaminant: Coliform (TCR). Follow-up actions: St Public Notif requested (NOV-28-2010)
- Monitoring, Repeat Major (TCR) - Between AUG-2010 and SEP-2010, Contaminant: Coliform (TCR). Follow-up actions: St Violation/Reminder Notice (SEP-20-2010), St Public Notif requested (SEP-20-2010)
- Monitoring, Repeat Major (TCR) - In SEP-2006, Contaminant: Coliform (TCR). Follow-up actions: St Violation/Reminder Notice (OCT-18-2006)
- Monitoring, Repeat Major (TCR) - In SEP-2006, Contaminant: Coliform (TCR). Follow-up actions: St Violation/Reminder Notice (OCT-18-2006)
- 3 routine major monitoring violations
- 3 minor monitoring violations
Past monitoring violations:BLACKIE RD WS #05 (Population served: 54, Groundwater):
- Monitoring, Repeat Major (TCR) - In DEC-2008, Contaminant: Coliform (TCR). Follow-up actions: St Public Notif requested (JAN-26-2009), St Public Notif received (JAN-26-2009), St Violation/Reminder Notice (JAN-26-2009)
- Monitoring, Repeat Major (TCR) - In DEC-2008, Contaminant: Coliform (TCR). Follow-up actions: St Public Notif requested (JAN-26-2009), St Public Notif received (JAN-26-2009), St Violation/Reminder Notice (JAN-26-2009)
- 2 routine major monitoring violations
- 3 minor monitoring violations
- 2 regular monitoring violations
Past health violations:RIVER RD WS #26 (Population served: 45, Groundwater):Past monitoring violations:
- MCL, Monthly (TCR) - In SEP-2007, Contaminant: Coliform. Follow-up actions: St Violation/Reminder Notice (OCT-26-2007), St Public Notif requested (OCT-26-2007)
- MCL, Monthly (TCR) - In SEP-2007, Contaminant: Coliform. Follow-up actions: St Violation/Reminder Notice (OCT-26-2007), St Public Notif requested (OCT-26-2007)
- MCL, Monthly (TCR) - In AUG-2007, Contaminant: Coliform. Follow-up actions: St Violation/Reminder Notice (SEP-27-2007), St Public Notif requested (SEP-27-2007)
- MCL, Monthly (TCR) - In AUG-2007, Contaminant: Coliform
- One minor monitoring violation
Past monitoring violations:CALERA CANYON HEIGHTS HOA (Population served: 39, Groundwater):
- 8 routine major monitoring violations
Past health violations:
- MCL, Monthly (TCR) - In JUN-2012, Contaminant: Coliform. Follow-up actions: St Violation/Reminder Notice (JUL-20-2012), St Public Notif requested (JUL-20-2012)
- MCL, Monthly (TCR) - In APR-2012, Contaminant: Coliform. Follow-up actions: St Violation/Reminder Notice (MAY-15-2012), St Public Notif requested (MAY-15-2012)
- MCL, Monthly (TCR) - In FEB-2012, Contaminant: Coliform. Follow-up actions: St Violation/Reminder Notice (APR-26-2012), St Public Notif requested (APR-26-2012)
- MCL, Monthly (TCR) - In MAY-2011, Contaminant: Coliform. Follow-up actions: St Violation/Reminder Notice (JUN-29-2011)
- MCL, Monthly (TCR) - In AUG-2010, Contaminant: Coliform. Follow-up actions: St Violation/Reminder Notice (APR-15-2011)
- MCL, Monthly (TCR) - In APR-2005, Contaminant: Coliform. Follow-up actions: St Violation/Reminder Notice (MAY-26-2005), St Public Notif requested (MAY-26-2005)
- 3 other older health violations
Drinking water stations with addresses in Salinas that have no violations reported:
- ALCO WATER SERVICE (Population served: 29,327, Primary Water Source Type: Groundwater)
- MONTEREY ROSES WS (Population served: 50, Primary Water Source Type: Groundwater)
- RIVER RD WS#34 (Population served: 45, Primary Water Source Type: Groundwater)
- ROCKY POINT RESTAURANT WS *CLOSED* (Population served: 26, Primary Water Source Type: Purch surface water)
- HORN WS (Population served: 25, Primary Water Source Type: Groundwater)
- JOLON RD WS #6 (Population served: 25, Primary Water Source Type: )
| This city: | 3.7 people |
| California: | 2.9 people |
| This city: | 78.0% |
| Whole state: | 68.7% |
| This city: | 8.8% |
| Whole state: | 7.2% |
Likely homosexual households (counted as self-reported same-sex unmarried-partner households)
- Lesbian couples: 0.3% of all households
- Gay men: 0.3% of all households
People in group quarters in Salinas in 2010:
- 992 people in local jails and other municipal confinement facilities
- 531 people in nursing facilities/skilled-nursing facilities
- 275 people in other noninstitutional facilities
- 226 people in group homes intended for adults
- 185 people in correctional facilities intended for juveniles
- 80 people in residential treatment centers for adults
- 55 people in emergency and transitional shelters (with sleeping facilities) for people experiencing homelessness
- 54 people in correctional residential facilities
- 31 people in group homes for juveniles (non-correctional)
- 22 people in workers' group living quarters and job corps centers
- 10 people in residential treatment centers for juveniles (non-correctional)
- 4 people in hospitals with patients who have no usual home elsewhere
People in group quarters in Salinas in 2000:
- 7,133 people in state prisons
- 949 people in agriculture workers' dormitories on farms
- 945 people in local jails and other confinement facilities (including police lockups)
- 500 people in other noninstitutional group quarters
- 361 people in nursing homes
- 224 people in other workers' dormitories
- 103 people in college dormitories (includes college quarters off campus)
- 93 people in short-term care, detention or diagnostic centers for delinquent children
- 77 people in other nonhousehold living situations
- 64 people in other group homes
- 56 people in halfway houses
- 54 people in training schools for juvenile delinquents
- 48 people in wards in general hospitals for patients who have no usual home elsewhere
- 44 people in homes for the mentally ill
- 44 people in homes for the mentally retarded
- 33 people in homes or halfway houses for drug/alcohol abuse
- 31 people in hospitals/wards and hospices for chronically ill
- 31 people in hospices or homes for chronically ill
- 22 people in unknown juvenile institutions
- 13 people in mental (psychiatric) hospitals or wards
- 11 people in religious group quarters
Banks with most branches in Salinas (2011 data):
- Wells Fargo Bank, National Association: 7 branches. Info updated 2011/04/05: Bank assets: $1,161,490.0 mil, Deposits: $905,653.0 mil, headquarters in Sioux Falls, SD, positive income, 6395 total offices, Holding Company: Wells Fargo & Company
- JPMorgan Chase Bank, National Association: 425 Main Street Branch, Salinas - Creek Bridge, North Main St Branch, 800 E Alisal Branch. Info updated 2011/11/10: Bank assets: $1,811,678.0 mil, Deposits: $1,190,738.0 mil, headquarters in Columbus, OH, positive income, International Specialization, 5577 total offices, Holding Company: Jpmorgan Chase & Co.
- Bank of America, National Association: Salinas Main Branch, Alisal Branch, North Salinas Branch. Info updated 2009/11/18: Bank assets: $1,451,969.3 mil, Deposits: $1,077,176.8 mil, headquarters in Charlotte, NC, positive income, 5782 total offices, Holding Company: Bank Of America Corporation
- Santa Barbara Bank & Trust, National Association: Salinas Branch, Salinas-Harden Ranch Branch, Oldtown Branch. Info updated 2011/06/09: Bank assets: $5,847.9 mil, Deposits: $4,684.3 mil, headquarters in Santa Barbara, CA, positive income, Commercial Lending Specialization, 48 total offices, Holding Company: Sb Acquisition Company, Llc
- Rabobank, National Association: Salinas Branch, Limited Service Facility (Courier), Westridge Branch. Info updated 2011/01/27: Bank assets: $11,745.0 mil, Deposits: $8,446.0 mil, headquarters in Roseville, CA, positive income, Agricultural Specialization, 124 total offices, Holding Company: Cooperatieve Centrale Raiffeisen-Boerenleenbank B.A., "rabobank Nederland
- Comerica Bank: Prunedale Branch at 7915 San Miguel Canyon Road, branch established on 1987/06/30; Salinas Branch at 430 South Main Street, branch established on 1987/06/30. Info updated 2011/07/29: Bank assets: $60,970.5 mil, Deposits: $48,300.9 mil, headquarters in Dallas, TX, positive income, Commercial Lending Specialization, 497 total offices, Holding Company: Comerica Incorporated
- Union Bank, National Association: Salinas Branch at 531 South Main Street, branch established on 1973/12/17; North Salinas Branch at 1890 North Main Street, branch established on 1934/11/01. Info updated 2011/09/01: Bank assets: $88,967.5 mil, Deposits: $65,286.4 mil, headquarters in San Francisco, CA, positive income, Commercial Lending Specialization, 403 total offices, Holding Company: Mitsubishi Ufj Financial Group, Inc.
- U.S. Bank National Association: Independence And Constitution Safewa at 1516 Constitution Boulevard, branch established on 2004/04/30; Salinas Nob Hill Foods Branch at 1320 South Main Street, branch established on 2007/07/30. Info updated 2012/01/30: Bank assets: $330,470.8 mil, Deposits: $236,091.5 mil, headquarters in Cincinnati, OH, positive income, 3121 total offices, Holding Company: U.S. Bancorp
- Pacific Valley Bank: at 422 Main Street, branch established on 2004/09/14; Salinas Main Branch at 422 Main Street, branch established on 2006/06/26. Info updated 2009/09/30: Bank assets: $178.2 mil, Deposits: $156.0 mil, local headquarters, positive income, Commercial Lending Specialization, 4 total offices
- 3 other banks with 3 local branches
For population 15 years and over in Salinas:
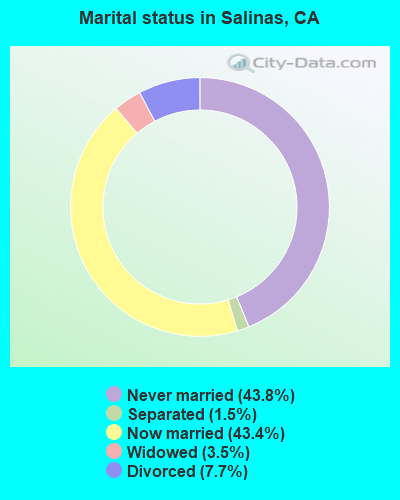
- Never married: 43.8%
- Now married: 43.4%
- Separated: 1.5%
- Widowed: 3.5%
- Divorced: 7.7%
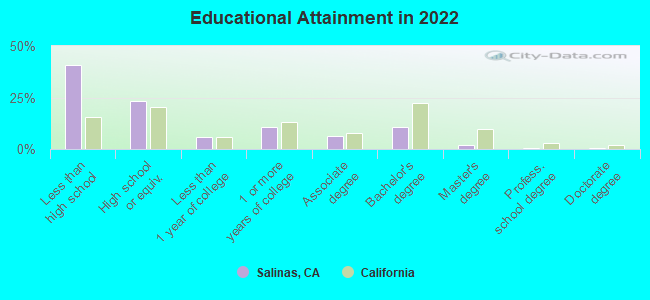
For population 25 years and over in Salinas:
- High school or higher: 59.1%
- Bachelor's degree or higher: 13.5%
- Graduate or professional degree: 2.8%
- Unemployed: 12.0%
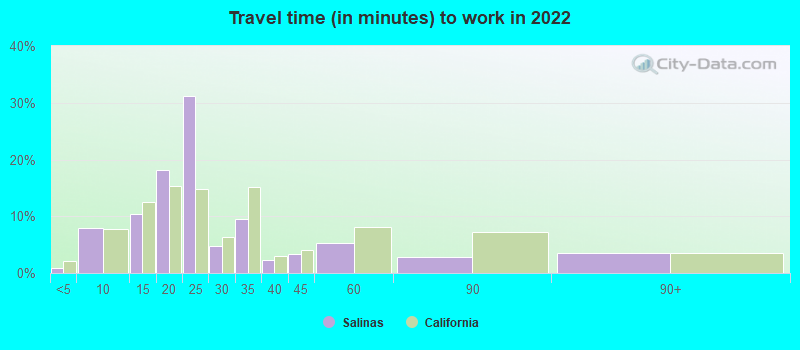
- Mean travel time to work (commute): 26.5 minutes
| Here: | 24.2 |
| California average: | 15.5 |
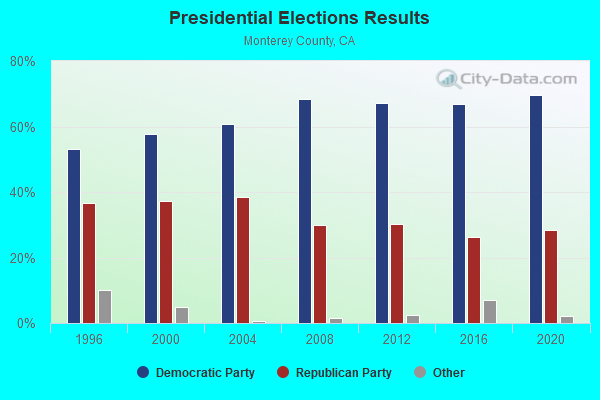
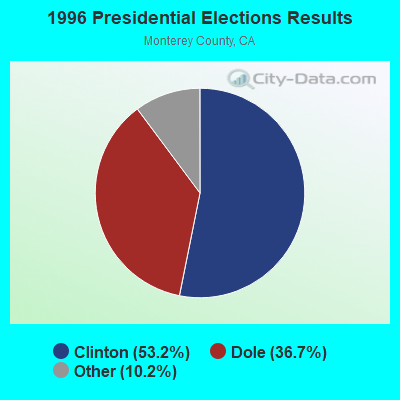
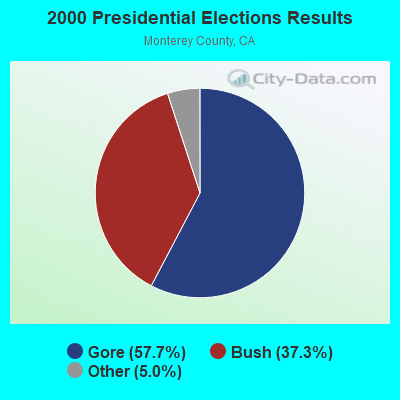
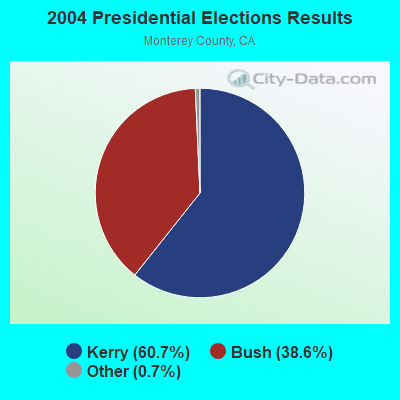
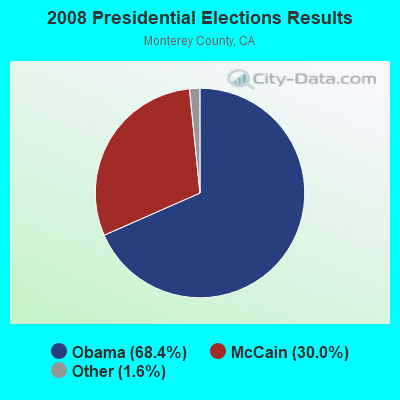
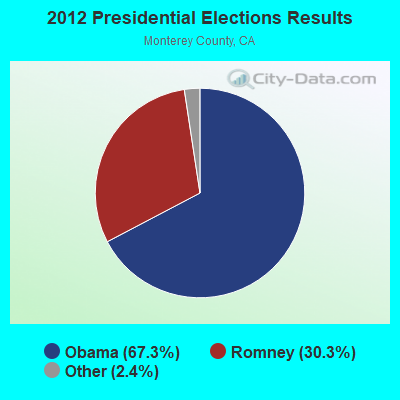
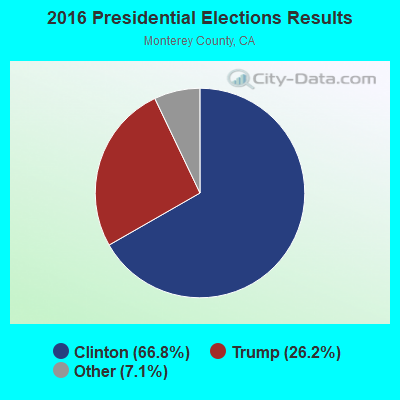
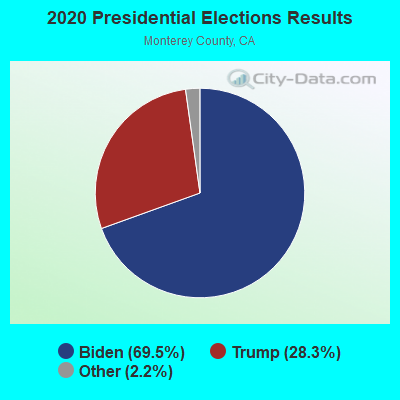
Graphs represent county-level data. Detailed 2008 Election Results
Neighborhoods in Salinas:
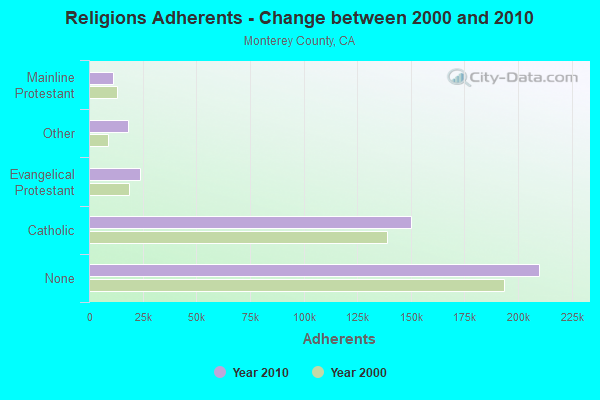
(Salinas, California Neighborhood Map)Religion statistics for Salinas, CA (based on Monterey County data)
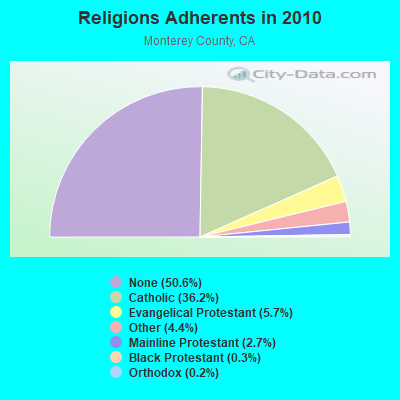
| Religion | Adherents | Congregations |
|---|---|---|
| Catholic | 150,050 | 26 |
| Evangelical Protestant | 23,624 | 154 |
| Other | 18,309 | 48 |
| Mainline Protestant | 11,244 | 48 |
| Black Protestant | 1,199 | 8 |
| Orthodox | 640 | 3 |
| None | 209,991 | - |
Food Environment Statistics:
| This county: | 2.82 / 10,000 pop. |
| California: | 2.14 / 10,000 pop. |
| Monterey County: | 0.05 / 10,000 pop. |
| State: | 0.04 / 10,000 pop. |
| Monterey County: | 0.91 / 10,000 pop. |
| California: | 0.62 / 10,000 pop. |
| Monterey County: | 2.00 / 10,000 pop. |
| California: | 1.49 / 10,000 pop. |
| This county: | 9.24 / 10,000 pop. |
| California: | 7.42 / 10,000 pop. |
| This county: | 7.5% |
| California: | 7.3% |
| Here: | 21.8% |
| California: | 21.3% |
| Monterey County: | 18.4% |
| State: | 17.9% |
Health and Nutrition:
| This city: | 46.0% |
| California: | 49.4% |
| Here: | 45.9% |
| California: | 48.0% |
| This city: | 28.0 |
| State: | 28.1 |
| Salinas: | 23.1% |
| State: | 20.2% |
| This city: | 9.8% |
| State: | 11.2% |
| Salinas: | 6.7 |
| California: | 6.8 |
| Salinas: | 29.0% |
| California: | 31.5% |
| This city: | 54.9% |
| California: | 56.4% |
| Salinas: | 81.7% |
| State: | 80.9% |
More about Health and Nutrition of Salinas, CA Residents
| Local government employment and payroll (March 2022) | |||||
| Function | Full-time employees | Monthly full-time payroll | Average yearly full-time wage | Part-time employees | Monthly part-time payroll |
|---|---|---|---|---|---|
| Police Protection - Officers | 154 | $2,041,212 | $159,055 | 9 | $44,009 |
| Streets and Highways | 103 | $786,046 | $91,578 | 8 | $17,541 |
| Firefighters | 90 | $1,101,036 | $146,805 | 0 | $0 |
| Police - Other | 50 | $321,651 | $77,196 | 7 | $14,042 |
| Local Libraries | 41 | $225,896 | $66,116 | 37 | $57,242 |
| Financial Administration | 25 | $288,113 | $138,294 | 4 | $9,620 |
| Other Government Administration | 18 | $232,525 | $155,017 | 11 | $24,046 |
| Other and Unallocable | 15 | $119,518 | $95,614 | 3 | $6,628 |
| Housing and Community Development (Local) | 15 | $161,737 | $129,390 | 2 | $2,501 |
| Sewerage | 13 | $107,397 | $99,136 | 0 | $0 |
| Parks and Recreation | 9 | $67,073 | $89,431 | 56 | $57,801 |
| Judicial and Legal | 8 | $103,562 | $155,343 | 0 | $0 |
| Fire - Other | 4 | $37,289 | $111,867 | 3 | $10,886 |
| Airports | 4 | $14,322 | $42,966 | 0 | $0 |
| Totals for Government | 549 | $5,607,377 | $122,566 | 140 | $244,316 |
Salinas government finances - Expenditure in 2017 (per resident):
- Construction - Regular Highways: $4,904,000 ($30.46)
Housing and Community Development: $3,854,000 ($23.93)
Central Staff Services: $2,868,000 ($17.81)
Libraries: $2,673,000 ($16.60)
Police Protection: $872,000 ($5.42)
Air Transportation: $703,000 ($4.37)
Local Fire Protection: $622,000 ($3.86)
Sewerage: $372,000 ($2.31)
Parking Facilities: $261,000 ($1.62)
Parks and Recreation: $164,000 ($1.02)
- Current Operations - Police Protection: $47,498,000 ($294.98)
Local Fire Protection: $22,294,000 ($138.45)
Central Staff Services: $15,900,000 ($98.75)
Regular Highways: $10,513,000 ($65.29)
Housing and Community Development: $9,592,000 ($59.57)
Financial Administration: $6,859,000 ($42.60)
Parks and Recreation: $5,343,000 ($33.18)
Libraries: $4,643,000 ($28.83)
Sewerage: $3,941,000 ($24.48)
Protective Inspection and Regulation - Other: $2,501,000 ($15.53)
Health - Other: $1,691,000 ($10.50)
Air Transportation: $1,251,000 ($7.77)
Solid Waste Management: $975,000 ($6.06)
Parking Facilities: $676,000 ($4.20)
Water Utilities: $9,000 ($0.06)
- General - Interest on Debt: $3,917,000 ($24.33)
- Intergovernmental to Local - Other - General - Other: $2,587,000 ($16.07)
- Other Capital Outlay - General - Other: $1,532,000 ($9.51)
Parks and Recreation: $787,000 ($4.89)
Parking Facilities: $531,000 ($3.30)
Health - Other: $163,000 ($1.01)
Solid Waste Management: $120,000 ($0.75)
Police Protection: $1,000 ($0.01)
Salinas government finances - Revenue in 2017 (per resident):
- Charges - Other: $10,005,000 ($62.14)
Sewerage: $3,453,000 ($21.44)
Solid Waste Management: $2,905,000 ($18.04)
Air Transportation: $1,335,000 ($8.29)
Parks and Recreation: $423,000 ($2.63)
Parking Facilities: $389,000 ($2.42)
Regular Highways: $355,000 ($2.20)
- Federal Intergovernmental - Other: $3,946,000 ($24.51)
Housing and Community Development: $3,410,000 ($21.18)
Air Transportation: $757,000 ($4.70)
- Local Intergovernmental - Other: $1,290,000 ($8.01)
- Miscellaneous - General Revenue - Other: $2,289,000 ($14.22)
Special Assessments: $2,064,000 ($12.82)
Fines and Forfeits: $793,000 ($4.92)
Interest Earnings: $551,000 ($3.42)
Rents: $512,000 ($3.18)
Donations From Private Sources: $211,000 ($1.31)
- Revenue - Water Utilities: $9,000 ($0.06)
- State Intergovernmental - Other: $6,274,000 ($38.96)
Highways: $2,911,000 ($18.08)
Sewerage: $275,000 ($1.71)
General Local Government Support: $72,000 ($0.45)
- Tax - General Sales and Gross Receipts: $64,962,000 ($403.44)
Property: $31,703,000 ($196.89)
Public Utilities Sales: $20,734,000 ($128.77)
Occupation and Business License - Other: $5,031,000 ($31.24)
Other Selective Sales: $2,730,000 ($16.95)
Other License: $2,509,000 ($15.58)
Documentary and Stock Transfer: $213,000 ($1.32)
Salinas government finances - Debt in 2017 (per resident):
- Long Term Debt - Beginning Outstanding - Unspecified Public Purpose: $59,865,000 ($371.79)
Outstanding Unspecified Public Purpose: $55,841,000 ($346.80)
Retired Unspecified Public Purpose: $8,891,000 ($55.22)
Issue, Unspecified Public Purpose: $4,867,000 ($30.23)
Beginning Outstanding - Public Debt for Private Purpose: $2,132,000 ($13.24)
Outstanding Nonguaranteed - Industrial Revenue: $1,982,000 ($12.31)
Retired Nonguaranteed - Public Debt for Private Purpose: $150,000 ($0.93)
Salinas government finances - Cash and Securities in 2017 (per resident):
- Bond Funds - Cash and Securities: $6,598,000 ($40.98)
- Other Funds - Cash and Securities: $95,167,000 ($591.03)
- Sinking Funds - Cash and Securities: $10,694,000 ($66.41)
4.96% of this county's 2021 resident taxpayers lived in other counties in 2020 ($91,945 average adjusted gross income)
| Here: | 4.96% |
| California average: | 5.19% |
0.08% of residents moved from foreign countries ($1,276 average AGI)
Monterey County: 0.08% California average: 0.03%
Top counties from which taxpayers relocated into this county between 2020 and 2021:
| from Santa Cruz County, CA | |
| from Santa Clara County, CA | |
| from Los Angeles County, CA |
6.17% of this county's 2020 resident taxpayers moved to other counties in 2021 ($76,219 average adjusted gross income)
| Here: | 6.17% |
| California average: | 6.14% |
0.08% of residents moved to foreign countries ($1,055 average AGI)
Monterey County: 0.08% California average: 0.02%
Top counties to which taxpayers relocated from this county between 2020 and 2021:
| to Santa Cruz County, CA | |
| to Santa Clara County, CA | |
| to Los Angeles County, CA |
| Businesses in Salinas, CA | ||||
| Name | Count | Name | Count | |
|---|---|---|---|---|
| 7-Eleven | 8 | La-Z-Boy | 1 | |
| 99 Cents Only Stores | 1 | Lane Bryant | 1 | |
| AT&T | 4 | Lane Furniture | 2 | |
| Ace Hardware | 2 | LensCrafters | 1 | |
| Aeropostale | 1 | Little Caesars Pizza | 3 | |
| Applebee's | 1 | Macy's | 1 | |
| Ashley Furniture | 1 | Marriott | 2 | |
| AutoZone | 5 | Marshalls | 1 | |
| Baskin-Robbins | 2 | MasterBrand Cabinets | 5 | |
| Bath & Body Works | 1 | Mazda | 1 | |
| Bed Bath & Beyond | 1 | McDonald's | 10 | |
| Best Western | 2 | Motel 6 | 2 | |
| Blockbuster | 3 | Motherhood Maternity | 2 | |
| Burger King | 6 | New Balance | 2 | |
| CVS | 6 | New York & Co | 1 | |
| Carl\s Jr. | 4 | Nike | 14 | |
| Casual Male XL | 1 | Nissan | 1 | |
| Chevrolet | 1 | Office Depot | 1 | |
| Chuck E. Cheese's | 1 | OfficeMax | 1 | |
| Cinnabon | 1 | Old Navy | 1 | |
| Circle K | 1 | Olive Garden | 1 | |
| Cold Stone Creamery | 2 | Outback | 1 | |
| Comfort Inn | 1 | Outback Steakhouse | 1 | |
| Costco | 1 | Pac Sun | 1 | |
| Curves | 1 | Panda Express | 3 | |
| DHL | 1 | Papa John's Pizza | 1 | |
| Dairy Queen | 3 | Payless | 3 | |
| Days Inn | 1 | Penske | 1 | |
| Dennys | 3 | PetSmart | 1 | |
| Discount Tire | 1 | Pier 1 Imports | 1 | |
| Domino's Pizza | 2 | Pizza Hut | 1 | |
| Econo Lodge | 1 | Quality | 1 | |
| El Pollo Loco | 2 | Quiznos | 1 | |
| Ethan Allen | 1 | RadioShack | 4 | |
| Famous Footwear | 1 | Ramada | 1 | |
| Fashion Bug | 1 | Red Lobster | 1 | |
| FedEx | 13 | Rite Aid | 2 | |
| Finish Line | 1 | SAS Shoes | 1 | |
| Firestone Complete Auto Care | 1 | Sears | 3 | |
| Foot Locker | 1 | Sephora | 1 | |
| Ford | 1 | Spencer Gifts | 1 | |
| Forever 21 | 1 | Sprint Nextel | 1 | |
| GNC | 1 | Starbucks | 10 | |
| GameStop | 3 | Subway | 15 | |
| Gap | 1 | Super 8 | 1 | |
| Goodwill | 1 | T-Mobile | 8 | |
| H&R Block | 4 | Taco Bell | 5 | |
| Holiday Inn | 1 | Target | 1 | |
| Hollister Co. | 1 | The Room Place | 1 | |
| Home Depot | 1 | Torrid | 1 | |
| HomeTown Buffet | 1 | Toyota | 1 | |
| Honda | 1 | Toys"R"Us | 3 | |
| Hot Topic | 1 | U-Haul | 3 | |
| Howard Johnson | 1 | UPS | 18 | |
| IHOP | 1 | Vans | 6 | |
| JCPenney | 1 | Verizon Wireless | 2 | |
| Jack In The Box | 4 | Victoria's Secret | 1 | |
| Jamba Juice | 2 | Volkswagen | 1 | |
| Jones New York | 1 | Vons | 2 | |
| Journeys | 1 | Walgreens | 2 | |
| KFC | 3 | Walmart | 2 | |
| Kmart | 1 | Wendy's | 2 | |
| Kohl's | 1 | Wet Seal | 1 | |
| Kroger | 4 | YMCA | 2 | |
Strongest AM radio stations in Salinas:
- KTOM (1380 AM; 5 kW; SALINAS, CA; Owner: CLEAR CHANNEL BROADCASTING LICENSES, INC.)
- KYAA (1200 AM; 25 kW; SOQUEL, CA; Owner: PEOPLE'S RADIO, INC.)
- KDBV (980 AM; 10 kW; SALINAS, CA; Owner: WOLFHOUSE RADIO GROUP, INC.)
- KSRK (540 AM; 10 kW; CARMEL VALLEY, CA; Owner: PEOPLE'S RADIO, INC.)
- KION (1460 AM; 10 kW; SALINAS, CA)
- KTGE (1570 AM; 5 kW; SALINAS, CA; Owner: WOLFHOUSE RADIO GROUP, INC.)
- KKMC (880 AM; 10 kW; GONZALES, CA; Owner: MONTEREY COUNTY BROADCASTERS, INC.)
- KMBX (700 AM; 10 kW; SOLEDAD, CA; Owner: ENTRAVISION HOLDINGS, LLC)
- KLOK (1170 AM; 50 kW; SAN JOSE, CA; Owner: ENTRAVISION HOLDINGS, LLC)
- KIDD (630 AM; 1 kW; MONTEREY, CA; Owner: BUCKLEY COMMUNICATIONS, INC.)
- KNBR (680 AM; 50 kW; SAN FRANCISCO, CA; Owner: KNBR LICO, INC.)
- KGO (810 AM; 50 kW; SAN FRANCISCO, CA; Owner: KGO-AM RADIO, INC.)
- KSCO (1080 AM; 10 kW; SANTA CRUZ, CA)
Strongest FM radio stations in Salinas:
- KDON-FM (102.5 FM; SALINAS, CA; Owner: CLEAR CHANNEL BROADCASTING LICENSES, INC.)
- K202DU (88.3 FM; SAN JUAN BAUTISTA, CA; Owner: CALVARY CHAPEL OF TWIN FALLS, INC.)
- KBTU (93.5 FM; HOLLISTER, CA; Owner: MAPLETON COMMUNICATIONS, L.L.C.)
- KUSP (88.9 FM; SANTA CRUZ, CA; Owner: PATAPHYSICAL B/CING. FOUNDATION,INC.)
- K260AA (99.9 FM; CARMEL VALLEY, CA; Owner: ENTRAVISION HOLDINGS, LLC)
- KWAV (96.9 FM; MONTEREY, CA; Owner: BUCKLEY BROADCASTING OF MONTEREY)
- KTOM-FM (100.7 FM; SALINAS, CA; Owner: CLEAR CHANNEL BROADCASTING LICENSES, INC.)
- KLVM (89.7 FM; PRUNEDALE, CA; Owner: PRUNEDALE EDUCATIONAL ASSOCIATION)
- K291AE (106.1 FM; SEASIDE, CA; Owner: MAPELTON COMMUNICATIONS, LLC)
- K265DG (100.9 FM; HOLLISTER, CA; Owner: CLEAR CHANNEL BROADCASTING LICENSES, INC.)
- K206BQ (89.1 FM; HOLLISTER, CA; Owner: PATAPHYSICAL BROADCASTING FOUNDATION, INC.)
- KRAY-FM (103.5 FM; SALINAS, CA; Owner: WOLFHOUSE RADIO GROUP, INC.)
- KHRI (90.7 FM; HOLLISTER, CA; Owner: EDUCATIONAL MEDIA FOUNDATION)
- KEBV (97.9 FM; SALINAS, CA; Owner: WOLFHOUSE RADIO GROUP, INC.)
- KSQL (99.1 FM; SANTA CRUZ, CA; Owner: TMS LICENSE CALIFORNIA, INC)
- KOCN (105.1 FM; PACIFIC GROVE, CA; Owner: CLEAR CHANNEL BROADCASTING LICENSES, INC.)
- KKUP (91.5 FM; CUPERTINO, CA; Owner: ASSURANCE SCIENCES FOUNDATION)
- KBRG (100.3 FM; SAN JOSE, CA; Owner: ENTRAVISION HOLDINGS, LLC)
- KSEA (107.9 FM; GREENFIELD, CA; Owner: FARMWORKER EDU'AL RADIO NETWORK, INC)
- K240AK (95.9 FM; SOLEDAD, CA; Owner: CALVARY CHAPEL OF TWIN FALLS, INC.)
TV broadcast stations around Salinas:
- KSBW (Channel 8; SALINAS, CA; Owner: HEARST-ARGYLE STATIONS, INC.)
- KCBA (Channel 35; SALINAS, CA; Owner: SEAL ROCK BROADCASTERS, L.L.C.)
- KCAH (Channel 25; WATSONVILLE, CA; Owner: KTEH FOUNDATION)
- K29AB (Channel 29; MONTEREY, ETC., CA; Owner: KTVU PARTNERSHIP)
- KMUV-LP (Channel 23; MONTEREY, CA; Owner: SAINTE PARTNERS II, L.P.)
- KSMS-TV (Channel 67; MONTEREY, CA; Owner: ENTRAVISION HOLDINGS, LLC)
- KION-TV (Channel 46; MONTEREY, CA; Owner: ACKERLEY MEDIA GROUP, INC.)
- K15CU (Channel 15; SALINAS, CA; Owner: TELEMUNDO OF NORTHERN CALIFORNIA LIC. CORP.)
- K42DT (Channel 42; COALINGA, CA; Owner: VENTURE TECHNOLOGIES GROUP, LLC)
- KMCE-LP (Channel 43; MONTEREY, CA; Owner: SCOTTS VALLEY GROUP, INC. d/b as MARCOM)
- KMMD-CA (Channel 3; SALINAS, CA; Owner: CABALLERO TELEVISION TEXAS, L.L.C.)
- K59AY (Channel 59; HOLLISTER, CA; Owner: ACKERLEY MEDIA GROUP, INC.)
- K53DT (Channel 53; MONTEREY, CA; Owner: TRINITY BROADCASTING NETWORK)
- National Bridge Inventory (NBI) Statistics
- 84Number of bridges
- 1,224ft / 373mTotal length
- $9,544,000Total costs
- 1,832,006Total average daily traffic
- 216,293Total average daily truck traffic
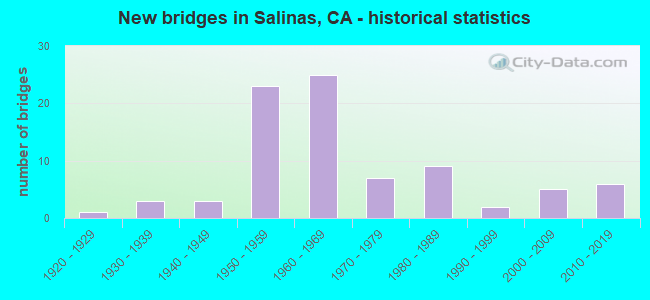
- New bridges - historical statistics
- 11920-1929
- 31930-1939
- 31940-1949
- 231950-1959
- 251960-1969
- 71970-1979
- 91980-1989
- 21990-1999
- 52000-2009
- 62010-2019
FCC Registered Antenna Towers: 413 (See the full list of FCC Registered Antenna Towers)
FCC Registered Commercial Land Mobile Towers: 15 (See the full list of FCC Registered Commercial Land Mobile Towers in Salinas, CA)
FCC Registered Private Land Mobile Towers: 16 (See the full list of FCC Registered Private Land Mobile Towers)
FCC Registered Broadcast Land Mobile Towers: 129 (See the full list of FCC Registered Broadcast Land Mobile Towers)
FCC Registered Microwave Towers: 167 (See the full list of FCC Registered Microwave Towers in this town)
FCC Registered Paging Towers: 40 (See the full list of FCC Registered Paging Towers)
FCC Registered Maritime Coast & Aviation Ground Towers: 7 (See the full list of FCC Registered Maritime Coast & Aviation Ground Towers)
FCC Registered Amateur Radio Licenses: 466 (See the full list of FCC Registered Amateur Radio Licenses in Salinas)
FAA Registered Aircraft Manufacturers and Dealers: 6 (See the full list of FAA Registered Manufacturers and Dealers in Salinas)
FAA Registered Aircraft: 139 (See the full list of FAA Registered Aircraft)
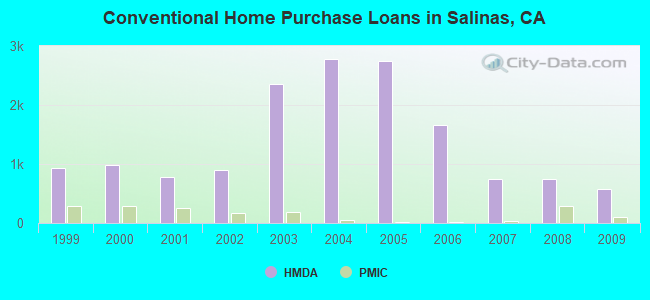
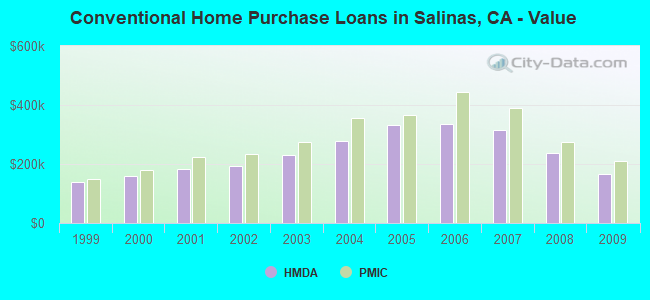
| Home Mortgage Disclosure Act Aggregated Statistics For Year 2009 (Based on 20 full and 6 partial tracts) | ||||||||||||||
| A) FHA, FSA/RHS & VA Home Purchase Loans | B) Conventional Home Purchase Loans | C) Refinancings | D) Home Improvement Loans | E) Loans on Dwellings For 5+ Families | F) Non-occupant Loans on < 5 Family Dwellings (A B C & D) | G) Loans On Manufactured Home Dwelling (A B C & D) | ||||||||
|---|---|---|---|---|---|---|---|---|---|---|---|---|---|---|
| Number | Average Value | Number | Average Value | Number | Average Value | Number | Average Value | Number | Average Value | Number | Average Value | Number | Average Value | |
| LOANS ORIGINATED | 889 | $212,223 | 581 | $167,010 | 534 | $224,011 | 27 | $136,001 | 5 | $2,009,160 | 261 | $136,851 | 1 | $106,800 |
| APPLICATIONS APPROVED, NOT ACCEPTED | 65 | $212,148 | 62 | $204,758 | 76 | $248,768 | 4 | $151,180 | 0 | $0 | 27 | $147,289 | 1 | $104,060 |
| APPLICATIONS DENIED | 200 | $195,579 | 190 | $164,375 | 427 | $250,349 | 28 | $73,544 | 1 | $1,075,200 | 121 | $159,905 | 15 | $77,416 |
| APPLICATIONS WITHDRAWN | 120 | $212,646 | 95 | $151,103 | 157 | $231,964 | 9 | $85,337 | 2 | $323,350 | 59 | $152,557 | 4 | $84,070 |
| FILES CLOSED FOR INCOMPLETENESS | 24 | $188,608 | 34 | $174,115 | 65 | $248,429 | 3 | $162,257 | 0 | $0 | 16 | $152,969 | 0 | $0 |
Detailed mortgage data for all 25 tracts in Salinas, CA
| Private Mortgage Insurance Companies Aggregated Statistics For Year 2009 (Based on 19 full and 5 partial tracts) | ||||||
| A) Conventional Home Purchase Loans | B) Refinancings | C) Non-occupant Loans on < 5 Family Dwellings (A & B) | ||||
|---|---|---|---|---|---|---|
| Number | Average Value | Number | Average Value | Number | Average Value | |
| LOANS ORIGINATED | 94 | $209,101 | 2 | $298,175 | 0 | $0 |
| APPLICATIONS APPROVED, NOT ACCEPTED | 63 | $245,325 | 6 | $359,155 | 1 | $124,000 |
| APPLICATIONS DENIED | 10 | $230,809 | 3 | $278,407 | 0 | $0 |
| APPLICATIONS WITHDRAWN | 8 | $229,382 | 2 | $273,120 | 0 | $0 |
| FILES CLOSED FOR INCOMPLETENESS | 6 | $245,540 | 0 | $0 | 1 | $234,000 |
2005 - 2018 National Fire Incident Reporting System (NFIRS) incidents
- Fire incident types reported to NFIRS in Salinas, CA
- 1,09449.3%Outside Fires
- 59326.7%Structure Fires
- 45820.7%Mobile Property/Vehicle Fires
- 723.2%Other
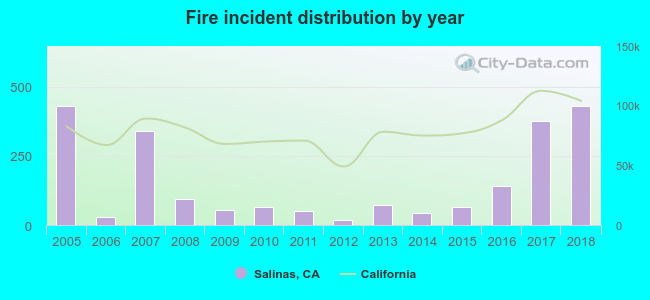 Based on the data from the years 2005 - 2018 the average number of fires per year is 158. The highest number of fires - 432 took place in 2005, and the least - 19 in 2012. The data has a declining trend.
 When looking into fire subcategories, the most incidents belonged to: Outside Fires (49.3%), and Structure Fires (26.7%).
Fire-safe hotels and motels in Salinas, California:
- Quality Inn, 144 Kern St, Salinas, California 93905 , Phone: (831) 758-8850, Fax: (831) 758-3611
- Howard Johnson Inn, 131 John St, Salinas, California 93901 , Phone: (831) 757-1020, Fax: (831) 422-9541
- El Rey Motel, 443 W Market St, Salinas, California 93901 , Phone: (831) 422-0497
- Econo Lodge, 180 S Sanborn Rd, Salinas, California 93905 , Phone: (831) 422-5111, Fax: (831) 783-0307
- Good Nite Inn Salinas, 545 Work St, Salinas, California 93901 , Phone: (831) 757-9667, Fax: (831) 757-9681
- Comfort Inn & Suites, 181 Kern St, Salinas, California 93905 , Phone: (831) 770-1400, Fax: (831) 770-1600
- America's Best Value Inn, 1030 Fairview Ave, Salinas, California 93905 , Phone: (831) 422-6486, Fax: (831) 422-8712
- Residence Inn Salinas, 17215 El Rancho Way, Salinas, California 93912 , Phone: (831) 775-0410, Fax: (831) 775-0411
- 5 other hotels and motels
| Most common first names in Salinas, CA among deceased individuals | ||
| Name | Count | Lived (average) |
|---|---|---|
| John | 499 | 73.4 years |
| William | 446 | 74.4 years |
| Mary | 445 | 79.1 years |
| James | 384 | 71.6 years |
| Robert | 370 | 70.9 years |
| George | 254 | 75.8 years |
| Frank | 248 | 75.0 years |
| Charles | 244 | 72.3 years |
| Maria | 237 | 72.9 years |
| Dorothy | 209 | 78.3 years |
| Most common last names in Salinas, CA among deceased individuals | ||
| Last name | Count | Lived (average) |
|---|---|---|
| Smith | 204 | 74.9 years |
| Johnson | 163 | 74.9 years |
| Garcia | 134 | 68.3 years |
| Martinez | 107 | 67.3 years |
| Rodriguez | 106 | 72.3 years |
| Williams | 93 | 73.6 years |
| Miller | 91 | 74.0 years |
| Lopez | 90 | 65.5 years |
| Brown | 90 | 73.9 years |
| Moore | 83 | 74.3 years |
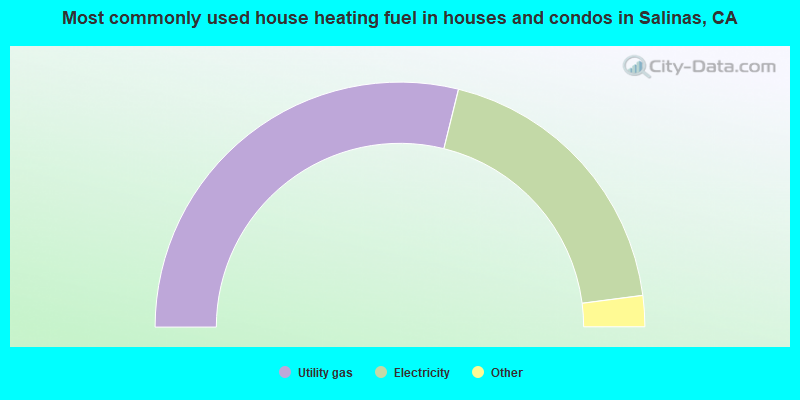
- 57.7%Utility gas
- 38.2%Electricity
- 1.8%No fuel used
- 1.4%Solar energy
- 0.3%Other fuel
- 0.3%Wood
- 0.3%Bottled, tank, or LP gas
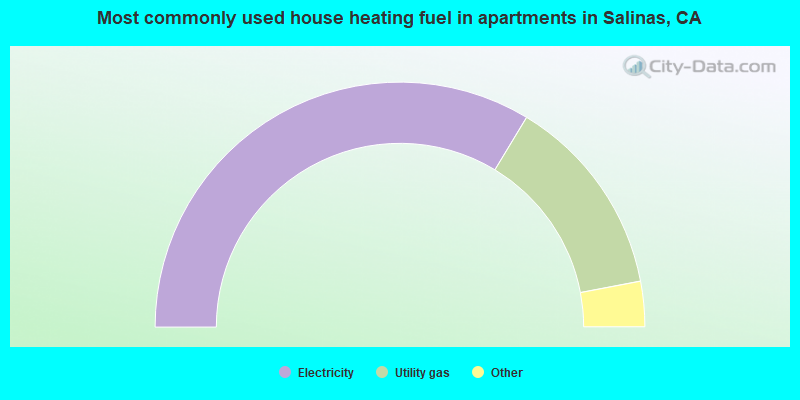
- 67.3%Electricity
- 26.7%Utility gas
- 3.9%No fuel used
- 1.4%Bottled, tank, or LP gas
- 0.7%Wood
Salinas compared to California state average:
- Black race population percentage significantly below state average.
- Hispanic race population percentage above state average.
- Percentage of population with a bachelor's degree or higher below state average.
Salinas, CA compared to other similar cities:
Salinas on our top lists:
- #5 on the list of "Top 101 cities with largest percentage of females in industries: agriculture, forestry, fishing and hunting (population 50,000+)"
- #5 on the list of "Top 101 cities with largest percentage of males in industries: agriculture, forestry, fishing and hunting (population 50,000+)"
- #7 on the list of "Top 101 cities with largest percentage of males in occupations: farming, fishing, and forestry occupations (population 50,000+)"
- #7 on the list of "Top 101 cities with largest percentage of females in occupations: farming, fishing, and forestry occupations (population 50,000+)"
- #10 on the list of "Top 101 cities with the smallest temperature differences during a year (population 50,000+)"
- #16 on the list of "Top 101 cities with the largest sunshine amount differences during a year (population 50,000+)"
- #23 on the list of "Top 101 cities with the largest city-data.com crime index per police officer (population 50,000+)"
- #30 on the list of "Top 100 least-educated cities (pop. 50,000+)"
- #37 on the list of "Top 101 cities with the most cars per house, population 50,000+"
- #40 on the list of "Top 101 cities with largest percentage of females in occupations: personal care and service occupations (population 50,000+)"
- #40 on the list of "Top 101 cities with the highest percentage of family households, population 100,000+"
- #43 on the list of "Top 101 cities with the lowest number of days clear of clouds (population 50,000+)"
- #43 on the list of "Top 101 cities with the highest number of days clear of clouds (population 50,000+)"
- #47 on the list of "Top 101 cities with the highest average sunshine amount (population 50,000+)"
- #52 on the list of "Top 101 cities with the lowest number of police officers per 1000 residents (population 50,000+)"
- #55 on the list of "Top 101 cities with the lowest percentage of English-only speaking households, population 50,000+"
- #56 on the list of "Top 101 cities with largest percentage of females in occupations: material moving occupations (population 50,000+)"
- #58 on the list of "Top 101 cities with the highest number of murders per 100,000 residents, excludes tourist destinations and others with a lot of outsiders visiting based on city industries data (population 50,000+)"
- #58 on the list of "Top 101 cities with the highest number of auto thefts per 100,000 residents, excludes tourist destinations and others with a lot of outsiders visiting based on city industries data (population 50,000+)"
- #58 on the list of "Top 101 cities with the highest maximum monthly sunshine amount (population 50,000+)"
- #15 (93905) on the list of "Top 101 zip codes with the largest percentage of taxpayers using paid preparers for 2012 taxes (pop 5,000+)"
- #51 (93905) on the list of "Top 101 zip codes with the smallest percentage of taxpayers reporting profit/loss from business in 2012 (pop 5,000+)"
- #66 (93905) on the list of "Top 101 zip codes with the largest percentage of returns reporting salary or wage in 2012 (pop 5,000+)"
- #70 (93905) on the list of "Top 101 zip codes with the smallest percentage of taxpayers reporting net capital gain/loss in 2012 (pop 5,000+)"
- #101 (93905) on the list of "Top 101 zip codes with the lowest charity contributions deductions as a percentage of AGI in 2012 (pop 5,000+)"
- #15 on the list of "Top 101 counties with the highest Nitrogen Dioxide air pollution readings in 2012 (ppm)"
- #20 on the list of "Top 101 counties with the lowest surface withdrawal of fresh water for public supply (pop. 50,000+)"
- #33 on the list of "Top 101 counties with the highest number of births per 1000 residents 2007-2013"
- #44 on the list of "Top 101 counties with the lowest Particulate Matter (PM2.5) Annual air pollution readings in 2012 (µg/m3)"
- #54 on the list of "Top 101 counties with the highest Particulate Matter (PM10) Annual air pollution readings in 2012 (µg/m3)"

|
|
Total of 403 patent applications in 2008-2024.