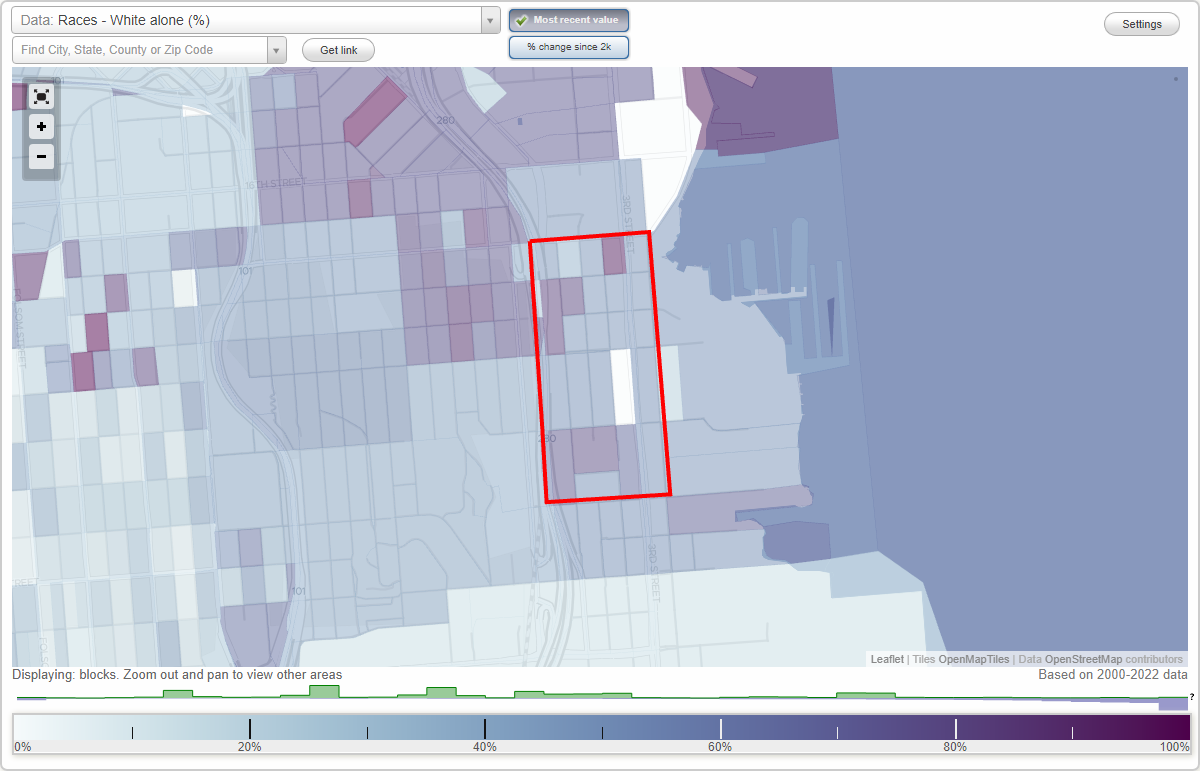
Dogpatch neighborhood in San Francisco, California (CA), 94107 detailed profile
Settings
X

Business Search - 14 Million verified businesses
Area: 0.175 square miles
Population: 1,734
Population density:
| Dogpatch: | 9,891 people per square mile |
| San Francisco: | 17,313 people per square mile |

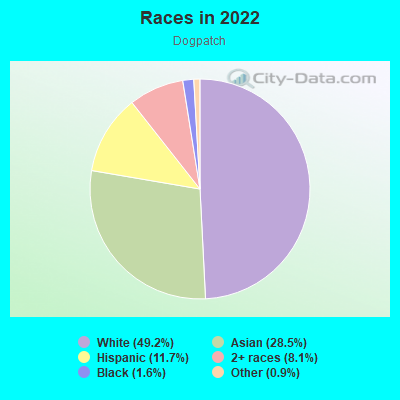
- 85349.2%White
- 49428.5%Asian
- 20211.7%Hispanic or Latino
- 1418.1%Two or more races
- 271.6%Black
- 150.9%Some other race
Median household income in 2022:
| Dogpatch: | $242,063 |
| San Francisco: | $136,692 |
Distribution of median household income
![Distribution of median household income]()
- 13Less than $10,000
- 72$10,000 to $19,999
- 124$20,000 to $29,999
- 6$30,000 to $39,999
- 25$40,000 to $49,999
- 23$50,000 to $59,999
- 30$60,000 to $74,999
- 28$75,000 to $99,999
- 58$100,000 to $124,999
- 56$125,000 to $149,999
- 140$150,000 to $199,999
- 501$200,000 or more

Distribution of owner-occupied house/condo value
![Distribution of owner-occupied house/condo value]()
- 47$250,000 to $299,999
- 3$400,000 to $499,999
- 17$750,000 to $999,999
- 169$1,000,000 or more

Distribution of rent paid by renters
![Distribution of rent paid by renters]()
- 38$600 to $699
- 16$700 to $799
- 35$800 to $899
- 9$1,000 to $1,249
- 22$1,250 to $1,499
- 10$1,500 to $1,999
- 610$2,000 or more

Median rent in 2022:
| Dogpatch: | $3,405 |
| San Francisco: | $2,001 |
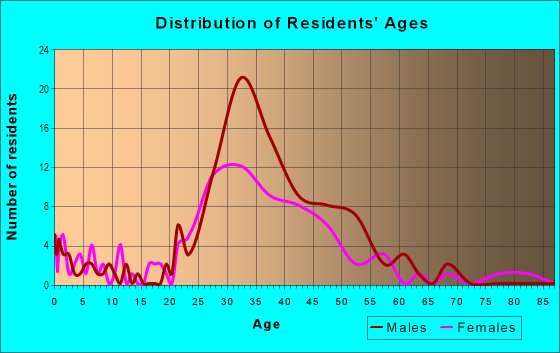
| Males: | 930 |
| Females: | 804 |
Males:
| This neighborhood: | 35.3 years |
| Whole city: | 40.3 years |
| This neighborhood: | 36.3 years |
| Whole city: | 40.5 years |
Average household size:
| Dogpatch: | 10.2 people |
| San Francisco: | 2.2 people |
Percentage of family households:
| Dogpatch: | 35.8% |
| San Francisco: | 30.3% |
| Here: | 33.7% |
| San Francisco: | 35.3% |
Percentage of married-couple families with children (among all households):
| Dogpatch: | 39.8% |
| San Francisco: | 35.9% |
Percentage of single-mother households (among all households):
| Dogpatch: | 7.7% |
| San Francisco: | 6.0% |
Percentage of never married males 15 years old and over:
Percentage of never married females 15 years old and over:
| Dogpatch: | 30.6% |
| San Francisco: | 24.6% |
Percentage of never married females 15 years old and over:
| Dogpatch: | 24.3% |
| city: | 19.9% |
Percentage of people that speak English not well or not at all:
| Dogpatch: | 0.1% |
| San Francisco: | 10.9% |
Percentage of people born in this state:
Percentage of people born in another U.S. state:
Percentage of native residents but born outside the U.S.:
Percentage of foreign born residents:
| Here: | 30.7% |
| San Francisco: | 40.8% |
Percentage of people born in another U.S. state:
| Dogpatch: | 41.6% |
| San Francisco: | 23.4% |
Percentage of native residents but born outside the U.S.:
| Here: | 2.5% |
| city: | 2.6% |
Percentage of foreign born residents:
| Here: | 25.2% |
| San Francisco: | 33.2% |
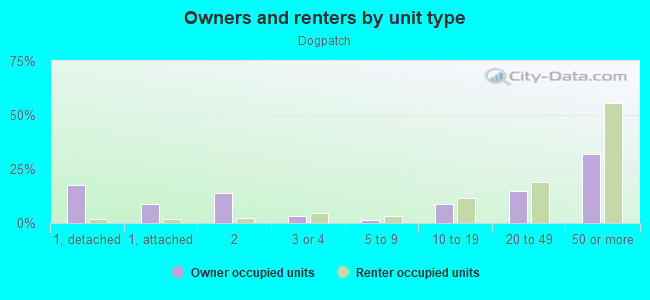
Owner-occupied
Renter-occupied

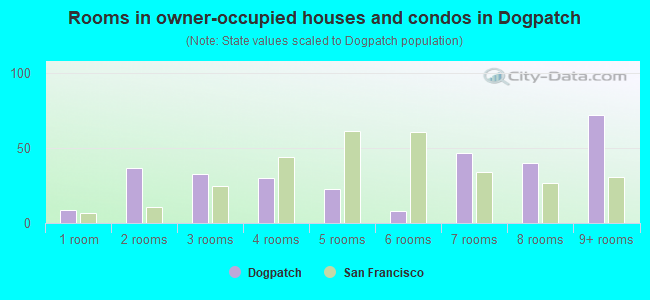
- Rooms in owner-occupied houses and condos in Dogpatch
- 91 room
- 372 rooms
- 333 rooms
- 304 rooms
- 235 rooms
- 86 rooms
- 477 rooms
- 408 rooms
- 729+ rooms
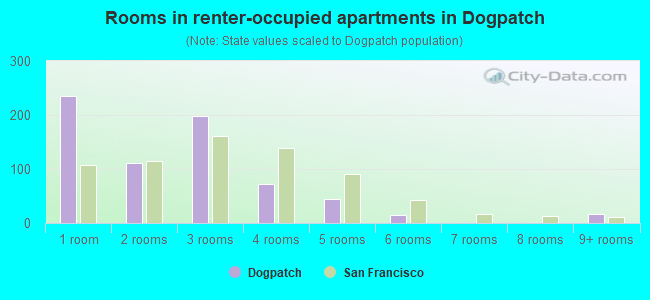
- Rooms in renter-occupied apartments in Dogpatch
- 2351 room
- 1122 rooms
- 1983 rooms
- 734 rooms
- 455 rooms
- 146 rooms
- 07 rooms
- 08 rooms
- 169+ rooms
Owner-occupied
Renter-occupied
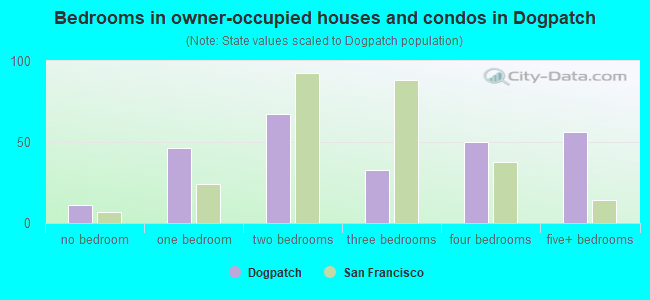
- Bedrooms in owner-occupied houses and condos in Dogpatch
- 11no bedroom
- 461 bedroom
- 672 bedrooms
- 333 bedrooms
- 504 bedrooms
- 565+ bedrooms
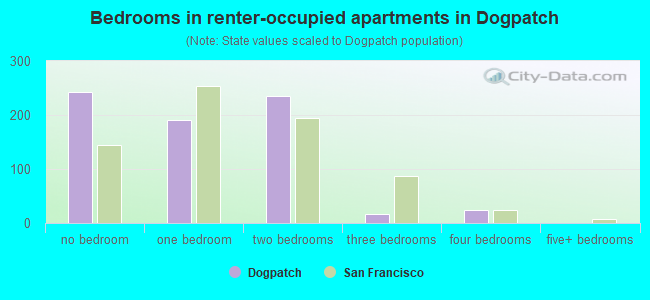
- Bedrooms in renter-occupied apartments in Dogpatch
- 243no bedroom
- 1911 bedroom
- 2352 bedrooms
- 173 bedrooms
- 244 bedrooms
- 05+ bedrooms
Average number of cars or other vehicles available in houses/condos:
Average number of cars or other vehicles available in apartments:
| This neighborhood: | 1.5 |
| San Francisco: | 1.5 |
Average number of cars or other vehicles available in apartments:
| Here: | 0.8 |
| city: | 0.8 |
Percentage of units with a mortgage:
| Dogpatch: | 86.7% |
| San Francisco: | 62.3% |
Housing prices:
- Average estimated value of detached houses in 2022 (4.1% of all units):
Dogpatch: $1,832,487 San Francisco: $1,942,973
- Average estimated value of townhouses or other attached units in 2022 (3.1% of all units):
This neighborhood: $2,406,335 city: $1,528,422
- Average estimated value of housing units in 2-unit structures in 2022 (5.6% of all units):
This neighborhood: $2,001,160 San Francisco: $1,536,932
- Average estimated '22 value of housing units in 3-to-4-unit structures (3.6% of all units):
Dogpatch: $1,866,676 city: $1,622,965
- Average estimated '22 value of housing units in 5-or-more-unit structures (53.6% of all units):
Dogpatch: $1,255,421 San Francisco: $1,155,972
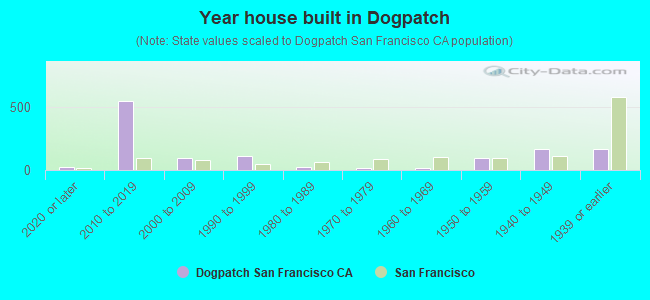
- Year house built in Dogpatch
- 222020 or later
- 5492010 to 2019
- 972000 to 2009
- 1141990 to 1999
- 261980 to 1989
- 181970 to 1979
- 171960 to 1969
- 971950 to 1959
- 1701940 to 1949
- 1661939 or earlier
City-data.com crime index for city in 2020 (higher means more crime):
| City: | 387.4 |
| U.S. average: | 219.5 |
Travel time to work (commute)
![Travel time to work (commute)]()
- 38Less than 5 minutes
- 495 to 9 minutes
- 17510 to 14 minutes
- 16615 to 19 minutes
- 7820 to 24 minutes
- 5525 to 29 minutes
- 15630 to 34 minutes
- 3435 to 39 minutes
- 7540 to 44 minutes
- 13545 to 59 minutes
- 10460 to 89 minutes
- 7590 or more minutes

Means of transportation to work
![Means of transportation to work]()
- 16.7%228Drove a car alone
- 4.6%63Carpooled
- 4.3%58Bus
- 2.4%33Subway or elevated rail
- 11.4%155Long-distance train or commuter rail
- 2.1%28Light rail, streetcar or trolley
- 1.5%21Taxi
- 3.0%41Motorcycle
- 7.3%99Bicycle
- 16.9%231Walked
- 3.0%41Other means
- 28.1%383Worked at home

Time leaving home to go to work
![Time leaving home to go to work]()
- 3112:00 a.m. to 4:59 a.m.
- 75:00 a.m. to 5:29 a.m.
- 165:30 a.m. to 5:59 a.m.
- 56:00 a.m. to 6:29 a.m.
- 1056:30 a.m. to 6:59 a.m.
- 2627:00 a.m. to 7:29 a.m.
- 1107:30 a.m. to 7:59 a.m.
- 2098:00 a.m. to 8:29 a.m.
- 1498:30 a.m. to 8:59 a.m.
- 1709:00 a.m. to 9:59 a.m.
- 6210:00 a.m. to 10:59 a.m.
- 1811:00 a.m. to 11:59 a.m.
- 2712:00 p.m. to 3:59 p.m.
- 344:00 p.m. to 11:59 p.m.

Occupations of males:
- Percentage of males in management occupations (except farmers):
Here: 28.8% city: 17.2%
- Percentage of males in business and financial operations occupations:
Here: 8.8% city: 8.9%
- Percentage of males in computer and mathematical occupations:
Here: 27.0% city: 14.6%
- Percentage of males in architecture and engineering occupations:
Here: 6.1% city: 4.0%
- Percentage of males in life, physical, and social science occupations:
Here: 6.0% city: 2.4%
- Percentage of males in legal occupations:
Here: 1.3% city: 2.5%
- Percentage of males in education, training, and library occupations:
Here: 2.0% city: 3.4%
- Percentage of males in arts, design, entertainment, sports, and media occupations:
Here: 5.5% city: 4.9%
- Percentage of males in healthcare practitioners and technical occupations:
Here: 4.1% city: 3.2%
- Percentage of males in service occupations:
Here: 2.4% city: 11.8%
- Percentage of males in sales and office occupations:
Here: 4.4% city: 13.5%
- Percentage of males in construction, extraction, and maintenance occupations:
Here: 3.1% city: 3.1%
Occupations of females:
- Percentage of females in management occupations (except farmers):
Here: 17.2% city: 15.8%
- Percentage of females in business and financial operations occupations:
Here: 10.5% city: 11.5%
- Percentage of females in computer and mathematical occupations:
Here: 15.2% city: 5.1%
- Percentage of females in architecture and engineering occupations:
Here: 3.9% city: 1.6%
- Percentage of females in life, physical, and social science occupations:
Here: 11.3% city: 2.9%
- Percentage of females in legal occupations:
Here: 2.4% city: 3.0%
- Percentage of females in education, training, and library occupations:
Here: 3.6% city: 7.1%
- Percentage of females in arts, design, entertainment, sports, and media occupations:
Here: 2.4% city: 5.1%
- Percentage of females in healthcare practitioners and technical occupations:
Here: 18.4% city: 8.4%
- Percentage of females in service occupations:
Here: 6.6% city: 15.4%
- Percentage of females in sales and office occupations:
Here: 6.3% city: 19.3%
- Percentage of females in production occupations:
Here: 2.0% city: 1.5%
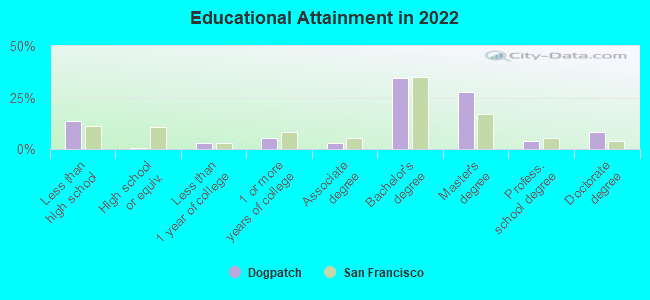
Education in this neighborhood (subdivision or community):
- Percentage of people 3 years and older in K-12 schools:
Dogpatch: 10.3% San Francisco: 9.7%
- Percentage of people 3 years and older in undergraduate colleges:
Dogpatch: 3.5% San Francisco: 4.8%
- Percentage of people 3 years and older in grad. or professional schools:
Dogpatch: 5.4% San Francisco: 2.6%
- Percentage of students K-12 enrolled in private schools:
Dogpatch: 50.6% San Francisco: 36.5%
Percentage of population below poverty level:
| Dogpatch: | 1.9% |
| San Francisco: | 10.4% |
Median year owner moved in (as recorded in 2022):
Median year renter moved in (as recorded in 2022):
| Dogpatch: | 2012 |
| San Francisco: | 2007 |
Median year renter moved in (as recorded in 2022):
| Dogpatch: | 2017 |
| San Francisco: | 2019 |
Percentage of married-couple families with both working:
| Dogpatch: | 72.2% |
| San Francisco: | 75.9% |
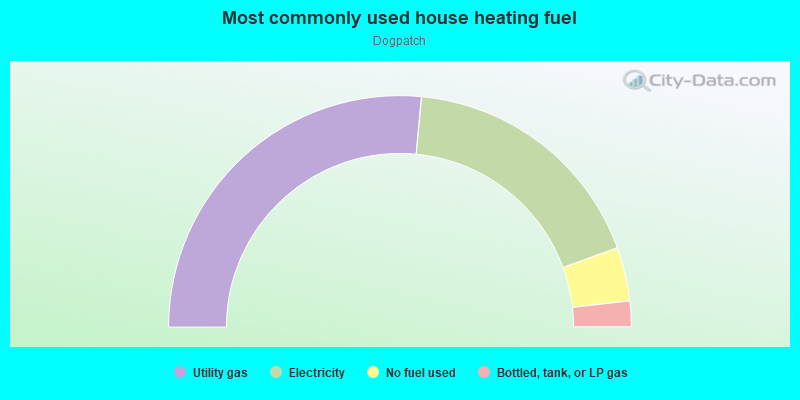
- 53.0%Utility gas
- 35.9%Electricity
- 7.5%No fuel used
- 3.6%Bottled, tank, or LP gas
Limited-access highways (interstate or state) in this neighborhood:
I- 280
Length: 0.61 miles
Direction: N-S
Address range: 400 to 898
Direction: N-S
Address range: 400 to 898
Roads and streets:
3rd St
Length: 0.91 miles
Directions: N-S, SE-NW, SW-NE
Address range: 2001 to 2499
Directions: N-S, SE-NW, SW-NE
Address range: 2001 to 2499
Iowa St
Length: 0.79 miles
Direction: N-S
Address range: 1 to 847
Direction: N-S
Address range: 1 to 847
Indiana St
Length: 0.55 miles
Direction: N-S
Address range: 500 to 1099
Direction: N-S
Address range: 500 to 1099
Tennessee St
Length: 0.55 miles
Direction: N-S
Address range: 600 to 1198
Direction: N-S
Address range: 600 to 1198
Illinois St
Length: 0.53 miles
Direction: N-S
Address range: 600 to 1199
Direction: N-S
Address range: 600 to 1199
Minnesota St
Length: 0.48 miles
Direction: N-S
Address range: 500 to 1099
Direction: N-S
Address range: 500 to 1099
20th St
Length: 0.47 miles
Directions: E-W, SW-NE
Address range: 600 to 1149
Directions: E-W, SW-NE
Address range: 600 to 1149
19th St
Length: 0.34 miles
Direction: E-W
Address range: 500 to 1050
Direction: E-W
Address range: 500 to 1050
22nd St
Length: 0.34 miles
Direction: E-W
Address range: 600 to 1149
Direction: E-W
Address range: 600 to 1149
18th St
Length: 0.33 miles
Direction: E-W
Address range: 500 to 1049
Direction: E-W
Address range: 500 to 1049
Mariposa St
Length: 0.33 miles
Direction: E-W
Address range: 400 to 899
Direction: E-W
Address range: 400 to 899
Tubbs St
Length: 0.13 miles
Direction: E-W
Address range: 1 to 199
Direction: E-W
Address range: 1 to 199
Railroad features:
Union Pacific RR
Length: 0.19 miles
Directions: N-S, SE-NW, SW-NE
Directions: N-S, SE-NW, SW-NE