Estimated zip code population in 2022: 30,088 Zip code population in 2010: 26,599 Zip code population in 2000: 17,368
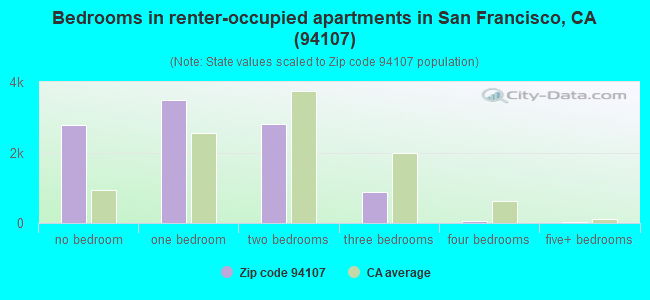
Houses and condos: 18,762 Renter-occupied apartments: 9,926
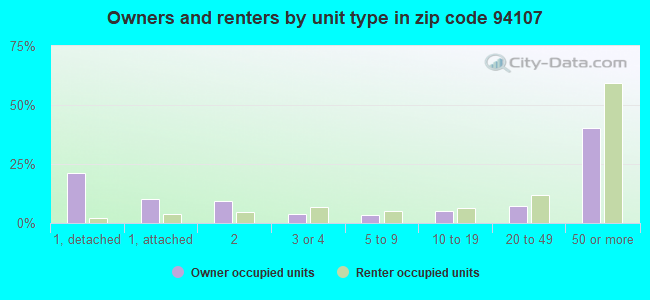
% of renters here:
64%
State:
44%
March 2022 cost of living index in zip code 94107: 130.2 (high, U.S. average is 100)
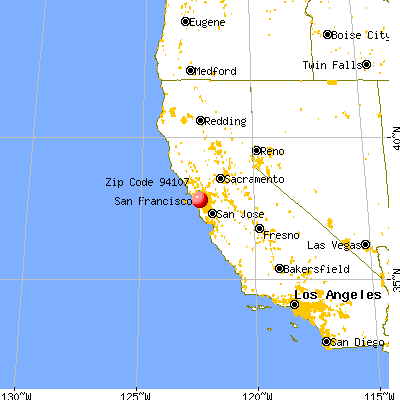
Land area: 1.8 sq. mi. Water area: 0.1 sq. mi.
Population density: 16,792 people per square mile
(very high).
OSM Map
General Map
Google Map
MSN Map
OSM Map
General Map
Google Map
MSN Map
OSM Map
General Map
Google Map
MSN Map
OSM Map
General Map
Google Map
MSN Map
Please wait while loading the map...
Real estate property taxes paid for housing units in 2022:
This zip code:
0.7% ($10,292)
California:
0.7% ($4,831)
Median real estate property taxes paid for housing units with mortgages in 2022: $10,330 (0.7%) Median real estate property taxes paid for housing units with no mortgage in 2022: $8,746 (0.6%)
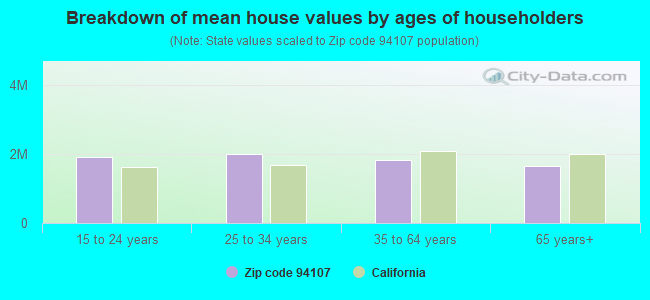
Estimated median house/condo value in 2022: $1,394,990
94107:
$1,394,990
California:
$715,900
According to our research of California and other state lists, there were 17 registered sex offenders living in 94107 zip code as of April 26, 2024. The ratio of all residents to sex offenders in zip code 94107 is 1,753 to 1. The ratio of registered sex offenders to all residents in this zip code is lower than the state average.
Median resident age:
This zip code:
36.4 years
California median age:
37.9 years
Average household size:
This zip code:
1.9 people
California:
2.8 people
Averages for the 2020 tax year for zip code 94107, filed in 2021:
Average Adjusted Gross Income (AGI) in 2020: $235,403 (Individual Income Tax Returns)
Here:
$235,403
State:
$95,910
Salary/wage: $204,357 (reported on 87.6% of returns)
Here:
$204,357
State:
$77,331
(% of AGI for various income ranges: 1239.7% for AGIs below $25k, 3939.3% for AGIs $25k-50k, 7758.2% for AGIs $50k-75k, 11716.3% for AGIs $75k-100k, 23306.7% for AGIs $100k-200k, 193938.9% for AGIs over 200k)
Taxable interest for individuals: $1,976 (reported on 50.7% of returns)
This zip code:
$1,976
California:
$2,294
(% of AGI for various income ranges: 28.6% for AGIs below $25k, 33.3% for AGIs $25k-50k, 50.2% for AGIs $50k-75k, 67.7% for AGIs $75k-100k, 116.6% for AGIs $100k-200k, 1065.0% for AGIs over 200k)
Ordinary dividends: $8,515 (reported on 48.4% of returns)
Here:
$8,515
State:
$10,949
(% of AGI for various income ranges: 69.2% for AGIs below $25k, 119.4% for AGIs $25k-50k, 145.7% for AGIs $50k-75k, 263.9% for AGIs $75k-100k, 366.4% for AGIs $100k-200k, 4767.8% for AGIs over 200k)
Net capital gain/loss in AGI: +$59,343 (reported on 48.3% of returns)
Here:
+$59,343
State:
+$49,306
(% of AGI for various income ranges: 47.6% for AGIs below $25k, 140.0% for AGIs $25k-50k, 192.5% for AGIs $50k-75k, 256.1% for AGIs $75k-100k, 704.2% for AGIs $100k-200k, 40247.7% for AGIs over 200k)
Profit/loss from business: +$28,956 (reported on 17.3% of returns)
Here:
+$28,956
State:
+$15,671
(% of AGI for various income ranges: 212.6% for AGIs below $25k, 306.4% for AGIs $25k-50k, 394.3% for AGIs $50k-75k, 396.2% for AGIs $75k-100k, 737.9% for AGIs $100k-200k, 4568.4% for AGIs over 200k)
Taxable individual retirement arrangement distribution: $20,696 (reported on 5.5% of returns)
94107:
$20,696
California:
$23,505
(% of AGI for various income ranges: 51.8% for AGIs below $25k, 78.5% for AGIs $25k-50k, 113.4% for AGIs $50k-75k, 206.4% for AGIs $75k-100k, 296.2% for AGIs $100k-200k, 658.7% for AGIs over 200k)
Self-employed (Keogh) retirement plans: $35,118 (reported on 2.2% of returns)
94107:
$35,118
California:
$30,163
(% of AGI for various income ranges: 39.8% for AGIs $50k-75k, 81.5% for AGIs $100k-200k, 937.8% for AGIs over 200k)
Total itemized deductions: $36,329 (reported on 22.5% of returns)
Here:
$36,329
State:
$39,517
(% of AGI for various income ranges: 232.2% for AGIs below $25k, 295.3% for AGIs $25k-50k, 426.5% for AGIs $50k-75k, 661.9% for AGIs $75k-100k, 1162.7% for AGIs $100k-200k, 8150.7% for AGIs over 200k)
Charity contributions: $9,676 (reported on 17.3% of returns)
Here:
$9,676
State:
$12,598
(% of AGI for various income ranges: 7.0% for AGIs below $25k, 27.7% for AGIs $25k-50k, 29.1% for AGIs $50k-75k, 56.1% for AGIs $75k-100k, 130.7% for AGIs $100k-200k, 2097.8% for AGIs over 200k)
Taxes paid: $9,451 (reported on 22.5% of returns)
94107:
$9,451
State:
$8,807
(% of AGI for various income ranges: 39.8% for AGIs below $25k, 67.3% for AGIs $25k-50k, 116.4% for AGIs $50k-75k, 194.1% for AGIs $75k-100k, 384.9% for AGIs $100k-200k, 1968.1% for AGIs over 200k)
Earned income credit: $1,502 (reported on 4.9% of returns)
Here:
$1,502
State:
$2,074
(% of AGI for various income ranges: 58.9% for AGIs below $25k, 30.7% for AGIs $25k-50k)
Percentage of individuals using paid preparers for their 2020 taxes: 94.4%
Here:
94%
State:
92%
(% for various income ranges: 90.4% for AGIs below $25k, 93.2% for AGIs $25k-50k, 93.0% for AGIs $50k-75k, 94.3% for AGIs $75k-100k, 95.5% for AGIs $100k-200k, 96.3% for AGIs over 200k)
Averages for the 2012 tax year for zip code 94107, filed in 2013:
Average Adjusted Gross Income (AGI) in 2012: $167,964 (Individual Income Tax Returns)
Here:
$167,964
State:
$72,726
Salary/wage: $131,602 (reported on 87.1% of returns)
Here:
$131,602
State:
$59,079
(% of AGI for various income ranges: 72.2% for AGIs below $25k, 79.5% for AGIs $25k-50k, 85.6% for AGIs $50k-75k, 85.7% for AGIs $75k-100k, 87.7% for AGIs $100k-200k, 58.3% for AGIs over 200k)
Taxable interest for individuals: $1,777 (reported on 52.0% of returns)
This zip code:
$1,777
California:
$2,146
(% of AGI for various income ranges: 1.3% for AGIs below $25k, 0.7% for AGIs $25k-50k, 0.6% for AGIs $50k-75k, 0.4% for AGIs $75k-100k, 0.4% for AGIs $100k-200k, 0.6% for AGIs over 200k)
Ordinary dividends: $8,045 (reported on 38.2% of returns)
Here:
$8,045
State:
$9,308
(% of AGI for various income ranges: 4.7% for AGIs below $25k, 1.9% for AGIs $25k-50k, 1.6% for AGIs $50k-75k, 1.4% for AGIs $75k-100k, 1.4% for AGIs $100k-200k, 2.0% for AGIs over 200k)
Net capital gain/loss in AGI: +$88,784 (reported on 36.2% of returns)
Here:
+$88,784
State:
+$30,460
(% of AGI for various income ranges: 0.2% for AGIs below $25k, 0.4% for AGIs $25k-50k, 1.0% for AGIs $50k-75k, 1.3% for AGIs $75k-100k, 1.7% for AGIs $100k-200k, 29.2% for AGIs over 200k)
Profit/loss from business: +$28,865 (reported on 21.3% of returns)
Here:
+$28,865
State:
+$17,064
(% of AGI for various income ranges: 18.8% for AGIs below $25k, 10.8% for AGIs $25k-50k, 5.9% for AGIs $50k-75k, 4.6% for AGIs $75k-100k, 3.9% for AGIs $100k-200k, 2.6% for AGIs over 200k)
Taxable individual retirement arrangement distribution: $19,577 (reported on 5.6% of returns)
94107:
$19,577
California:
$19,557
(% of AGI for various income ranges: 2.0% for AGIs below $25k, 1.2% for AGIs $25k-50k, 1.6% for AGIs $50k-75k, 1.1% for AGIs $75k-100k, 0.9% for AGIs $100k-200k, 0.4% for AGIs over 200k)
Self-employment retirement plans: $25,434 (reported on 3.0% of returns)
94107:
$25,434
California:
$24,530
(% of AGI for various income ranges: 0.5% for AGIs $25k-50k, 0.4% for AGIs $50k-75k, 0.3% for AGIs $75k-100k, 0.4% for AGIs $100k-200k, 0.5% for AGIs over 200k)
Total itemized deductions: $46,299 (18% of AGI, reported on 57.3% of returns)
Here:
$46,299
State:
$34,004
Here:
17.8% of AGI
State:
22.7% of AGI
(% of AGI for various income ranges: 18.2% for AGIs below $25k, 10.6% for AGIs $25k-50k, 12.5% for AGIs $50k-75k, 19.5% for AGIs $75k-100k, 16.1% for AGIs $100k-200k, 15.9% for AGIs over 200k)
Charity contributions: $5,312 (reported on 41.6% of returns)
Here:
$5,312
State:
$4,659
(% of AGI for various income ranges: 0.7% for AGIs below $25k, 0.6% for AGIs $25k-50k, 0.8% for AGIs $50k-75k, 0.9% for AGIs $75k-100k, 0.9% for AGIs $100k-200k, 1.6% for AGIs over 200k)
Taxes paid: $24,180 (reported on 57.2% of returns)
94107:
$24,180
State:
$14,448
(% of AGI for various income ranges: 3.8% for AGIs below $25k, 2.7% for AGIs $25k-50k, 4.8% for AGIs $50k-75k, 6.9% for AGIs $75k-100k, 8.8% for AGIs $100k-200k, 8.8% for AGIs over 200k)
Earned income credit: $1,603 (reported on 6.7% of returns)
Here:
$1,603
State:
$2,286
(% of AGI for various income ranges: 4.0% for AGIs below $25k, 0.3% for AGIs $25k-50k)
Percentage of individuals using paid preparers for their 2012 taxes: 49.4%
Here:
49%
State:
64%
(% for various income ranges: 46.4% for AGIs below $25k, 43.6% for AGIs $25k-50k, 43.4% for AGIs $50k-75k, 42.9% for AGIs $75k-100k, 48.3% for AGIs $100k-200k, 67.4% for AGIs over 200k)
Averages for the 2004 tax year for zip code 94107, filed in 2005:
Average Adjusted Gross Income (AGI) in 2004: $95,132 (Individual Income Tax Returns)
Here:
$95,132
State:
$58,600
Salary/wage: $84,206 (reported on 84.5% of returns)
Here:
$84,206
State:
$49,455
(% of AGI for various income ranges: 74.6% for AGIs $10k-25k, 83.6% for AGIs $25k-50k, 86.7% for AGIs $50k-75k, 88.7% for AGIs $75k-100k, 68.3% for AGIs over 100k)
Taxable interest for individuals: $2,024 (reported on 54.5% of returns)
This zip code:
$2,024
California:
$2,365
(% of AGI for various income ranges: 2.3% for AGIs $10k-25k, 1.4% for AGIs $25k-50k, 1.0% for AGIs $50k-75k, 0.8% for AGIs $75k-100k, 1.1% for AGIs over 100k)
Taxable dividends: $4,054 (reported on 37.1% of returns)
Here:
$4,054
State:
$4,746
(% of AGI for various income ranges: 1.9% for AGIs $10k-25k, 1.7% for AGIs $25k-50k, 1.6% for AGIs $50k-75k, 1.1% for AGIs $75k-100k, 1.5% for AGIs over 100k)
Net capital gain/loss: +$31,746 (reported on 35.7% of returns)
Here:
+$31,746
State:
+$23,418
(% of AGI for various income ranges: 0.4% for AGIs $10k-25k, 0.6% for AGIs $25k-50k, 1.1% for AGIs $50k-75k, 0.8% for AGIs $75k-100k, 16.7% for AGIs over 100k)
Profit/loss from business: +$23,344 (reported on 21.9% of returns)
Here:
+$23,344
State:
+$16,826
(% of AGI for various income ranges: 16.8% for AGIs $10k-25k, 8.2% for AGIs $25k-50k, 6.7% for AGIs $50k-75k, 5.1% for AGIs $75k-100k, 4.2% for AGIs over 100k)
Profit/loss from farming: +$9,182 (reported on 0.1% of returns)
Here:
+$9,182
State:
-$7,562
IRA payment deduction: $2,966 (reported on 3.7% of returns)
94107:
$2,966
California:
$3,192
(% of AGI for various income ranges: 0.4% for AGIs $10k-25k, 0.5% for AGIs $25k-50k, 0.2% for AGIs $50k-75k, 0.1% for AGIs $75k-100k, 0.0% for AGIs over 100k)
Self-employed pension: $16,352 (reported on 3.9% of returns)
Here:
$16,352
California:
$17,688
(% of AGI for various income ranges: 0.4% for AGIs $10k-25k, 0.5% for AGIs $25k-50k, 0.6% for AGIs $50k-75k, 0.5% for AGIs $75k-100k, 0.7% for AGIs over 100k)
Total itemized deductions: $28,767 (19% of AGI, reported on 51.1% of returns)
Here:
$28,767
State:
$28,113
Here:
18.5% of AGI
State:
25.3% of AGI
(% of AGI for various income ranges: 15.1% for AGIs $10k-25k, 11.9% for AGIs $25k-50k, 14.9% for AGIs $50k-75k, 17.5% for AGIs $75k-100k, 15.3% for AGIs over 100k)
Charity contributions deductions: $3,055 (2% of AGI, reported on 41.7% of returns)
Here:
$3,055
State:
$3,923
Here:
1.8% of AGI
State:
3.3% of AGI
(% of AGI for various income ranges: 0.9% for AGIs $10k-25k, 0.9% for AGIs $25k-50k, 1.1% for AGIs $50k-75k, 1.2% for AGIs $75k-100k, 1.4% for AGIs over 100k)
Total tax: $19,791 (reported on 88.1% of returns)
94107:
$19,791
State:
$10,761
(% of AGI for various income ranges: 6.7% for AGIs $10k-25k, 10.4% for AGIs $25k-50k, 13.8% for AGIs $50k-75k, 15.2% for AGIs $75k-100k, 20.6% for AGIs over 100k)
Earned income credit: $1,275 (reported on 7.1% of returns)
Here:
$1,275
State:
$1,763
Percentage of individuals using paid preparers for their 2004 taxes: 54.5%
Here:
54%
State:
66%
(% for various income ranges: 54.9% for AGIs below $10k, 52.5% for AGIs $10k-25k, 49.0% for AGIs $25k-50k, 50.6% for AGIs $50k-75k, 52.3% for AGIs $75k-100k, 62.6% for AGIs over 100k)
Likely homosexual households (counted as self-reported same-sex unmarried-partner households)
Lesbian couples: 0.3% of all households
Gay men: 1.3% of all households
Household received Food Stamps/SNAP in the past 12 months: 798 Household did not receive Food Stamps/SNAP in the past 12 months: 14,489
Women who had a birth in the past 12 months: 324 (322 now married, 0 unmarried) Women who did not have a birth in the past 12 months: 9,081 (3,208 now married, 5,888 unmarried)
Housing units in zip code 94107 with a mortgage: 4,285 (415 second mortgage, 16 home equity loan, 372 both second mortgage and home equity loan) Houses without a mortgage: 71
Median monthly owner costs for units with a mortgage: $3,876 Median monthly owner costs for units without a mortgage: $1,342
Residents with income below the poverty level in 2022:
This zip code:
8.0%
Whole state:
12.2%
Residents with income below 50% of the poverty level in 2022:
This zip code:
3.8%
Whole state:
6.2%
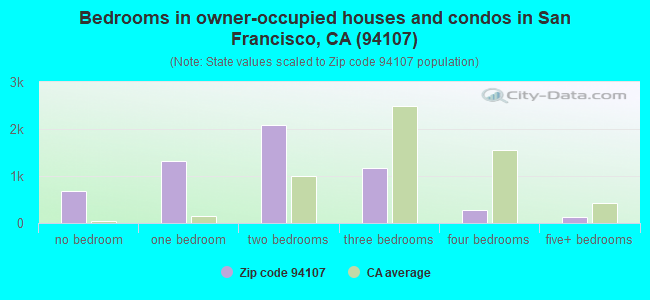
Median number of rooms in houses and condos:
Here:
4.2
State:
6.0
Median number of rooms in apartments:
Here:
2.8
State:
3.9
Notable locations in this zip code not listed on our city pages
Notable locations in zip code 94107: Southern Pacific Station (A), Pier 40 (B), Pier 38 (C), Pier 36 (D), Pier 34 (E), Pier 32 (F), Pier 30 (G), Pier 28 (H), Pier 26 (I), Cartoon Art Museum (J), Potrero Branch Library (K), Southern Pacific Terminal (L), Potrero Hill Police Station (M), Potrero Hill Neighborhood House (N), China Basin Building (O), American Medical Response (P), San Francisco Fire Department Station 8 (Q), San Francisco Fire Department Station 37 (R). Display/hide their locations on the map
Churches in zip code 94107 include: Hillside Baptist Church (A), Saint Stephen Baptist Church (B), Saint Teresas Roman Catholic Church (C). Display/hide their locations on the map
Parks in zip code 94107 include: McKinley Square (1), Willie Mays Plaza (2), South Park (3), Potrero Hill Recreation Center (4), Warm Water Cove Park (5), Jackson Park (6). Display/hide their locations on the map
Tourist attractions (not listed on the city page) : HotWired's RGB Gallery (Art Museums; 660 Third Street), Sunnyside Plants Inc (Botanical Gardens; 660 Brannan St).
2,247 married couples with children.
454 single-parent households (54 men, 400 women).
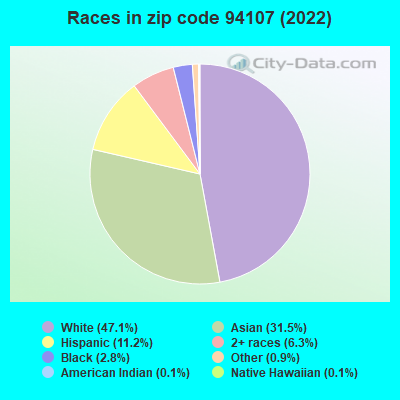
60.8% of residents of 94107 zip code speak English at home.
7.5% of residents speak Spanish at home (82% very well, 11% well, 5% not well, 1% not at all).
9.3% of residents speak other Indo-European language at home (88% very well, 7% well, 5% not well).
18.7% of residents speak Asian or Pacific Island language at home (56% very well, 21% well, 13% not well, 10% not at all).
3.7% of residents speak other language at home (78% very well, 20% well, 2% not well).
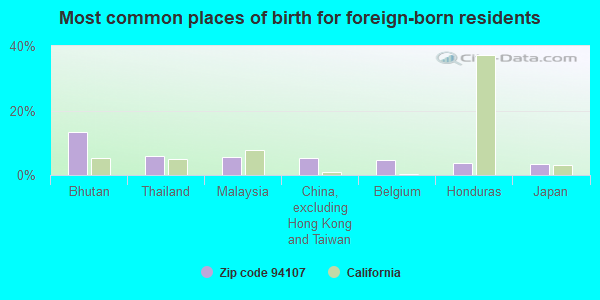
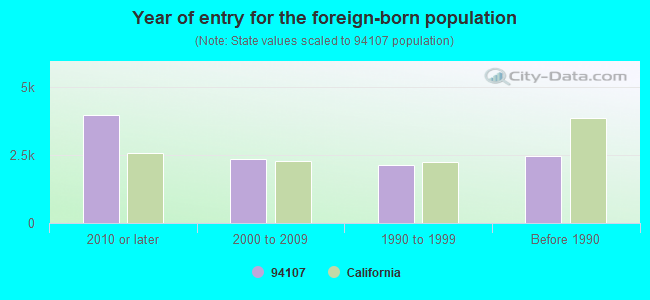
Foreign born population: 9,559 (31.8%) (52.7% of them are naturalized citizens)
Major facilities with environmental interests located in this zip code:
MIRANT DELTA LLC POTRERO POWER PLANT (1201 ILLINOIS STREET in SAN FRANCISCO, CA)
AIR MAJOR (AIRS/AFS) AIR PROGRAM (Clean Air Markets Division Business System) OIL CONTROL (Facility Response Plan for oil discharge) STATE MASTER (California - Hazardous Waste Tracking) - HAZARDOU WASTE PROGRAM (Integrated Compliance Information System) - ICIS-09-2001-0070, FORMAL ENFORCEMENT ACTION CRITERIA AND HAZARDOUS AIR POLLUTANT INVENTORY (Inventory of air pollution sources) National Pollutant Discharge Elimination System NON-MAJOR (Tracking pollutant discharge elimination systems) - permit HAZARDOUS WASTE BIENNIAL REPORTER (Resource Conservation and Recovery Act (tracking hazardous waste)) Large Quantity Generators, more that 1000 kg of hazardous waste/month (Resource Conservation and Recovery Act (tracking hazardous waste)) - notification TRI REPORTER (Tracking of toxic chemicals releasing facilities) Business SIC classification: ELECTRIC SERVICES; ELECTRIC AND OTHER SERVICES COMBINED Business NAICS classification: FOSSIL FUEL ELECTRIC POWER GENERATION. Organizations: MIRANT POTRERO, LLC (CONTACT/GENERAL)
, SOUTHERN ENERGY PORTRERO (CONTACT/OWNER)
, PACIFIC GAS AND ELECTRIC COMPANY (OWNER/OPERATOR)
Alternative names: MIRANT DELTA, LLC-POTRERO PLANT, MIRANT POTRERO L.L.C., MIRANT POTRERO, LLC POTRERO POWER PLANT, PACIFIC GAS & ELECTRIC CO, POTRERO PLANT, SOUTHERN ENERGY CALIFORNIA, POTRERO_PLAN, SOUTHERN ENERGY PORTRERO, SOUTHERN ENERGY POTRERO LLC
CATELLUS URBAN DEVELOPMENT CORPORATION (45 MISSION ROCK STREET in SAN FRANCISCO, CA)
STATE MASTER (California - Hazardous Waste Tracking) - HAZARDOU WASTE PROGRAM HAZARDOUS WASTE BIENNIAL REPORTER (Resource Conservation and Recovery Act (tracking hazardous waste)) Large Quantity Generators, more that 1000 kg of hazardous waste/month (Resource Conservation and Recovery Act (tracking hazardous waste)) Small Quantity Generators, between 100 kg and 1000 kg of hazardous waste/month (Resource Conservation and Recovery Act (tracking hazardous waste)) - notification
699 SECOND STREET (699 SECOND STREET in SAN FRANCISCO, CA)
STATE MASTER (California - Hazardous Waste Tracking) - HAZARDOU WASTE PROGRAM Large Quantity Generators, more that 1000 kg of hazardous waste/month (Resource Conservation and Recovery Act (tracking hazardous waste)) Organizations: 699 SECOND DEVELOPMENT LLC (CONTACT/OPERATOR)
MARINA AUTO BODY (585 BRYANT STREET in SAN FRANCISCO, CA)
STATE MASTER (California - Hazardous Waste Tracking) - HAZARDOU WASTE PROGRAM CRITERIA AND HAZARDOUS AIR POLLUTANT INVENTORY (Inventory of air pollution sources) Small Quantity Generators, between 100 kg and 1000 kg of hazardous waste/month (Resource Conservation and Recovery Act (tracking hazardous waste)) - notification Business SIC classification: TOP, BODY, AND UPHOLSTERY REPAIR SHOPS AND PAINT SHOPS Organizations: MIKE GIANNINI (CONTACT/OWNER)
Alternative names: MARINA AUTO PAINT
MURPHY PRINTING (424 BRYANT in SAN FRANCISCO, CA)
STATE MASTER (California - Hazardous Waste Tracking) - HAZARDOU WASTE PROGRAM Small Quantity Generators, between 100 kg and 1000 kg of hazardous waste/month (Resource Conservation and Recovery Act (tracking hazardous waste)) - notification Business NAICS classification: COMMERCIAL LITHOGRAPHIC PRINTING. Organizations: MURPHY PRINTING INC (CONTACT/OWNER)
EUR ASIA MOTORS (645 BRYANT ST in SAN FRANCISCO, CA)
STATE MASTER (California - Hazardous Waste Tracking) - HAZARDOU WASTE PROGRAM CRITERIA AND HAZARDOUS AIR POLLUTANT INVENTORY (Inventory of air pollution sources) Small Quantity Generators, between 100 kg and 1000 kg of hazardous waste/month (Resource Conservation and Recovery Act (tracking hazardous waste)) - notification Business SIC classification: TOP, BODY, AND UPHOLSTERY REPAIR SHOPS AND PAINT SHOPS Organizations: HARRY MING (CONTACT/OWNER)
MEL GOTELLI BODY & FENDER SHOP (52 ZOE ST in SAN FRANCISCO, CA)
STATE MASTER (California - Hazardous Waste Tracking) - HAZARDOU WASTE PROGRAM CRITERIA AND HAZARDOUS AIR POLLUTANT INVENTORY (Inventory of air pollution sources) Small Quantity Generators, between 100 kg and 1000 kg of hazardous waste/month (Resource Conservation and Recovery Act (tracking hazardous waste)) Business SIC classification: TOP, BODY, AND UPHOLSTERY REPAIR SHOPS AND PAINT SHOPS Business NAICS classification: AUTOMOTIVE BODY, PAINT, AND INTERIOR REPAIR AND MAINTENANCE.
INTERNATIONAL STUDIES ACADEMY HIGH (693 VERMONT ST in SAN FRANCISCO, CA)
(Geographic Names Information System) (National Center for Education Statistics) - STATE ID-3830353 Organizations: SAN FRANCISCO UNIFIED (SCHOOL DISTRICT)
BARBARY COAST TRUCKING AND BROKERS (953 DEHARO STREET in SAN FRANCISCO, CA)
STATE MASTER (California - Hazardous Waste Tracking) - HAZARDOU WASTE PROGRAM TRANSPORTER (Resource Conservation and Recovery Act (tracking hazardous waste)) - notification Organizations: JIMMIE RAY POTTS (CONTACT/OWNER)
Alternative names: BARBARY COAST TRUCKING CO, BARBERY COAST TRUCKING & BARKERS
MARTIN BUILDING CO (2255 THIRD ST in SAN FRANCISCO, CA)
STATE MASTER (California - Hazardous Waste Tracking) - HAZARDOU WASTE PROGRAM Small Quantity Generators, between 100 kg and 1000 kg of hazardous waste/month (Resource Conservation and Recovery Act (tracking hazardous waste)) - notification
EQUILON ENTERPRISES (2890 3RD in SAN FRANCISCO, CA) . Federal Facility
STATE MASTER (California - Hazardous Waste Tracking) - HAZARDOU WASTE PROGRAM Small Quantity Generators, between 100 kg and 1000 kg of hazardous waste/month (Resource Conservation and Recovery Act (tracking hazardous waste)) - notification Organizations: EQUILON ENTERPRISES, LLC (CONTACT/OWNER)
Alternative names: SHELL OIL CO
H&H SHIP SERVICE COMPANY (220 CHINA BASIN ST in SAN FRANCISCO, CA)
OIL CONTROL (Facility Response Plan for oil discharge) COMPLIANCE ACTIVITY (Tracking inspections of insecticide, fungicide, and rodenticide, and toxic substances) Large Quantity Generators, more that 1000 kg of hazardous waste/month (Resource Conservation and Recovery Act (tracking hazardous waste)) TRANSPORTER (Resource Conservation and Recovery Act (tracking hazardous waste)) TSD (Resource Conservation and Recovery Act (tracking hazardous waste)) Business SIC classification: SCRAP AND WASTE MATERIALS Business NAICS classification: PETROLEUM LUBRICATING OIL AND GREASE MANUFACTURING. Organizations: H & H SHIP SERVICE CO (CONTACT/OPERATOR)
Alternative names: H & H ENVIRONMENTAL SERVICES
CIARLO BROTHERS (765 BRYANT STREET in SAN FRANCISCO, CA)
STATE MASTER (California - Hazardous Waste Tracking) - HAZARDOU WASTE PROGRAM Small Quantity Generators, between 100 kg and 1000 kg of hazardous waste/month (Resource Conservation and Recovery Act (tracking hazardous waste))
Housing units lacking complete plumbing facilities: 0.8% Housing units lacking complete kitchen facilities: 1.4%
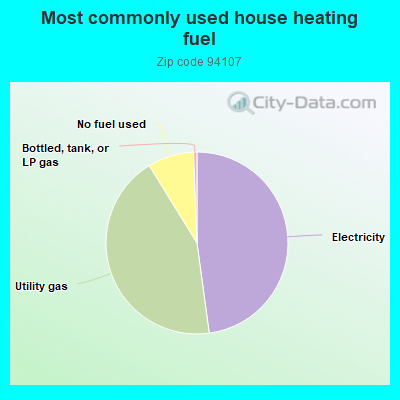
47.9%Electricity
43.4%Utility gas
8.2%No fuel used
0.6%Bottled, tank, or LP gas
Population in 1990: 12,143. Population change in the 1990s: +5,225 (+43.0%).
Place of birth for U.S.-born residents:
This state: 10,131
Northeast: 3,157
Midwest: 2,066
South: 3,047
West: 909
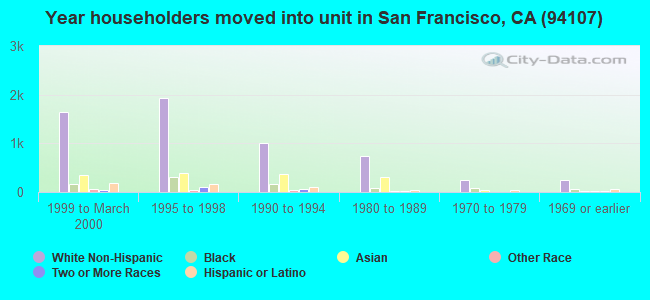
47% of the 94107 zip code residents lived in the same house 5 years ago. Out of people who lived in different houses, 48% lived in this county. Out of people who lived in different counties, 50% lived in California.
80% of the 94107 zip code residents lived in the same house 1 year ago. Out of people who lived in different houses, 44% moved from this county. Out of people who lived in different houses, 29% moved from different county within same state. Out of people who lived in different houses, 17% moved from different state. Out of people who lived in different houses, 9% moved from abroad.
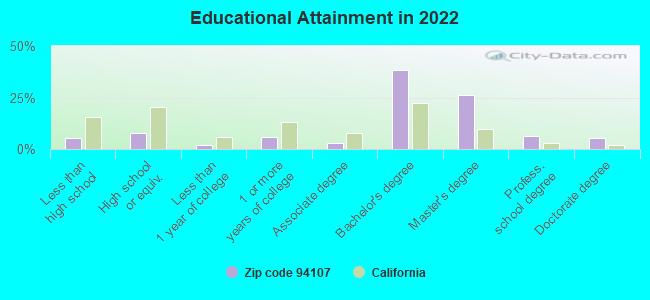
Private vs. public school enrollment:
Students in private schools in grades 1 to 8 (elementary and middle school): 445
Here:
39.5%
California:
10.5%
Students in private schools in grades 9 to 12 (high school): 23
Here:
6.7%
California:
8.5%
Students in private undergraduate colleges: 289
Here:
23.2%
California:
15.9%
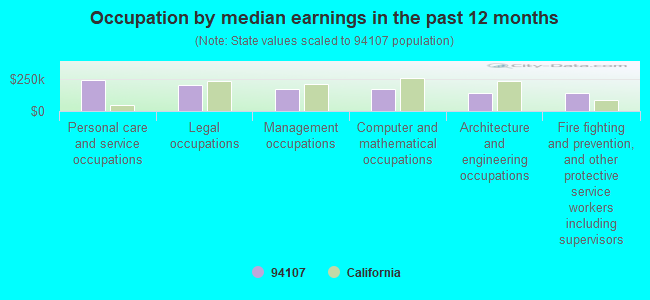
Occupation by median earnings in the past 12 months ($)
241,193Personal care and service occupations
202,639Legal occupations
169,412Management occupations
167,561Computer and mathematical occupations
139,203Architecture and engineering occupations
138,708Fire fighting and prevention, and other protective service workers including supervisors
Companies with biggest federal contracts located in this zip code (SAN FRANCISCO, CA):
B A E SAN FRANCISCO SHIP REPAI (FOOT OF 20TH ST PIER 70) : $325,608,777 in 197 contractsfrom 1999 to 2006
Contracts for Maintenance, Repair or Alteration of Real Property -- Restoration of real property, Non-nuclear Ship Repair (West) Ship repair (including overhauls and conversions) performed on. non-nuclear propelled and nonpropelled ships west of the 108th meridian, Non-nuclear Ship Repair (East) Ship repair (including overhauls and conversions) performed on non-nuclear propelled and nonpropelled ships east of the 108th meridian, by National Park Service, Navy, Army, U.S. Coast Guard, and others Signed by year:2000: $10,772,280; 2001: $8,107,106; 2002: $252,843,013; 2003: $11,624,542; 2004: $14,252,498; 2005: $21,194,385; 2006: $3,342,017.
Biggest contracts:
$246,207,000 with National Park Service for Maintenance, Repair or Alteration of Real Property -- Restoration of real property. Signed on 2002-09-15. Completion date: 2002-12-15.
$5,439,793 with Navy for Non-nuclear Ship Repair (West) Ship repair (including overhauls and conversions) performed on. non-nuclear propelled and nonpropelled ships west of the 108th meridian. Signed on 2005-04-22. Completion date: 2005-09-01.
$4,700,316, same as above.Signed on 2000-09-27. Completion date: 2000-09-30.
$3,938,526 with Navy for Non-nuclear Ship Repair (East) Ship repair (including overhauls and conversions) performed on non-nuclear propelled and nonpropelled ships east of the 108th meridian. Signed on 2001-02-15. Completion date: 2001-05-14.
SARASWATI ASSOCIATES (650 5TH STREET; small business) : $5,113,863 in 20 contractsfrom 2002 to 2006
Contracts for Other Defense -- Applied Research and Exploratory Development (R&D), Defense Missile and Space Systems -- Advanced Development (R&D), Defense Missile and Space Systems -- Operational Systems Development (R&D), Defense Missile and Space Systems -- Basic Research (R&D), and moreby Army, Air Force Signed by year:2000: $0; 2001: $0; 2002: $98,619; 2003: $319,934; 2004: $2,146,388; 2005: $1,698,923; 2006: $849,999.
Biggest contracts:
$650,000 with Army for Other Defense -- Applied Research and Exploratory Development (R&D). Signed on 2005-06-20. Completion date: 2006-09-30.
$650,000 with Army for Defense Missile and Space Systems -- Advanced Development (R&D). Signed on 2004-07-15. Completion date: 2006-07-14.
$650,000 with Army for Other Defense -- Applied Research and Exploratory Development (R&D). Signed on 2004-06-24. Completion date: 2006-09-30.
$375,000 with Air Force for Defense Missile and Space Systems -- Operational Systems Development (R&D). Signed on 2006-04-07. Completion date: 2008-07-07.
GEOCELL SYSTEMS INC (PIER 54 TERRY FRANCOIS BLV; small business) : $4,560,102 in 13 contractsfrom 2002 to 2006
Contracts for Other Special Studies and Analyses, Wallboard, Building Paper, and Thermal Insulation Materials, Miscellaneous Items by Army, U.S. Army Corps of Engineers - civil program financing only, Navy, Air Force, and others Signed by year:2000: $0; 2001: $0; 2002: $9,500; 2003: $0; 2004: $2,676,939; 2005: $966,163; 2006: $907,500.
Biggest contracts:
$849,500 with Army for Other Special Studies and Analyses. Taking place in MS. Signed on 2006-02-16. Completion date: 2006-03-31.
$849,500 with U.S. Army Corps of Engineers - civil program financing only for Other Special Studies and Analyses. Taking place in MS. Signed on 2004-12-20. Completion date: 2005-09-30.
$849,500 with Army for Other Special Studies and Analyses. Taking place in MS. Signed on 2004-12-20. Completion date: 2005-09-30.
$819,980 with Navy for Wallboard, Building Paper, and Thermal Insulation Materials. Signed on 2004-04-27. Completion date: 2004-07-30.
SBC GLOBAL SERVICES, INC (370 3RD ST RM 604) : $3,538,029 in 70 contractsfrom 2003 to 2006
Contracts for Telephone and/or Communications Services (includes Telegraph, Telex, and Cablevision Services), ADP Telecommunications and Transmission Services, Telephone and Telegraph Equipment, Electrical and Electronic Properties Measuring and Testing Instruments, and moreby Navy, Defense Information Systems Agency, U.S. Army Corps of Engineers - civil program financing only, Army, and others Signed by year:2000: $0; 2001: $0; 2002: $0; 2003: $15,005; 2004: $493,645; 2005: $2,289,577; 2006: $739,802.
Biggest contracts:
$1,511,176 with Navy for Telephone and/or Communications Services (includes Telegraph, Telex, and Cablevision Services). Signed on 2005-10-28. Completion date: 2005-10-28.
$461,050, same as above.Signed on 2004-10-01. Completion date: 2005-10-28.
$304,531 with Defense Information Systems Agency for ADP Telecommunications and Transmission Services. Signed on 2006-02-28. Completion date: 2009-02-09.
$209,301 with U.S. Army Corps of Engineers - civil program financing only for Telephone and Telegraph Equipment. Taking place in TX. Signed on 2005-08-31. Completion date: 2006-01-30.
ALL CITIES ENTERPRISES (PIER 54, TERRY FRANCOIS BL; small business) : $2,394,537 in 5 contractsfrom 2000 to 2005
Contracts for Maintenance, Repair or Alteration of Real Property -- Other Non-Building Facilities, Maintenance, Repair or Alteration of Real Property -- Miscellaneous Buildings, Maintenance, Repair or Alteration of Real Property -- Highways, Roads, Streets, Bridges, and Railways (includes resurfacing) by U.S. Army Corps of Engineers - civil program financing only, Air Force Signed by year:2000: $213,305; 2001: $1,721,620; 2002: $39,768; 2003: $429,000; 2004: $0; 2005: -$9,156; 2006: $0.
Biggest contracts:
$1,721,620 with U.S. Army Corps of Engineers - civil program financing only for Maintenance, Repair or Alteration of Real Property -- Other Non-Building Facilities. Signed on 2001-09-28. Completion date: 2001-12-28.
$429,000 with Air Force for Maintenance, Repair or Alteration of Real Property -- Miscellaneous Buildings. Signed on 2003-09-22. Completion date: 2004-08-20.
$213,305 with U.S. Army Corps of Engineers - civil program financing only for Maintenance, Repair or Alteration of Real Property -- Highways, Roads, Streets, Bridges, and Railways (includes resurfacing). Signed on 2000-09-29. Completion date: 2000-10-31.
$39,768 with U.S. Army Corps of Engineers - civil program financing only for Maintenance, Repair or Alteration of Real Property -- Other Non-Building Facilities. Signed on 2002-06-04. Completion date: 2002-08-29.
AMSEC LLC (620 FOLSOM ST STE 301) : $504,862 in 8 contractsfrom 1999 to 2000
Contracts for Marine Architect and Engineering Services, Architect - Engineer Services (including landscaping, interior layout, and designing) by Navy, National Oceanic and Atmospheric Administration/Under Secretary for Oceans and Atmosphere Signed by year:2000: $499,862; 2001: $0; 2002: $0; 2003: $0; 2004: $0; 2005: $0; 2006: $0.
Biggest contracts:
$158,015 with Navy for Marine Architect and Engineering Services. Taking place in VA. Signed on 2000-02-17. Completion date: 2000-08-27.
$75,000, same as above.Signed on 2000-03-03. Completion date: 2000-08-27.
$59,991, same as above.Signed on 2000-01-07. Completion date: 2000-08-27.
$55,000, same as above.Signed on 2000-03-09. Completion date: 2000-08-27.
NATIVEMINDS, INC (490 2ND ST 200; small business) : $239,027 in 5 contractsfrom 2001 to 2003
Contracts for ADP Software, Maintenance, Repair and Rebuilding of Equipment -- Automatic Data Processing Equipment (Including Firmware), Software, Supplies and Support Equipment by National Institutes of Health, Defense Logistics Agency Signed by year:2000: $0; 2001: $165,000; 2002: $37,014; 2003: $37,013; 2004: $0; 2005: $0; 2006: $0.
Biggest contracts:
$120,000 with National Institutes of Health for ADP Software. Taking place in MD. Signed on 2001-12-15. Completion date: 2002-10-15.
$45,000, same as above.Signed on 2001-11-15. Completion date: 2002-10-15.
$37,014 with Defense Logistics Agency for Maintenance, Repair and Rebuilding of Equipment -- Automatic Data Processing Equipment (Including Firmware), Software, Supplies and Support Equipment. Taking place in MI. Signed on 2002-04-12. Completion date: 2002-09-30.
$37,013, same as above.Signed on 2003-10-15. Completion date: 2004-09-30.
PARKER DESIGN (350 TOWNSEND ST STE 307; small business) : $198,980 in 9 contractsfrom 2002 to 2006
Contracts for Other Special Studies and Analyses, Public Relations Services(includes writing services, event planning and management, media relations, radio and television analysis, and press services) by Army, U.S. Army Corps of Engineers - civil program financing only Signed by year:2000: $0; 2001: $0; 2002: $22,775; 2003: $0; 2004: $162,474; 2005: -$1,952; 2006: $15,683.
Biggest contracts:
$84,797 with Army for Other Special Studies and Analyses. Signed on 2004-01-29. Completion date: 2004-04-30.
$84,797 with U.S. Army Corps of Engineers - civil program financing only for Other Special Studies and Analyses. Signed on 2004-01-29. Completion date: 2004-04-30.
$22,775, same as above.Signed on 2002-10-08. Completion date: 2003-09-30.
$15,683 with Army for Public Relations Services(includes writing services, event planning and management, media relations, radio and television analysis, and press services). Signed on 2006-06-29. Completion date: 2007-04-30.
WAVE 80 BIOSCIENCES, INC (2325 THIRD STREET; small business) : $174,900 in 2 contractsfrom 2003 to 2004
$99,906 with Department of Defense for Other Research and Development -- Basic Research (R&D). Signed on 2003-06-16. Completion date: 2003-12-16.
$74,994 with U.S. Special Operations Command for Other Research and Development -- Basic Research (R&D). Signed on 2004-07-12. Completion date: 2006-01-11.
NEXSYS ELECTRONICS, INC (667 FOLSOM ST, 2ND FL; small business)
$125,085 with Army for Other Professional Services. Signed on 2005-08-12. Completion date: 2006-03-10.
Top industries in this zip code by the number of employees in 2005:
Administrative and Support and Waste Management and Remediation Services: Janitorial Services (over 1000 employees: 2 establishments, 100-249 employees: 1 establishment, 20-49 employees: 1 establishment, 10-19 employees: 2 establishments, 1-4 employees: 3 establishments)
2005 - 2018 National Fire Incident Reporting System (NFIRS) incidents
According to the data from the years 2005 - 2018 the average number of fires per year is 154. The highest number of reported fire incidents - 227 took place in 2018, and the least - 77 in 2014. The data has an increasing trend.
When looking into fire subcategories, the most incidents belonged to: Structure Fires (44.7%), and Outside Fires (43.2%).
Fire incident types reported to NFIRS in Zip Code 94107


+$9,182
-$7,562
 Nearest zip codes: 94158, 94103, 94110, 94102, 94105, 94104.
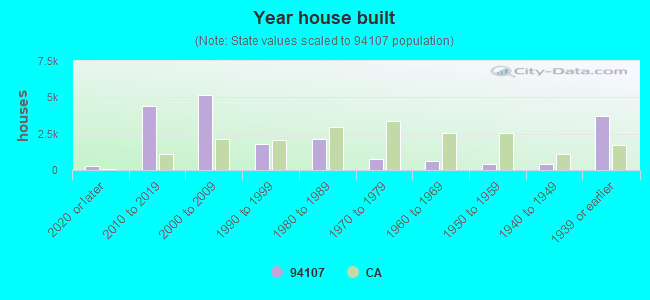


 According to the data from the years 2005 - 2018 the average number of fires per year is 154. The highest number of reported fire incidents - 227 took place in 2018, and the least - 77 in 2014. The data has an increasing trend.
 When looking into fire subcategories, the most incidents belonged to: Structure Fires (44.7%), and Outside Fires (43.2%).