Estimated zip code population in 2022: 13,608 Zip code population in 2010: 5,846 Zip code population in 2000: 2,058
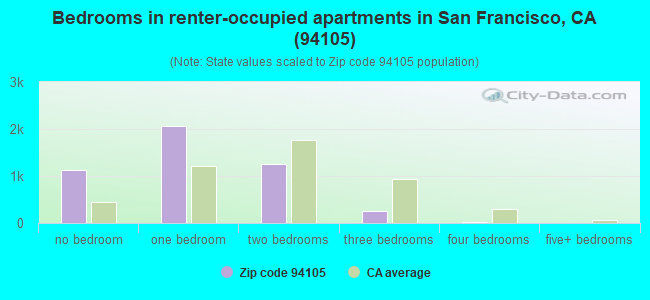
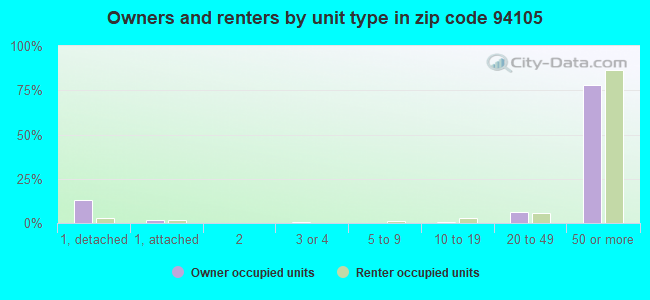
Houses and condos: 9,458 Renter-occupied apartments: 4,692
% of renters here:
61%
State:
44%
March 2022 cost of living index in zip code 94105: 128.8 (high, U.S. average is 100)
Land area: 0.4 sq. mi. Water area: 0.1 sq. mi.
Population density: 36,839 people per square mile
(very high).
OSM Map
General Map
Google Map
MSN Map
OSM Map
General Map
Google Map
MSN Map
OSM Map
General Map
Google Map
MSN Map
OSM Map
General Map
Google Map
MSN Map
Please wait while loading the map...
Real estate property taxes paid for housing units in 2022:
This zip code:
0.7% ($10,292)
California:
0.7% ($4,831)
Median real estate property taxes paid for housing units with mortgages in 2022: $10,330 (0.7%) Median real estate property taxes paid for housing units with no mortgage in 2022: $10,572 (0.6%)
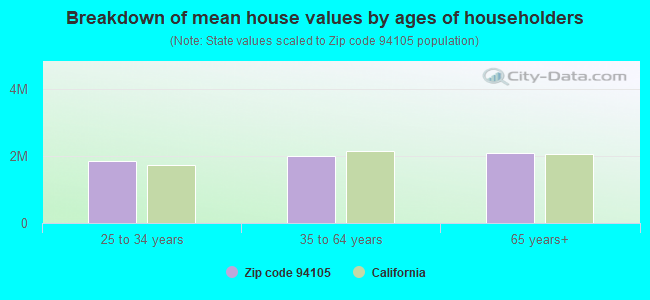
Estimated median house/condo value in 2022: $1,580,453
94105:
$1,580,453
California:
$715,900
According to our research of California and other state lists, there were 5 registered sex offenders living in 94105 zip code as of April 27, 2024. The ratio of all residents to sex offenders in zip code 94105 is 1,378 to 1. The ratio of registered sex offenders to all residents in this zip code is lower than the state average.
Median resident age:
This zip code:
34.3 years
California median age:
37.9 years
Average household size:
This zip code:
1.7 people
California:
2.8 people
Averages for the 2020 tax year for zip code 94105, filed in 2021:
Average Adjusted Gross Income (AGI) in 2020: $377,342 (Individual Income Tax Returns)
Here:
$377,342
State:
$95,910
Salary/wage: $249,108 (reported on 90.2% of returns)
Here:
$249,108
State:
$77,331
(% of AGI for various income ranges: 1236.7% for AGIs below $25k, 3969.4% for AGIs $25k-50k, 7570.5% for AGIs $50k-75k, 11149.5% for AGIs $75k-100k, 22710.3% for AGIs $100k-200k, 213683.3% for AGIs over 200k)
Taxable interest for individuals: $11,478 (reported on 53.3% of returns)
This zip code:
$11,478
California:
$2,294
(% of AGI for various income ranges: 57.3% for AGIs below $25k, 37.2% for AGIs $25k-50k, 92.3% for AGIs $50k-75k, 52.3% for AGIs $75k-100k, 137.8% for AGIs $100k-200k, 7075.1% for AGIs over 200k)
Ordinary dividends: $60,948 (reported on 52.6% of returns)
Here:
$60,948
State:
$10,949
(% of AGI for various income ranges: 87.3% for AGIs below $25k, 102.6% for AGIs $25k-50k, 222.6% for AGIs $50k-75k, 198.1% for AGIs $75k-100k, 292.0% for AGIs $100k-200k, 38378.4% for AGIs over 200k)
Net capital gain/loss in AGI: +$154,684 (reported on 54.6% of returns)
Here:
+$154,684
State:
+$49,306
(% of AGI for various income ranges: 61.6% for AGIs below $25k, 96.2% for AGIs $25k-50k, 240.5% for AGIs $50k-75k, 255.3% for AGIs $75k-100k, 712.6% for AGIs $100k-200k, 101773.4% for AGIs over 200k)
Profit/loss from business: +$41,070 (reported on 14.0% of returns)
Here:
+$41,070
State:
+$15,671
(% of AGI for various income ranges: 178.8% for AGIs below $25k, 319.1% for AGIs $25k-50k, 451.6% for AGIs $50k-75k, 437.0% for AGIs $75k-100k, 298.5% for AGIs $100k-200k, 5484.6% for AGIs over 200k)
Taxable individual retirement arrangement distribution: $35,771 (reported on 5.0% of returns)
94105:
$35,771
California:
$23,505
(% of AGI for various income ranges: 40.2% for AGIs below $25k, 120.9% for AGIs $25k-50k, 195.6% for AGIs $75k-100k, 219.2% for AGIs $100k-200k, 1492.2% for AGIs over 200k)
Self-employed (Keogh) retirement plans: $39,306 (reported on 2.1% of returns)
94105:
$39,306
California:
$30,163
(% of AGI for various income ranges: 126.0% for AGIs $75k-100k, 916.4% for AGIs over 200k)
Total itemized deductions: $98,378 (reported on 21.1% of returns)
Here:
$98,378
State:
$39,517
(% of AGI for various income ranges: 155.5% for AGIs below $25k, 210.9% for AGIs $25k-50k, 376.5% for AGIs $50k-75k, 500.5% for AGIs $75k-100k, 767.3% for AGIs $100k-200k, 23143.4% for AGIs over 200k)
Charity contributions: $81,532 (reported on 16.5% of returns)
Here:
$81,532
State:
$12,598
(% of AGI for various income ranges: 18.3% for AGIs $25k-50k, 31.6% for AGIs $50k-75k, 71.2% for AGIs $75k-100k, 111.8% for AGIs $100k-200k, 16242.4% for AGIs over 200k)
Taxes paid: $9,665 (reported on 21.0% of returns)
94105:
$9,665
State:
$8,807
(% of AGI for various income ranges: 42.9% for AGIs below $25k, 64.5% for AGIs $25k-50k, 100.2% for AGIs $50k-75k, 155.8% for AGIs $75k-100k, 268.0% for AGIs $100k-200k, 1703.4% for AGIs over 200k)
Earned income credit: $1,597 (reported on 4.3% of returns)
Here:
$1,597
State:
$2,074
(% of AGI for various income ranges: 51.4% for AGIs below $25k, 56.0% for AGIs $25k-50k)
Percentage of individuals using paid preparers for their 2020 taxes: 95.7%
Here:
96%
State:
92%
(% for various income ranges: 92.9% for AGIs below $25k, 94.7% for AGIs $25k-50k, 95.3% for AGIs $50k-75k, 96.8% for AGIs $75k-100k, 96.1% for AGIs $100k-200k, 96.4% for AGIs over 200k)
Averages for the 2012 tax year for zip code 94105, filed in 2013:
Average Adjusted Gross Income (AGI) in 2012: $325,864 (Individual Income Tax Returns)
Here:
$325,864
State:
$72,726
Salary/wage: $200,577 (reported on 88.3% of returns)
Here:
$200,577
State:
$59,079
(% of AGI for various income ranges: 78.4% for AGIs below $25k, 88.2% for AGIs $25k-50k, 89.7% for AGIs $50k-75k, 91.0% for AGIs $75k-100k, 89.4% for AGIs $100k-200k, 46.3% for AGIs over 200k)
Taxable interest for individuals: $6,907 (reported on 59.5% of returns)
This zip code:
$6,907
California:
$2,146
(% of AGI for various income ranges: 1.8% for AGIs below $25k, 0.6% for AGIs $25k-50k, 0.7% for AGIs $50k-75k, 0.8% for AGIs $75k-100k, 0.5% for AGIs $100k-200k, 1.4% for AGIs over 200k)
Ordinary dividends: $29,302 (reported on 45.2% of returns)
Here:
$29,302
State:
$9,308
(% of AGI for various income ranges: 6.1% for AGIs below $25k, 3.9% for AGIs $25k-50k, 1.8% for AGIs $50k-75k, 3.4% for AGIs $75k-100k, 1.5% for AGIs $100k-200k, 4.5% for AGIs over 200k)
Net capital gain/loss in AGI: +$172,026 (reported on 44.2% of returns)
Here:
+$172,026
State:
+$30,460
(% of AGI for various income ranges: 1.9% for AGIs $25k-50k, 0.6% for AGIs $75k-100k, 1.5% for AGIs $100k-200k, 28.4% for AGIs over 200k)
Profit/loss from business: +$43,487 (reported on 16.0% of returns)
Here:
+$43,487
State:
+$17,064
(% of AGI for various income ranges: 17.6% for AGIs below $25k, 6.9% for AGIs $25k-50k, 5.3% for AGIs $50k-75k, 2.4% for AGIs $75k-100k, 4.2% for AGIs $100k-200k, 1.6% for AGIs over 200k)
Taxable individual retirement arrangement distribution: $43,152 (reported on 5.3% of returns)
94105:
$43,152
California:
$19,557
(% of AGI for various income ranges: 2.2% for AGIs below $25k, 2.1% for AGIs $25k-50k, 1.4% for AGIs $50k-75k, 1.5% for AGIs $75k-100k, 1.0% for AGIs $100k-200k, 0.6% for AGIs over 200k)
Self-employment retirement plans: $38,690 (reported on 3.9% of returns)
94105:
$38,690
California:
$24,530
(% of AGI for various income ranges: 3.6% for AGIs $25k-50k, 0.5% for AGIs $100k-200k, 0.5% for AGIs over 200k)
Total itemized deductions: $74,686 (17% of AGI, reported on 69.5% of returns)
Here:
$74,686
State:
$34,004
Here:
16.8% of AGI
State:
22.7% of AGI
(% of AGI for various income ranges: 34.6% for AGIs below $25k, 14.8% for AGIs $25k-50k, 12.7% for AGIs $50k-75k, 15.4% for AGIs $75k-100k, 16.3% for AGIs $100k-200k, 15.9% for AGIs over 200k)
Charity contributions: $15,551 (reported on 49.5% of returns)
Here:
$15,551
State:
$4,659
(% of AGI for various income ranges: 1.0% for AGIs below $25k, 0.8% for AGIs $25k-50k, 0.6% for AGIs $50k-75k, 1.4% for AGIs $75k-100k, 0.8% for AGIs $100k-200k, 2.7% for AGIs over 200k)
Taxes paid: $44,893 (reported on 69.1% of returns)
94105:
$44,893
State:
$14,448
(% of AGI for various income ranges: 11.2% for AGIs below $25k, 4.9% for AGIs $25k-50k, 4.8% for AGIs $50k-75k, 7.3% for AGIs $75k-100k, 9.1% for AGIs $100k-200k, 9.8% for AGIs over 200k)
Earned income credit: $756 (reported on 3.1% of returns)
Here:
$756
State:
$2,286
(% of AGI for various income ranges: 1.1% for AGIs below $25k, 0.2% for AGIs $25k-50k)
Percentage of individuals using paid preparers for their 2012 taxes: 52.8%
Here:
53%
State:
64%
(% for various income ranges: 45.9% for AGIs below $25k, 40.8% for AGIs $25k-50k, 42.4% for AGIs $50k-75k, 43.9% for AGIs $75k-100k, 49.6% for AGIs $100k-200k, 70.8% for AGIs over 200k)
Averages for the 2004 tax year for zip code 94105, filed in 2005:
Average Adjusted Gross Income (AGI) in 2004: $187,180 (Individual Income Tax Returns)
Here:
$187,180
State:
$58,600
Salary/wage: $114,593 (reported on 84.4% of returns)
Here:
$114,593
State:
$49,455
(% of AGI for various income ranges: 77.0% for AGIs $10k-25k, 87.5% for AGIs $25k-50k, 89.6% for AGIs $50k-75k, 90.0% for AGIs $75k-100k, 44.2% for AGIs over 100k)
Taxable interest for individuals: $8,546 (reported on 59.6% of returns)
This zip code:
$8,546
California:
$2,365
(% of AGI for various income ranges: 2.5% for AGIs $10k-25k, 0.9% for AGIs $25k-50k, 0.7% for AGIs $50k-75k, 0.3% for AGIs $75k-100k, 3.0% for AGIs over 100k)
Taxable dividends: $9,511 (reported on 41.9% of returns)
Here:
$9,511
State:
$4,746
(% of AGI for various income ranges: 3.7% for AGIs $10k-25k, 1.7% for AGIs $25k-50k, 1.0% for AGIs $50k-75k, 1.1% for AGIs $75k-100k, 2.2% for AGIs over 100k)
Net capital gain/loss: +$87,746 (reported on 41.3% of returns)
Here:
+$87,746
State:
+$23,418
(% of AGI for various income ranges: 0.7% for AGIs $10k-25k, -0.1% for AGIs $25k-50k, -0.3% for AGIs $50k-75k, 0.3% for AGIs $75k-100k, 22.5% for AGIs over 100k)
Profit/loss from business: +$34,326 (reported on 17.3% of returns)
Here:
+$34,326
State:
+$16,826
(% of AGI for various income ranges: 16.8% for AGIs $10k-25k, 6.9% for AGIs $25k-50k, 5.6% for AGIs $50k-75k, 4.9% for AGIs $75k-100k, 2.6% for AGIs over 100k)
IRA payment deduction: $2,846 (reported on 2.9% of returns)
94105:
$2,846
California:
$3,192
Self-employed pension: $26,306 (reported on 4.1% of returns)
Here:
$26,306
California:
$17,688
Total itemized deductions: $44,445 (16% of AGI, reported on 61.0% of returns)
Here:
$44,445
State:
$28,113
Here:
15.7% of AGI
State:
25.3% of AGI
(% of AGI for various income ranges: 22.1% for AGIs $10k-25k, 15.1% for AGIs $25k-50k, 16.1% for AGIs $50k-75k, 17.9% for AGIs $75k-100k, 13.8% for AGIs over 100k)
Charity contributions deductions: $5,451 (2% of AGI, reported on 48.9% of returns)
Here:
$5,451
State:
$3,923
Here:
1.7% of AGI
State:
3.3% of AGI
(% of AGI for various income ranges: 1.4% for AGIs $10k-25k, 0.9% for AGIs $25k-50k, 1.3% for AGIs $50k-75k, 1.1% for AGIs $75k-100k, 1.5% for AGIs over 100k)
Total tax: $43,217 (reported on 90.4% of returns)
94105:
$43,217
State:
$10,761
(% of AGI for various income ranges: 7.0% for AGIs $10k-25k, 10.3% for AGIs $25k-50k, 13.9% for AGIs $50k-75k, 15.8% for AGIs $75k-100k, 21.9% for AGIs over 100k)
Earned income credit: $835 (reported on 3.1% of returns)
Here:
$835
State:
$1,763
Percentage of individuals using paid preparers for their 2004 taxes: 54.1%
Here:
54%
State:
66%
(% for various income ranges: 61.7% for AGIs below $10k, 52.2% for AGIs $10k-25k, 45.8% for AGIs $25k-50k, 47.2% for AGIs $50k-75k, 42.9% for AGIs $75k-100k, 63.5% for AGIs over 100k)
Likely homosexual households (counted as self-reported same-sex unmarried-partner households)
Lesbian couples: 0.0% of all households
Gay men: 1.8% of all households
Household received Food Stamps/SNAP in the past 12 months: 106 Household did not receive Food Stamps/SNAP in the past 12 months: 7,455
Women who had a birth in the past 12 months: 117 (116 now married, 0 unmarried) Women who did not have a birth in the past 12 months: 4,807 (1,952 now married, 2,853 unmarried)
Housing units in zip code 94105 with a mortgage: 2,046 (115 second mortgage, 120 both second mortgage and home equity loan) Median monthly owner costs for units with a mortgage: $3,876 Median monthly owner costs for units without a mortgage: $1,556
Residents with income below the poverty level in 2022:
This zip code:
5.2%
Whole state:
12.2%
Residents with income below 50% of the poverty level in 2022:
This zip code:
0.3%
Whole state:
6.2%
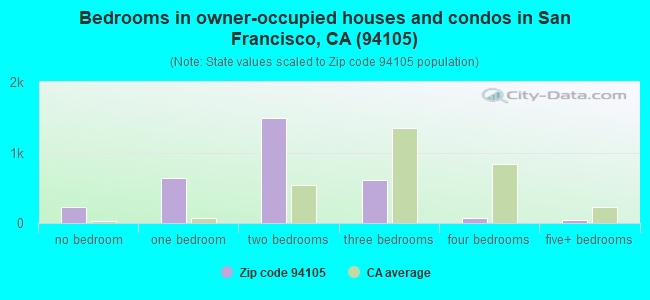
Median number of rooms in houses and condos:
Here:
3.5
State:
6.0
Median number of rooms in apartments:
Here:
2.6
State:
3.9
Notable locations in this zip code not listed on our city pages
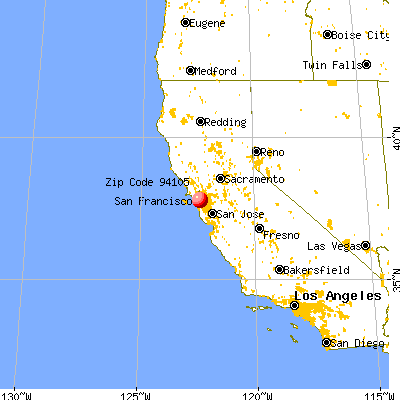
Notable locations in zip code 94105: Montgomery Street Bay Area Rapid Transit Station (A), Pier 24 (B), Jewish Community Museum (C), Rincon Center (D), Hills Plaza (E), Federal Reserve Bank of San Francisco (F), Transbay Bus Terminal (G), Rincon Towers (H), San Francisco Fire Department Station 1 (I), San Francisco Fire Department Station 35 (J). Display/hide their locations on the map
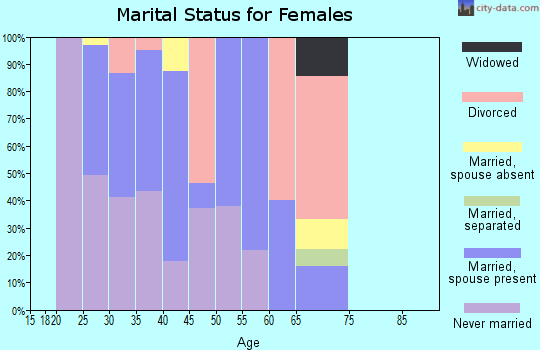
362 married couples with children.
94 single-parent households (94 women).
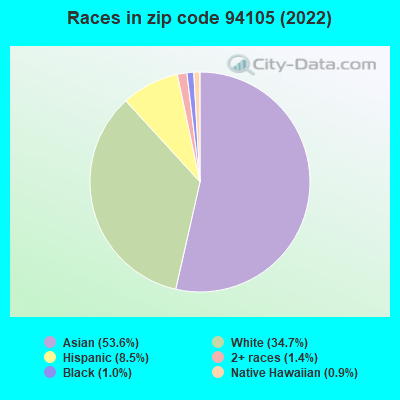
48.1% of residents of 94105 zip code speak English at home.
6.6% of residents speak Spanish at home (41% very well, 30% well, 22% not well, 7% not at all).
11.4% of residents speak other Indo-European language at home (86% very well, 14% well).
32.5% of residents speak Asian or Pacific Island language at home (84% very well, 11% well, 2% not well, 3% not at all).
1.1% of residents speak other language at home (93% very well, 7% well).
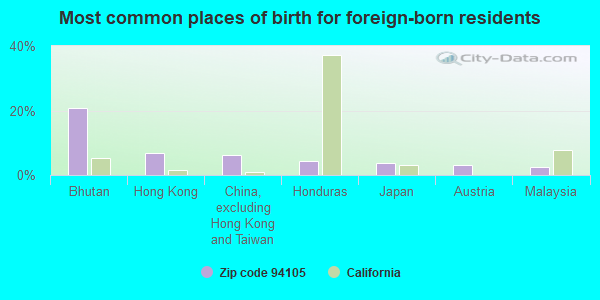
Foreign born population: 5,983 (44.0%) (38.9% of them are naturalized citizens)
Major facilities with environmental interests located in this zip code:
CALTRANS WEST APRROACH TO THE SFOBB (ROUTE 80 FROM 5TH ST in SAN FRANCISCO, CA)
STATE MASTER (California - Hazardous Waste Tracking) - HAZARDOU WASTE PROGRAM Large Quantity Generators, more that 1000 kg of hazardous waste/month (Resource Conservation and Recovery Act (tracking hazardous waste)) Organizations: DEANNA ROZGAY RESIDENT ENGINEER (CONTACT/OPERATOR)
235 SECOND ST L L C (235 2ND ST in SAN FRANCISCO, CA)
STATE MASTER (California - Hazardous Waste Tracking) - HAZARDOU WASTE PROGRAM Large Quantity Generators, more that 1000 kg of hazardous waste/month (Resource Conservation and Recovery Act (tracking hazardous waste)) - notification
K2 FIRST STREET ASSOCIATES LLC (507 AND 515 HOWARD ST AND 204 in SAN FRANCISCO, CA)
STATE MASTER (California - Hazardous Waste Tracking) - HAZARDOU WASTE PROGRAM Large Quantity Generators, more that 1000 kg of hazardous waste/month (Resource Conservation and Recovery Act (tracking hazardous waste)) - notification
F1 K1 FIRST ST ASSOC L L C (FIRST ST FREMONT ST HOWARD ST in SAN FRANCISCO, CA)
STATE MASTER (California - Hazardous Waste Tracking) - HAZARDOU WASTE PROGRAM Large Quantity Generators, more that 1000 kg of hazardous waste/month (Resource Conservation and Recovery Act (tracking hazardous waste)) - notification
ABS-CBN TELECOM NORTH AMERICA INC (450 MISSION ST STE 303 in SAN FRANCISCO, CA) . Federal Facility
STATE MASTER (California - Hazardous Waste Tracking) - HAZARDOU WASTE PROGRAM Large Quantity Generators, more that 1000 kg of hazardous waste/month (Resource Conservation and Recovery Act (tracking hazardous waste)) - notification Organizations: ABS CBN TELECOM N A (CONTACT/OWNER)
Alternative names: ABS CBN TELECOM N A SAN FRANCISCO
GAP INC (1 HARRISON ST in SAN FRANCISCO, CA)
STATE MASTER (California - Hazardous Waste Tracking) - HAZARDOU WASTE PROGRAM Small Quantity Generators, between 100 kg and 1000 kg of hazardous waste/month (Resource Conservation and Recovery Act (tracking hazardous waste)) - notification
GAP INC (2 FOLSOM ST in SAN FRANCISCO, CA)
STATE MASTER (California - Hazardous Waste Tracking) - HAZARDOU WASTE PROGRAM Small Quantity Generators, between 100 kg and 1000 kg of hazardous waste/month (Resource Conservation and Recovery Act (tracking hazardous waste)) - notification
MOKU PAHU ITB NUMBER CG000290 (333 MARKET ST in SAN FRANCISCO, CA)
STATE MASTER (California - Hazardous Waste Tracking) - HAZARDOU WASTE PROGRAM Small Quantity Generators, between 100 kg and 1000 kg of hazardous waste/month (Resource Conservation and Recovery Act (tracking hazardous waste)) - notification Organizations: HAWAII SUGAR TRANSP CO INC (CONTACT/OWNER)
Alternative names: SHIP:MOKU PAHU/MATSON NAVIGATION CO
CALTRANS DIST 4 (160 HARRISON ST in SAN FRANCISCO, CA)
STATE MASTER (California - Hazardous Waste Tracking) - HAZARDOU WASTE PROGRAM Small Quantity Generators, between 100 kg and 1000 kg of hazardous waste/month (Resource Conservation and Recovery Act (tracking hazardous waste)) - notification
CALTRANS - WEST BAY PAINT (435 BEALE STREET in SAN FRANCISCO, CA)
HAZARDOUS WASTE BIENNIAL REPORTER (Resource Conservation and Recovery Act (tracking hazardous waste)) Large Quantity Generators, more that 1000 kg of hazardous waste/month (Resource Conservation and Recovery Act (tracking hazardous waste)) Organizations: STATE OF CALIFORNIA (CONTACT/OPERATOR)
Alternative names: CALTRANS DISTRICT 4
HILLS PLAZA PHASE II (345 SPEAR ST STE 735 in SAN FRANCISCO, CA)
(Resource Conservation and Recovery Act (tracking hazardous waste)) Organizations: HARRISON PLAZA LTD (CONTACT/OWNER)
F2 FIRST ST ASSOC L L C (BLOCK BOUND BY FIRST ST HOWA R in SAN FRANCISCO, CA)
Large Quantity Generators, more that 1000 kg of hazardous waste/month (Resource Conservation and Recovery Act (tracking hazardous waste)) - notification
FOUNDRY SQUARE ASSOC I V L L C (39 NATOMA ST REDEVELOPMENT in SAN FRANCISCO, CA)
Large Quantity Generators, more that 1000 kg of hazardous waste/month (Resource Conservation and Recovery Act (tracking hazardous waste)) - notification
Housing units lacking complete kitchen facilities: 0.1%
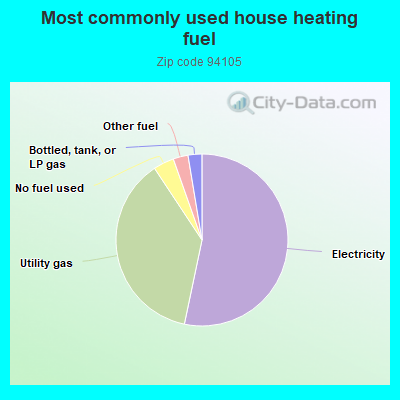
53.3%Electricity
37.4%Utility gas
3.9%No fuel used
2.8%Other fuel
2.6%Bottled, tank, or LP gas
Population in 1990: 2,054. Population change in the 1990s: +4 (+0.2%).
Place of birth for U.S.-born residents:
This state: 3,884
Northeast: 1,235
Midwest: 653
South: 1,114
West: 551
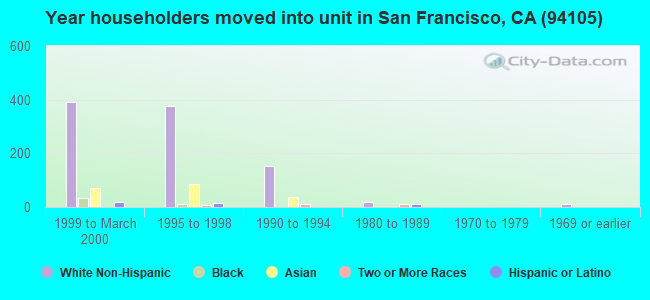
18% of the 94105 zip code residents lived in the same house 5 years ago. Out of people who lived in different houses, 31% lived in this county. Out of people who lived in different counties, 50% lived in California.
64% of the 94105 zip code residents lived in the same house 1 year ago. Out of people who lived in different houses, 47% moved from this county. Out of people who lived in different houses, 22% moved from different county within same state. Out of people who lived in different houses, 17% moved from different state. Out of people who lived in different houses, 12% moved from abroad.
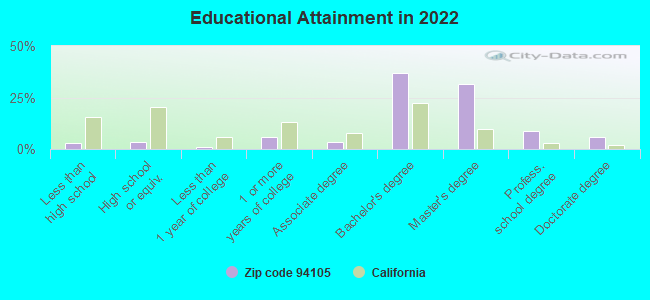
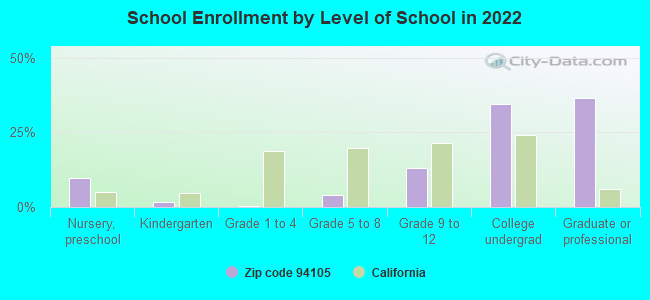
Private vs. public school enrollment:
Students in private schools in grades 1 to 8 (elementary and middle school):
Here:
0.0%
California:
10.5%
Students in private schools in grades 9 to 12 (high school):
Here:
0.0%
California:
8.5%
Students in private undergraduate colleges: 245
Here:
62.6%
California:
15.9%
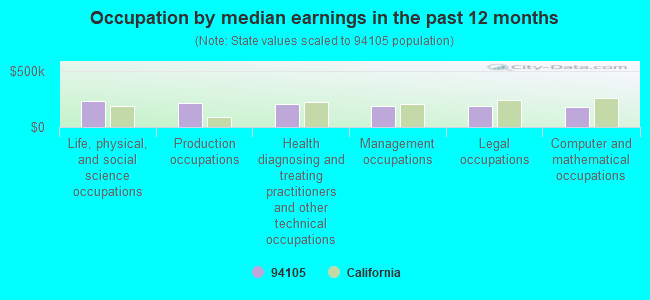
Occupation by median earnings in the past 12 months ($)
237,945Life, physical, and social science occupations
217,710Production occupations
203,815Health diagnosing and treating practitioners and other technical occupations
186,273Management occupations
184,784Legal occupations
180,388Computer and mathematical occupations
Companies with biggest federal contracts located in this zip code:
BECHTEL PARSONS BLUE GRASS, A (50 BEALE ST in SAN FRANCISCO, CA) : $240,895,139 in 40 contractsfrom 2003 to 2006
Contracts for Hazardous Substance Removal, Cleanup, and Disposal Services and Operational Support, Demolition of Buildings by Army Signed by year:2000: $0; 2001: $0; 2002: $0; 2003: $37,462,720; 2004: $55,621,599; 2005: $51,390,259; 2006: $96,420,561.
Biggest contracts:
$34,400,000 with Army for Hazardous Substance Removal, Cleanup, and Disposal Services and Operational Support. Signed on 2006-06-07. Completion date: 2013-06-13.
$27,000,000, same as above.Signed on 2006-01-04. Completion date: 2013-06-13.
$25,000,000 with Army for Hazardous Substance Removal, Cleanup, and Disposal Services and Operational Support. Taking place in KY. Signed on 2005-03-31. Completion date: 2013-06-13.
$21,200,000 with Army for Hazardous Substance Removal, Cleanup, and Disposal Services and Operational Support. Signed on 2004-12-03. Completion date: 2013-06-13.
TETRA TECH EM INC (135 MAIN ST in SAN FRANCISCO, CA) : $72,803,341 in 2559 contractsfrom 1999 to 2006
Contracts for Other Architect and Engineering Services, Construction of Structures and Facilities -- Other Non-Building Facilities, Hazardous Substance Removal, Cleanup, and Disposal Services and Operational Support, Industrial Investigations, Surveys and Technical Support for Multiple Pollutants, and moreby Navy, Forest Service (disused code: now 12C2), Bureau of Land Management, Forest Service, and others Signed by year:2000: $36,884,813; 2001: $31,585,709; 2002: -$130,043; 2003: -$390,754; 2004: -$788,278; 2005: $352,167; 2006: $152,845.
Biggest contracts:
$5,000,000 with Navy for Other Architect and Engineering Services. Signed on 2000-12-07. Completion date: 2002-10-30.
$2,434,471, same as above.Signed on 2001-07-31. Completion date: 2002-09-30.
$2,324,493, same as above.Signed on 2001-11-01. Completion date: 2002-10-31.
$2,036,649, same as above.Signed on 1999-10-01. Completion date: 1999-09-30.
PROMIA INCORPORATED (160 SPEAR STREET in SAN FRANCISCO, CA; small business) : $20,972,146 in 16 contractsfrom 2000 to 2006
Contracts for R&D-SPACE & TERRESTRIAL-OPSY DEV, Defense Electronics and Communication Equipment -- Advanced Development (R&D) by Navy Signed by year:2000: $730,825; 2001: $6,254,000; 2002: $2,224,948; 2003: $4,374,370; 2004: $3,609,520; 2005: $1,711,483; 2006: $2,067,000.
Biggest contracts:
$6,254,000 with Navy for R&D-SPACE & TERRESTRIAL-OPSY DEV. Signed on 2001-09-14. Completion date: 2003-09-14.
$3,399,988, same as above.Signed on 2003-08-12. Completion date: 2004-09-30.
$2,909,520, same as above.Signed on 2004-06-10. Completion date: 2006-09-30.
$1,999,948, same as above.Signed on 2002-09-20. Completion date: 2004-07-20.
CHEVRON CORPORATION (575 MARKET ST in SAN FRANCISCO, CA) : $7,920,107 in 17 contractsfrom 2000 to 2006
Contracts for Lease or Rental of Facilities -- Fuel Storage Buildings, Other Professional Services, Maintenance, Repair and Rebuilding of Equipment -- Metalworking Machinery by Defense Logistics Agency, Navy Signed by year:2000: $979,887; 2001: $1,045,058; 2002: $176,872; 2003: $0; 2004: $484,407; 2005: $1,961,876; 2006: $3,272,007.
Biggest contracts:
$3,272,007 with Defense Logistics Agency for Lease or Rental of Facilities -- Fuel Storage Buildings. Taking place in AK. Signed on 2006-03-23. Completion date: 2016-08-19.
$1,961,876, same as above.Signed on 2005-08-15. Completion date: 2016-08-19.
$694,819 with Navy for Other Professional Services. Signed on 2000-06-23. Completion date: 2000-09-30.
$623,274, same as above.Signed on 2001-09-26. Completion date: 2002-09-25.
INCHCAPE SHIPPING SERVICES INC (180 HOWARD ST STE 450 in SAN FRANCISCO, CA) : $4,402,708 in 57 contractsfrom 1999 to 2001
Contracts for Logistics Support Services by Navy Signed by year:2000: $2,851,883; 2001: $864,656; 2002: $0; 2003: $0; 2004: $0; 2005: $0; 2006: $0.
Biggest contracts:
$254,927 with Navy for Logistics Support Services. Signed on 2001-03-02. Completion date: 2001-03-05.
$246,367, same as above.Signed on 2000-10-05. Completion date: 2000-10-10.
$199,775, same as above.Signed on 2000-10-05. Completion date: 2000-10-10.
$170,731, same as above.Signed on 2000-09-20. Completion date: 2000-09-25.
BECHTEL ENVIRONMENTAL, INC (50 BEALE STREET in SAN FRANCISCO, CA) : $3,038,336 in 11 contractsfrom 2000 to 2004
Contracts for Other Environmental Services, Studies, and Analytical Support, Water Quality Studies by Navy Signed by year:2000: $2,247,123; 2001: $0; 2002: $0; 2003: $683,264; 2004: $107,949; 2005: $0; 2006: $0.
Biggest contracts:
$1,383,751 with Navy for Other Environmental Services, Studies, and Analytical Support. Signed on 2000-01-26. Completion date: 2002-01-30.
$393,554 with Navy for Water Quality Studies. Signed on 2003-12-03. Completion date: 2005-02-05.
$369,756 with Navy for Other Environmental Services, Studies, and Analytical Support. Signed on 2000-01-24. Completion date: 2000-09-30.
$328,301, same as above.Signed on 2000-02-17. Completion date: 2001-04-17.
WATERFRONT CONTAINER LEASING C (101 THE EMBARCADERO # 200 in SAN FRANCISCO, CA; small business) 1000 employees, $0 revenue: $2,907,442 in 39 contractsfrom 2000 to 2005
Contracts for Specialized Shipping and Storage Containers, Miscellaneous Materials Handling Equipment, Non-nuclear Ship Repair (West) Ship repair (including overhauls and conversions) performed on. non-nuclear propelled and nonpropelled ships west of the 108th meridian by Defense Logistics Agency, Air Force, Navy, Bureau of Land Management, and others Signed by year:2000: $361,200; 2001: $509,210; 2002: $688,748; 2003: $382,100; 2004: $601,080; 2005: $365,104; 2006: $0.
Biggest contracts:
$659,000 with Defense Logistics Agency for Specialized Shipping and Storage Containers. Signed on 2002-08-13. Completion date: 2002-10-13.
$356,148 with Air Force for Miscellaneous Materials Handling Equipment. Taking place in VA. Signed on 2003-05-30. Completion date: 2003-09-30.
$192,360 with Navy for Non-nuclear Ship Repair (West) Ship repair (including overhauls and conversions) performed on. non-nuclear propelled and nonpropelled ships west of the 108th meridian. Signed on 2001-12-04. Completion date: 2002-02-28.
$182,100, same as above.Signed on 2000-05-19. Completion date: 2000-08-19.
BLACKSTONE TECHNOLOGY GROUP (605 MARKET ST in SAN FRANCISCO, CA; small business) : $2,390,783 in 4 contractsfrom 2004 to 2006
$1,695,627 with Office of the Secretary, Department of Homeland Security for Program Management/Support Services. Taking place in VA. Signed on 2006-09-29. Completion date: 2011-02-07.
$442,317 with Office of the Secretary, Department of Homeland Security for Other Management Support Services. Taking place in DC. Signed on 2006-04-26. Completion date: 2011-12-14.
$219,001 with Office of the Secretary, Department of Homeland Security for Other ADP and Telecommunications Services (includes data storage on tapes, compact disks, etc.). Taking place in DC. Signed on 2006-04-04. Completion date: 2011-12-14.
$33,838 with Defense Information Systems Agency for ADP Facility Operation and Maintenance Services. Taking place in DC. Signed on 2004-07-23. Completion date: 2004-09-30.
WELLS FARGO BANK N. A. NTL BNK ASC. ( in San Francisco, CA) : $2,157,419 in 23 contractsfrom 2003 to 2006
Contracts for Lease or Rental of Facilities -- Office Buildings by Public Buildings Service Signed by year:2000: $0; 2001: $0; 2002: $0; 2003: $640,678; 2004: $284,154; 2005: $758,102; 2006: $474,485.
Biggest contracts:
$94,897 with Public Buildings Service for Lease or Rental of Facilities -- Office Buildings. Signed on 2006-01-01. Completion date: 2006-09-30.
$94,897, same as above.Signed on 2006-04-01. Completion date: 2006-09-30.
$94,897, same as above.Signed on 2006-04-01. Completion date: 2006-09-30.
$94,897, same as above.Signed on 2006-07-01. Completion date: 2006-09-30.
GAS IMAGING SYSTEMS, INC (ONE MARKET STREETSTEUART T in SAN FRANCISCO, CA; small business) : $1,659,002 in 13 contractsfrom 2004 to 2006
Contracts for Gases: Compressed and Liquefied by Defense Logistics Agency, Navy Signed by year:2000: $0; 2001: $0; 2002: $0; 2003: $0; 2004: $438,625; 2005: $402,934; 2006: $817,443.
Biggest contracts:
$817,443 with Defense Logistics Agency for Gases: Compressed and Liquefied. Signed on 2006-04-14. Completion date: 2006-10-25.
$218,790 with Defense Logistics Agency for Gases: Compressed and Liquefied. Taking place in IL. Signed on 2004-04-21. Completion date: 2004-06-05.
$168,300, same as above.Signed on 2005-02-18. Completion date: 2005-04-04.
$146,234, same as above.Signed on 2005-04-04. Completion date: 2005-05-04.
Top industries in this zip code by the number of employees in 2005:
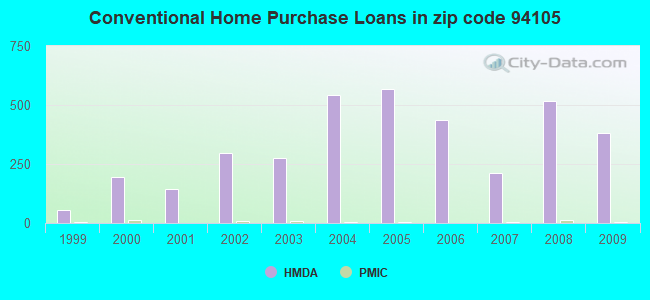
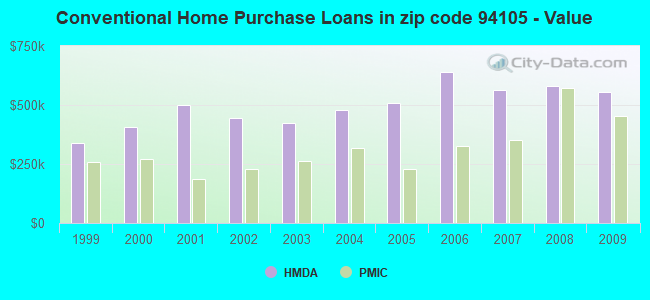
Detailed PMIC statistics for the following Tracts:0176.02
, 0179.01
2005 - 2018 National Fire Incident Reporting System (NFIRS) incidents
According to the data from the years 2005 - 2018 the average number of fires per year is 162. The highest number of reported fire incidents - 254 took place in 2013, and the least - 58 in 2016. The data has a decreasing trend.
When looking into fire subcategories, the most incidents belonged to: Structure Fires (59.7%), and Outside Fires (34.2%).
Fire incident types reported to NFIRS in Zip Code 94105


 Nearest zip codes: 94104, 94111, 94108, 94133, 94158, 94103.


 According to the data from the years 2005 - 2018 the average number of fires per year is 162. The highest number of reported fire incidents - 254 took place in 2013, and the least - 58 in 2016. The data has a decreasing trend.
 When looking into fire subcategories, the most incidents belonged to: Structure Fires (59.7%), and Outside Fires (34.2%).