Estimated zip code population in 2022: 11,969 Zip code population in 2010: 13,768 Zip code population in 2000: 13,716
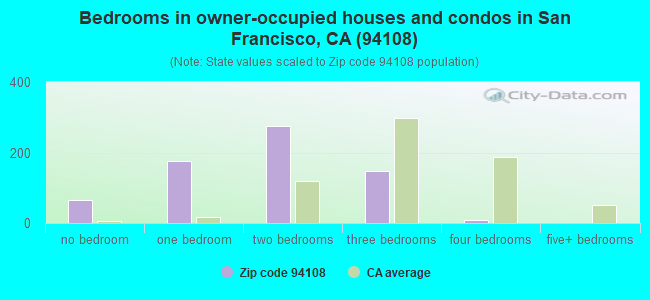
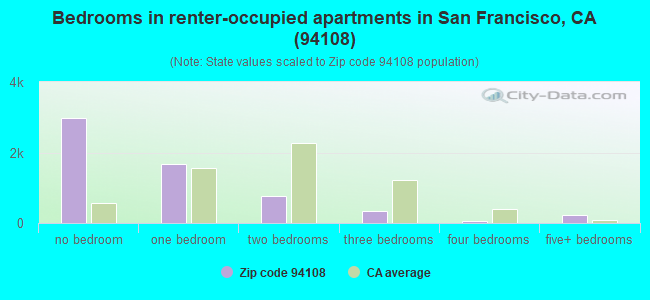
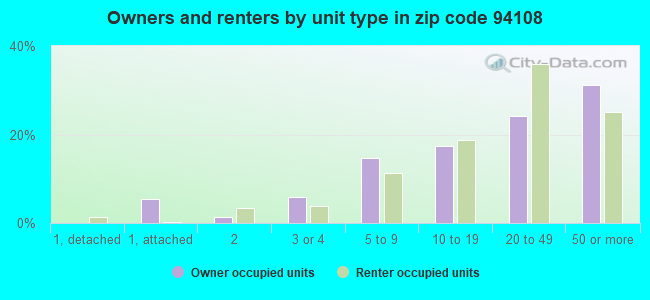
Houses and condos: 8,078 Renter-occupied apartments: 5,903
% of renters here:
90%
State:
44%
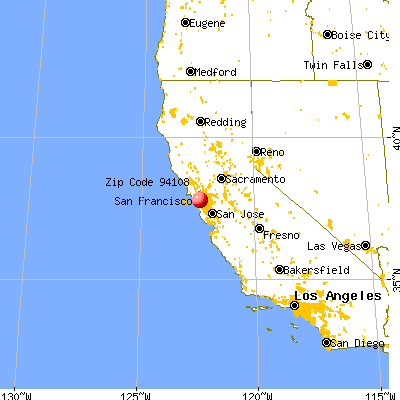
March 2022 cost of living index in zip code 94108: 141.8 (very high, U.S. average is 100)
Land area: 0.3 sq. mi. Water area: 0.0 sq. mi.
Population density: 44,320 people per square mile
(very high).
OSM Map
General Map
Google Map
MSN Map
OSM Map
General Map
Google Map
MSN Map
OSM Map
General Map
Google Map
MSN Map
OSM Map
General Map
Google Map
MSN Map
Please wait while loading the map...
Real estate property taxes paid for housing units in 2022:
This zip code:
0.7% ($10,292)
California:
0.7% ($4,831)
Median real estate property taxes paid for housing units with mortgages in 2022: $10,330 (0.7%) Median real estate property taxes paid for housing units with no mortgage in 2022: $10,572 (0.8%)
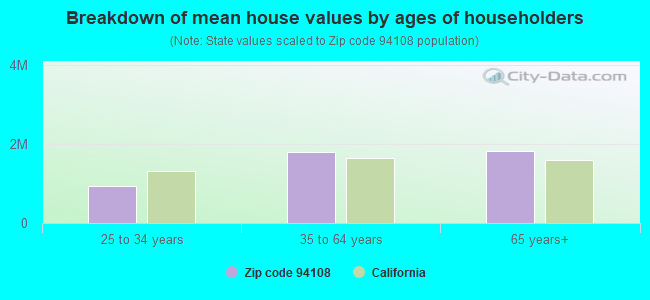
Estimated median house/condo value in 2022: $1,406,934
94108:
$1,406,934
California:
$715,900
According to our research of California and other state lists, there were 12 registered sex offenders living in 94108 zip code as of April 26, 2024. The ratio of all residents to sex offenders in zip code 94108 is 1,243 to 1. The ratio of registered sex offenders to all residents in this zip code is lower than the state average.
Median resident age:
This zip code:
44.1 years
California median age:
37.9 years
Average household size:
This zip code:
1.8 people
California:
2.8 people
Averages for the 2020 tax year for zip code 94108, filed in 2021:
Average Adjusted Gross Income (AGI) in 2020: $108,254 (Individual Income Tax Returns)
Here:
$108,254
State:
$95,910
Salary/wage: $83,378 (reported on 81.6% of returns)
Here:
$83,378
State:
$77,331
(% of AGI for various income ranges: 1230.1% for AGIs below $25k, 4320.9% for AGIs $25k-50k, 8382.4% for AGIs $50k-75k, 11509.7% for AGIs $75k-100k, 23015.8% for AGIs $100k-200k, 155122.5% for AGIs over 200k)
Taxable interest for individuals: $3,806 (reported on 35.1% of returns)
This zip code:
$3,806
California:
$2,294
(% of AGI for various income ranges: 27.5% for AGIs below $25k, 41.6% for AGIs $25k-50k, 77.3% for AGIs $50k-75k, 104.2% for AGIs $75k-100k, 201.5% for AGIs $100k-200k, 4987.5% for AGIs over 200k)
Ordinary dividends: $14,245 (reported on 28.1% of returns)
Here:
$14,245
State:
$10,949
(% of AGI for various income ranges: 39.7% for AGIs below $25k, 64.8% for AGIs $25k-50k, 108.4% for AGIs $50k-75k, 260.0% for AGIs $75k-100k, 546.2% for AGIs $100k-200k, 16598.3% for AGIs over 200k)
Net capital gain/loss in AGI: +$36,772 (reported on 28.1% of returns)
Here:
+$36,772
State:
+$49,306
(% of AGI for various income ranges: 20.9% for AGIs below $25k, 56.2% for AGIs $25k-50k, 150.6% for AGIs $50k-75k, 333.9% for AGIs $75k-100k, 731.9% for AGIs $100k-200k, 48352.5% for AGIs over 200k)
Profit/loss from business: +$20,004 (reported on 15.7% of returns)
Here:
+$20,004
State:
+$15,671
(% of AGI for various income ranges: 150.0% for AGIs below $25k, 259.2% for AGIs $25k-50k, 263.3% for AGIs $50k-75k, 424.2% for AGIs $75k-100k, 927.5% for AGIs $100k-200k, 7354.2% for AGIs over 200k)
Taxable individual retirement arrangement distribution: $25,230 (reported on 5.3% of returns)
94108:
$25,230
California:
$23,505
(% of AGI for various income ranges: 42.6% for AGIs below $25k, 72.9% for AGIs $25k-50k, 121.8% for AGIs $50k-75k, 233.5% for AGIs $75k-100k, 417.5% for AGIs $100k-200k, 3331.7% for AGIs over 200k)
Self-employed (Keogh) retirement plans: $33,900 (reported on 1.1% of returns)
94108:
$33,900
California:
$30,163
(% of AGI for various income ranges: 114.6% for AGIs $100k-200k, 1519.2% for AGIs over 200k)
Total itemized deductions: $49,598 (reported on 9.5% of returns)
Here:
$49,598
State:
$39,517
(% of AGI for various income ranges: 93.7% for AGIs below $25k, 130.9% for AGIs $25k-50k, 161.8% for AGIs $50k-75k, 548.1% for AGIs $75k-100k, 1001.9% for AGIs $100k-200k, 16676.7% for AGIs over 200k)
Charity contributions: $23,024 (reported on 7.4% of returns)
Here:
$23,024
State:
$12,598
(% of AGI for various income ranges: 30.8% for AGIs $25k-50k, 71.0% for AGIs $75k-100k, 170.6% for AGIs $100k-200k, 7755.0% for AGIs over 200k)
Taxes paid: $8,881 (reported on 9.4% of returns)
94108:
$8,881
State:
$8,807
(% of AGI for various income ranges: 14.1% for AGIs below $25k, 33.9% for AGIs $25k-50k, 50.0% for AGIs $50k-75k, 137.7% for AGIs $75k-100k, 272.3% for AGIs $100k-200k, 2300.0% for AGIs over 200k)
Earned income credit: $1,699 (reported on 12.6% of returns)
Here:
$1,699
State:
$2,074
(% of AGI for various income ranges: 85.3% for AGIs below $25k, 66.5% for AGIs $25k-50k)
Percentage of individuals using paid preparers for their 2020 taxes: 92.1%
Here:
92%
State:
92%
(% for various income ranges: 90.4% for AGIs below $25k, 91.4% for AGIs $25k-50k, 91.9% for AGIs $50k-75k, 90.6% for AGIs $75k-100k, 94.7% for AGIs $100k-200k, 95.6% for AGIs over 200k)
Averages for the 2012 tax year for zip code 94108, filed in 2013:
Average Adjusted Gross Income (AGI) in 2012: $141,881 (Individual Income Tax Returns)
Here:
$141,881
State:
$72,726
Salary/wage: $66,404 (reported on 84.0% of returns)
Here:
$66,404
State:
$59,079
(% of AGI for various income ranges: 75.0% for AGIs below $25k, 86.3% for AGIs $25k-50k, 87.1% for AGIs $50k-75k, 86.1% for AGIs $75k-100k, 81.0% for AGIs $100k-200k, 18.9% for AGIs over 200k)
Taxable interest for individuals: $5,448 (reported on 35.5% of returns)
This zip code:
$5,448
California:
$2,146
(% of AGI for various income ranges: 1.2% for AGIs below $25k, 0.6% for AGIs $25k-50k, 0.5% for AGIs $50k-75k, 0.6% for AGIs $75k-100k, 0.6% for AGIs $100k-200k, 1.7% for AGIs over 200k)
Ordinary dividends: $19,407 (reported on 22.6% of returns)
Here:
$19,407
State:
$9,308
(% of AGI for various income ranges: 1.9% for AGIs below $25k, 1.2% for AGIs $25k-50k, 1.2% for AGIs $50k-75k, 1.7% for AGIs $75k-100k, 2.0% for AGIs $100k-200k, 3.8% for AGIs over 200k)
Net capital gain/loss in AGI: +$128,559 (reported on 20.2% of returns)
Here:
+$128,559
State:
+$30,460
(% of AGI for various income ranges: 0.4% for AGIs $50k-75k, 1.1% for AGIs $75k-100k, 1.4% for AGIs $100k-200k, 26.4% for AGIs over 200k)
Profit/loss from business: +$26,314 (reported on 16.5% of returns)
Here:
+$26,314
State:
+$17,064
(% of AGI for various income ranges: 10.7% for AGIs below $25k, 6.1% for AGIs $25k-50k, 4.4% for AGIs $50k-75k, 2.9% for AGIs $75k-100k, 4.5% for AGIs $100k-200k, 2.1% for AGIs over 200k)
Taxable individual retirement arrangement distribution: $31,022 (reported on 5.9% of returns)
94108:
$31,022
California:
$19,557
(% of AGI for various income ranges: 2.2% for AGIs below $25k, 1.1% for AGIs $25k-50k, 1.3% for AGIs $50k-75k, 1.5% for AGIs $75k-100k, 1.6% for AGIs $100k-200k, 1.2% for AGIs over 200k)
Self-employment retirement plans: $26,750 (reported on 1.5% of returns)
94108:
$26,750
California:
$24,530
(% of AGI for various income ranges: 0.7% for AGIs $25k-50k, 0.4% for AGIs $100k-200k, 0.3% for AGIs over 200k)
Total itemized deductions: $49,558 (11% of AGI, reported on 25.7% of returns)
Here:
$49,558
State:
$34,004
Here:
11.0% of AGI
State:
22.7% of AGI
(% of AGI for various income ranges: 4.8% for AGIs below $25k, 3.5% for AGIs $25k-50k, 5.1% for AGIs $50k-75k, 10.1% for AGIs $75k-100k, 12.1% for AGIs $100k-200k, 9.4% for AGIs over 200k)
Charity contributions: $8,730 (reported on 17.4% of returns)
Here:
$8,730
State:
$4,659
(% of AGI for various income ranges: 0.3% for AGIs below $25k, 0.4% for AGIs $25k-50k, 0.5% for AGIs $50k-75k, 1.0% for AGIs $75k-100k, 1.1% for AGIs $100k-200k, 1.2% for AGIs over 200k)
Taxes paid: $41,103 (reported on 25.5% of returns)
94108:
$41,103
State:
$14,448
(% of AGI for various income ranges: 1.2% for AGIs below $25k, 0.8% for AGIs $25k-50k, 1.6% for AGIs $50k-75k, 5.2% for AGIs $75k-100k, 7.5% for AGIs $100k-200k, 8.9% for AGIs over 200k)
Earned income credit: $1,701 (reported on 17.8% of returns)
Here:
$1,701
State:
$2,286
(% of AGI for various income ranges: 5.6% for AGIs below $25k, 0.6% for AGIs $25k-50k)
Percentage of individuals using paid preparers for their 2012 taxes: 51.6%
Here:
52%
State:
64%
(% for various income ranges: 55.8% for AGIs below $25k, 51.6% for AGIs $25k-50k, 39.2% for AGIs $50k-75k, 39.3% for AGIs $75k-100k, 50.0% for AGIs $100k-200k, 78.0% for AGIs over 200k)
Averages for the 2004 tax year for zip code 94108, filed in 2005:
Average Adjusted Gross Income (AGI) in 2004: $140,517 (Individual Income Tax Returns)
Here:
$140,517
State:
$58,600
Salary/wage: $99,047 (reported on 82.2% of returns)
Here:
$99,047
State:
$49,455
(% of AGI for various income ranges: 80.3% for AGIs $10k-25k, 85.5% for AGIs $25k-50k, 81.1% for AGIs $50k-75k, 80.0% for AGIs $75k-100k, 51.9% for AGIs over 100k)
Taxable interest for individuals: $6,192 (reported on 46.2% of returns)
This zip code:
$6,192
California:
$2,365
(% of AGI for various income ranges: 2.2% for AGIs $10k-25k, 1.7% for AGIs $25k-50k, 2.3% for AGIs $50k-75k, 2.6% for AGIs $75k-100k, 1.9% for AGIs over 100k)
Taxable dividends: $12,613 (reported on 28.0% of returns)
Here:
$12,613
State:
$4,746
(% of AGI for various income ranges: 1.8% for AGIs $10k-25k, 1.4% for AGIs $25k-50k, 2.1% for AGIs $50k-75k, 2.0% for AGIs $75k-100k, 2.6% for AGIs over 100k)
Net capital gain/loss: +$118,612 (reported on 25.8% of returns)
Here:
+$118,612
State:
+$23,418
(% of AGI for various income ranges: -0.0% for AGIs $10k-25k, 0.4% for AGIs $25k-50k, 1.2% for AGIs $50k-75k, 1.4% for AGIs $75k-100k, 26.4% for AGIs over 100k)
Profit/loss from business: +$29,825 (reported on 17.6% of returns)
Here:
+$29,825
State:
+$16,826
(% of AGI for various income ranges: 8.4% for AGIs $10k-25k, 5.1% for AGIs $25k-50k, 5.2% for AGIs $50k-75k, 6.4% for AGIs $75k-100k, 3.3% for AGIs over 100k)
IRA payment deduction: $3,066 (reported on 4.1% of returns)
94108:
$3,066
California:
$3,192
(% of AGI for various income ranges: 0.5% for AGIs $10k-25k, 0.6% for AGIs $25k-50k, 0.3% for AGIs $50k-75k, 0.0% for AGIs over 100k)
Self-employed pension: $17,019 (reported on 3.4% of returns)
Here:
$17,019
California:
$17,688
(% of AGI for various income ranges: 0.2% for AGIs $10k-25k, 0.2% for AGIs $25k-50k, 0.4% for AGIs $50k-75k, 0.9% for AGIs $75k-100k, 0.4% for AGIs over 100k)
Total itemized deductions: $72,531 (14% of AGI, reported on 23.1% of returns)
Here:
$72,531
State:
$28,113
Here:
14.0% of AGI
State:
25.3% of AGI
(% of AGI for various income ranges: 3.5% for AGIs $10k-25k, 5.2% for AGIs $25k-50k, 9.0% for AGIs $50k-75k, 12.7% for AGIs $75k-100k, 12.9% for AGIs over 100k)
Charity contributions deductions: $12,941 (2% of AGI, reported on 18.1% of returns)
Here:
$12,941
State:
$3,923
Here:
2.4% of AGI
State:
3.3% of AGI
(% of AGI for various income ranges: 0.4% for AGIs $10k-25k, 0.5% for AGIs $25k-50k, 0.9% for AGIs $50k-75k, 1.3% for AGIs $75k-100k, 1.9% for AGIs over 100k)
Total tax: $38,220 (reported on 78.2% of returns)
94108:
$38,220
State:
$10,761
(% of AGI for various income ranges: 5.0% for AGIs $10k-25k, 9.6% for AGIs $25k-50k, 13.6% for AGIs $50k-75k, 15.5% for AGIs $75k-100k, 23.5% for AGIs over 100k)
Earned income credit: $1,381 (reported on 15.5% of returns)
Here:
$1,381
State:
$1,763
Percentage of individuals using paid preparers for their 2004 taxes: 60.3%
Here:
60%
State:
66%
(% for various income ranges: 61.8% for AGIs below $10k, 65.2% for AGIs $10k-25k, 51.5% for AGIs $25k-50k, 49.2% for AGIs $50k-75k, 53.6% for AGIs $75k-100k, 79.1% for AGIs over 100k)
Likely homosexual households (counted as self-reported same-sex unmarried-partner households)
Lesbian couples: 0.1% of all households
Gay men: 0.8% of all households
Household received Food Stamps/SNAP in the past 12 months: 1,352 Household did not receive Food Stamps/SNAP in the past 12 months: 5,353
Women who had a birth in the past 12 months: 123 (120 now married, 2 unmarried) Women who did not have a birth in the past 12 months: 2,844 (641 now married, 2,223 unmarried)
Housing units in zip code 94108 with a mortgage: 387 (57 second mortgage, 60 both second mortgage and home equity loan) Median monthly owner costs for units with a mortgage: $3,645 Median monthly owner costs for units without a mortgage: $1,556
Residents with income below the poverty level in 2022:
This zip code:
18.7%
Whole state:
12.2%
Residents with income below 50% of the poverty level in 2022:
This zip code:
9.6%
Whole state:
6.2%
Median number of rooms in houses and condos:
Here:
4.3
State:
6.0
Median number of rooms in apartments:
Here:
2.3
State:
3.9
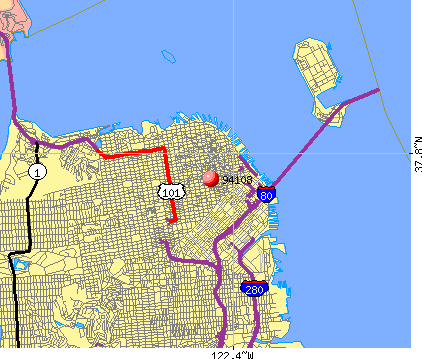
Notable locations in this zip code not listed on our city pages
Notable locations in zip code 94108: Chinatown Branch Library (A), San Francisco Environmental Center (B), Pacific Union Club (C), Masonic Memorial Temple (D), Hartford Building (E), Cable Car Barn and Museum (F), James C Flood Mansion (G), American Conservatory Theater - Administrative Offices (H). Display/hide their locations on the map
Churches in zip code 94108 include: Chapel of Grace (A), Chinese Baptist Church (B), Grace Cathedral (C), Notre Dame Des Victoires Church (D), Old Saint Marys Church (E), Saint Marys Chinese Mission (F), Tin How Temple (G), Chinese United Methodist Church (H), Buddhas Universal Church (I). Display/hide their locations on the map
Parks in zip code 94108 include: Portsmouth Square (1), Chinese Childrens Playground (2), Huntington Park (3), Saint Marys Square (4), Chinese Recreation Center (5). Display/hide their locations on the map
Tourist attractions (not listed on the city page) : Forever Happy Tours (Tourism Consultants; 447 Sutter Street #411), Cebu Philippines Travel (Recreational Trips & Guides; 447 Sutter St).
720 married couples with children.
313 single-parent households (96 men, 217 women).
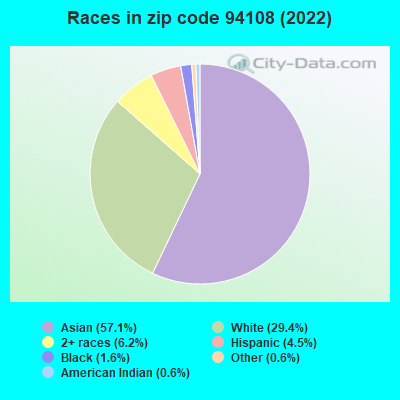
43.4% of residents of 94108 zip code speak English at home.
2.7% of residents speak Spanish at home (71% very well, 27% well, 3% not at all).
7.3% of residents speak other Indo-European language at home (84% very well, 16% well).
46.9% of residents speak Asian or Pacific Island language at home (27% very well, 14% well, 23% not well, 36% not at all).
0.1% of residents speak other language at home (100% very well).
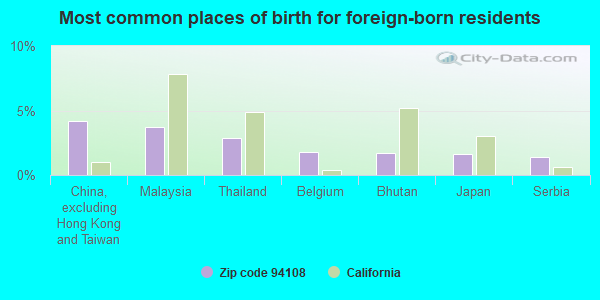
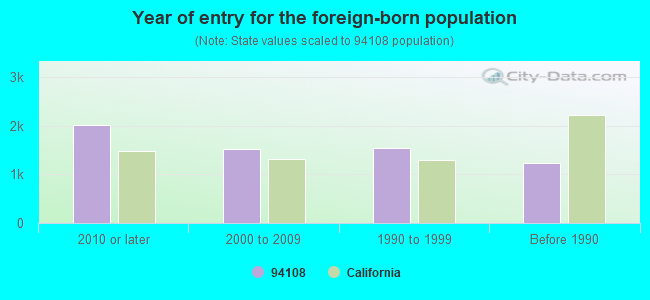
Foreign born population: 5,845 (48.8%) (60.1% of them are naturalized citizens)
Major facilities with environmental interests located in this zip code:
MARK HOPKINS HOTEL (999 CALIFORNIA STREET in SAN FRANCISCO, CA)
STATE MASTER (California - Hazardous Waste Tracking) - HAZARDOU WASTE PROGRAM CRITERIA AND HAZARDOUS AIR POLLUTANT INVENTORY (Inventory of air pollution sources) Small Quantity Generators, between 100 kg and 1000 kg of hazardous waste/month (Resource Conservation and Recovery Act (tracking hazardous waste)) - notification Small Quantity Generators, between 100 kg and 1000 kg of hazardous waste/month (Resource Conservation and Recovery Act (tracking hazardous waste)) - notification Business SIC classification: DRYCLEANING PLANTS, EXCEPT RUG CLEANING Organizations: GRAND METROPOLITAN (CONTACT/OWNER)
, INTER-CONTINTAL HOTEL (CONTACT/OWNER)
Alternative names: INTERCONTINENTAL HOTELS, MARK HOPKINS INTER CONTINENTAL HOTEL
FAIRMONT HOTEL MANAGEMENT COMPANY (950 MASON ST in SAN FRANCISCO, CA)
AIR MINOR (AIRS/AFS) STATE MASTER (California - Hazardous Waste Tracking) - HAZARDOU WASTE PROGRAM CRITERIA AND HAZARDOUS AIR POLLUTANT INVENTORY (Inventory of air pollution sources) Small Quantity Generators, between 100 kg and 1000 kg of hazardous waste/month (Resource Conservation and Recovery Act (tracking hazardous waste)) Business SIC classification: HOTELS AND MOTELS; DRYCLEANING PLANTS, EXCEPT RUG CLEANING Alternative names: FAIRMONT HOTEL S F L P, FAIRMOUNT HOTEL
CAMPTON PLACE HOTEL (340 STOCKTON STREET in SAN FRANCISCO, CA)
STATE MASTER (California - Hazardous Waste Tracking) - HAZARDOU WASTE PROGRAM CRITERIA AND HAZARDOUS AIR POLLUTANT INVENTORY (Inventory of air pollution sources) Small Quantity Generators, between 100 kg and 1000 kg of hazardous waste/month (Resource Conservation and Recovery Act (tracking hazardous waste)) - notification Business SIC classification: DRYCLEANING PLANTS, EXCEPT RUG CLEANING Organizations: AYALLA HOTELS CORP (CONTACT/OWNER)
ACADEMY OF ART UNIVERSITY (540 POWELL ST in SAN FRANCISCO, CA) . Federal Facility
STATE MASTER (California - Hazardous Waste Tracking) - HAZARDOU WASTE PROGRAM Small Quantity Generators, between 100 kg and 1000 kg of hazardous waste/month (Resource Conservation and Recovery Act (tracking hazardous waste)) - notification Organizations: RICHARD A STEPHENS (CONTACT/OWNER)
Alternative names: ACADEMY OF ART COLLEGE
INTERNATIONAL BUILDING (601 CALIFORNIA ST in SAN FRANCISCO, CA)
STATE MASTER (California - Hazardous Waste Tracking) - HAZARDOU WASTE PROGRAM Small Quantity Generators, between 100 kg and 1000 kg of hazardous waste/month (Resource Conservation and Recovery Act (tracking hazardous waste)) Alternative names: HINES
KWONG SANG LUNG COMPANY (947 GRANT AVENUE in SAN FRANCISCO, CA)
(Integrated Compliance Information System) - ICIS-09-2003-0133, FORMAL ENFORCEMENT ACTION COMPLIANCE ACTIVITY (Tracking inspections of insecticide, fungicide, and rodenticide, and toxic substances) Business SIC classification: GROCERY STORES
LAU (GORDON J) ELEMENTARY (950 CLAY ST in SAN FRANCISCO, CA)
(National Center for Education Statistics) - STATE ID-6040877 Organizations: SAN FRANCISCO UNIFIED (SCHOOL DISTRICT)
HOEY CHUCK AND ASSOCIATES (445 GRANT AVENUE #400 in SAN FRANCISCO, CA)
COMPLIANCE ACTIVITY (Tracking inspections of insecticide, fungicide, and rodenticide, and toxic substances) Alternative names: CHUCK, HOOEY AND ASSOCIATES, HOEY, CHUCK AND ASSOCIATES/RE-INSPECTION
FOTRON MAX PHOTO LAB (1021 STOCKTON ST in SAN FRANCISCO, CA)
Small Quantity Generators, between 100 kg and 1000 kg of hazardous waste/month (Resource Conservation and Recovery Act (tracking hazardous waste)) - notification Organizations: FIRST DEVELOPMENT CORP (CONTACT/OWNER)
, LI HEMINWAY (CONTACT/OWNER)
FOUR FIFTY SUTTER RADIOLOGY (450 SUTTER ST 1739 in SAN FRANCISCO, CA)
Small Quantity Generators, between 100 kg and 1000 kg of hazardous waste/month (Resource Conservation and Recovery Act (tracking hazardous waste)) - notification Organizations: THURMOND FEDERAL BARTOK RADILOL (CONTACT/OWNER)
HENRY COTTONS (105 GRANT ST in SAN FRANCISCO, CA)
Small Quantity Generators, between 100 kg and 1000 kg of hazardous waste/month (Resource Conservation and Recovery Act (tracking hazardous waste)) - notification
HI Q PHOTO LAB (727 WASHINGTON ST in SAN FRANCISCO, CA)
Small Quantity Generators, between 100 kg and 1000 kg of hazardous waste/month (Resource Conservation and Recovery Act (tracking hazardous waste)) - notification Organizations: GILMAN LEE (CONTACT/OWNER)
MACYS DIGITAL PREPRESS (170 OFARRELL ST in SAN FRANCISCO, CA)
Small Quantity Generators, between 100 kg and 1000 kg of hazardous waste/month (Resource Conservation and Recovery Act (tracking hazardous waste)) - notification
Housing units lacking complete plumbing facilities: 12.9% Housing units lacking complete kitchen facilities: 15.7%
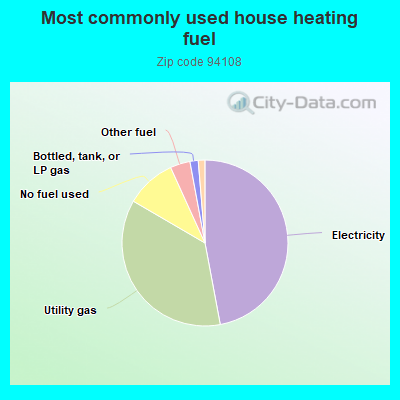
47.1%Electricity
36.4%Utility gas
9.8%No fuel used
3.9%Other fuel
1.6%Bottled, tank, or LP gas
1.3%Fuel oil, kerosene, etc.
Population in 1990: 14,143.
Place of birth for U.S.-born residents:
This state: 3,369
Northeast: 799
Midwest: 567
South: 624
West: 413
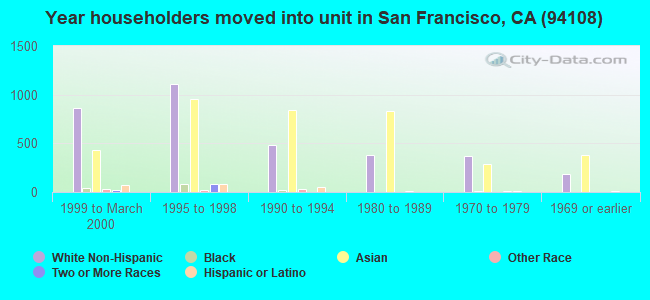
62% of the 94108 zip code residents lived in the same house 5 years ago. Out of people who lived in different houses, 44% lived in this county. Out of people who lived in different counties, 50% lived in California.
88% of the 94108 zip code residents lived in the same house 1 year ago. Out of people who lived in different houses, 55% moved from this county. Out of people who lived in different houses, 13% moved from different county within same state. Out of people who lived in different houses, 25% moved from different state. Out of people who lived in different houses, 7% moved from abroad.
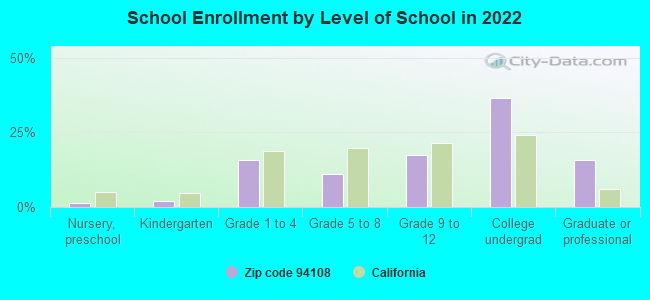
Private vs. public school enrollment:
Students in private schools in grades 1 to 8 (elementary and middle school): 177
Here:
34.6%
California:
10.5%
Students in private schools in grades 9 to 12 (high school): 32
Here:
10.3%
California:
8.5%
Students in private undergraduate colleges: 159
Here:
23.8%
California:
15.9%
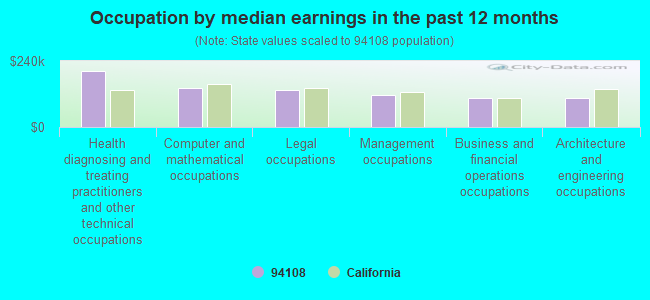
Occupation by median earnings in the past 12 months ($)
203,496Health diagnosing and treating practitioners and other technical occupations
143,626Computer and mathematical occupations
134,376Legal occupations
114,955Management occupations
104,881Business and financial operations occupations
103,940Architecture and engineering occupations
Companies with federal contracts located in this zip code (SAN FRANCISCO, CA):
SAM TECHNOLOGY, INC (425 BUSH STREET, 5TH FLOOR; small business) : $3,619,574 in 15 contractsfrom 2000 to 2005
Contracts for Other Defense -- Applied Research and Exploratory Development (R&D), Other Research and Development -- Applied Research and Exploratory Development (R&D), Other Defense -- Operational Systems Development (R&D), Services -- Management and Support (R&D), and moreby Army, Air Force, Navy, National Institutes of Health, and others Signed by year:2000: $857,667; 2001: $263,000; 2002: $0; 2003: $649,479; 2004: $724,609; 2005: $1,124,819; 2006: $0.
Biggest contracts:
$500,000 with Army for Other Defense -- Applied Research and Exploratory Development (R&D). Signed on 2003-08-25. Completion date: 2005-05-20.
$375,000 with Air Force for Other Research and Development -- Applied Research and Exploratory Development (R&D). Signed on 2005-04-01. Completion date: 2007-04-02.
$374,974 with Navy for Other Defense -- Operational Systems Development (R&D). Signed on 2004-09-02. Completion date: 2005-08-31.
$374,938 with Air Force for Other Research and Development -- Applied Research and Exploratory Development (R&D). Signed on 2005-09-09. Completion date: 2007-04-02.
RENAISSANCE HOTEL OPERATING CO (905 CALIFORNIA ST) : $65,625 in 3 contractsfrom 2003 to 2004
$34,125 with Army for Lease or Rental of Facilities -- Conference Space and Facilities. Signed on 2004-12-14. Completion date: 2005-05-20.
$29,000 with Employment and Training Administration for Civilian Personnel Recruitment. Taking place in OR. Signed on 2003-04-15. Completion date: 2003-05-15.
$2,500 with Public Buildings Service for Lease or Rental of Facilities -- Conference Space and Facilities. Signed on 2004-08-26. Effective on 2004-09-02. Completion date: 2004-09-02.
MICHAEL J PARENTI (No data from D and B; small business)
$25,000 with Forest Service (disused code: now 12C2) for Automated Information System Design and Integration Services. Signed on 2000-09-15. Completion date: 2001-09-15.
$12,000 with U.S. Army Corps of Engineers - civil program financing only for Lease or Rental of Facilities -- Miscellaneous Buildings. Signed on 2002-06-18. Completion date: 2002-05-29.
-$2,135, same as above.Signed on 2002-09-30. Completion date: 2002-05-29.
CHEN, JASON H (12 GEARY STE 308; small business)
$2,630 with Air Force for Miscellaneous Communication Equipment. Signed on 2005-05-26. Completion date: 2005-05-21.
TEXTAINER EQUIPMENT MANAGEMENT (650 CALIFORNIA ST, FL 16) : -$429,019 in 86 contractsfrom 2002 to 2006
Contracts for Motor Freight, Lease or Rental of Equipment -- Ground Effect Vehicles, Motor Vehicles, Trailers, and Cycles, Specialized Shipping and Storage Containers, Lease or Rental of Equipment -- Containers, Packaging, and Packing Supplies, and moreby Army Signed by year:2000: $0; 2001: $0; 2002: $39,500; 2003: $835,833; 2004: $1,110,728; 2005: -$2,252,967; 2006: -$162,113.
Biggest contracts:
$673,689 with Army for Motor Freight. Taking place in NJ. Signed on 2004-02-17. Completion date: 2004-02-20.
$348,100 with Army for Lease or Rental of Equipment -- Ground Effect Vehicles, Motor Vehicles, Trailers, and Cycles. Signed on 2003-12-22. Completion date: 2004-11-24.
$291,493 with Army for Specialized Shipping and Storage Containers. Taking place in HI. Signed on 2003-11-06. Completion date: 2004-11-17.
$263,813, same as above.Signed on 2004-01-15. Completion date: 2004-01-21.
Top industries in this zip code by the number of employees in 2005:
2005 - 2018 National Fire Incident Reporting System (NFIRS) incidents
According to the data from the years 2005 - 2018 the average number of fires per year is 51. The highest number of reported fire incidents - 85 took place in 2018, and the least - 20 in 2012. The data has an increasing trend.
When looking into fire subcategories, the most incidents belonged to: Structure Fires (64.1%), and Outside Fires (27.7%).
Fire incident types reported to NFIRS in Zip Code 94108


 Nearest zip codes: 94104, 94111, 94133, 94109, 94105, 94102.


 According to the data from the years 2005 - 2018 the average number of fires per year is 51. The highest number of reported fire incidents - 85 took place in 2018, and the least - 20 in 2012. The data has an increasing trend.
 When looking into fire subcategories, the most incidents belonged to: Structure Fires (64.1%), and Outside Fires (27.7%).