Averages for the 2020 tax year for zip code 94102, filed in 2021:
Average Adjusted Gross Income (AGI) in 2020: $117,690 (Individual Income Tax Returns)
Here:
$117,690
State:
$95,910
Salary/wage: $109,346 (reported on 85.2% of returns)
Here:
$109,346
State:
$77,331
(% of AGI for various income ranges: 1222.2% for AGIs below $25k, 4536.8% for AGIs $25k-50k, 7999.6% for AGIs $50k-75k, 12010.4% for AGIs $75k-100k, 22862.5% for AGIs $100k-200k, 197401.0% for AGIs over 200k)
Taxable interest for individuals: $1,549 (reported on 30.0% of returns)
This zip code:
$1,549
California:
$2,294
(% of AGI for various income ranges: 12.6% for AGIs below $25k, 17.9% for AGIs $25k-50k, 29.1% for AGIs $50k-75k, 41.7% for AGIs $75k-100k, 95.0% for AGIs $100k-200k, 1102.6% for AGIs over 200k)
Ordinary dividends: $8,253 (reported on 25.8% of returns)
Here:
$8,253
State:
$10,949
(% of AGI for various income ranges: 20.7% for AGIs below $25k, 38.0% for AGIs $25k-50k, 63.0% for AGIs $50k-75k, 125.1% for AGIs $75k-100k, 237.9% for AGIs $100k-200k, 6490.8% for AGIs over 200k)
Net capital gain/loss in AGI: +$40,026 (reported on 25.7% of returns)
Here:
+$40,026
State:
+$49,306
(% of AGI for various income ranges: 16.7% for AGIs below $25k, 41.8% for AGIs $25k-50k, 108.5% for AGIs $50k-75k, 146.8% for AGIs $75k-100k, 525.4% for AGIs $100k-200k, 36213.1% for AGIs over 200k)
Profit/loss from business: +$13,137 (reported on 16.4% of returns)
Here:
+$13,137
State:
+$15,671
(% of AGI for various income ranges: 227.2% for AGIs below $25k, 212.0% for AGIs $25k-50k, 214.9% for AGIs $50k-75k, 255.1% for AGIs $75k-100k, 391.7% for AGIs $100k-200k, 3197.4% for AGIs over 200k)
Taxable individual retirement arrangement distribution: $15,463 (reported on 3.5% of returns)
94102:
$15,463
California:
$23,505
(% of AGI for various income ranges: 35.2% for AGIs below $25k, 43.4% for AGIs $25k-50k, 71.1% for AGIs $50k-75k, 92.1% for AGIs $75k-100k, 201.7% for AGIs $100k-200k, 551.5% for AGIs over 200k)
Self-employed (Keogh) retirement plans: $25,491 (reported on 0.7% of returns)
94102:
$25,491
California:
$30,163
(% of AGI for various income ranges: 23.1% for AGIs $50k-75k, 37.8% for AGIs $100k-200k, 519.7% for AGIs over 200k)
Total itemized deductions: $42,313 (reported on 8.4% of returns)
Here:
$42,313
State:
$39,517
(% of AGI for various income ranges: 36.1% for AGIs below $25k, 83.1% for AGIs $25k-50k, 210.1% for AGIs $50k-75k, 291.2% for AGIs $75k-100k, 730.6% for AGIs $100k-200k, 9156.9% for AGIs over 200k)
Charity contributions: $11,831 (reported on 6.6% of returns)
Here:
$11,831
State:
$12,598
(% of AGI for various income ranges: 2.8% for AGIs below $25k, 12.3% for AGIs $25k-50k, 30.0% for AGIs $50k-75k, 64.3% for AGIs $75k-100k, 123.3% for AGIs $100k-200k, 2265.4% for AGIs over 200k)
Taxes paid: $9,103 (reported on 8.3% of returns)
94102:
$9,103
State:
$8,807
(% of AGI for various income ranges: 8.6% for AGIs below $25k, 20.4% for AGIs $25k-50k, 60.7% for AGIs $50k-75k, 100.0% for AGIs $75k-100k, 260.8% for AGIs $100k-200k, 1464.4% for AGIs over 200k)
Earned income credit: $1,368 (reported on 11.1% of returns)
Here:
$1,368
State:
$2,074
(% of AGI for various income ranges: 60.5% for AGIs below $25k, 39.7% for AGIs $25k-50k)
Percentage of individuals using paid preparers for their 2020 taxes: 92.3%
Here:
92%
State:
92%
(% for various income ranges: 89.1% for AGIs below $25k, 91.5% for AGIs $25k-50k, 90.8% for AGIs $50k-75k, 93.3% for AGIs $75k-100k, 95.2% for AGIs $100k-200k, 97.9% for AGIs over 200k)
Averages for the 2012 tax year for zip code 94102, filed in 2013:
Average Adjusted Gross Income (AGI) in 2012: $62,062 (Individual Income Tax Returns)
Here:
$62,062
State:
$72,726
Salary/wage: $56,042 (reported on 87.5% of returns)
Here:
$56,042
State:
$59,079
(% of AGI for various income ranges: 79.8% for AGIs below $25k, 88.6% for AGIs $25k-50k, 89.3% for AGIs $50k-75k, 88.7% for AGIs $75k-100k, 86.0% for AGIs $100k-200k, 61.2% for AGIs over 200k)
Taxable interest for individuals: $1,023 (reported on 26.2% of returns)
This zip code:
$1,023
California:
$2,146
(% of AGI for various income ranges: 0.7% for AGIs below $25k, 0.2% for AGIs $25k-50k, 0.3% for AGIs $50k-75k, 0.3% for AGIs $75k-100k, 0.5% for AGIs $100k-200k, 0.6% for AGIs over 200k)
Ordinary dividends: $4,170 (reported on 16.3% of returns)
Here:
$4,170
State:
$9,308
(% of AGI for various income ranges: 1.2% for AGIs below $25k, 0.7% for AGIs $25k-50k, 0.7% for AGIs $50k-75k, 0.8% for AGIs $75k-100k, 1.1% for AGIs $100k-200k, 1.6% for AGIs over 200k)
Net capital gain/loss in AGI: +$21,848 (reported on 13.9% of returns)
Here:
+$21,848
State:
+$30,460
(% of AGI for various income ranges: 0.1% for AGIs $25k-50k, 0.6% for AGIs $50k-75k, 0.4% for AGIs $75k-100k, 1.5% for AGIs $100k-200k, 14.5% for AGIs over 200k)
Profit/loss from business: +$19,197 (reported on 16.1% of returns)
Here:
+$19,197
State:
+$17,064
(% of AGI for various income ranges: 12.2% for AGIs below $25k, 5.0% for AGIs $25k-50k, 3.4% for AGIs $50k-75k, 3.9% for AGIs $75k-100k, 4.9% for AGIs $100k-200k, 4.2% for AGIs over 200k)
Taxable individual retirement arrangement distribution: $17,490 (reported on 3.7% of returns)
94102:
$17,490
California:
$19,557
(% of AGI for various income ranges: 1.1% for AGIs below $25k, 0.9% for AGIs $25k-50k, 1.2% for AGIs $50k-75k, 1.2% for AGIs $75k-100k, 1.2% for AGIs $100k-200k, 0.9% for AGIs over 200k)
Self-employment retirement plans: $18,000 (reported on 1.0% of returns)
94102:
$18,000
California:
$24,530
(% of AGI for various income ranges: 0.2% for AGIs below $25k, 0.3% for AGIs $50k-75k, 0.4% for AGIs $100k-200k, 0.5% for AGIs over 200k)
Total itemized deductions: $27,024 (17% of AGI, reported on 22.5% of returns)
Here:
$27,024
State:
$34,004
Here:
16.8% of AGI
State:
22.7% of AGI
(% of AGI for various income ranges: 4.1% for AGIs below $25k, 3.1% for AGIs $25k-50k, 5.9% for AGIs $50k-75k, 9.9% for AGIs $75k-100k, 13.7% for AGIs $100k-200k, 13.9% for AGIs over 200k)
Charity contributions: $2,801 (reported on 14.7% of returns)
Here:
$2,801
State:
$4,659
(% of AGI for various income ranges: 0.3% for AGIs below $25k, 0.3% for AGIs $25k-50k, 0.6% for AGIs $50k-75k, 0.8% for AGIs $75k-100k, 0.8% for AGIs $100k-200k, 0.8% for AGIs over 200k)
Taxes paid: $15,544 (reported on 22.4% of returns)
94102:
$15,544
State:
$14,448
(% of AGI for various income ranges: 0.9% for AGIs below $25k, 0.8% for AGIs $25k-50k, 2.0% for AGIs $50k-75k, 5.3% for AGIs $75k-100k, 8.0% for AGIs $100k-200k, 9.5% for AGIs over 200k)
Earned income credit: $1,352 (reported on 14.7% of returns)
Here:
$1,352
State:
$2,286
(% of AGI for various income ranges: 3.3% for AGIs below $25k, 0.4% for AGIs $25k-50k)
Percentage of individuals using paid preparers for their 2012 taxes: 47.0%
Here:
47%
State:
64%
(% for various income ranges: 46.7% for AGIs below $25k, 50.0% for AGIs $25k-50k, 41.2% for AGIs $50k-75k, 41.0% for AGIs $75k-100k, 44.7% for AGIs $100k-200k, 67.3% for AGIs over 200k)
Averages for the 2004 tax year for zip code 94102, filed in 2005:
Average Adjusted Gross Income (AGI) in 2004: $39,977 (Individual Income Tax Returns)
Here:
$39,977
State:
$58,600
Salary/wage: $34,443 (reported on 87.1% of returns)
Here:
$34,443
State:
$49,455
(% of AGI for various income ranges: 229.9% for AGIs below $10k, 83.1% for AGIs $10k-25k, 91.4% for AGIs $25k-50k, 86.2% for AGIs $50k-75k, 86.5% for AGIs $75k-100k, 44.8% for AGIs over 100k)
Taxable interest for individuals: $1,358 (reported on 30.5% of returns)
This zip code:
$1,358
California:
$2,365
(% of AGI for various income ranges: 5.9% for AGIs below $10k, 1.2% for AGIs $10k-25k, 0.7% for AGIs $25k-50k, 0.9% for AGIs $50k-75k, 0.7% for AGIs $75k-100k, 1.3% for AGIs over 100k)
Taxable dividends: $3,531 (reported on 15.0% of returns)
Here:
$3,531
State:
$4,746
(% of AGI for various income ranges: 8.5% for AGIs below $10k, 0.7% for AGIs $10k-25k, 0.6% for AGIs $25k-50k, 0.8% for AGIs $50k-75k, 1.7% for AGIs $75k-100k, 2.2% for AGIs over 100k)
Net capital gain/loss: +$12,883 (reported on 13.0% of returns)
Here:
+$12,883
State:
+$23,418
(% of AGI for various income ranges: 6.0% for AGIs below $10k, -0.1% for AGIs $10k-25k, 0.3% for AGIs $25k-50k, 0.9% for AGIs $50k-75k, 0.7% for AGIs $75k-100k, 11.7% for AGIs over 100k)
Profit/loss from business: +$15,223 (reported on 14.4% of returns)
Here:
+$15,223
State:
+$16,826
(% of AGI for various income ranges: 28.2% for AGIs below $10k, 7.6% for AGIs $10k-25k, 3.3% for AGIs $25k-50k, 4.5% for AGIs $50k-75k, 4.0% for AGIs $75k-100k, 6.8% for AGIs over 100k)
IRA payment deduction: $2,791 (reported on 2.7% of returns)
94102:
$2,791
California:
$3,192
(% of AGI for various income ranges: 0.7% for AGIs below $10k, 0.3% for AGIs $10k-25k, 0.3% for AGIs $25k-50k, 0.2% for AGIs $50k-75k, 0.1% for AGIs $75k-100k, 0.1% for AGIs over 100k)
Self-employed pension: $11,600 (reported on 1.2% of returns)
Here:
$11,600
California:
$17,688
(% of AGI for various income ranges: 0.1% for AGIs $10k-25k, 0.1% for AGIs $25k-50k, 0.3% for AGIs $50k-75k, 0.4% for AGIs $75k-100k, 0.7% for AGIs over 100k)
Total itemized deductions: $22,539 (20% of AGI, reported on 16.1% of returns)
Here:
$22,539
State:
$28,113
Here:
19.6% of AGI
State:
25.3% of AGI
(% of AGI for various income ranges: 20.1% for AGIs below $10k, 4.5% for AGIs $10k-25k, 3.9% for AGIs $25k-50k, 7.6% for AGIs $50k-75k, 14.4% for AGIs $75k-100k, 14.1% for AGIs over 100k)
Charity contributions deductions: $3,867 (3% of AGI, reported on 12.4% of returns)
Here:
$3,867
State:
$3,923
Here:
3.0% of AGI
State:
3.3% of AGI
(% of AGI for various income ranges: 0.8% for AGIs below $10k, 0.3% for AGIs $10k-25k, 0.5% for AGIs $25k-50k, 0.9% for AGIs $50k-75k, 1.3% for AGIs $75k-100k, 2.3% for AGIs over 100k)
Total tax: $6,201 (reported on 78.6% of returns)
94102:
$6,201
State:
$10,761
(% of AGI for various income ranges: 8.8% for AGIs below $10k, 5.6% for AGIs $10k-25k, 9.4% for AGIs $25k-50k, 13.8% for AGIs $50k-75k, 15.5% for AGIs $75k-100k, 15.4% for AGIs over 100k)
Earned income credit: $1,110 (reported on 15.3% of returns)
Here:
$1,110
State:
$1,763
Percentage of individuals using paid preparers for their 2004 taxes: 50.2%
Here:
50%
State:
66%
(% for various income ranges: 50.1% for AGIs below $10k, 52.2% for AGIs $10k-25k, 49.0% for AGIs $25k-50k, 44.7% for AGIs $50k-75k, 48.3% for AGIs $75k-100k, 60.8% for AGIs over 100k)
Likely homosexual households (counted as self-reported same-sex unmarried-partner households)
Lesbian couples: 0.4% of all households
Gay men: 1.3% of all households
Household received Food Stamps/SNAP in the past 12 months: 4,716 Household did not receive Food Stamps/SNAP in the past 12 months: 15,129
Women who had a birth in the past 12 months: 499 (200 now married, 302 unmarried) Women who did not have a birth in the past 12 months: 7,701 (2,253 now married, 5,480 unmarried)
Housing units in zip code 94102 with a mortgage: 1,167 (28 second mortgage, 30 both second mortgage and home equity loan) Median monthly owner costs for units with a mortgage: $3,876 Median monthly owner costs for units without a mortgage: $1,398
Residents with income below the poverty level in 2022:
This zip code:
20.1%
Whole state:
12.2%
Residents with income below 50% of the poverty level in 2022:
This zip code:
12.0%
Whole state:
6.2%
Median number of rooms in houses and condos:
Here:
3.6
State:
6.0
Median number of rooms in apartments:
Here:
1.9
State:
3.9
Notable locations in this zip code not listed on our city pages
Notable locations in zip code 94102: Civic Center (A), San Francisco Opera House (B), San Francisco Civic Center Historic District (C), Veterans Building (D), Hayes Valley Community Center (E), War Memorial Opera House (F), San Francisco Museum of Art (G), San Francisco City Hall (H), Public Library of the City and County of San Francisco (I), Pioneer Hall (J), Metropolitan Club (K), Fox Plaza (L), Davies Symphony Hall (M), Civic Center Auditorium (N), Brooks Exhibit Hall (O), Bohemian Club (P), San Francisco Fire Department Station 36 (Q), Tenderloin Police Station (R). Display/hide their locations on the map
Churches in zip code 94102 include: First Congregational Church (A), Islam Temple (B), Bethel African Methodist Episcopal Church (C), First Baptist Church (D), William Taylor Methodist Church (E), Zen Center (F), Advent of Christ the King Church (G), Greater Jerusalem Baptist Church (H), Neighborhood Baptist Church (I). Display/hide their locations on the map
Parks in zip code 94102 include: Union Square Park (1), Civic Center Plaza (2), Marshall Square (3), Memorial Court (4), Pioneer Monument (5), Koshland Park (6), Market Street Theatre and Loft Historic District (7), Jefferson Square Playground (8). Display/hide their locations on the map
Tourist attractions (not listed on the city page) : Civic Center Sauna & Hot Tub (Recreation Areas; 15 Fell Street), Airline Ticket Reservation (201 Turk Street), 364 Hayes Street Gallery (Tours & Charters; 364 Hayes St).
2,128 married couples with children.
763 single-parent households (144 men, 619 women).
52.3% of residents of 94102 zip code speak English at home.
15.1% of residents speak Spanish at home (51% very well, 22% well, 20% not well, 7% not at all).
8.2% of residents speak other Indo-European language at home (84% very well, 9% well, 5% not well, 2% not at all).
20.3% of residents speak Asian or Pacific Island language at home (31% very well, 28% well, 23% not well, 18% not at all).
4.2% of residents speak other language at home (56% very well, 27% well, 12% not well, 5% not at all).
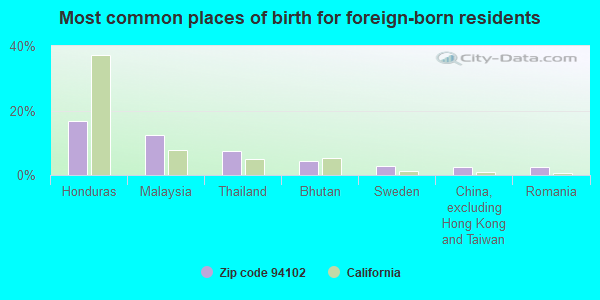
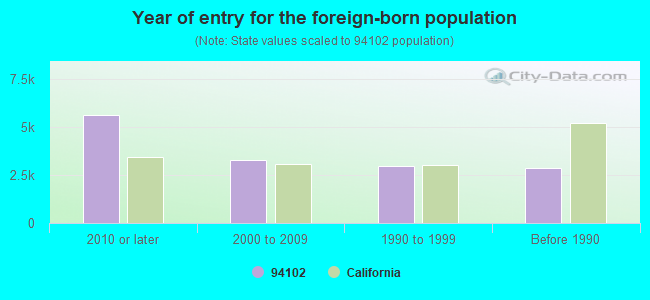
Foreign born population: 13,358 (39.5%) (50.4% of them are naturalized citizens)
Major facilities with environmental interests located in this zip code:
GENERAL SERVICES ADMINISTRATION (450 GOLDEN GATE AVENUE in SAN FRANCISCO, CA)
STATE MASTER (California - Hazardous Waste Tracking) - HAZARDOU WASTE PROGRAM CRITERIA AND HAZARDOUS AIR POLLUTANT INVENTORY (Inventory of air pollution sources) Small Quantity Generators, between 100 kg and 1000 kg of hazardous waste/month (Resource Conservation and Recovery Act (tracking hazardous waste)) (Resource Conservation and Recovery Act (tracking hazardous waste)) Business SIC classification: GENERAL GOVERNMENT Organizations: US GENL SVCES AGNCY (CONTACT/OWNER)
Alternative names: FEDERAL BUILDING, FEDERAL BLDG & COURTHOUSE, USGSA FEDERAL BUILDING
GREYHOUND LINES, INC (480 IRWIN ST in SAN FRANCISCO, CA)
STATE MASTER (California - Hazardous Waste Tracking) - HAZARDOU WASTE PROGRAM (Resource Conservation and Recovery Act (tracking hazardous waste)) Business NAICS classification: OTHER AUTOMOTIVE MECHANICAL AND ELECTRICAL REPAIR AND MAINTENANCE. Organizations: GREYHOUND LINES INC (CONTACT/OWNER)
JESSIE SQUARE GARAGE (738 MISSION ST in SAN FRANCISCO, CA)
STATE MASTER (California - Hazardous Waste Tracking) - HAZARDOU WASTE PROGRAM Large Quantity Generators, more that 1000 kg of hazardous waste/month (Resource Conservation and Recovery Act (tracking hazardous waste)) Organizations: JESSIE SQUARE GARAGE PARTNERS LLC (CONTACT/OPERATOR)
HILTON HOTEL (333 O'FARRELL STREET in SAN FRANCISCO, CA)
STATE MASTER (California - Hazardous Waste Tracking) - HAZARDOU WASTE PROGRAM CRITERIA AND HAZARDOUS AIR POLLUTANT INVENTORY (Inventory of air pollution sources) Small Quantity Generators, between 100 kg and 1000 kg of hazardous waste/month (Resource Conservation and Recovery Act (tracking hazardous waste)) Business SIC classification: DRYCLEANING PLANTS, EXCEPT RUG CLEANING Alternative names: HILTON SAN FRANCISCO, SAN FRANCISCO HILTON HOTEL
NIKKO HOTEL (222 MASON STREET in SAN FRANCISCO, CA)
STATE MASTER (California - Hazardous Waste Tracking) - HAZARDOU WASTE PROGRAM CRITERIA AND HAZARDOUS AIR POLLUTANT INVENTORY (Inventory of air pollution sources) Small Quantity Generators, between 100 kg and 1000 kg of hazardous waste/month (Resource Conservation and Recovery Act (tracking hazardous waste)) - notification Organizations: HOTEL NIKKO INTL (CONTACT/OWNER)
Alternative names: HOTEL NIKKO SAN FRANCISCO
LEES AUTOBODY AND MECHANIC SHOP (256 TURK STREET in SAN FRANCISCO, CA)
STATE MASTER (California - Hazardous Waste Tracking) - HAZARDOU WASTE PROGRAM CRITERIA AND HAZARDOUS AIR POLLUTANT INVENTORY (Inventory of air pollution sources) Small Quantity Generators, between 100 kg and 1000 kg of hazardous waste/month (Resource Conservation and Recovery Act (tracking hazardous waste)) - notification Business SIC classification: TOP, BODY, AND UPHOLSTERY REPAIR SHOPS AND PAINT SHOPS Organizations: LEE CHAK KWONG (CONTACT/OWNER)
CALTRANS DISTRICT 4 - SHOP (129 CLAY ST in SAN FRANCISCO, CA) . Federal Facility
STATE MASTER (California - Hazardous Waste Tracking) - HAZARDOU WASTE PROGRAM Small Quantity Generators, between 100 kg and 1000 kg of hazardous waste/month (Resource Conservation and Recovery Act (tracking hazardous waste)) - notification Organizations: CALIF DEPT OF TRANS (CONTACT/OWNER)
Alternative names: CALTRANS EQUIPMENT SUB SHOP
HARSCH INVESTMENT CORP (325 MASON ST in SAN FRANCISCO, CA)
STATE MASTER (California - Hazardous Waste Tracking) - HAZARDOU WASTE PROGRAM Small Quantity Generators, between 100 kg and 1000 kg of hazardous waste/month (Resource Conservation and Recovery Act (tracking hazardous waste)) - notification
KAHN AND KEVILLE TIRE AND AUTO SERVICE (500 TURK ST in SAN FRANCISCO, CA)
STATE MASTER (California - Hazardous Waste Tracking) - HAZARDOU WASTE PROGRAM Small Quantity Generators, between 100 kg and 1000 kg of hazardous waste/month (Resource Conservation and Recovery Act (tracking hazardous waste)) - notification Organizations: RON DHEIN (CONTACT/OWNER)
CALIFORNIA STATE AUTOMOBILE ASSOCIATION (150 HAYES ST in SAN FRANCISCO, CA)
STATE MASTER (California - Hazardous Waste Tracking) - HAZARDOU WASTE PROGRAM Small Quantity Generators, between 100 kg and 1000 kg of hazardous waste/month (Resource Conservation and Recovery Act (tracking hazardous waste)) - notification Organizations: CALIFORNIA STATE AUTO ASSN CORP (CONTACT/OWNER)
Alternative names: CAL ST AUTO ASSN INTER-INSURANCE BUREAU
C H L INTERNATIONAL 101 POWELL (101 POWELL ST in SAN FRANCISCO, CA)
STATE MASTER (California - Hazardous Waste Tracking) - HAZARDOU WASTE PROGRAM Small Quantity Generators, between 100 kg and 1000 kg of hazardous waste/month (Resource Conservation and Recovery Act (tracking hazardous waste)) - notification Organizations: C H L INTL ASSOC (CONTACT/OWNER)
CALTRANS (150 OAK ST in SAN FRANCISCO, CA)
(Resource Conservation and Recovery Act (tracking hazardous waste)) Organizations: CALIFORNIA DEPT OF TRANSPORTATION (CONTACT/OWNER)
Alternative names: CALTRANS DISTRICT 4
ALTERNATIVE/OPPORTUNITY (135 VAN NESS AVE. in SAN FRANCISCO, CA)
(National Center for Education Statistics) - STATE ID-3830395 Organizations: SAN FRANCISCO CO. OFF. OF EDUCATION (SCHOOL DISTRICT)
Housing units lacking complete plumbing facilities: 5.5% Housing units lacking complete kitchen facilities: 15.4%
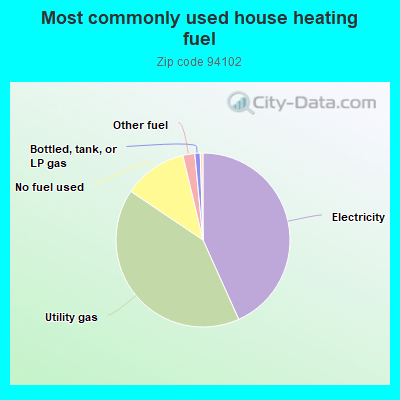
43.1%Electricity
41.0%Utility gas
11.8%No fuel used
2.2%Other fuel
1.0%Bottled, tank, or LP gas
0.5%Solar energy
Population in 1990: 26,908. Population change in the 1990s: +2,083 (+7.7%).
Place of birth for U.S.-born residents:
This state: 10,201
Northeast: 2,839
Midwest: 2,487
South: 2,349
West: 1,494
47% of the 94102 zip code residents lived in the same house 5 years ago. Out of people who lived in different houses, 51% lived in this county. Out of people who lived in different counties, 50% lived in California.
83% of the 94102 zip code residents lived in the same house 1 year ago. Out of people who lived in different houses, 48% moved from this county. Out of people who lived in different houses, 24% moved from different county within same state. Out of people who lived in different houses, 17% moved from different state. Out of people who lived in different houses, 11% moved from abroad.
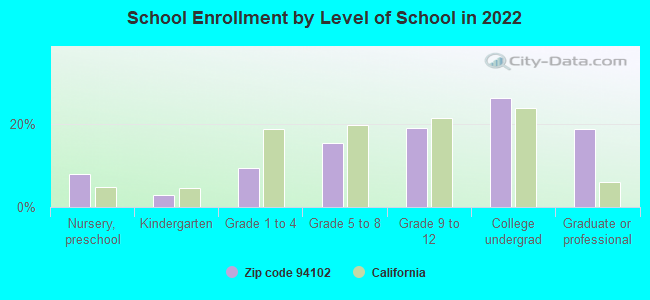
Private vs. public school enrollment:
Students in private schools in grades 1 to 8 (elementary and middle school): 120
Here:
9.6%
California:
10.5%
Students in private schools in grades 9 to 12 (high school): 79
Here:
8.2%
California:
8.5%
Students in private undergraduate colleges: 428
Here:
31.9%
California:
15.9%
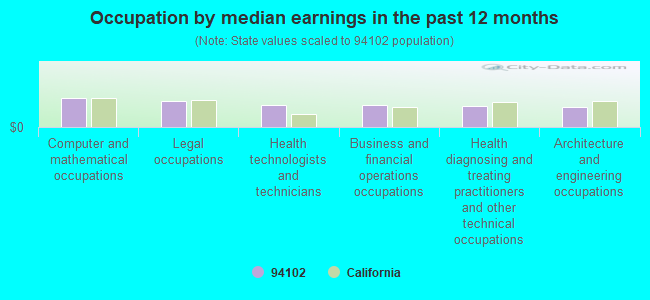
Occupation by median earnings in the past 12 months ($)
179,977Computer and mathematical occupations
158,968Legal occupations
133,843Health technologists and technicians
132,148Business and financial operations occupations
126,038Health diagnosing and treating practitioners and other technical occupations
123,256Architecture and engineering occupations
Companies with federal contracts located in this zip code (SAN FRANCISCO, CA):
ROSE RESNICK LIGHTHOUSE FOR TH (214 VAN NESS AVE) : $2,065,092 in 9 contractsfrom 2000 to 2005
Contracts for Toiletry Paper Products by Defense Logistics Agency Signed by year:2000: $179,712; 2001: $889,980; 2002: $0; 2003: $0; 2004: $0; 2005: $995,400; 2006: $0.
Biggest contracts:
$744,720 with Defense Logistics Agency for Toiletry Paper Products. Signed on 2001-09-28. Completion date: 2002-10-30.
$600,000, same as above.Signed on 2005-09-02. Completion date: 2005-11-30.
$300,000, same as above.Signed on 2005-09-29. Completion date: 2005-12-15.
$179,712, same as above.Signed on 2000-12-08. Completion date: 2001-12-31.
ADVANCED SOFTWARE DESIGN, INC (1390 MARKET STREET; small business) : $683,391 in 5 contractsfrom 2003 to 2004
Contracts for ADP Systems Development Services, ADP Systems Analysis Services by Navy, Air Force Signed by year:2000: $0; 2001: $0; 2002: $0; 2003: $595,510; 2004: $87,881; 2005: $0; 2006: $0.
Biggest contracts:
$254,998 with Navy for ADP Systems Development Services. Signed on 2003-09-23. Completion date: 2004-04-22.
$245,002, same as above.Signed on 2003-06-19. Completion date: 2003-12-19.
$87,881, same as above.Signed on 2004-01-15. Completion date: 2004-05-17.
$49,944 with Air Force for ADP Systems Analysis Services. Signed on 2003-02-25. Completion date: 2003-05-30.
VOCAL POINT INC (450 GEARY ST UNIT 300; small business) : $374,836 in 2 contractsin 2000
$374,836 with Army for Other Defense -- Management and Support (R&D). Signed on 2000-01-18. Completion date: 2001-04-30.
$0, same as above.Signed on 2000-01-18. Completion date: 2001-04-30.
PALACE HOTEL (; small business)
$73,597 with U.S. Customs Service for Lodging - Hotel/Motel. Signed on 2003-10-24. Effective on 2003-10-01. Completion date: 2004-09-30.
FELIX WALDHAUSER (555 O FARRELL ST APT 601; small business) : $22,000 in 2 contractsin 2000
$20,000 with Geological Survey for Geological Studies. Signed on 2000-01-15. Completion date: 1999-12-15.
$2,000, same as above.Signed on 2000-06-15. Completion date: 2000-06-15.
MARINES' MEMORIAL ASSOCIATION (609 SUTTER ST) : $7,244 in 2 contractsfrom 2001 to 2005
$4,598 with U.S. Army Corps of Engineers - civil program financing only for Lodging - Hotel/Motel. Signed on 2001-03-27. Completion date: 2001-06-12.
$2,646 with Navy for Lodging - Hotel/Motel. Signed on 2005-08-23. Completion date: 2005-03-25.
Top industries in this zip code by the number of employees in 2005:
Administrative and Support and Waste Management and Remediation Services: Security Guards and Patrol Services (over 1000: 1, 500-999: 2, 100-249: 1, 10-19: 1)
Management of Companies and Enterprises: Corporate, Subsidiary, and Regional Managing Offices (500-999: 2, 100-249: 1, 50-99: 1, 20-49: 2, 5-9: 4, 1-4: 3)
2005 - 2018 National Fire Incident Reporting System (NFIRS) incidents
According to the data from the years 2005 - 2018 the average number of fire incidents per year is 244. The highest number of fire incidents - 327 took place in 2006, and the least - 78 in 2012. The data has a decreasing trend.
When looking into fire subcategories, the most incidents belonged to: Structure Fires (67.0%), and Outside Fires (28.1%).
Fire incident types reported to NFIRS in Zip Code 94102


 Nearest zip codes: 94103, 94109, 94108, 94115, 94104, 94133.


 According to the data from the years 2005 - 2018 the average number of fire incidents per year is 244. The highest number of fire incidents - 327 took place in 2006, and the least - 78 in 2012. The data has a decreasing trend.
 When looking into fire subcategories, the most incidents belonged to: Structure Fires (67.0%), and Outside Fires (28.1%).