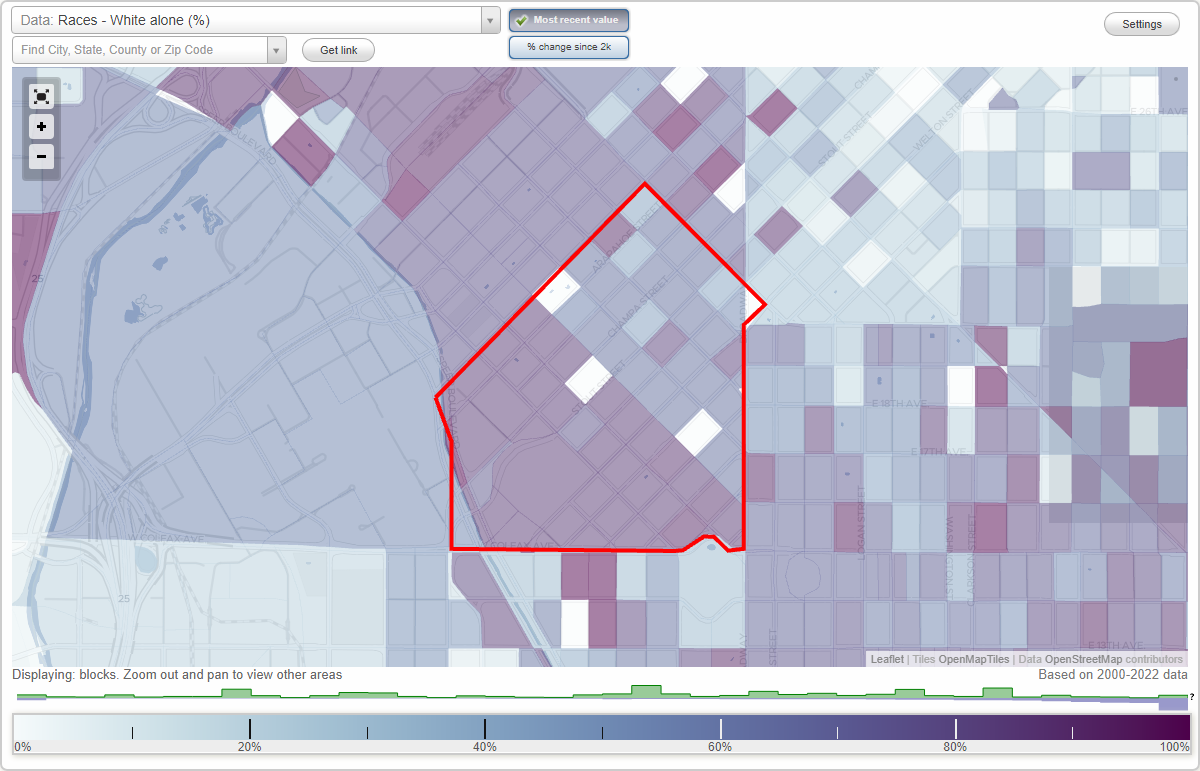
Downtown (Central Business District) neighborhood in Denver, Colorado (CO), 80202, 80204 detailed profile
Settings
X

Business Search - 14 Million verified businesses
Area: 0.435 square miles
Population: 956
Population density:
| Downtown (Central Business District): | 2,199 people per square mile |
| Denver: | 4,651 people per square mile |

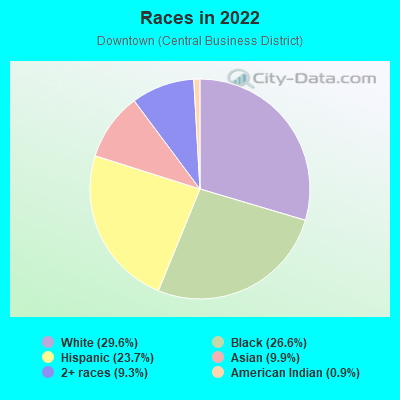
- 29629.6%White
- 26626.6%Black
- 23723.7%Hispanic or Latino
- 999.9%Asian
- 939.3%Two or more races
- 90.9%American Indian
Distribution of median household income
![Distribution of median household income]()
- 95Less than $10,000
- 111$10,000 to $19,999
- 92$20,000 to $29,999
- 176$30,000 to $39,999
- 92$40,000 to $49,999
- 60$50,000 to $59,999
- 41$60,000 to $74,999
- 29$75,000 to $99,999
- 364$100,000 to $124,999
- 22$125,000 to $149,999
- 37$150,000 to $199,999
- 116$200,000 or more

Distribution of owner-occupied house/condo value
![Distribution of owner-occupied house/condo value]()
- 20$150,000 to $199,999
- 201$250,000 to $299,999
- 119$300,000 to $399,999
- 71$400,000 to $499,999
- 60$500,000 to $749,999
- 15$750,000 to $999,999
- 103$1,000,000 or more

Distribution of rent paid by renters
![Distribution of rent paid by renters]()
- 246Less than $100
- 269$100 to $199
- 115$200 to $299
- 19$300 to $399
- 89$400 to $499
- 120$500 to $599
- 55$600 to $699
- 39$700 to $799
- 41$800 to $899
- 26$900 to $999
- 6$1,000 to $1,249
- 168$1,250 to $1,499
- 29$1,500 to $1,999
- 364$2,000 or more

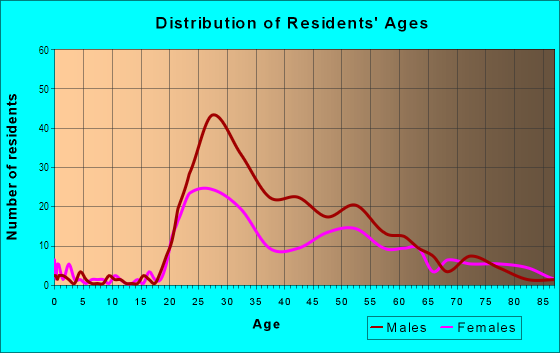
| Males: | 696 |
| Females: | 259 |
Males:
| This neighborhood: | 49.0 years |
| Whole city: | 35.2 years |
| This neighborhood: | 43.0 years |
| Whole city: | 35.1 years |
Average household size:
| Downtown (Central Business District): | 1.3 people |
| Denver: | 28.0 people |
Percentage of family households:
| Downtown (Central Business District): | 11.6% |
| Denver: | 35.1% |
| Here: | 12.3% |
| Denver: | 32.5% |
Percentage of married-couple families with children (among all households):
| Downtown (Central Business District): | 25.4% |
| Denver: | 32.4% |
Percentage of single-mother households (among all households):
| Downtown (Central Business District): | 166.8% |
| Denver: | 10.3% |
Percentage of never married males 15 years old and over:
Percentage of never married females 15 years old and over:
| Downtown (Central Business District): | 42.3% |
| Denver: | 25.0% |
Percentage of never married females 15 years old and over:
| Downtown (Central Business District): | 16.9% |
| city: | 20.8% |
Percentage of people that speak English not well or not at all:
| Downtown (Central Business District): | 0.0% |
| Denver: | 3.9% |
Percentage of people born in this state:
Percentage of people born in another U.S. state:
Percentage of native residents but born outside the U.S.:
Percentage of foreign born residents:
| Here: | 29.1% |
| Denver: | 38.5% |
Percentage of people born in another U.S. state:
| Downtown (Central Business District): | 63.1% |
| Denver: | 46.1% |
Percentage of native residents but born outside the U.S.:
| Here: | 1.1% |
| city: | 1.7% |
Percentage of foreign born residents:
| Here: | 6.7% |
| Denver: | 13.8% |
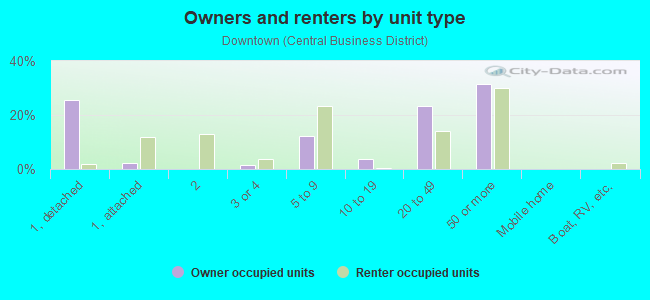
Owner-occupied
Renter-occupied

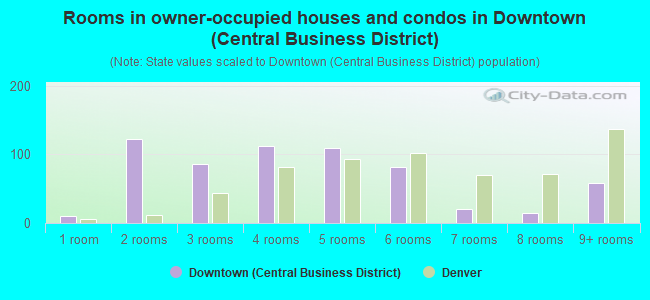
- Rooms in owner-occupied houses and condos in Downtown <
> - 101 room
- 1222 rooms
- 863 rooms
- 1124 rooms
- 1095 rooms
- 816 rooms
- 217 rooms
- 148 rooms
- 599+ rooms
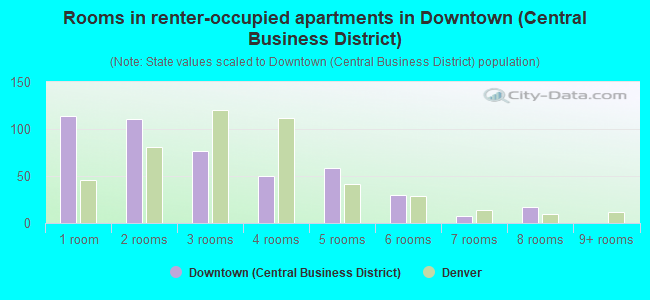
- Rooms in renter-occupied apartments in Downtown <
> - 1141 room
- 1112 rooms
- 773 rooms
- 504 rooms
- 595 rooms
- 306 rooms
- 77 rooms
- 178 rooms
- 09+ rooms
Owner-occupied
Renter-occupied
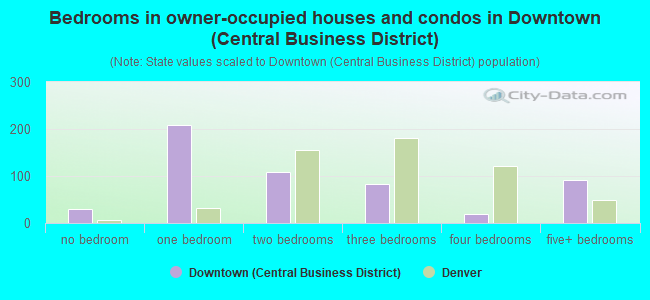
- Bedrooms in owner-occupied houses and condos in Downtown <
> - 29no bedroom
- 2091 bedroom
- 1092 bedrooms
- 843 bedrooms
- 204 bedrooms
- 915+ bedrooms
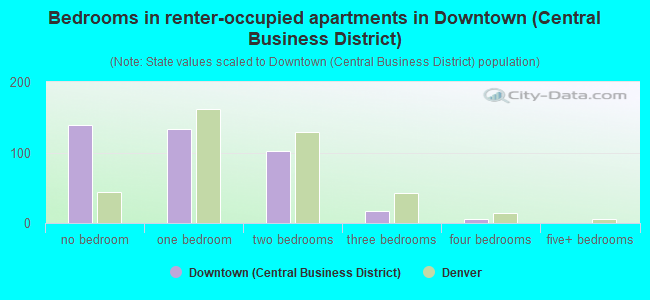
- Bedrooms in renter-occupied apartments in Downtown <
> - 139no bedroom
- 1341 bedroom
- 1022 bedrooms
- 173 bedrooms
- 54 bedrooms
- 05+ bedrooms
Average number of cars or other vehicles available in houses/condos:
Average number of cars or other vehicles available in apartments:
| This neighborhood: | 5.1 |
| Denver: | 1.9 |
Average number of cars or other vehicles available in apartments:
| Here: | 0.7 |
| city: | 1.3 |
Percentage of units with a mortgage:
| Downtown (Central Business District): | 94.8% |
| Denver: | 75.6% |
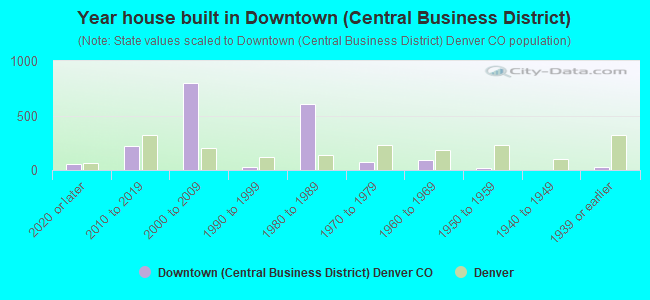
- Year house built in Downtown <
> - 542020 or later
- 2212010 to 2019
- 7952000 to 2009
- 281990 to 1999
- 6051980 to 1989
- 771970 to 1979
- 961960 to 1969
- 191950 to 1959
- 01940 to 1949
- 231939 or earlier
City-data.com crime index for city in 2020 (higher means more crime):
| City: | 519.0 |
| U.S. average: | 219.5 |
Travel time to work (commute)
![Travel time to work (commute)]()
- 35Less than 5 minutes
- 1885 to 9 minutes
- 31010 to 14 minutes
- 23315 to 19 minutes
- 37220 to 24 minutes
- 11925 to 29 minutes
- 34830 to 34 minutes
- 5735 to 39 minutes
- 11940 to 44 minutes
- 6545 to 59 minutes
- 18260 to 89 minutes
- 290 or more minutes

Means of transportation to work
![Means of transportation to work]()
- 60.6%200Drove a car alone
- 38.2%126Carpooled
- 27.3%90Bus
- 28.2%93Subway or elevated rail
- 4.5%15Light rail, streetcar or trolley
- 17.9%59Taxi
- 10.6%35Motorcycle
- 17.0%56Bicycle
- 17.9%59Walked
- 4.8%16Other means
- 37.0%122Worked at home

Time leaving home to go to work
![Time leaving home to go to work]()
- 8312:00 a.m. to 4:59 a.m.
- 225:00 a.m. to 5:29 a.m.
- 155:30 a.m. to 5:59 a.m.
- 1036:00 a.m. to 6:29 a.m.
- 816:30 a.m. to 6:59 a.m.
- 3117:00 a.m. to 7:29 a.m.
- 3537:30 a.m. to 7:59 a.m.
- 3888:00 a.m. to 8:29 a.m.
- 2798:30 a.m. to 8:59 a.m.
- 2489:00 a.m. to 9:59 a.m.
- 4710:00 a.m. to 10:59 a.m.
- 4612:00 p.m. to 3:59 p.m.
- 534:00 p.m. to 11:59 p.m.

Occupations of males:
- Percentage of males in management occupations (except farmers):
Here: 10.5% city: 15.4%
- Percentage of males in business and financial operations occupations:
Here: 6.9% city: 8.3%
- Percentage of males in computer and mathematical occupations:
Here: 2.7% city: 7.4%
- Percentage of males in architecture and engineering occupations:
Here: 47.9% city: 4.5%
- Percentage of males in life, physical, and social science occupations:
Here: 12.1% city: 1.4%
- Percentage of males in community and social services occupations:
Here: 4.1% city: 0.9%
- Percentage of males in legal occupations:
Here: 6.9% city: 2.3%
- Percentage of males in education, training, and library occupations:
Here: 10.8% city: 3.1%
- Percentage of males in arts, design, entertainment, sports, and media occupations:
Here: 20.9% city: 3.1%
- Percentage of males in healthcare practitioners and technical occupations:
Here: 9.7% city: 3.5%
- Percentage of males in service occupations:
Here: 6.9% city: 11.9%
- Percentage of males in sales and office occupations:
Here: 148.2% city: 15.4%
- Percentage of males in farming, fishing, and forestry occupations:
Here: 8.6% city: 0.3%
- Percentage of males in construction, extraction, and maintenance occupations:
Here: 1.8% city: 8.0%
- Percentage of males in production occupations:
Here: 2.0% city: 3.2%
- Percentage of males in transportation occupations:
Here: 4.9% city: 4.2%
- Percentage of males in material moving occupations:
Here: 1.2% city: 3.5%
Occupations of females:
- Percentage of females in management occupations (except farmers):
Here: 270.0% city: 14.0%
- Percentage of females in business and financial operations occupations:
Here: 31.1% city: 10.0%
- Percentage of females in computer and mathematical occupations:
Here: 108.0% city: 2.9%
- Percentage of females in architecture and engineering occupations:
Here: 26.2% city: 1.5%
- Percentage of females in life, physical, and social science occupations:
Here: 56.7% city: 1.5%
- Percentage of females in community and social services occupations:
Here: 59.5% city: 3.0%
- Percentage of females in legal occupations:
Here: 33.2% city: 2.4%
- Percentage of females in education, training, and library occupations:
Here: 53.6% city: 7.9%
- Percentage of females in arts, design, entertainment, sports, and media occupations:
Here: 11.0% city: 3.8%
- Percentage of females in healthcare practitioners and technical occupations:
Here: 5.2% city: 10.2%
- Percentage of females in service occupations:
Here: 17.6% city: 16.2%
- Percentage of females in sales and office occupations:
Here: 35.2% city: 21.4%
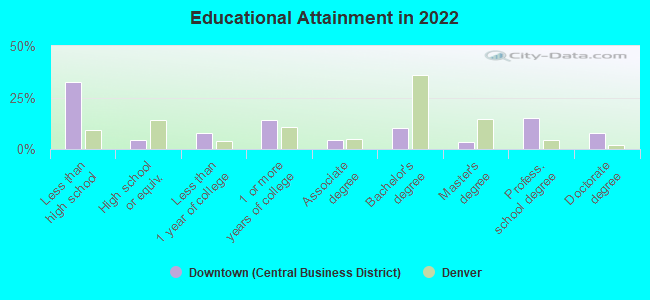
Education in this neighborhood (subdivision or community):
- Percentage of people 3 years and older in K-12 schools:
Downtown (Central Business District): 22.8% Denver: 12.7%
- Percentage of people 3 years and older in undergraduate colleges:
Downtown (Central Business District): 8.8% Denver: 4.1%
- Percentage of people 3 years and older in grad. or professional schools:
Downtown (Central Business District): 6.7% Denver: 2.2%
- Percentage of students K-12 enrolled in private schools:
Downtown (Central Business District): 0.0% Denver: 11.0%
Percentage of population below poverty level:
| Downtown (Central Business District): | 13.4% |
| Denver: | 11.8% |
Median year renter moved in (as recorded in 2022):
| Downtown (Central Business District): | 2018 |
| Denver: | 2021 |
Percentage of married-couple families with both working:
| Downtown (Central Business District): | 100.0% |
| Denver: | 74.1% |
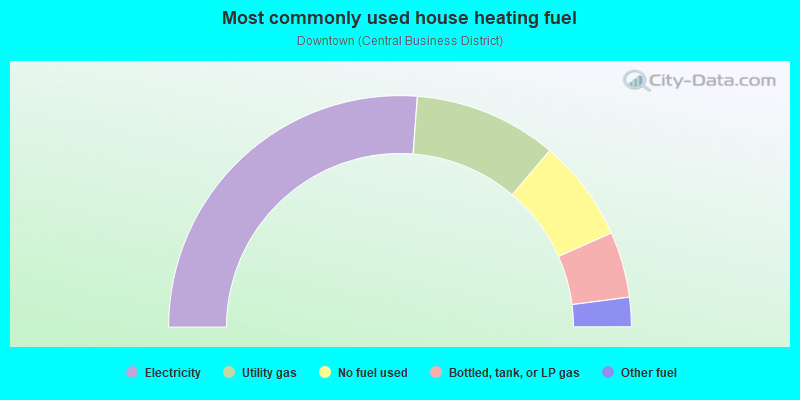
- 52.4%Electricity
- 20.0%Utility gas
- 14.3%No fuel used
- 9.2%Bottled, tank, or LP gas
- 4.1%Other fuel
Roads and streets:
Stout St
Length: 0.91 miles
Directions: E-W, N-S, SW-NE
Address range: 1100 to 1899
Directions: E-W, N-S, SW-NE
Address range: 1100 to 1899
Welton St
Length: 0.85 miles
Directions: N-S, SW-NE
Address range: 1100 to 1929
Directions: N-S, SW-NE
Address range: 1100 to 1929
Champa St
Length: 0.83 miles
Direction: SW-NE
Address range: 1124 to 1899
Direction: SW-NE
Address range: 1124 to 1899
I- 70 Bus (US Hwy 40, W Colfax Ave)
Length: 0.82 miles
Directions: E-W, SE-NW, SW-NE
Address range: 25 to 899
Directions: E-W, SE-NW, SW-NE
Address range: 25 to 899
15th St
Length: 0.77 miles
Direction: SE-NW
Address range: 100 to 1145
Direction: SE-NW
Address range: 100 to 1145
16th St
Length: 0.76 miles
Direction: SE-NW
Address range: 100 to 1147
Direction: SE-NW
Address range: 100 to 1147
Arapahoe St
Length: 0.70 miles
Direction: SW-NE
Address range: 1250 to 1899
Direction: SW-NE
Address range: 1250 to 1899
Glenarm Pl
Length: 0.68 miles
Direction: SW-NE
Address range: 1200 to 1899
Direction: SW-NE
Address range: 1200 to 1899
California St
Length: 0.68 miles
Directions: E-W, SW-NE
Address range: 153 to 1899
Directions: E-W, SW-NE
Address range: 153 to 1899
14th St
Length: 0.66 miles
Direction: SE-NW
Address range: 200 to 1099
Direction: SE-NW
Address range: 200 to 1099
17th St
Length: 0.66 miles
Direction: SE-NW
Address range: 300 to 1147
Direction: SE-NW
Address range: 300 to 1147
Curtis St
Length: 0.61 miles
Direction: SW-NE
Address range: 1300 to 1899
Direction: SW-NE
Address range: 1300 to 1899
18th St
Length: 0.56 miles
Direction: SE-NW
Address range: 400 to 1143
Direction: SE-NW
Address range: 400 to 1143
Tremont Pl
Length: 0.53 miles
Direction: SW-NE
Address range: 1200 to 1799
Direction: SW-NE
Address range: 1200 to 1799
19th St
Length: 0.41 miles
Direction: SE-NW
Address range: 500 to 1099
Direction: SE-NW
Address range: 500 to 1099
Court Pl
Length: 0.37 miles
Directions: E-W, N-S, SW-NE
Address range: 1350 to 1699
Directions: E-W, N-S, SW-NE
Address range: 1350 to 1699
13th St
Length: 0.36 miles
Directions: N-S, SE-NW
Address range: 300 to 1199
Directions: N-S, SE-NW
Address range: 300 to 1199
Speer Blvd
Length: 0.33 miles
Directions: N-S, SE-NW
Address range: 1500 to 1849
Directions: N-S, SE-NW
Address range: 1500 to 1849
12th St
Length: 0.25 miles
Direction: SE-NW
Address range: 500 to 799
Direction: SE-NW
Address range: 500 to 799
Cleveland Pl
Length: 0.22 miles
Direction: SW-NE
Address range: 1400 to 1651
Direction: SW-NE
Address range: 1400 to 1651
N Speer Blvd W
Length: 0.14 miles
Directions: N-S, SE-NW
Address range: 1500 to 1699
Directions: N-S, SE-NW
Address range: 1500 to 1699
Broadway
Length: 0.08 miles
Directions: E-W, N-S
Address range: 1800 to 1999
Directions: E-W, N-S
Address range: 1800 to 1999
Cheyenne Pl
Length: 0.06 miles
Direction: SW-NE
Address range: 1500 to 1599
Direction: SW-NE
Address range: 1500 to 1599
Other features:
Cherry Crk
Length: 0.15 miles
Directions: N-S, SE-NW
Directions: N-S, SE-NW