Estimated zip code population in 2022: 18,397 Zip code population in 2010: 10,148 Zip code population in 2000: 4,364
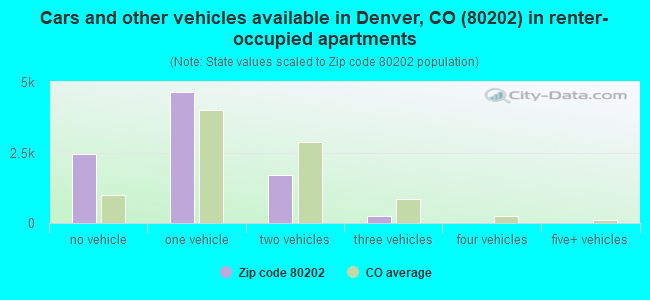
Houses and condos: 14,210 Renter-occupied apartments: 9,103
% of renters here:
76%
State:
34%
March 2022 cost of living index in zip code 80202: 112.3 (more than average, U.S. average is 100)
Land area: 1.1 sq. mi. Water area: 0.0 sq. mi.
Population density: 16,429 people per square mile
(very high).
OSM Map
General Map
Google Map
MSN Map
OSM Map
General Map
Google Map
MSN Map
OSM Map
General Map
Google Map
MSN Map
OSM Map
General Map
Google Map
MSN Map
Please wait while loading the map...
Real estate property taxes paid for housing units in 2022:
This zip code:
0.5% ($3,953)
Colorado:
0.5% ($2,422)
Median real estate property taxes paid for housing units with mortgages in 2022: $3,542 (0.5%) Median real estate property taxes paid for housing units with no mortgage in 2022: $4,542 (0.5%)
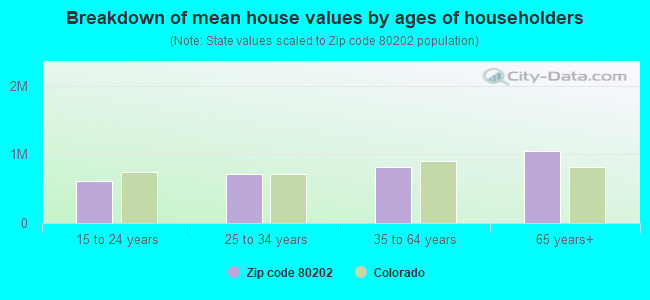
Estimated median house/condo value in 2022: $778,012
80202:
$778,012
Colorado:
$531,100
According to our research of Colorado and other state lists, there were 10 registered sex offenders living in 80202 zip code as of April 27, 2024. The ratio of all residents to sex offenders in zip code 80202 is 1,282 to 1. The ratio of registered sex offenders to all residents in this zip code is much lower than the state average.
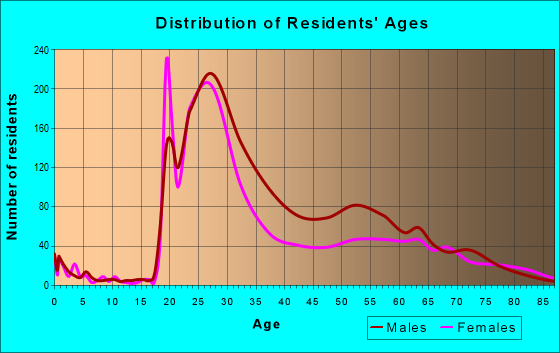
Median resident age:
This zip code:
33.9 years
Colorado median age:
37.7 years
Average household size:
This zip code:
1.5 people
Colorado:
2.4 people
Averages for the 2020 tax year for zip code 80202, filed in 2021:
Average Adjusted Gross Income (AGI) in 2020: $167,357 (Individual Income Tax Returns)
Here:
$167,357
State:
$89,260
Salary/wage: $98,678 (reported on 88.2% of returns)
Here:
$98,678
State:
$70,330
(% of AGI for various income ranges: 1270.7% for AGIs below $25k, 3904.7% for AGIs $25k-50k, 7105.7% for AGIs $50k-75k, 11181.1% for AGIs $75k-100k, 20469.7% for AGIs $100k-200k, 131260.3% for AGIs over 200k)
Taxable interest for individuals: $8,973 (reported on 34.0% of returns)
This zip code:
$8,973
Colorado:
$2,176
(% of AGI for various income ranges: 19.4% for AGIs below $25k, 19.2% for AGIs $25k-50k, 19.2% for AGIs $50k-75k, 48.6% for AGIs $75k-100k, 139.5% for AGIs $100k-200k, 9964.8% for AGIs over 200k)
Ordinary dividends: $23,893 (reported on 35.9% of returns)
Here:
$23,893
State:
$8,820
(% of AGI for various income ranges: 56.4% for AGIs below $25k, 74.3% for AGIs $25k-50k, 95.8% for AGIs $50k-75k, 181.4% for AGIs $75k-100k, 647.6% for AGIs $100k-200k, 26501.2% for AGIs over 200k)
Net capital gain/loss in AGI: +$124,697 (reported on 35.9% of returns)
Here:
+$124,697
State:
+$37,276
(% of AGI for various income ranges: 49.8% for AGIs below $25k, 59.7% for AGIs $25k-50k, 114.5% for AGIs $50k-75k, 218.2% for AGIs $75k-100k, 1038.9% for AGIs $100k-200k, 155082.4% for AGIs over 200k)
Profit/loss from business: +$29,201 (reported on 15.4% of returns)
Here:
+$29,201
State:
+$15,295
(% of AGI for various income ranges: 134.8% for AGIs below $25k, 146.2% for AGIs $25k-50k, 262.8% for AGIs $50k-75k, 328.1% for AGIs $75k-100k, 827.6% for AGIs $100k-200k, 9087.9% for AGIs over 200k)
Taxable individual retirement arrangement distribution: $31,815 (reported on 5.6% of returns)
80202:
$31,815
Colorado:
$23,785
(% of AGI for various income ranges: 45.5% for AGIs below $25k, 51.8% for AGIs $25k-50k, 86.4% for AGIs $50k-75k, 114.7% for AGIs $75k-100k, 579.7% for AGIs $100k-200k, 2795.5% for AGIs over 200k)
Self-employed (Keogh) retirement plans: $39,371 (reported on 1.2% of returns)
80202:
$39,371
Colorado:
$23,633
(% of AGI for various income ranges: 20.4% for AGIs $50k-75k, 42.3% for AGIs $100k-200k, 1395.5% for AGIs over 200k)
Total itemized deductions: $79,754 (reported on 13.1% of returns)
Here:
$79,754
State:
$35,141
(% of AGI for various income ranges: 83.4% for AGIs below $25k, 86.4% for AGIs $25k-50k, 145.9% for AGIs $50k-75k, 332.6% for AGIs $75k-100k, 1006.6% for AGIs $100k-200k, 30849.4% for AGIs over 200k)
Charity contributions: $34,344 (reported on 9.9% of returns)
Here:
$34,344
State:
$12,103
(% of AGI for various income ranges: 4.6% for AGIs below $25k, 9.9% for AGIs $25k-50k, 12.9% for AGIs $50k-75k, 32.1% for AGIs $75k-100k, 146.7% for AGIs $100k-200k, 11362.1% for AGIs over 200k)
Taxes paid: $8,294 (reported on 13.1% of returns)
80202:
$8,294
State:
$7,710
(% of AGI for various income ranges: 12.0% for AGIs below $25k, 14.2% for AGIs $25k-50k, 32.4% for AGIs $50k-75k, 100.4% for AGIs $75k-100k, 320.0% for AGIs $100k-200k, 2026.7% for AGIs over 200k)
Earned income credit: $794 (reported on 4.2% of returns)
Here:
$794
State:
$2,053
(% of AGI for various income ranges: 17.9% for AGIs below $25k, 7.1% for AGIs $25k-50k)
Percentage of individuals using paid preparers for their 2020 taxes: 95.7%
Here:
96%
State:
93%
(% for various income ranges: 93.5% for AGIs below $25k, 96.3% for AGIs $25k-50k, 97.0% for AGIs $50k-75k, 96.2% for AGIs $75k-100k, 95.4% for AGIs $100k-200k, 95.5% for AGIs over 200k)
Averages for the 2012 tax year for zip code 80202, filed in 2013:
Average Adjusted Gross Income (AGI) in 2012: $192,906 (Individual Income Tax Returns)
Here:
$192,906
State:
$69,103
Salary/wage: $96,114 (reported on 84.9% of returns)
Here:
$96,114
State:
$54,794
(% of AGI for various income ranges: 79.4% for AGIs below $25k, 86.9% for AGIs $25k-50k, 85.6% for AGIs $50k-75k, 84.8% for AGIs $75k-100k, 77.5% for AGIs $100k-200k, 27.1% for AGIs over 200k)
Taxable interest for individuals: $11,044 (reported on 41.1% of returns)
This zip code:
$11,044
Colorado:
$1,971
(% of AGI for various income ranges: 2.6% for AGIs below $25k, 0.5% for AGIs $25k-50k, 0.7% for AGIs $50k-75k, 1.0% for AGIs $75k-100k, 0.6% for AGIs $100k-200k, 3.0% for AGIs over 200k)
Ordinary dividends: $30,082 (reported on 33.6% of returns)
Here:
$30,082
State:
$7,140
(% of AGI for various income ranges: 3.7% for AGIs below $25k, 2.1% for AGIs $25k-50k, 2.0% for AGIs $50k-75k, 1.7% for AGIs $75k-100k, 2.4% for AGIs $100k-200k, 6.4% for AGIs over 200k)
Net capital gain/loss in AGI: +$100,524 (reported on 31.3% of returns)
Here:
+$100,524
State:
+$23,009
(% of AGI for various income ranges: 0.7% for AGIs $25k-50k, 1.3% for AGIs $50k-75k, 1.4% for AGIs $75k-100k, 3.1% for AGIs $100k-200k, 21.9% for AGIs over 200k)
Profit/loss from business: +$29,306 (reported on 17.8% of returns)
Here:
+$29,306
State:
+$13,514
(% of AGI for various income ranges: 9.1% for AGIs below $25k, 5.6% for AGIs $25k-50k, 4.1% for AGIs $50k-75k, 3.4% for AGIs $75k-100k, 4.6% for AGIs $100k-200k, 1.9% for AGIs over 200k)
Taxable individual retirement arrangement distribution: $36,840 (reported on 7.1% of returns)
80202:
$36,840
Colorado:
$17,927
(% of AGI for various income ranges: 2.6% for AGIs below $25k, 1.8% for AGIs $25k-50k, 1.4% for AGIs $50k-75k, 1.7% for AGIs $75k-100k, 3.0% for AGIs $100k-200k, 1.0% for AGIs over 200k)
Self-employment retirement plans: $27,731 (reported on 2.0% of returns)
80202:
$27,731
Colorado:
$19,483
(% of AGI for various income ranges: 0.5% for AGIs $50k-75k, 0.4% for AGIs $100k-200k, 0.3% for AGIs over 200k)
Total itemized deductions: $52,352 (13% of AGI, reported on 41.3% of returns)
Here:
$52,352
State:
$24,621
Here:
13.0% of AGI
State:
18.5% of AGI
(% of AGI for various income ranges: 14.8% for AGIs below $25k, 8.8% for AGIs $25k-50k, 9.3% for AGIs $50k-75k, 11.6% for AGIs $75k-100k, 13.9% for AGIs $100k-200k, 10.9% for AGIs over 200k)
Charity contributions: $17,774 (reported on 32.2% of returns)
Here:
$17,774
State:
$4,449
(% of AGI for various income ranges: 0.7% for AGIs below $25k, 0.7% for AGIs $25k-50k, 0.8% for AGIs $50k-75k, 0.8% for AGIs $75k-100k, 1.7% for AGIs $100k-200k, 3.7% for AGIs over 200k)
Taxes paid: $18,416 (reported on 41.0% of returns)
80202:
$18,416
State:
$7,641
(% of AGI for various income ranges: 2.8% for AGIs below $25k, 2.1% for AGIs $25k-50k, 2.3% for AGIs $50k-75k, 3.7% for AGIs $75k-100k, 5.0% for AGIs $100k-200k, 4.0% for AGIs over 200k)
Earned income credit: $636 (reported on 5.0% of returns)
Here:
$636
State:
$2,095
(% of AGI for various income ranges: 1.1% for AGIs below $25k)
Percentage of individuals using paid preparers for their 2012 taxes: 46.4%
Here:
46%
State:
49%
(% for various income ranges: 37.4% for AGIs below $25k, 36.8% for AGIs $25k-50k, 39.4% for AGIs $50k-75k, 43.5% for AGIs $75k-100k, 56.4% for AGIs $100k-200k, 76.5% for AGIs over 200k)
Averages for the 2004 tax year for zip code 80202, filed in 2005:
Average Adjusted Gross Income (AGI) in 2004: $176,619 (Individual Income Tax Returns)
Here:
$176,619
State:
$55,014
Salary/wage: $101,388 (reported on 84.4% of returns)
Here:
$101,388
State:
$46,010
(% of AGI for various income ranges: 85.5% for AGIs $10k-25k, 88.4% for AGIs $25k-50k, 83.9% for AGIs $50k-75k, 85.3% for AGIs $75k-100k, 40.7% for AGIs over 100k)
Taxable interest for individuals: $26,961 (reported on 46.8% of returns)
This zip code:
$26,961
Colorado:
$2,127
(% of AGI for various income ranges: 1.9% for AGIs $10k-25k, 1.4% for AGIs $25k-50k, 2.0% for AGIs $50k-75k, 0.7% for AGIs $75k-100k, 8.0% for AGIs over 100k)
Taxable dividends: $19,168 (reported on 35.9% of returns)
Here:
$19,168
State:
$3,782
(% of AGI for various income ranges: 1.7% for AGIs $10k-25k, 1.5% for AGIs $25k-50k, 1.7% for AGIs $50k-75k, 1.5% for AGIs $75k-100k, 4.1% for AGIs over 100k)
Net capital gain/loss: +$165,839 (reported on 34.5% of returns)
Here:
+$165,839
State:
+$17,882
(% of AGI for various income ranges: 0.5% for AGIs $10k-25k, 0.9% for AGIs $25k-50k, 1.9% for AGIs $50k-75k, 1.9% for AGIs $75k-100k, 37.3% for AGIs over 100k)
Profit/loss from business: +$20,912 (reported on 17.1% of returns)
Here:
+$20,912
State:
+$11,247
(% of AGI for various income ranges: 7.2% for AGIs $10k-25k, 4.1% for AGIs $25k-50k, 3.8% for AGIs $50k-75k, 3.8% for AGIs $75k-100k, 1.7% for AGIs over 100k)
IRA payment deduction: $2,876 (reported on 2.2% of returns)
80202:
$2,876
Colorado:
$2,947
(% of AGI for various income ranges: 0.3% for AGIs $10k-25k, 0.2% for AGIs $25k-50k, 0.2% for AGIs $50k-75k, 0.0% for AGIs over 100k)
Self-employed pension: $21,692 (reported on 2.8% of returns)
Here:
$21,692
Colorado:
$13,653
(% of AGI for various income ranges: 0.2% for AGIs $25k-50k, 0.3% for AGIs $50k-75k, 0.6% for AGIs $75k-100k, 0.3% for AGIs over 100k)
Total itemized deductions: $68,125 (18% of AGI, reported on 42.9% of returns)
Here:
$68,125
State:
$20,560
Here:
18.3% of AGI
State:
21.4% of AGI
(% of AGI for various income ranges: 13.8% for AGIs $10k-25k, 10.4% for AGIs $25k-50k, 14.3% for AGIs $50k-75k, 16.5% for AGIs $75k-100k, 16.7% for AGIs over 100k)
Charity contributions deductions: $30,333 (7% of AGI, reported on 35.2% of returns)
Here:
$30,333
State:
$3,518
Here:
7.1% of AGI
State:
3.4% of AGI
(% of AGI for various income ranges: 0.8% for AGIs $10k-25k, 0.9% for AGIs $25k-50k, 1.4% for AGIs $50k-75k, 1.5% for AGIs $75k-100k, 6.8% for AGIs over 100k)
Total tax: $40,696 (reported on 86.1% of returns)
80202:
$40,696
State:
$9,173
(% of AGI for various income ranges: 6.2% for AGIs $10k-25k, 10.4% for AGIs $25k-50k, 13.6% for AGIs $50k-75k, 15.0% for AGIs $75k-100k, 20.9% for AGIs over 100k)
Earned income credit: $613 (reported on 5.2% of returns)
Here:
$613
State:
$1,595
Percentage of individuals using paid preparers for their 2004 taxes: 52.8%
Here:
53%
State:
55%
(% for various income ranges: 55.2% for AGIs below $10k, 42.2% for AGIs $10k-25k, 41.3% for AGIs $25k-50k, 51.3% for AGIs $50k-75k, 52.6% for AGIs $75k-100k, 73.1% for AGIs over 100k)
Likely homosexual households (counted as self-reported same-sex unmarried-partner households)
Lesbian couples: 0.0% of all households
Gay men: 0.3% of all households
Household received Food Stamps/SNAP in the past 12 months: 431 Household did not receive Food Stamps/SNAP in the past 12 months: 11,488
Women who did not have a birth in the past 12 months: 6,075 (1,303 now married, 4,814 unmarried)
Housing units in zip code 80202 with a mortgage: 1,671 (148 second mortgage, 136 both second mortgage and home equity loan) Houses without a mortgage: 26
Median monthly owner costs for units with a mortgage: $2,743 Median monthly owner costs for units without a mortgage: $1,218
Residents with income below the poverty level in 2022:
This zip code:
12.9%
Whole state:
9.4%
Residents with income below 50% of the poverty level in 2022:
This zip code:
6.4%
Whole state:
4.6%
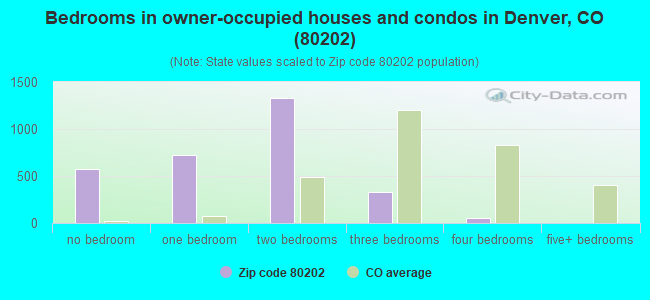
Median number of rooms in houses and condos:
Here:
3.4
State:
6.8
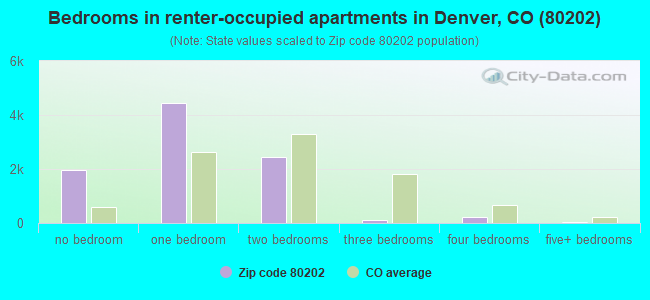
Median number of rooms in apartments:
Here:
2.6
State:
4.0
Notable locations in this zip code not listed on our city pages
Notable locations in zip code 80202: United States Customhouse (A), California Building (B), Trinity Plaza (C), Wellington Webb Municipal Office Building (D), Denver County Court Civil Division (E), Colorado Convention Center (F), Currigan Exhibition Hall (G), Denver Sheriff Department Civil Unit (H), Denver County Court Civil Division (I), Greek Theater (J), City and County Building Annex Number 2 (K), City And County Building (L), City Hall Annex Number 1 (M), Denver Post Tower (N), Denver County Criminal Court (O), Paramount Theater (P), Republic Plaza (Q), City Center Tower (R), The Byron White United States Courthouse (S), Tabor Center (T). Display/hide their locations on the map
Parks in zip code 80202 include: Denver Union Station (1), United Nations Park (2), Civic Center Park (3), Confluence Park (4), River Front Park (5), Larimer Square Historic District (6), Voorhies Memorial (7), Pioneer Monument Fountain (8), Kittredge Building (9). Display/hide their locations on the map
Tourist attractions (not listed on the city page) : Telecommunications History Group Inc (Historical Places & Services; 1005 17th Street), Historic Denver Inc - Administrative Offices (Cultural Attractions- Events- & Facilities; 1536 Wynkoop Street), Jefferson County - Libraries-Public- TTY for Hearing Impaired Persons (Cultural Attractions- Events- & Facilities; 8555 West 57th Avenue), Museum of Contemporary Art-Denver (Cultural Attractions- Events- & Facilities; 1275 19th Street), Dave & Busters (Amusement & Theme Parks; Multiple Locations), Denver Tourist Information (918 16th Street), Cherry Creek Shopping Center (Tours & Charters; 3000 E 1st Ave).
346 married couples with children.
46 single-parent households (38 men, 8 women).
86.4% of residents of 80202 zip code speak English at home.
7.5% of residents speak Spanish at home (86% very well, 8% well, 3% not well, 3% not at all).
2.1% of residents speak other Indo-European language at home (86% very well, 14% well).
3.2% of residents speak Asian or Pacific Island language at home (65% very well, 11% well, 11% not well, 13% not at all).
0.2% of residents speak other language at home (100% very well).
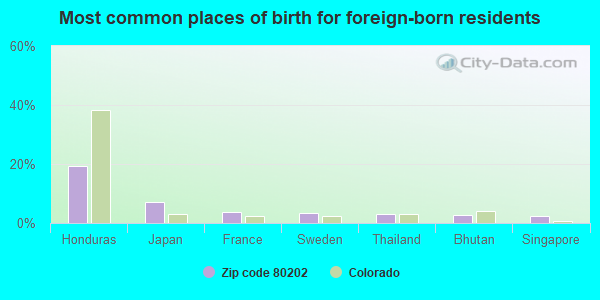
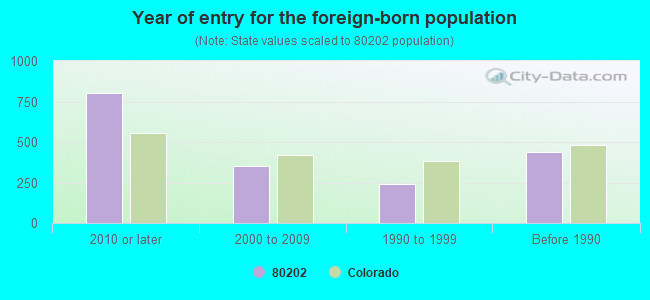
Foreign born population: 1,489 (8.1%) (55.9% of them are naturalized citizens)
AMERICAN MAIL WELL ENVELOPE (3500 ROCKMONT DRIVE in DENVER, CO)
AIR MINOR (AIRS/AFS) STATE MASTER (Colorado database) - RCRAINFO-COD086345543, SQG CRITERIA AND HAZARDOUS AIR POLLUTANT INVENTORY (Inventory of air pollution sources) Conditionally Exempt Small Quantity Generators, less than 100 kg/month of hazardous waste (Resource Conservation and Recovery Act (tracking hazardous waste)) - notification Business SIC classification: COMMERCIAL PRINTING, LITHOGRAPHIC Organizations: MAIL WELL CORP (CONTACT/OWNER)
Alternative names: MAIL-WELL ENVELOPE, MAIL-WELL ENVELOPE (WAS AMERICAN M-W)
CGG AMERICAN SERVICES (1616 CHAMPA ST in DENVER, CO)
STATE MASTER (Colorado database) - RCRAINFO-COD980959837, SQG (Resource Conservation and Recovery Act (tracking hazardous waste))
GENERAL SERVICE ADMIN (1961 STOUT ST RM 160 in DENVER, CO) . Federal Facility. GENERAL SERVICES ADMINISTRATION
STATE MASTER (Colorado database) - RCRAINFO-CO2470090141, SQG Small Quantity Generators, between 100 kg and 1000 kg of hazardous waste/month (Resource Conservation and Recovery Act (tracking hazardous waste)) - notification
BLAKE STREET PROPERTIES (1428 15TH ST in DENVER, CO)
STATE MASTER (Colorado database) - RCRAINFO-COR000005975, ENFORCEMENT/COMPLIANCE ACTIVITY (Resource Conservation and Recovery Act (tracking hazardous waste))
GROENDYKE TRANSPORT, INC. (1675 BROADWAY in DENVER, CO)
ENFORCEMENT/COMPLIANCE ACTIVITY (Integrated Compliance Information System) (Integrated Compliance Information System) - ICIS-08-2000-0290, FORMAL ENFORCEMENT ACTION
A M R COMBS DENVER INC (SMITH RD SAND CREEK SEC 28 S 1/2 OF SEC 21 in DENVER, CO)
(Integrated Compliance Information System) - ICIS-08-1992-0062, FORMAL ENFORCEMENT ACTION
K.P. KAUFFMAN CO (1675 BROADWAY, STE 1970 in DENVER, CO)
(Integrated Compliance Information System) - ICIS-08-1999-0222, FORMAL ENFORCEMENT ACTION
FOX CO (1200 17TH STREET, STE 3000 in DENVER, CO)
(Integrated Compliance Information System) - ICIS-08-2000-0197, FORMAL ENFORCEMENT ACTION
BERRY PETROLEUM CO - YGS SITE 02 (HB: 36629 HWY 385 in WRAY, CO)
AIR MINOR (AIRS/AFS) Business SIC classification: CRUDE PETROLEUM AND NATURAL GAS
BARRETT RESOURCES CORP (SEC 33 T6S R94W in GARFIELD, CO)
AIR MINOR (AIRS/AFS) Business SIC classification: CRUDE PETROLEUM AND NATURAL GAS
ADAMS MARK HOTEL DENVER (1550 COURT PLACE in DENVER, CO)
AIR SYNTHETIC MINOR (AIRS/AFS) CRITERIA AND HAZARDOUS AIR POLLUTANT INVENTORY (Inventory of air pollution sources) Conditionally Exempt Small Quantity Generators, less than 100 kg/month of hazardous waste (Resource Conservation and Recovery Act (tracking hazardous waste)) - notification Business SIC classification: HOTELS AND MOTELS; DRYCLEANING PLANTS, EXCEPT RUG CLEANING Alternative names: ADAMS MARK HOTEL WAS RADISSON HOTEL
Housing units lacking complete plumbing facilities: 1.0% Housing units lacking complete kitchen facilities: 1.6%
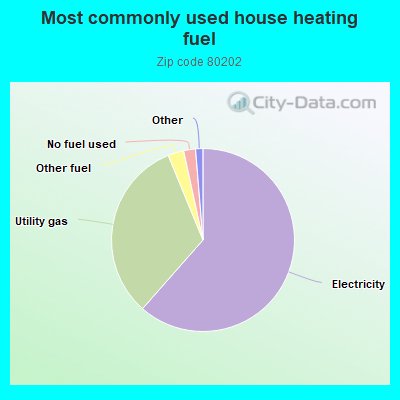
61.5%Electricity
32.3%Utility gas
2.8%Other fuel
2.1%No fuel used
0.7%Bottled, tank, or LP gas
0.6%Solar energy
Population in 1990: 2,816. Population change in the 1990s: +1,548 (+55.0%).
Place of birth for U.S.-born residents:
This state: 2,997
Northeast: 2,669
Midwest: 4,222
South: 4,019
West: 2,733
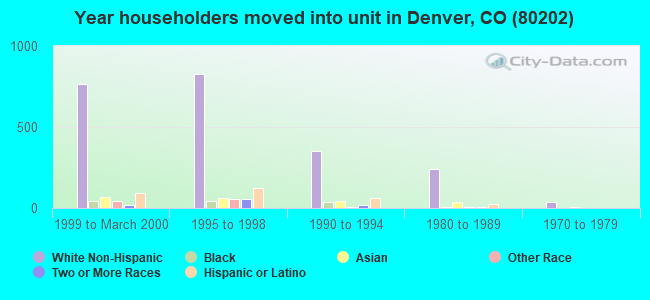
33% of the 80202 zip code residents lived in the same house 5 years ago. Out of people who lived in different houses, 39% lived in this county. Out of people who lived in different counties, 50% lived in Colorado.
64% of the 80202 zip code residents lived in the same house 1 year ago. Out of people who lived in different houses, 34% moved from this county. Out of people who lived in different houses, 15% moved from different county within same state. Out of people who lived in different houses, 43% moved from different state. Out of people who lived in different houses, 5% moved from abroad.
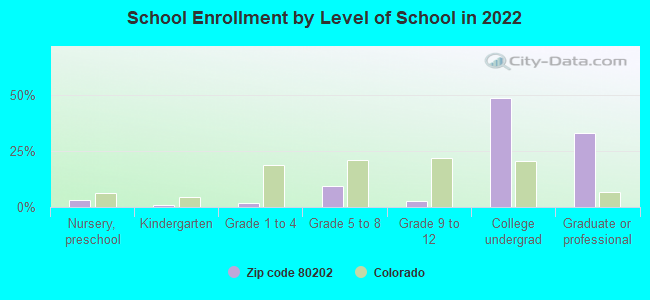
Private vs. public school enrollment:
Students in private schools in grades 1 to 8 (elementary and middle school):
Here:
0.0%
Colorado:
11.4%
Students in private schools in grades 9 to 12 (high school):
Here:
0.0%
Colorado:
8.5%
Students in private undergraduate colleges: 84
Here:
7.2%
Colorado:
14.0%
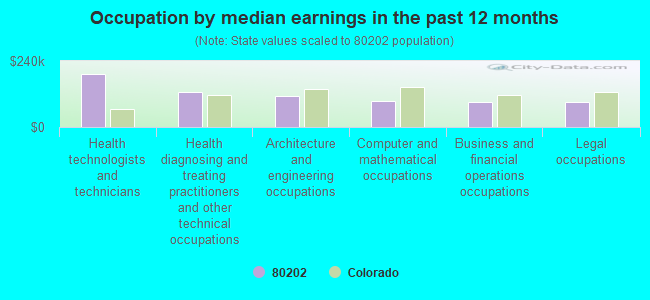
Occupation by median earnings in the past 12 months ($)
192,494Health technologists and technicians
126,691Health diagnosing and treating practitioners and other technical occupations
112,593Architecture and engineering occupations
94,091Computer and mathematical occupations
91,960Business and financial operations occupations
89,746Legal occupations
Companies with biggest federal contracts located in this zip code (DENVER, CO):
GARY-WILLIAMS ENERGY CORPORATI (370 17TH ST STE 5300; small business) : $412,186,776 in 18 contractsfrom 2000 to 2006
Contracts for Liquid Propellants and Fuels, Petroleum Base by Defense Logistics Agency Signed by year:2000: $56,527,797; 2001: $64,839,226; 2002: $37,816,004; 2003: $0; 2004: $59,231,153; 2005: $75,398,395; 2006: $118,374,201.
Biggest contracts:
$64,917,210 with Defense Logistics Agency for Liquid Propellants and Fuels, Petroleum Base. Taking place in OK. Signed on 2006-03-22. Completion date: 2007-04-30.
$53,456,991, same as above.Signed on 2006-03-22. Completion date: 2007-04-30.
$49,526,047, same as above.Signed on 2000-09-08. Completion date: 2001-10-30.
$48,074,283, same as above.Signed on 2001-09-18. Completion date: 2002-10-30.
HERMES CONSOLIDATED, INC (1600 BROADWAY; small business) : $150,026,818 in 10 contractsfrom 1999 to 2006
Contracts for Liquid Propellants and Fuels, Petroleum Base, Fuel Oils by Defense Logistics Agency Signed by year:2000: $20,687,628; 2001: $25,940,250; 2002: $8,481,967; 2003: $0; 2004: $25,746,189; 2005: $27,597,240; 2006: $40,792,973.
Biggest contracts:
$40,792,973 with Defense Logistics Agency for Liquid Propellants and Fuels, Petroleum Base. Taking place in WY. Signed on 2006-03-21. Completion date: 2007-04-30.
$27,597,240, same as above.Signed on 2005-03-18. Completion date: 2006-04-30.
$25,940,250 with Defense Logistics Agency for Liquid Propellants and Fuels, Petroleum Base. Signed on 2001-09-20. Completion date: 2002-10-30.
$23,085,177 with Defense Logistics Agency for Liquid Propellants and Fuels, Petroleum Base. Taking place in WY. Signed on 2004-03-02. Completion date: 2005-04-30.
QWEST CORPORATION (1005 17TH STREET) : $33,376,109 in 1220 contractsfrom 1999 to 2006
Contracts for ADP Telecommunications and Transmission Services, ADP Components, Telephone and/or Communications Services (includes Telegraph, Telex, and Cablevision Services), Lease or Rental of Equipment -- Communication, Detection, and Coherent Radiation Equipment, and moreby Department of Defense, Bureau of Land Management, Air Force, Federal Technology Service, and others Signed by year:2000: $3,991,095; 2001: $49,685,016; 2002: -$23,547,363; 2003: -$1,833,814; 2004: $3,088,634; 2005: $838,908; 2006: $3,633.
Biggest contracts:
$31,560,000 with Department of Defense for ADP Telecommunications and Transmission Services. Signed on 2001-10-31. Completion date: 2011-01-04.
$30,913,200, same as above.Signed on 2002-06-30. Completion date: 2011-01-04.
$3,266,800, same as above.Signed on 2001-10-31. Completion date: 2006-10-11.
$3,262,480, same as above.Signed on 2001-10-31. Completion date: 2006-10-11.
AXXESS CONNECT (1400 16TH STREET, SUITE 40; small business) : $32,703,465 in 155 contractsfrom 2002 to 2006
Contracts for ADP Telecommunications and Transmission Services by Defense Information Systems Agency, Department of Defense Signed by year:2000: $0; 2001: $0; 2002: $123,446; 2003: $10,507,464; 2004: $16,668,752; 2005: $4,790,855; 2006: $612,948.
Biggest contracts:
$1,881,000 with Defense Information Systems Agency for ADP Telecommunications and Transmission Services. Signed on 2003-11-30. Completion date: 2006-10-22.
$1,332,072, same as above.Signed on 2004-02-29. Completion date: 2007-01-29.
$1,121,480 with Department of Defense for ADP Telecommunications and Transmission Services. Signed on 2003-08-31. Completion date: 2006-08-08.
$1,085,240 with Defense Information Systems Agency for ADP Telecommunications and Transmission Services. Signed on 2004-02-29. Completion date: 2009-02-04.
COASTAL FUELS MARKETING, INC (1670 BROADWAY, SUITE 3200) : $5,790,865 in 10 contractsfrom 2000 to 2006
Contracts for Fuel Oils, Lease or Rental of Facilities -- Fuel Storage Buildings, Liquid Propellants and Fuels, Petroleum Base by Defense Logistics Agency, Army Signed by year:2000: $3,353,603; 2001: $636,342; 2002: $649,000; 2003: $0; 2004: $180,000; 2005: $959,920; 2006: $12,000.
Biggest contracts:
$2,717,261 with Defense Logistics Agency for Fuel Oils. Taking place in NY. Signed on 2000-03-31. Completion date: 2002-04-30.
$757,920 with Defense Logistics Agency for Lease or Rental of Facilities -- Fuel Storage Buildings. Taking place in FL. Signed on 2005-05-18. Completion date: 2010-05-31.
$649,000, same as above.Signed on 2002-02-07. Completion date: 2003-02-28.
$636,342, same as above.Signed on 2001-01-12. Completion date: 2001-02-28.
MWH AMERICAS, INC (1801 CALIFORNIA ST) : $5,219,155 in 9 contractsfrom 2004 to 2006
Contracts for Residential Buildings, Other Buildings, Architect - Engineer Services (including landscaping, interior layout, and designing), Construction of Structures and Facilities -- Miscellaneous Buildings by Air Force Signed by year:2000: $0; 2001: $0; 2002: $0; 2003: $0; 2004: $2,430,499; 2005: $2,694,271; 2006: $94,385.
Biggest contracts:
$2,430,499 with Air Force for Residential Buildings. Taking place in TX. Signed on 2004-09-25. Completion date: 2005-12-30.
$1,069,046, same as above.Signed on 2005-06-30. Completion date: 2006-12-31.
$786,170 with Air Force for Other Buildings. Taking place in TX. Signed on 2005-06-30. Completion date: 2006-03-31.
$624,000 with Air Force for Architect - Engineer Services (including landscaping, interior layout, and designing). Taking place in TX. Signed on 2005-09-24. Completion date: 2006-05-22.
CAMBRIA CORPORATION (1625 LARIMER ST #707; small business) : $4,469,054 in 11 contractsfrom 2002 to 2005
Contracts for Maintenance, Repair or Alteration of Real Property -- Miscellaneous Buildings, Maintenance, Repair or Alteration of Real Property -- Office Buildings by Army Signed by year:2000: $0; 2001: $0; 2002: $1,240,457; 2003: $1,071,392; 2004: $2,165,000; 2005: -$7,795; 2006: $0.
Biggest contracts:
$2,165,000 with Army for Maintenance, Repair or Alteration of Real Property -- Miscellaneous Buildings. Signed on 2004-09-02. Completion date: 2005-01-21.
$1,207,690 with Army for Maintenance, Repair or Alteration of Real Property -- Office Buildings. Signed on 2002-09-30. Completion date: 2003-08-29.
$934,424 with Army for Maintenance, Repair or Alteration of Real Property -- Miscellaneous Buildings. Signed on 2003-09-05. Completion date: 2004-04-27.
$56,650 with Army for Maintenance, Repair or Alteration of Real Property -- Office Buildings. Signed on 2003-09-03. Completion date: 2003-08-29.
MATRIX DESIGN GROUP, INC (1601 BLAKE ST, STE 200) : $1,616,868 in 5 contractsfrom 2003 to 2005
Contracts for Other Environmental Services, Studies, and Analytical Support, Administrative and Service Buildings, Waste Treatment and Storage by Army Signed by year:2000: $0; 2001: $0; 2002: $0; 2003: $1,139,397; 2004: $294,853; 2005: $182,618; 2006: $0.
Biggest contracts:
$1,109,397 with Army for Other Environmental Services, Studies, and Analytical Support. Taking place in CA. Signed on 2003-10-20. Completion date: 2005-01-03.
$294,853 with Army for Administrative and Service Buildings. Signed on 2004-09-23. Completion date: 2005-09-30.
$182,618, same as above.Signed on 2005-05-13. Completion date: 2006-11-13.
$30,000 with Army for Waste Treatment and Storage. Signed on 2003-02-10. Completion date: 2003-03-13.
R N L FACILITIES CORPORATION (1515 ARAPAHOE ST TOWER 3) : $1,550,454 in 28 contractsfrom 2000 to 2006
Contracts for Architect - Engineer Services (including landscaping, interior layout, and designing) by Air Force, Army Signed by year:2000: $327,198; 2001: $340,799; 2002: $24,923; 2003: $165,147; 2004: $628,689; 2005: $43,717; 2006: $19,981.
Biggest contracts:
$249,758 with Air Force for Architect - Engineer Services (including landscaping, interior layout, and designing). Signed on 2004-06-15. Completion date: 2005-01-20.
$232,069 with Army for Architect - Engineer Services (including landscaping, interior layout, and designing). Signed on 2001-03-13. Completion date: 2001-12-31.
$227,374 with Air Force for Architect - Engineer Services (including landscaping, interior layout, and designing). Signed on 2004-10-22. Completion date: 2005-09-09.
$140,276 with Army for Architect - Engineer Services (including landscaping, interior layout, and designing). Signed on 2000-03-16. Completion date: 2000-12-29.
APPARATUS SALES CORPORATION (1800 GLENARM PLACE, 7TH FL; small business) : $1,509,181 in 23 contractsfrom 2000 to 2004
Contracts for Communications Services, ADP Systems Analysis Services, Electrical and Electronic assemblies, Boards, Cards, and Associated Hardware, Maintenance, Repair and Rebuilding of Equipment -- Automatic Data Processing Equipment (Including Firmware), Software, Supplies and Support Equipment, and moreby Air Force, Navy, Mine Safety and Health Administration, Federal Technology Service, and others Signed by year:2000: $265,000; 2001: $244,000; 2002: $253,401; 2003: $734,953; 2004: $11,827; 2005: $0; 2006: $0.
Biggest contracts:
$403,500 with Air Force for Communications Services. Signed on 2003-12-01. Completion date: 2004-09-30.
$265,000 with Navy for ADP Systems Analysis Services. Signed on 2000-10-12. Completion date: 2000-10-12.
$154,708 with Air Force for Electrical and Electronic assemblies, Boards, Cards, and Associated Hardware. Signed on 2003-07-01. Completion date: 2003-08-01.
$123,884 with Air Force for Maintenance, Repair and Rebuilding of Equipment -- Automatic Data Processing Equipment (Including Firmware), Software, Supplies and Support Equipment. Taking place in TX. Signed on 2003-10-07. Completion date: 2004-09-30.
Top industries in this zip code by the number of employees in 2005:
2002 - 2018 National Fire Incident Reporting System (NFIRS) incidents
According to the data from the years 2002 - 2018 the average number of fire incidents per year is 76. The highest number of fire incidents - 119 took place in 2002, and the least - 14 in 2018. The data has a dropping trend.
When looking into fire subcategories, the most reports belonged to: Outside Fires (45.8%), and Structure Fires (35.8%).
Fire incident types reported to NFIRS in Zip Code 80202
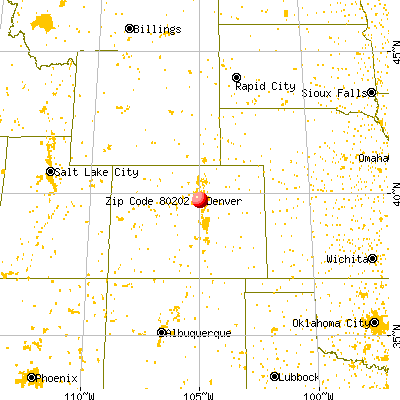


 Nearest zip codes: 80294, 80293, 80290, 80264, 80203, 80211.
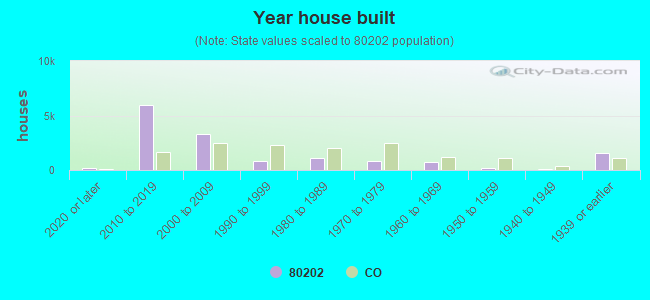


 According to the data from the years 2002 - 2018 the average number of fire incidents per year is 76. The highest number of fire incidents - 119 took place in 2002, and the least - 14 in 2018. The data has a dropping trend.
 When looking into fire subcategories, the most reports belonged to: Outside Fires (45.8%), and Structure Fires (35.8%).