Estimated zip code population in 2022: 36,620 Zip code population in 2010: 31,583 Zip code population in 2000: 37,620
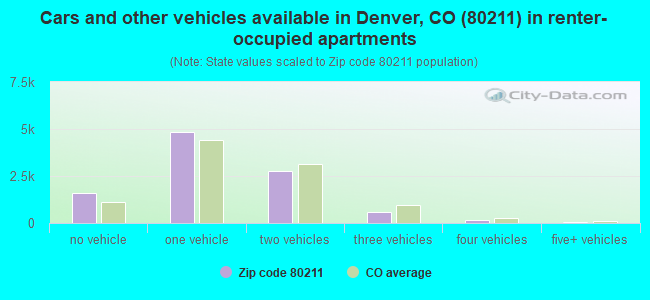
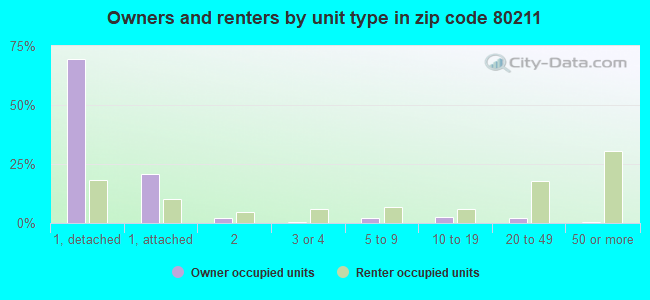
Houses and condos: 20,654 Renter-occupied apartments: 10,012
% of renters here:
51%
State:
34%
March 2022 cost of living index in zip code 80211: 111.0 (more than average, U.S. average is 100)
Land area: 4.5 sq. mi. Water area: 0.0 sq. mi.
Population density: 8,145 people per square mile
(high).
OSM Map
General Map
Google Map
MSN Map
OSM Map
General Map
Google Map
MSN Map
OSM Map
General Map
Google Map
MSN Map
OSM Map
General Map
Google Map
MSN Map
Please wait while loading the map...
Real estate property taxes paid for housing units in 2022:
This zip code:
0.4% ($2,978)
Colorado:
0.5% ($2,422)
Median real estate property taxes paid for housing units with mortgages in 2022: $3,007 (0.4%) Median real estate property taxes paid for housing units with no mortgage in 2022: $2,922 (0.4%)
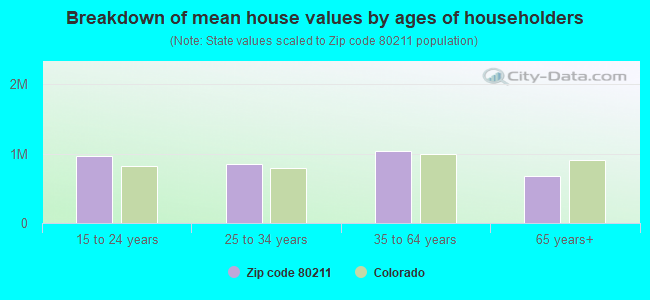
Estimated median house/condo value in 2022: $789,639
80211:
$789,639
Colorado:
$531,100
According to our research of Colorado and other state lists, there were 57 registered sex offenders living in 80211 zip code as of April 27, 2024. The ratio of all residents to sex offenders in zip code 80211 is 592 to 1. The ratio of registered sex offenders to all residents in this zip code is lower than the state average.
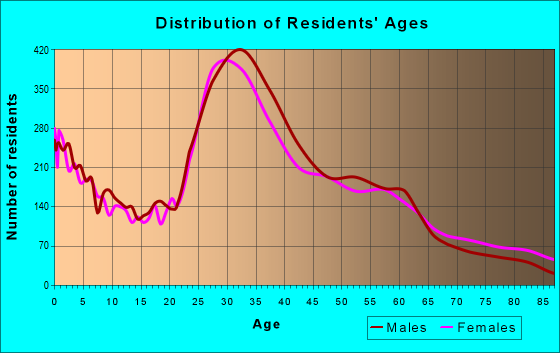
Median resident age:
This zip code:
34.2 years
Colorado median age:
37.7 years
Average household size:
This zip code:
1.8 people
Colorado:
2.4 people
Averages for the 2020 tax year for zip code 80211, filed in 2021:
Average Adjusted Gross Income (AGI) in 2020: $116,320 (Individual Income Tax Returns)
Here:
$116,320
State:
$89,260
Salary/wage: $97,268 (reported on 89.0% of returns)
Here:
$97,268
State:
$70,330
(% of AGI for various income ranges: 1163.1% for AGIs below $25k, 3880.7% for AGIs $25k-50k, 7233.3% for AGIs $50k-75k, 11147.8% for AGIs $75k-100k, 21174.8% for AGIs $100k-200k, 96060.7% for AGIs over 200k)
Taxable interest for individuals: $1,644 (reported on 34.6% of returns)
This zip code:
$1,644
Colorado:
$2,176
(% of AGI for various income ranges: 11.5% for AGIs below $25k, 14.6% for AGIs $25k-50k, 24.3% for AGIs $50k-75k, 30.4% for AGIs $75k-100k, 90.9% for AGIs $100k-200k, 974.4% for AGIs over 200k)
Ordinary dividends: $5,354 (reported on 34.1% of returns)
Here:
$5,354
State:
$8,820
(% of AGI for various income ranges: 33.0% for AGIs below $25k, 47.2% for AGIs $25k-50k, 87.9% for AGIs $50k-75k, 118.8% for AGIs $75k-100k, 331.8% for AGIs $100k-200k, 2943.5% for AGIs over 200k)
Net capital gain/loss in AGI: +$39,893 (reported on 32.9% of returns)
Here:
+$39,893
State:
+$37,276
(% of AGI for various income ranges: 37.2% for AGIs below $25k, 50.9% for AGIs $25k-50k, 105.5% for AGIs $50k-75k, 227.1% for AGIs $75k-100k, 808.6% for AGIs $100k-200k, 30769.4% for AGIs over 200k)
Profit/loss from business: +$18,452 (reported on 17.0% of returns)
Here:
+$18,452
State:
+$15,295
(% of AGI for various income ranges: 200.3% for AGIs below $25k, 224.4% for AGIs $25k-50k, 264.5% for AGIs $50k-75k, 316.7% for AGIs $75k-100k, 675.7% for AGIs $100k-200k, 3068.6% for AGIs over 200k)
Taxable individual retirement arrangement distribution: $15,634 (reported on 4.6% of returns)
80211:
$15,634
Colorado:
$23,785
(% of AGI for various income ranges: 35.6% for AGIs below $25k, 51.9% for AGIs $25k-50k, 59.5% for AGIs $50k-75k, 133.7% for AGIs $75k-100k, 226.0% for AGIs $100k-200k, 411.9% for AGIs over 200k)
Self-employed (Keogh) retirement plans: $22,979 (reported on 1.1% of returns)
80211:
$22,979
Colorado:
$23,633
(% of AGI for various income ranges: 21.1% for AGIs $50k-75k, 44.5% for AGIs $100k-200k, 444.9% for AGIs over 200k)
Total itemized deductions: $28,137 (reported on 17.4% of returns)
Here:
$28,137
State:
$35,141
(% of AGI for various income ranges: 68.4% for AGIs below $25k, 100.1% for AGIs $25k-50k, 213.4% for AGIs $50k-75k, 484.1% for AGIs $75k-100k, 1355.8% for AGIs $100k-200k, 6481.6% for AGIs over 200k)
Charity contributions: $5,232 (reported on 12.6% of returns)
Here:
$5,232
State:
$12,103
(% of AGI for various income ranges: 3.9% for AGIs below $25k, 7.9% for AGIs $25k-50k, 19.0% for AGIs $50k-75k, 38.7% for AGIs $75k-100k, 126.2% for AGIs $100k-200k, 1162.0% for AGIs over 200k)
Taxes paid: $8,281 (reported on 17.4% of returns)
80211:
$8,281
State:
$7,710
(% of AGI for various income ranges: 10.0% for AGIs below $25k, 19.0% for AGIs $25k-50k, 53.2% for AGIs $50k-75k, 142.3% for AGIs $75k-100k, 459.3% for AGIs $100k-200k, 1833.8% for AGIs over 200k)
Earned income credit: $1,806 (reported on 7.1% of returns)
Here:
$1,806
State:
$2,053
(% of AGI for various income ranges: 69.1% for AGIs below $25k, 25.3% for AGIs $25k-50k)
Percentage of individuals using paid preparers for their 2020 taxes: 95.0%
Here:
95%
State:
93%
(% for various income ranges: 91.7% for AGIs below $25k, 94.1% for AGIs $25k-50k, 96.1% for AGIs $50k-75k, 95.9% for AGIs $75k-100k, 96.3% for AGIs $100k-200k, 96.8% for AGIs over 200k)
Averages for the 2012 tax year for zip code 80211, filed in 2013:
Average Adjusted Gross Income (AGI) in 2012: $73,235 (Individual Income Tax Returns)
Here:
$73,235
State:
$69,103
Salary/wage: $57,607 (reported on 88.3% of returns)
Here:
$57,607
State:
$54,794
(% of AGI for various income ranges: 77.5% for AGIs below $25k, 86.0% for AGIs $25k-50k, 85.7% for AGIs $50k-75k, 86.8% for AGIs $75k-100k, 85.2% for AGIs $100k-200k, 38.3% for AGIs over 200k)
Taxable interest for individuals: $1,504 (reported on 30.0% of returns)
This zip code:
$1,504
Colorado:
$1,971
(% of AGI for various income ranges: 0.8% for AGIs below $25k, 0.3% for AGIs $25k-50k, 0.3% for AGIs $50k-75k, 0.4% for AGIs $75k-100k, 0.5% for AGIs $100k-200k, 1.1% for AGIs over 200k)
Ordinary dividends: $5,322 (reported on 21.6% of returns)
Here:
$5,322
State:
$7,140
(% of AGI for various income ranges: 1.1% for AGIs below $25k, 0.7% for AGIs $25k-50k, 0.9% for AGIs $50k-75k, 1.1% for AGIs $75k-100k, 1.1% for AGIs $100k-200k, 2.7% for AGIs over 200k)
Net capital gain/loss in AGI: +$17,042 (reported on 17.6% of returns)
Here:
+$17,042
State:
+$23,009
(% of AGI for various income ranges: 0.1% for AGIs below $25k, 0.3% for AGIs $25k-50k, 0.6% for AGIs $50k-75k, 0.7% for AGIs $75k-100k, 1.8% for AGIs $100k-200k, 10.4% for AGIs over 200k)
Profit/loss from business: +$13,270 (reported on 17.9% of returns)
Here:
+$13,270
State:
+$13,514
(% of AGI for various income ranges: 10.8% for AGIs below $25k, 4.5% for AGIs $25k-50k, 3.8% for AGIs $50k-75k, 3.6% for AGIs $75k-100k, 3.5% for AGIs $100k-200k, 1.0% for AGIs over 200k)
Taxable individual retirement arrangement distribution: $12,249 (reported on 5.3% of returns)
80211:
$12,249
Colorado:
$17,927
(% of AGI for various income ranges: 1.7% for AGIs below $25k, 1.1% for AGIs $25k-50k, 1.1% for AGIs $50k-75k, 1.1% for AGIs $75k-100k, 1.0% for AGIs $100k-200k, 0.4% for AGIs over 200k)
Self-employment retirement plans: $14,950 (reported on 0.8% of returns)
80211:
$14,950
Colorado:
$19,483
(% of AGI for various income ranges: 0.2% for AGIs below $25k, 0.2% for AGIs $50k-75k, 0.2% for AGIs $100k-200k, 0.3% for AGIs over 200k)
Total itemized deductions: $22,215 (16% of AGI, reported on 36.2% of returns)
Here:
$22,215
State:
$24,621
Here:
15.7% of AGI
State:
18.5% of AGI
(% of AGI for various income ranges: 7.5% for AGIs below $25k, 8.4% for AGIs $25k-50k, 11.7% for AGIs $50k-75k, 14.0% for AGIs $75k-100k, 13.4% for AGIs $100k-200k, 9.6% for AGIs over 200k)
Charity contributions: $3,701 (reported on 28.2% of returns)
Here:
$3,701
State:
$4,449
(% of AGI for various income ranges: 0.4% for AGIs below $25k, 0.7% for AGIs $25k-50k, 1.0% for AGIs $50k-75k, 1.1% for AGIs $75k-100k, 1.0% for AGIs $100k-200k, 2.5% for AGIs over 200k)
Taxes paid: $7,833 (reported on 35.9% of returns)
80211:
$7,833
State:
$7,641
(% of AGI for various income ranges: 1.2% for AGIs below $25k, 1.6% for AGIs $25k-50k, 3.0% for AGIs $50k-75k, 4.2% for AGIs $75k-100k, 4.8% for AGIs $100k-200k, 4.7% for AGIs over 200k)
Earned income credit: $1,990 (reported on 14.9% of returns)
Here:
$1,990
State:
$2,095
(% of AGI for various income ranges: 5.7% for AGIs below $25k, 0.6% for AGIs $25k-50k)
Percentage of individuals using paid preparers for their 2012 taxes: 46.8%
Here:
47%
State:
49%
(% for various income ranges: 47.3% for AGIs below $25k, 42.7% for AGIs $25k-50k, 44.4% for AGIs $50k-75k, 44.8% for AGIs $75k-100k, 50.7% for AGIs $100k-200k, 73.4% for AGIs over 200k)
Averages for the 2004 tax year for zip code 80211, filed in 2005:
Average Adjusted Gross Income (AGI) in 2004: $39,383 (Individual Income Tax Returns)
Here:
$39,383
State:
$55,014
Salary/wage: $37,359 (reported on 88.1% of returns)
Here:
$37,359
State:
$46,010
(% of AGI for various income ranges: 130.0% for AGIs below $10k, 82.1% for AGIs $10k-25k, 89.8% for AGIs $25k-50k, 88.2% for AGIs $50k-75k, 88.3% for AGIs $75k-100k, 67.8% for AGIs over 100k)
Taxable interest for individuals: $1,033 (reported on 33.6% of returns)
This zip code:
$1,033
Colorado:
$2,127
(% of AGI for various income ranges: 4.7% for AGIs below $10k, 1.4% for AGIs $10k-25k, 0.6% for AGIs $25k-50k, 0.8% for AGIs $50k-75k, 0.7% for AGIs $75k-100k, 0.9% for AGIs over 100k)
Taxable dividends: $1,967 (reported on 18.0% of returns)
Here:
$1,967
State:
$3,782
(% of AGI for various income ranges: 2.7% for AGIs below $10k, 0.6% for AGIs $10k-25k, 0.5% for AGIs $25k-50k, 0.8% for AGIs $50k-75k, 0.6% for AGIs $75k-100k, 1.6% for AGIs over 100k)
Net capital gain/loss: +$5,124 (reported on 14.6% of returns)
Here:
+$5,124
State:
+$17,882
(% of AGI for various income ranges: 0.4% for AGIs below $10k, 0.3% for AGIs $10k-25k, 0.3% for AGIs $25k-50k, 0.6% for AGIs $50k-75k, 1.0% for AGIs $75k-100k, 6.2% for AGIs over 100k)
Profit/loss from business: +$8,482 (reported on 15.7% of returns)
Here:
+$8,482
State:
+$11,247
(% of AGI for various income ranges: 9.6% for AGIs below $10k, 6.1% for AGIs $10k-25k, 2.9% for AGIs $25k-50k, 3.0% for AGIs $50k-75k, 3.8% for AGIs $75k-100k, 2.3% for AGIs over 100k)
IRA payment deduction: $2,395 (reported on 2.1% of returns)
80211:
$2,395
Colorado:
$2,947
(% of AGI for various income ranges: 0.2% for AGIs below $10k, 0.2% for AGIs $10k-25k, 0.2% for AGIs $25k-50k, 0.1% for AGIs $50k-75k, 0.1% for AGIs $75k-100k, 0.1% for AGIs over 100k)
Self-employed pension: $9,578 (reported on 0.8% of returns)
Here:
$9,578
Colorado:
$13,653
(% of AGI for various income ranges: 0.1% for AGIs $25k-50k, 0.1% for AGIs $50k-75k, 0.3% for AGIs $75k-100k, 0.4% for AGIs over 100k)
Total itemized deductions: $16,794 (25% of AGI, reported on 36.4% of returns)
Here:
$16,794
State:
$20,560
Here:
24.8% of AGI
State:
21.4% of AGI
(% of AGI for various income ranges: 18.2% for AGIs below $10k, 9.2% for AGIs $10k-25k, 14.3% for AGIs $25k-50k, 17.5% for AGIs $50k-75k, 17.7% for AGIs $75k-100k, 16.9% for AGIs over 100k)
Charity contributions deductions: $1,901 (3% of AGI, reported on 30.3% of returns)
Here:
$1,901
State:
$3,518
Here:
2.7% of AGI
State:
3.4% of AGI
(% of AGI for various income ranges: 0.8% for AGIs below $10k, 0.8% for AGIs $10k-25k, 1.2% for AGIs $25k-50k, 1.4% for AGIs $50k-75k, 1.5% for AGIs $75k-100k, 2.2% for AGIs over 100k)
Total tax: $5,849 (reported on 73.4% of returns)
80211:
$5,849
State:
$9,173
(% of AGI for various income ranges: 4.2% for AGIs below $10k, 4.1% for AGIs $10k-25k, 7.4% for AGIs $25k-50k, 10.8% for AGIs $50k-75k, 12.4% for AGIs $75k-100k, 18.0% for AGIs over 100k)
Earned income credit: $1,681 (reported on 18.4% of returns)
Here:
$1,681
State:
$1,595
Percentage of individuals using paid preparers for their 2004 taxes: 55.8%
Here:
56%
State:
55%
(% for various income ranges: 53.3% for AGIs below $10k, 60.3% for AGIs $10k-25k, 53.7% for AGIs $25k-50k, 53.8% for AGIs $50k-75k, 51.4% for AGIs $75k-100k, 62.6% for AGIs over 100k)
Likely homosexual households (counted as self-reported same-sex unmarried-partner households)
Lesbian couples: 0.3% of all households
Gay men: 0.4% of all households
Household received Food Stamps/SNAP in the past 12 months: 1,320 Household did not receive Food Stamps/SNAP in the past 12 months: 18,475
Women who had a birth in the past 12 months: 528 (505 now married, 34 unmarried) Women who did not have a birth in the past 12 months: 12,023 (3,794 now married, 8,274 unmarried)
Housing units in zip code 80211 with a mortgage: 7,552 (917 second mortgage, 23 home equity loan, 709 both second mortgage and home equity loan) Houses without a mortgage: 110
Median monthly owner costs for units with a mortgage: $2,663 Median monthly owner costs for units without a mortgage: $576
Residents with income below the poverty level in 2022:
This zip code:
9.3%
Whole state:
9.4%
Residents with income below 50% of the poverty level in 2022:
This zip code:
4.5%
Whole state:
4.6%
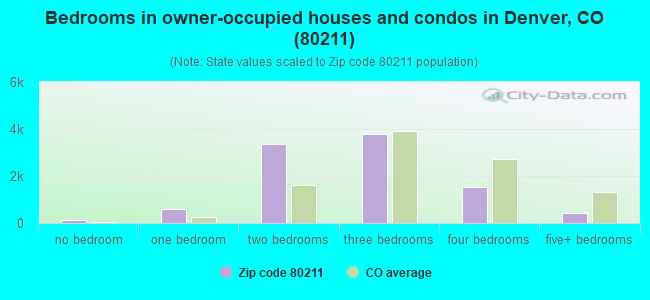
Median number of rooms in houses and condos:
Here:
6.0
State:
6.8
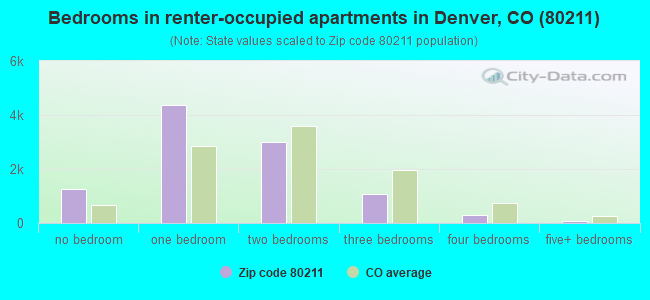
Median number of rooms in apartments:
Here:
3.5
State:
4.0
Notable locations in this zip code not listed on our city pages
Notable locations in zip code 80211: Old Highland Business District (A), Saint Elizabeth Retreat (B), Denver Public Library Woodbury Branch (C), Adams Mystery Playhouse (D), Germinal Stage Denver (E), The Denver Puppet Theater (F), Denver Police Department District 1 Substation (G), The Bug Theater (H), PPA Event Center (I), Children's Museum (J), Denver Fire Department Station 7 (K), Denver Fire Department Station 12 (L), Little Sisters of the Poor Mullen Home (M), Mount Saint Vincent Home (N), Highlands Masonic Temple (O). Display/hide their locations on the map
Churches in zip code 80211 include: Messiah Baptist Church (A), The Firehouse Church (B), Riverside Baptist Church (C), Highlands Lutheran Church (D), Highland Christian Church (E), Iglesia Palabra de Vida (F), First Denver Friends Church (G), Faith Lutheran Church (H), Emmaus Lutheran Church (I). Display/hide their locations on the map
Parks in zip code 80211 include: Hirshorn Park (1), Highland Park (2), Gates Crescent Park (3), Osceola And 29th Park (4), Pecos And 46th Park (5), Columbus Park (6), Chaffee Park (7), McDonough Park (8), Rocky Mountain Park (9). Display/hide their locations on the map
Tourist attraction (not listed on the city page) : Children's Museum of Denver (2121 Childrens Museum Drive).
2,991 married couples with children.
996 single-parent households (157 men, 839 women).
83.1% of residents of 80211 zip code speak English at home.
12.9% of residents speak Spanish at home (55% very well, 20% well, 16% not well, 9% not at all).
2.6% of residents speak other Indo-European language at home (94% very well, 5% well, 1% not well).
0.9% of residents speak Asian or Pacific Island language at home (41% very well, 16% well, 36% not well, 7% not at all).
0.2% of residents speak other language at home (35% very well, 46% well, 19% not at all).
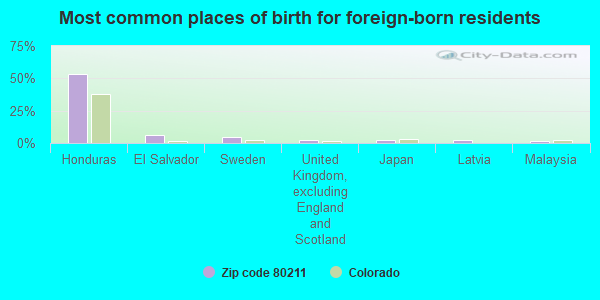
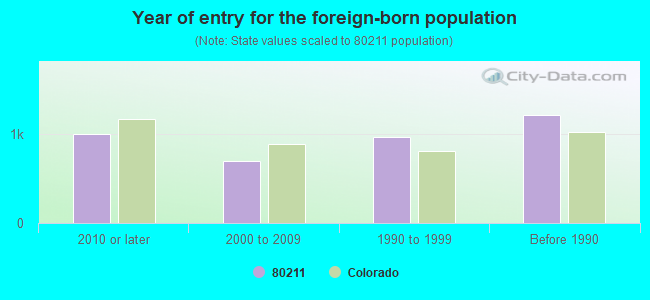
Foreign born population: 3,082 (8.4%) (46.8% of them are naturalized citizens)
Major facilities with environmental interests located in this zip code:
BF PIRRELLIS INCORPORATED (3549 W 38TH AVE in DENVER, CO)
AIR MINOR (AIRS/AFS) STATE MASTER (Colorado database) - RCRAINFO-COD983792359, SQG (Resource Conservation and Recovery Act (tracking hazardous waste)) Business SIC classification: TOP, BODY, AND UPHOLSTERY REPAIR SHOPS AND PAINT SHOPS Alternative names: B.F. PIRRELLI S INC, B.F. PIRRELLI'S INC
BRYANT-WEBSTER ELEMENTARY SCHOOL (3635 QUIVAS ST in DENVER, CO)
AIR MINOR (AIRS/AFS) AIR MONITORING SITE (Airborne pollution emission tracking) (Geographic Names Information System) (National Center for Education Statistics) - STATE ID-1106 Business SIC classification: ELEMENTARY AND SECONDARY SCHOOLS Organizations: DENVER COUNTY 1 (SCHOOL DISTRICT)
Alternative names: BRYANT-WEBSTER SCHOOL, DENVER PUBLIC SCHOOLS, DPS BRYANT WEBSTER
HENSLEY BATTERY & ELECTRIC (2031 BRYANT ST in DENVER, CO)
STATE MASTER (Colorado database) - RCRAINFO-COD981549710, SQG (Resource Conservation and Recovery Act (tracking hazardous waste)) Organizations: HENSLEY BATTERY INC (CONTACT/OWNER)
HORACE MANN MIDDLE SCHOOL (4130 NAVAJO STREET in DENVER, CO)
(Geographic Names Information System) (National Center for Education Statistics) - STATE ID-4094 Organizations: DENVER COUNTY 1 (SCHOOL DISTRICT)
BROWN ELEMENTARY SCHOOL (2550 LOWELL BLVD in DENVER, CO)
(Geographic Names Information System) (National Center for Education Statistics) - STATE ID-1076 Organizations: DENVER COUNTY 1 (SCHOOL DISTRICT)
JESUS CENTER SCHOOL (3600 ZUNI STREET in DENVER, CO)
(Integrated Compliance Information System) - ICIS-08-1987-0072, FORMAL ENFORCEMENT ACTION COMPLIANCE ACTIVITY (Tracking inspections of insecticide, fungicide, and rodenticide, and toxic substances)
ACADEMIA ANA MARIE SANDOVAL (3655 WYANDOT STREET in DENVER, CO)
(National Center for Education Statistics) - STATE ID-6397 Organizations: DENVER COUNTY 1 (SCHOOL DISTRICT)
AMOCO GAS STA NO 5006 (2990 WEST 44TH AVENUE in DENVER, CO)
AIR MINOR (AIRS/AFS) CRITERIA AND HAZARDOUS AIR POLLUTANT INVENTORY (Inventory of air pollution sources) (Resource Conservation and Recovery Act (tracking hazardous waste)) Business SIC classification: GASOLINE SERVICE STATIONS Organizations: AMOCO OIL CO (CONTACT/OWNER)
Alternative names: AMOCO OIL 5006, AMOCO STATION NUMBER 5006
FRED N THOMAS CAREER EDUCATION CENTER (2650 ELIOT STREET in DENVER, CO)
(National Center for Education Statistics) - STATE ID-1319 Organizations: DENVER COUNTY 1 (SCHOOL DISTRICT)
D & G IRON WORKS (3845 LIPAN STREET in DENVER, CO)
AIR MINOR (AIRS/AFS) (Resource Conservation and Recovery Act (tracking hazardous waste)) Business SIC classification: TOP, BODY, AND UPHOLSTERY REPAIR SHOPS AND PAINT SHOPS Organizations: DONALD MEYER (CONTACT/OWNER)
Alternative names: DON'S TRUCK
K/P GRAPHICS, INC. (1515 W 47TH AVE in DENVER, CO)
AIR MINOR (AIRS/AFS) (Resource Conservation and Recovery Act (tracking hazardous waste)) Business SIC classification: COMMERCIAL PRINTING, LITHOGRAPHIC Organizations: JAMES KNAPP (CONTACT/OWNER)
Alternative names: KP GRAPHICS
ACTION LABEL CO (3800 JASON ST in DENVER, CO)
AIR MINOR (AIRS/AFS) Business SIC classification: COATED AND LAMINATED PAPER; COMMERCIAL PRINTING
HOSPITAL SHARED SERVICES (1890 W 32ND AVE in DENVER, CO)
AIR MINOR (AIRS/AFS) CRITERIA AND HAZARDOUS AIR POLLUTANT INVENTORY (Inventory of air pollution sources) Conditionally Exempt Small Quantity Generators, less than 100 kg/month of hazardous waste (Resource Conservation and Recovery Act (tracking hazardous waste)) - notification Business SIC classification: COMMERCIAL PRINTING, LITHOGRAPHIC Organizations: GROUP OF NON-PROFIT HOSPITALS. (CONTACT/OWNER)
Housing units lacking complete plumbing facilities: 0.4% Housing units lacking complete kitchen facilities: 1.0%
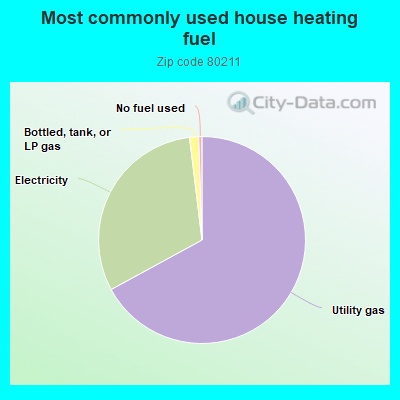
66.4%Utility gas
30.7%Electricity
1.4%Bottled, tank, or LP gas
0.5%No fuel used
Population in 1990: 34,679. Population change in the 1990s: +2,941 (+8.5%).
Place of birth for U.S.-born residents:
This state: 12,698
Northeast: 4,949
Midwest: 7,046
South: 4,063
West: 4,028
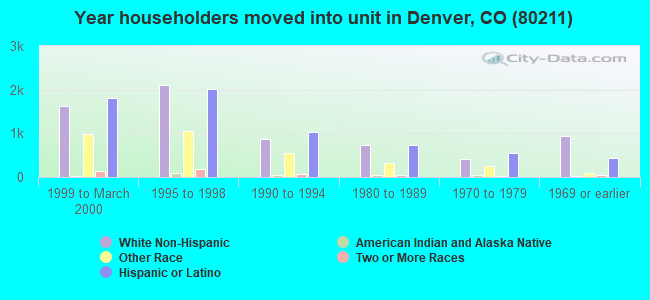
50% of the 80211 zip code residents lived in the same house 5 years ago. Out of people who lived in different houses, 57% lived in this county. Out of people who lived in different counties, 50% lived in Colorado.
75% of the 80211 zip code residents lived in the same house 1 year ago. Out of people who lived in different houses, 41% moved from this county. Out of people who lived in different houses, 25% moved from different county within same state. Out of people who lived in different houses, 30% moved from different state. Out of people who lived in different houses, 2% moved from abroad.
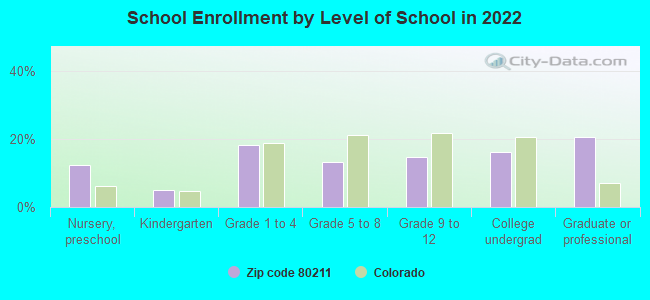
Private vs. public school enrollment:
Students in private schools in grades 1 to 8 (elementary and middle school): 128
Here:
8.5%
Colorado:
11.4%
Students in private schools in grades 9 to 12 (high school): 13
Here:
2.0%
Colorado:
8.5%
Students in private undergraduate colleges: 146
Here:
19.2%
Colorado:
14.0%
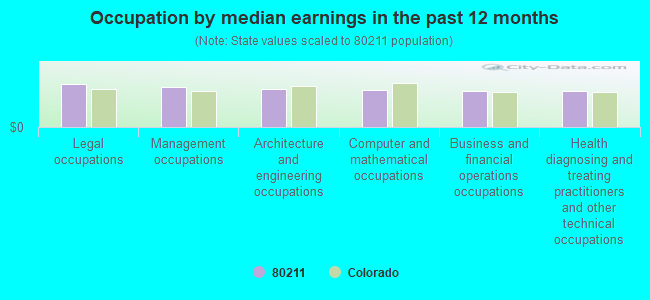
Occupation by median earnings in the past 12 months ($)
114,921Legal occupations
106,399Management occupations
100,161Architecture and engineering occupations
98,091Computer and mathematical occupations
94,945Business and financial operations occupations
94,561Health diagnosing and treating practitioners and other technical occupations
Companies with federal contracts located in this zip code (DENVER, CO):
CH2M HILL CORP (6060 S WILLOW DR)
$770,000 with Air Force for Other Architect and Engineering Services. Taking place in HI. Signed on 2000-02-14. Completion date: 2002-01-31.
MEDKEEPER, LLC (2727 BRYANT ST STE 250; small business) : $70,658 in 5 contractsfrom 2002 to 2005
Contracts for Other Medical -- Operational Systems Development (R&D), Maintenance, Repair and Rebuilding of Equipment -- Automatic Data Processing Equipment (Including Firmware), Software, Supplies and Support Equipment, Maintenance, Repair and Rebuilding of Equipment -- Food Preparation and Serving Equipment by National Institutes of Health, Army Signed by year:2000: $0; 2001: $0; 2002: $57,000; 2003: $6,668; 2004: $3,495; 2005: $3,495; 2006: $0.
Biggest contracts:
$57,000 with National Institutes of Health for Other Medical -- Operational Systems Development (R&D). Signed on 2002-09-15. Completion date: 2003-03-15.
$3,495 with Army for Maintenance, Repair and Rebuilding of Equipment -- Automatic Data Processing Equipment (Including Firmware), Software, Supplies and Support Equipment. Taking place in HI. Signed on 2005-11-07. Completion date: 2005-09-30.
$3,495, same as above.Signed on 2004-11-08. Completion date: 2005-09-30.
$3,495 with Army for Maintenance, Repair and Rebuilding of Equipment -- Food Preparation and Serving Equipment. Taking place in HI. Signed on 2003-11-21. Completion date: 2005-09-30.
SPACESAVER CONCEPTS, INC (2075 BRYANT STREET; small business) : $62,602 in 8 contractsfrom 2002 to 2005
Contracts for Relocation Services, Maintenance, Repair and Rebuilding of Equipment -- Instruments and Laboratory Equipment, Cabinets, Lockers, Bins, and Shelving, Maintenance, Repair and Rebuilding of Equipment -- Furniture by Air Force, Army, National Oceanic and Atmospheric Administration/Under Secretary for Oceans and Atmosphere Signed by year:2000: $0; 2001: $0; 2002: $4,499; 2003: $4,499; 2004: $54,110; 2005: -$506; 2006: $0.
Biggest contracts:
$53,479 with Air Force for Relocation Services. Signed on 2004-12-06. Completion date: 2005-02-01.
$4,499 with Army for Maintenance, Repair and Rebuilding of Equipment -- Instruments and Laboratory Equipment. Signed on 2003-10-20. Completion date: 2004-09-30.
$4,499 with Army for Cabinets, Lockers, Bins, and Shelving. Signed on 2002-12-04. Completion date: 2003-09-30.
$720 with National Oceanic and Atmospheric Administration/Under Secretary for Oceans and Atmosphere for Maintenance, Repair and Rebuilding of Equipment -- Furniture. Signed on 2004-08-21. Completion date: 2005-08-31.
GLYCOL SPECIALIST INC (4785 TEJON ST; small business)
$40,986 with Air Force for Aircraft Hydraulic, Vacuum, and De-icing System Components. Taking place in AK. Signed on 2000-08-03. Completion date: 2000-07-28.
RALPH'S INDUSTRIAL SEWING MACH (2030 CLAY ST; small business)
$4,455 with Army for Industrial Sewing Machines and Mobile Textile Repair Shops. Signed on 2005-06-09. Completion date: 2005-06-30.
S R INTERNATIONAL LOGISTICS IN (2525 16TH ST STE 208; small business) : $3,469 in 3 contractsfrom 2004 to 2005
$56,171 with Army for Miscellaneous Construction Materials. Signed on 2004-02-24. Completion date: 2004-03-22.
$3,469 with Army for Antennas, Waveguides, and Related Equipment. Signed on 2004-02-26. Completion date: 2004-03-18.
-$56,171 with Army for Miscellaneous Construction Materials. Signed on 2005-01-10. Completion date: 2004-03-22.
PROMISE KEEPERS (4045 PECOS STREET)
$3,000 with Army for Lease or Rental of Equipment -- Miscellaneous. Taking place in AZ. Signed on 2003-02-26. Completion date: 2003-02-20.
DENVER DAILY NEWS (2150 W 29TH AVE SUITE 135; small business)
$3,000 with Navy for Newspapers and Periodicals. Signed on 2003-10-24. Completion date: 2004-09-30.
ALLIANCE ELECTRONICS COLORADO, (2951 WYANDOT ST; small business)
$2,561 with Navy for Miscellaneous Communication Equipment. Signed on 2004-05-11. Completion date: 2004-08-03.
Top industries in this zip code by the number of employees in 2005:
2002 - 2018 National Fire Incident Reporting System (NFIRS) incidents
Based on the data from the years 2002 - 2018 the average number of fire incidents per year is 107. The highest number of reported fire incidents - 204 took place in 2003, and the least - 26 in 2018. The data has a decreasing trend.
When looking into fire subcategories, the most reports belonged to: Outside Fires (50.5%), and Structure Fires (26.8%).
Fire incident types reported to NFIRS in Zip Code 80211
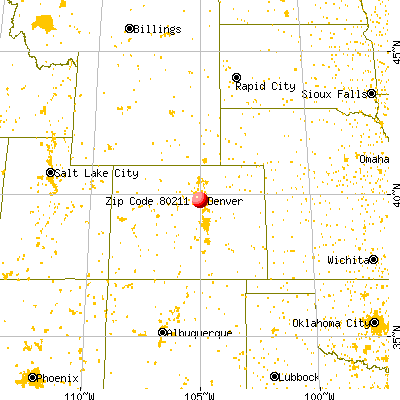


 Nearest zip codes: 80202, 80212, 80204, 80294, 80293, 80290.
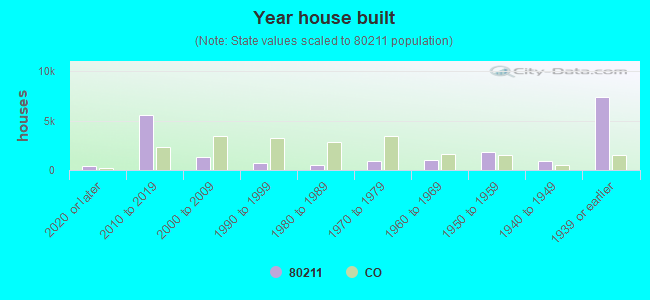


 Based on the data from the years 2002 - 2018 the average number of fire incidents per year is 107. The highest number of reported fire incidents - 204 took place in 2003, and the least - 26 in 2018. The data has a decreasing trend.
 When looking into fire subcategories, the most reports belonged to: Outside Fires (50.5%), and Structure Fires (26.8%).