Estimated zip code population in 2022: 20,662 Zip code population in 2010: 18,051 Zip code population in 2000: 18,843
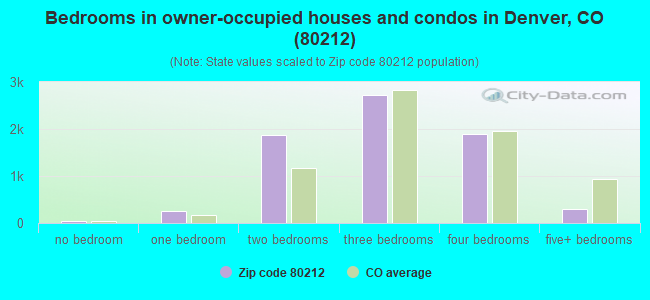
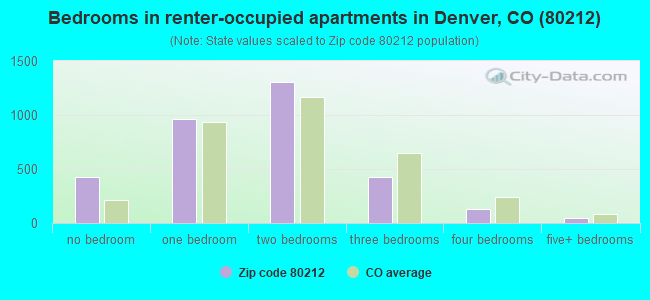
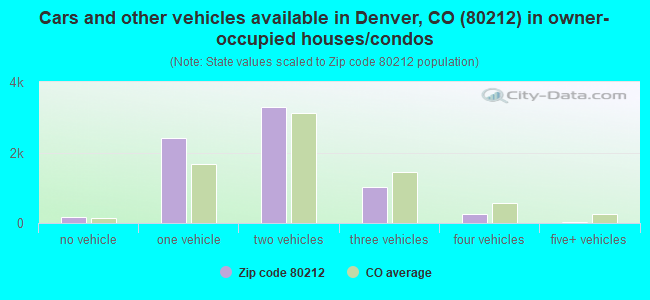
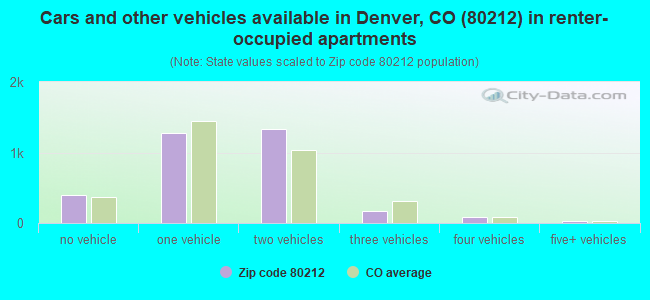
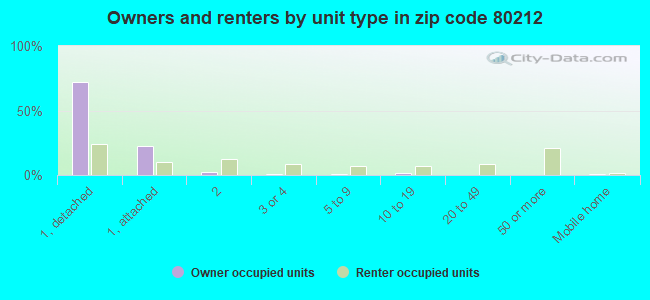
Houses and condos: 11,057 Renter-occupied apartments: 3,292
% of renters here:
32%
State:
34%
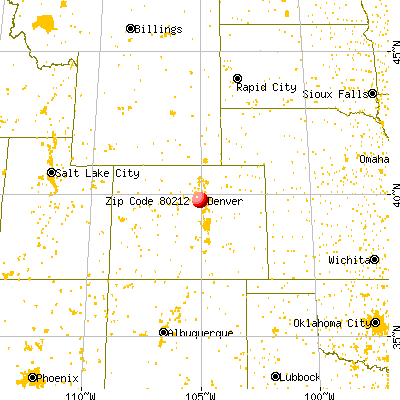
March 2022 cost of living index in zip code 80212: 109.9 (more than average, U.S. average is 100)
Land area: 3.6 sq. mi. Water area: 0.4 sq. mi.
Population density: 5,786 people per square mile
(average).
OSM Map
General Map
Google Map
MSN Map
OSM Map
General Map
Google Map
MSN Map
OSM Map
General Map
Google Map
MSN Map
OSM Map
General Map
Google Map
MSN Map
Please wait while loading the map...
Real estate property taxes paid for housing units in 2022:
This zip code:
0.4% ($2,910)
Colorado:
0.5% ($2,422)
Median real estate property taxes paid for housing units with mortgages in 2022: $2,976 (0.4%) Median real estate property taxes paid for housing units with no mortgage in 2022: $2,750 (0.4%)
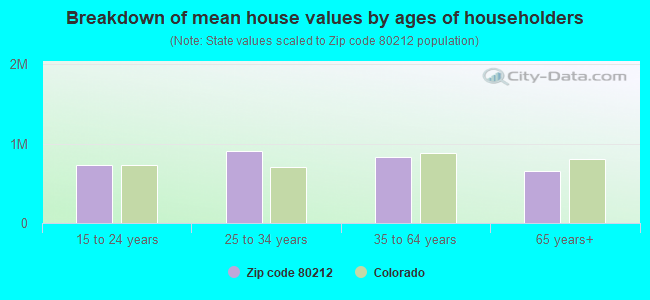
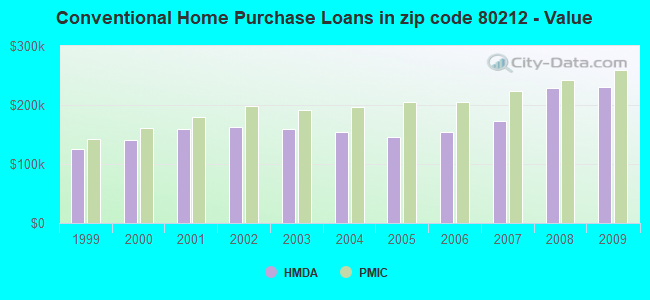
Estimated median house/condo value in 2022: $754,301
80212:
$754,301
Colorado:
$531,100
According to our research of Colorado and other state lists, there were 29 registered sex offenders living in 80212 zip code as of April 27, 2024. The ratio of all residents to sex offenders in zip code 80212 is 679 to 1. The ratio of registered sex offenders to all residents in this zip code is lower than the state average.
Median resident age:
This zip code:
38.2 years
Colorado median age:
37.7 years
Average household size:
This zip code:
2.0 people
Colorado:
2.4 people
Averages for the 2020 tax year for zip code 80212, filed in 2021:
Average Adjusted Gross Income (AGI) in 2020: $121,098 (Individual Income Tax Returns)
Here:
$121,098
State:
$89,260
Salary/wage: $100,328 (reported on 84.6% of returns)
Here:
$100,328
State:
$70,330
(% of AGI for various income ranges: 1117.3% for AGIs below $25k, 3697.2% for AGIs $25k-50k, 6907.3% for AGIs $50k-75k, 10455.9% for AGIs $75k-100k, 19966.5% for AGIs $100k-200k, 87192.0% for AGIs over 200k)
Taxable interest for individuals: $1,621 (reported on 39.3% of returns)
This zip code:
$1,621
Colorado:
$2,176
(% of AGI for various income ranges: 19.2% for AGIs below $25k, 18.6% for AGIs $25k-50k, 42.0% for AGIs $50k-75k, 59.6% for AGIs $75k-100k, 105.5% for AGIs $100k-200k, 808.6% for AGIs over 200k)
Ordinary dividends: $5,741 (reported on 34.8% of returns)
Here:
$5,741
State:
$8,820
(% of AGI for various income ranges: 43.3% for AGIs below $25k, 67.2% for AGIs $25k-50k, 112.7% for AGIs $50k-75k, 151.9% for AGIs $75k-100k, 334.1% for AGIs $100k-200k, 2651.4% for AGIs over 200k)
Net capital gain/loss in AGI: +$28,480 (reported on 32.5% of returns)
Here:
+$28,480
State:
+$37,276
(% of AGI for various income ranges: 27.9% for AGIs below $25k, 41.7% for AGIs $25k-50k, 146.7% for AGIs $50k-75k, 269.5% for AGIs $75k-100k, 858.3% for AGIs $100k-200k, 16838.6% for AGIs over 200k)
Profit/loss from business: +$20,821 (reported on 18.5% of returns)
Here:
+$20,821
State:
+$15,295
(% of AGI for various income ranges: 199.5% for AGIs below $25k, 247.4% for AGIs $25k-50k, 362.5% for AGIs $50k-75k, 458.6% for AGIs $75k-100k, 973.4% for AGIs $100k-200k, 3024.3% for AGIs over 200k)
Taxable individual retirement arrangement distribution: $19,464 (reported on 7.1% of returns)
80212:
$19,464
Colorado:
$23,785
(% of AGI for various income ranges: 53.6% for AGIs below $25k, 89.4% for AGIs $25k-50k, 150.5% for AGIs $50k-75k, 166.7% for AGIs $75k-100k, 410.5% for AGIs $100k-200k, 919.2% for AGIs over 200k)
Self-employed (Keogh) retirement plans: $22,541 (reported on 1.6% of returns)
80212:
$22,541
Colorado:
$23,633
(% of AGI for various income ranges: 31.6% for AGIs $50k-75k, 65.3% for AGIs $100k-200k, 522.2% for AGIs over 200k)
Total itemized deductions: $30,581 (reported on 20.1% of returns)
Here:
$30,581
State:
$35,141
(% of AGI for various income ranges: 80.4% for AGIs below $25k, 137.4% for AGIs $25k-50k, 341.3% for AGIs $50k-75k, 685.4% for AGIs $75k-100k, 1508.7% for AGIs $100k-200k, 7062.0% for AGIs over 200k)
Charity contributions: $7,025 (reported on 15.3% of returns)
Here:
$7,025
State:
$12,103
(% of AGI for various income ranges: 3.3% for AGIs below $25k, 9.8% for AGIs $25k-50k, 27.2% for AGIs $50k-75k, 54.6% for AGIs $75k-100k, 137.8% for AGIs $100k-200k, 1788.6% for AGIs over 200k)
Taxes paid: $8,278 (reported on 20.1% of returns)
80212:
$8,278
State:
$7,710
(% of AGI for various income ranges: 12.4% for AGIs below $25k, 24.8% for AGIs $25k-50k, 77.1% for AGIs $50k-75k, 201.3% for AGIs $75k-100k, 491.3% for AGIs $100k-200k, 1798.0% for AGIs over 200k)
Earned income credit: $1,711 (reported on 7.3% of returns)
Here:
$1,711
State:
$2,053
(% of AGI for various income ranges: 61.4% for AGIs below $25k, 28.0% for AGIs $25k-50k)
Percentage of individuals using paid preparers for their 2020 taxes: 93.6%
Here:
94%
State:
93%
(% for various income ranges: 89.2% for AGIs below $25k, 92.6% for AGIs $25k-50k, 94.3% for AGIs $50k-75k, 94.1% for AGIs $75k-100k, 95.7% for AGIs $100k-200k, 96.9% for AGIs over 200k)
Averages for the 2012 tax year for zip code 80212, filed in 2013:
Average Adjusted Gross Income (AGI) in 2012: $62,506 (Individual Income Tax Returns)
Here:
$62,506
State:
$69,103
Salary/wage: $57,781 (reported on 85.2% of returns)
Here:
$57,781
State:
$54,794
(% of AGI for various income ranges: 70.5% for AGIs below $25k, 81.7% for AGIs $25k-50k, 81.8% for AGIs $50k-75k, 82.6% for AGIs $75k-100k, 84.7% for AGIs $100k-200k, 65.2% for AGIs over 200k)
Taxable interest for individuals: $976 (reported on 34.6% of returns)
This zip code:
$976
Colorado:
$1,971
(% of AGI for various income ranges: 0.8% for AGIs below $25k, 0.4% for AGIs $25k-50k, 0.4% for AGIs $50k-75k, 0.5% for AGIs $75k-100k, 0.4% for AGIs $100k-200k, 0.8% for AGIs over 200k)
Ordinary dividends: $3,268 (reported on 23.9% of returns)
Here:
$3,268
State:
$7,140
(% of AGI for various income ranges: 1.9% for AGIs below $25k, 1.0% for AGIs $25k-50k, 1.0% for AGIs $50k-75k, 1.1% for AGIs $75k-100k, 1.0% for AGIs $100k-200k, 1.8% for AGIs over 200k)
Net capital gain/loss in AGI: +$9,056 (reported on 18.9% of returns)
Here:
+$9,056
State:
+$23,009
(% of AGI for various income ranges: 0.3% for AGIs $25k-50k, 0.5% for AGIs $50k-75k, 1.0% for AGIs $75k-100k, 1.7% for AGIs $100k-200k, 10.2% for AGIs over 200k)
Profit/loss from business: +$13,091 (reported on 18.5% of returns)
Here:
+$13,091
State:
+$13,514
(% of AGI for various income ranges: 11.5% for AGIs below $25k, 4.2% for AGIs $25k-50k, 3.4% for AGIs $50k-75k, 4.2% for AGIs $75k-100k, 3.1% for AGIs $100k-200k, 2.5% for AGIs over 200k)
Taxable individual retirement arrangement distribution: $12,169 (reported on 7.6% of returns)
80212:
$12,169
Colorado:
$17,927
(% of AGI for various income ranges: 3.1% for AGIs below $25k, 1.7% for AGIs $25k-50k, 1.8% for AGIs $50k-75k, 1.6% for AGIs $75k-100k, 1.2% for AGIs $100k-200k, 0.8% for AGIs over 200k)
Self-employment retirement plans: $13,918 (reported on 1.1% of returns)
80212:
$13,918
Colorado:
$19,483
(% of AGI for various income ranges: 0.4% for AGIs $50k-75k, 0.3% for AGIs $100k-200k, 0.6% for AGIs over 200k)
Total itemized deductions: $19,527 (19% of AGI, reported on 39.6% of returns)
Here:
$19,527
State:
$24,621
Here:
18.7% of AGI
State:
18.5% of AGI
(% of AGI for various income ranges: 10.6% for AGIs below $25k, 9.3% for AGIs $25k-50k, 13.6% for AGIs $50k-75k, 14.2% for AGIs $75k-100k, 13.9% for AGIs $100k-200k, 10.9% for AGIs over 200k)
Charity contributions: $2,356 (reported on 31.3% of returns)
Here:
$2,356
State:
$4,449
(% of AGI for various income ranges: 0.6% for AGIs below $25k, 0.7% for AGIs $25k-50k, 1.1% for AGIs $50k-75k, 1.2% for AGIs $75k-100k, 1.2% for AGIs $100k-200k, 1.8% for AGIs over 200k)
Taxes paid: $6,162 (reported on 39.5% of returns)
80212:
$6,162
State:
$7,641
(% of AGI for various income ranges: 1.6% for AGIs below $25k, 1.9% for AGIs $25k-50k, 3.3% for AGIs $50k-75k, 4.1% for AGIs $75k-100k, 4.9% for AGIs $100k-200k, 5.0% for AGIs over 200k)
Earned income credit: $1,750 (reported on 12.9% of returns)
Here:
$1,750
State:
$2,095
(% of AGI for various income ranges: 4.5% for AGIs below $25k, 0.6% for AGIs $25k-50k)
Percentage of individuals using paid preparers for their 2012 taxes: 46.5%
Here:
47%
State:
49%
(% for various income ranges: 43.6% for AGIs below $25k, 42.5% for AGIs $25k-50k, 45.7% for AGIs $50k-75k, 49.0% for AGIs $75k-100k, 51.1% for AGIs $100k-200k, 80.0% for AGIs over 200k)
Averages for the 2004 tax year for zip code 80212, filed in 2005:
Average Adjusted Gross Income (AGI) in 2004: $42,656 (Individual Income Tax Returns)
Here:
$42,656
State:
$55,014
Salary/wage: $40,465 (reported on 84.4% of returns)
Here:
$40,465
State:
$46,010
(% of AGI for various income ranges: 114.4% for AGIs below $10k, 73.6% for AGIs $10k-25k, 85.2% for AGIs $25k-50k, 86.2% for AGIs $50k-75k, 85.3% for AGIs $75k-100k, 67.0% for AGIs over 100k)
Taxable interest for individuals: $1,146 (reported on 44.2% of returns)
This zip code:
$1,146
Colorado:
$2,127
(% of AGI for various income ranges: 6.3% for AGIs below $10k, 2.4% for AGIs $10k-25k, 1.1% for AGIs $25k-50k, 0.9% for AGIs $50k-75k, 1.1% for AGIs $75k-100k, 0.9% for AGIs over 100k)
Taxable dividends: $1,902 (reported on 23.2% of returns)
Here:
$1,902
State:
$3,782
(% of AGI for various income ranges: 4.1% for AGIs below $10k, 1.9% for AGIs $10k-25k, 0.6% for AGIs $25k-50k, 0.8% for AGIs $50k-75k, 0.8% for AGIs $75k-100k, 1.3% for AGIs over 100k)
Net capital gain/loss: +$6,487 (reported on 18.1% of returns)
Here:
+$6,487
State:
+$17,882
(% of AGI for various income ranges: -3.6% for AGIs below $10k, 0.0% for AGIs $10k-25k, 0.4% for AGIs $25k-50k, 0.6% for AGIs $50k-75k, 1.9% for AGIs $75k-100k, 8.9% for AGIs over 100k)
Profit/loss from business: +$8,847 (reported on 16.4% of returns)
Here:
+$8,847
State:
+$11,247
(% of AGI for various income ranges: 14.3% for AGIs below $10k, 6.9% for AGIs $10k-25k, 2.9% for AGIs $25k-50k, 2.0% for AGIs $50k-75k, 3.0% for AGIs $75k-100k, 3.6% for AGIs over 100k)
IRA payment deduction: $2,444 (reported on 3.0% of returns)
80212:
$2,444
Colorado:
$2,947
(% of AGI for various income ranges: 0.7% for AGIs below $10k, 0.3% for AGIs $10k-25k, 0.2% for AGIs $25k-50k, 0.1% for AGIs $50k-75k, 0.1% for AGIs $75k-100k, 0.1% for AGIs over 100k)
Self-employed pension: $10,157 (reported on 0.8% of returns)
Here:
$10,157
Colorado:
$13,653
Total itemized deductions: $16,043 (24% of AGI, reported on 40.7% of returns)
Here:
$16,043
State:
$20,560
Here:
23.8% of AGI
State:
21.4% of AGI
(% of AGI for various income ranges: 27.9% for AGIs below $10k, 11.9% for AGIs $10k-25k, 14.2% for AGIs $25k-50k, 17.1% for AGIs $50k-75k, 16.8% for AGIs $75k-100k, 14.8% for AGIs over 100k)
Charity contributions deductions: $1,678 (2% of AGI, reported on 34.2% of returns)
Here:
$1,678
State:
$3,518
Here:
2.5% of AGI
State:
3.4% of AGI
(% of AGI for various income ranges: 1.0% for AGIs below $10k, 1.0% for AGIs $10k-25k, 1.1% for AGIs $25k-50k, 1.5% for AGIs $50k-75k, 1.6% for AGIs $75k-100k, 1.5% for AGIs over 100k)
Total tax: $5,933 (reported on 79.9% of returns)
80212:
$5,933
State:
$9,173
(% of AGI for various income ranges: 4.5% for AGIs below $10k, 4.8% for AGIs $10k-25k, 8.2% for AGIs $25k-50k, 10.6% for AGIs $50k-75k, 12.1% for AGIs $75k-100k, 16.6% for AGIs over 100k)
Earned income credit: $1,412 (reported on 12.9% of returns)
Here:
$1,412
State:
$1,595
Percentage of individuals using paid preparers for their 2004 taxes: 53.2%
Here:
53%
State:
55%
(% for various income ranges: 51.5% for AGIs below $10k, 56.0% for AGIs $10k-25k, 50.2% for AGIs $25k-50k, 53.0% for AGIs $50k-75k, 54.2% for AGIs $75k-100k, 60.5% for AGIs over 100k)
Likely homosexual households (counted as self-reported same-sex unmarried-partner households)
Lesbian couples: 0.2% of all households
Gay men: 0.5% of all households
Household received Food Stamps/SNAP in the past 12 months: 402 Household did not receive Food Stamps/SNAP in the past 12 months: 9,957
Women who had a birth in the past 12 months: 515 (421 now married, 94 unmarried) Women who did not have a birth in the past 12 months: 5,324 (2,258 now married, 3,069 unmarried)
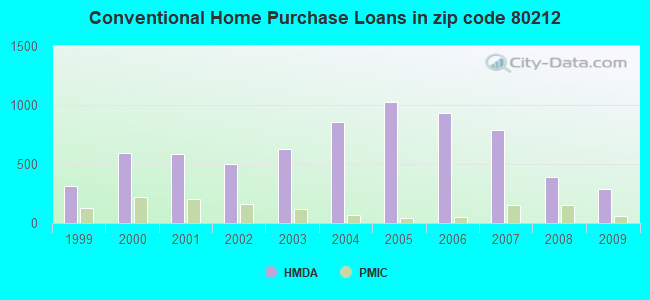
Housing units in zip code 80212 with a mortgage: 5,273 (720 second mortgage, 666 both second mortgage and home equity loan) Houses without a mortgage: 91
Median monthly owner costs for units with a mortgage: $2,487 Median monthly owner costs for units without a mortgage: $572
Residents with income below the poverty level in 2022:
This zip code:
10.1%
Whole state:
9.4%
Residents with income below 50% of the poverty level in 2022:
This zip code:
4.8%
Whole state:
4.6%
Median number of rooms in houses and condos:
Here:
6.3
State:
6.8
Median number of rooms in apartments:
Here:
3.8
State:
4.0
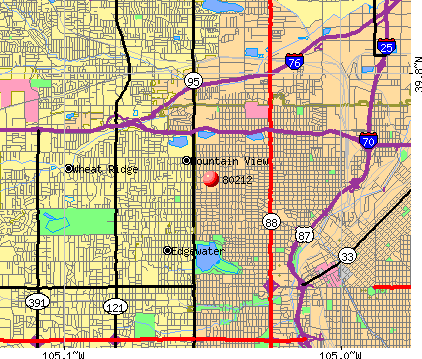
Notable locations in this zip code not listed on our city pages
Notable locations in zip code 80212: Willis Case Golf Course (A), Lakeside Amusement Park (B), Denver Public Library Smiley Branch (C), Jefferson County Public Library Wheat Ridge Branch (D), Mountain View Town Hall (E), The Oriental Theater (F), Lakeside Police Department (G), Lakeside Fire Department (H), Mountain View Police Department (I), Mountain View Municipal Court (J), El Jebel Shrine (K), Denver Fire Department Station 17 (L). Display/hide their locations on the map
Churches in zip code 80212 include: Berkeley United Methodist Church (A), Highlands United Methodist Church (B), Holy Family Catholic Church (C), Church of the Resurrection (D), Berkeley Baptist Church (E), Church of Jesus Christ of Latter - Day Saints (F), Park View Bible Baptist Church (G), Sloan's Lake Community Church (H), Saint Mary Magdalene Catholic Church (I). Display/hide their locations on the map
Parks in zip code 80212 include: Lake Side Amusement Park (1), Berkeley Park (2), Tennyson Park (3), Randall Park (4), Pferdsteller Park (5), Panorama Park (6), Sloans Lake Park (7). Display/hide their locations on the map
Tourist attractions (not listed on the city page) : Lakeside Catering CO (Amusement & Theme Parks; 4601 Sheridan Boulevard), Royal Bell Limited (5815 West 52nd Avenue).
2,405 married couples with children.
727 single-parent households (327 men, 400 women).
87.4% of residents of 80212 zip code speak English at home.
7.7% of residents speak Spanish at home (91% very well, 8% well, 2% not well).
2.0% of residents speak other Indo-European language at home (62% very well, 38% well).
2.8% of residents speak Asian or Pacific Island language at home (45% very well, 11% well, 44% not well).
0.3% of residents speak other language at home (85% very well, 15% well).
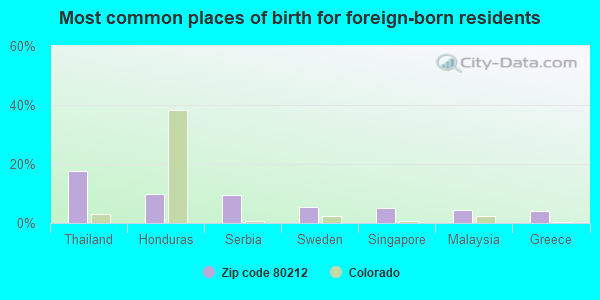
Foreign born population: 1,272 (6.2%) (62.6% of them are naturalized citizens)
This zip code:
6.2%
Whole state:
9.5%
18%Thailand
10%Honduras
10%Serbia
5%Sweden
5%Singapore
5%Malaysia
4%Greece
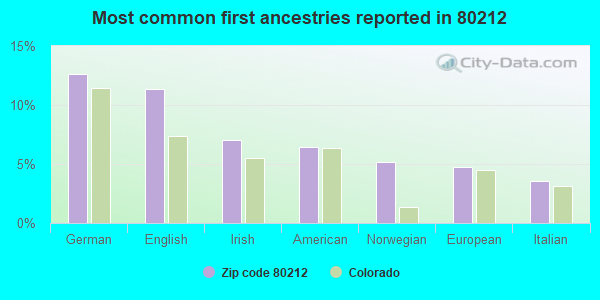
13%German
11%English
7%Irish
6%American
5%Norwegian
5%European
4%Italian
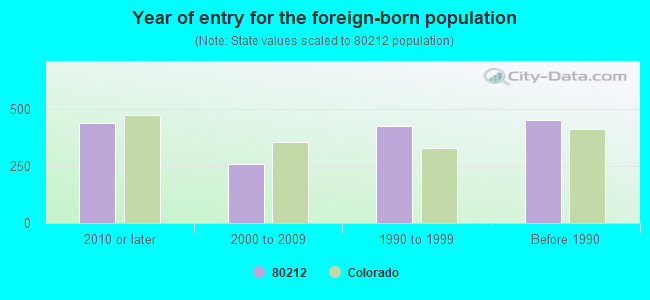
Year of entry for the foreign-born population
4382010 or later
2582000 to 2009
4271990 to 1999
455Before 1990
Major facilities with environmental interests located in this zip code:
CAROUSEL CLNRS (4040 W 38TH AVE in DENVER, CO)
AIR MINOR (AIRS/AFS) STATE MASTER (Colorado database) - RCRAINFO-COD013827639, SQG CRITERIA AND HAZARDOUS AIR POLLUTANT INVENTORY (Inventory of air pollution sources) Conditionally Exempt Small Quantity Generators, less than 100 kg/month of hazardous waste (Resource Conservation and Recovery Act (tracking hazardous waste)) Business SIC classification: DRYCLEANING PLANTS, EXCEPT RUG CLEANING Business NAICS classification: DRYCLEANING AND LAUNDRY SERVICES (EXCEPT COIN-OPERATED). Organizations: CAROUSAL CLEANERS (CONTACT/OPERATOR)
, C MILLER (CONTACT/OWNER)
, CHARLES MILLER (CONTACT/OWNER)
Alternative names: CAROUSEL CLEANERS
CENTENNIAL ELEMENTARY SCHOOL (4665 RALEIGH STREET in DENVER, CO)
(National Center for Education Statistics) - STATE ID-1400 Organizations: DENVER COUNTY 1 (SCHOOL DISTRICT)
FURNITURE FACTORY (4206 W 38TH AVE in DENVER, CO)
AIR MINOR (AIRS/AFS) (Resource Conservation and Recovery Act (tracking hazardous waste)) Business SIC classification: REUPHOLSTERY AND FURNITURE REPAIR
BEST VALUE TIRES INC (5990 W 44TH AVE in DENVER, CO)
(Resource Conservation and Recovery Act (tracking hazardous waste))
BRITE SPOT LAUNDRY DRY CLEANERS (4412 W 39TH AVE in DENVER, CO)
(Resource Conservation and Recovery Act (tracking hazardous waste)) Organizations: JAN APPLEHAUS (CONTACT/OWNER)
HUD CLEANUP ENVIRONET INC (3763 OSCEOLA ST in DENVER, CO)
(Resource Conservation and Recovery Act (tracking hazardous waste))
HUD CLEANUP MDR CORPORATION (4840 CHASE ST in DENVER, CO)
(Resource Conservation and Recovery Act (tracking hazardous waste))
BLACKTOP PAVING DELETED 9/15/78 (5965 W 52ND AVE in DENVER AREA, CO)
AIR MINOR (AIRS/AFS) Business SIC classification: ASPHALT PAVING MIXTURES AND BLOCKS
C KING PEST CONTROL (6905 W COLFAX in DENVER, CO)
(Resource Conservation and Recovery Act (tracking hazardous waste))
CSX CORPORATION OF COLORADO (5380 TENNYSON in DENVER, CO)
(Resource Conservation and Recovery Act (tracking hazardous waste))
JC TRUCKING INC (5085 HARLAN ST in DENVER, CO)
(Resource Conservation and Recovery Act (tracking hazardous waste))
CHEM MARK OF DENVER (4022 TENNYSON STREET in DENVER, CO)
COMPLIANCE ACTIVITY (Tracking inspections of insecticide, fungicide, and rodenticide, and toxic substances)
GODDARD APARTMENTS (3735 AMES STREET in WHEAT RIDGE, CO)
ENFORCEMENT/COMPLIANCE ACTIVITY (Integrated Compliance Information System) COMPLIANCE ACTIVITY (Tracking inspections of insecticide, fungicide, and rodenticide, and toxic substances)
Housing units lacking complete plumbing facilities: 0.6% Housing units lacking complete kitchen facilities: 2.6%
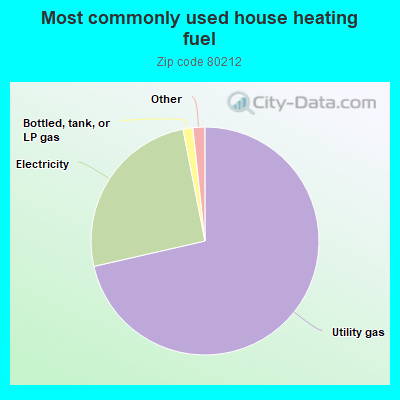
71.5%Utility gas
25.5%Electricity
1.4%Bottled, tank, or LP gas
0.7%Other fuel
0.6%No fuel used
Population in 1990: 17,745. Population change in the 1990s: +1,098 (+6.2%).
Place of birth for U.S.-born residents:
This state: 8,116
Northeast: 1,989
Midwest: 3,818
South: 2,097
West: 3,062
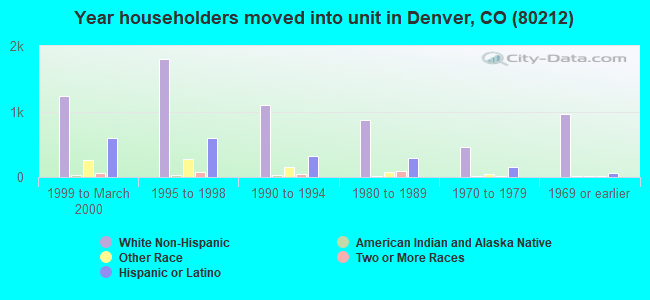
51% of the 80212 zip code residents lived in the same house 5 years ago. Out of people who lived in different houses, 43% lived in this county. Out of people who lived in different counties, 50% lived in Colorado.
84% of the 80212 zip code residents lived in the same house 1 year ago. Out of people who lived in different houses, 38% moved from this county. Out of people who lived in different houses, 35% moved from different county within same state. Out of people who lived in different houses, 25% moved from different state. Out of people who lived in different houses, 1% moved from abroad.
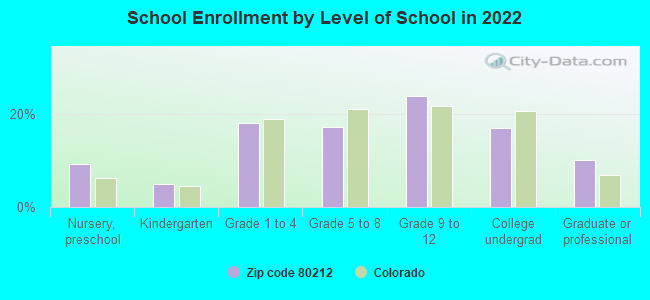
Private vs. public school enrollment:
Students in private schools in grades 1 to 8 (elementary and middle school): 97
Here:
8.7%
Colorado:
11.4%
Students in private schools in grades 9 to 12 (high school): 47
Here:
6.3%
Colorado:
8.5%
Students in private undergraduate colleges: 236
Here:
43.8%
Colorado:
14.0%
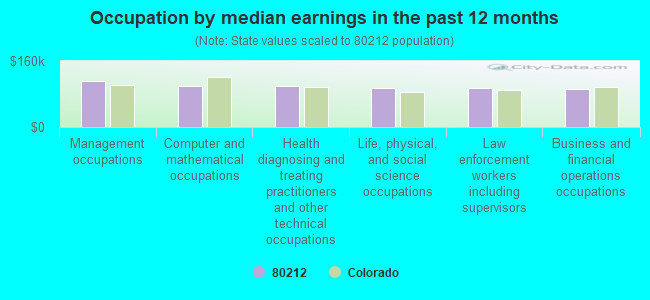
Occupation by median earnings in the past 12 months ($)
111,327Management occupations
100,511Computer and mathematical occupations
98,694Health diagnosing and treating practitioners and other technical occupations
94,158Life, physical, and social science occupations
93,489Law enforcement workers including supervisors
90,958Business and financial operations occupations
Companies with federal contracts located in this zip code:
LT ENVIRONMENTAL, INC (4400 WEST 46TH AVE in DENVER, CO; small business)
$5,000 with Air Force for Architect - Engineer Services (including landscaping, interior layout, and designing). Signed on 2001-09-28. Completion date: 2001-11-28.
COLORADO SECURITY PRODUCTS (3929 TENNYSON ST in DENVER, CO; small business)
$265 with Navy for Miscellaneous Alarm, Signal and Security Detection Systems. Signed on 2003-07-31. Completion date: 2003-07-31.
Top industries in this zip code by the number of employees in 2005:
Health Care and Social Assistance: Services for the Elderly and Persons with Disabilities (250-499 employees: 1 establishment, 100-249 employees: 1 establishment)
Construction: Poured Concrete Foundation and Structure Contractors (250-499: 1, 5-9: 1)
2002 - 2018 National Fire Incident Reporting System (NFIRS) incidents
Based on the data from the years 2002 - 2018 the average number of fire incidents per year is 38. The highest number of reported fire incidents - 65 took place in 2005, and the least - 25 in 2015. The data has a decreasing trend.
When looking into fire subcategories, the most reports belonged to: Outside Fires (50.8%), and Structure Fires (27.0%).
Fire incident types reported to NFIRS in Zip Code 80212


 Nearest zip codes: 80211, 80214, 80204, 80202, 80033, 80003.


 Based on the data from the years 2002 - 2018 the average number of fire incidents per year is 38. The highest number of reported fire incidents - 65 took place in 2005, and the least - 25 in 2015. The data has a decreasing trend.
 When looking into fire subcategories, the most reports belonged to: Outside Fires (50.8%), and Structure Fires (27.0%).