Downtown Livonia (Livonia Civic Center) neighborhood in Livonia, Michigan (MI), 48154 detailed profile
Settings
X

Business Search - 14 Million verified businesses
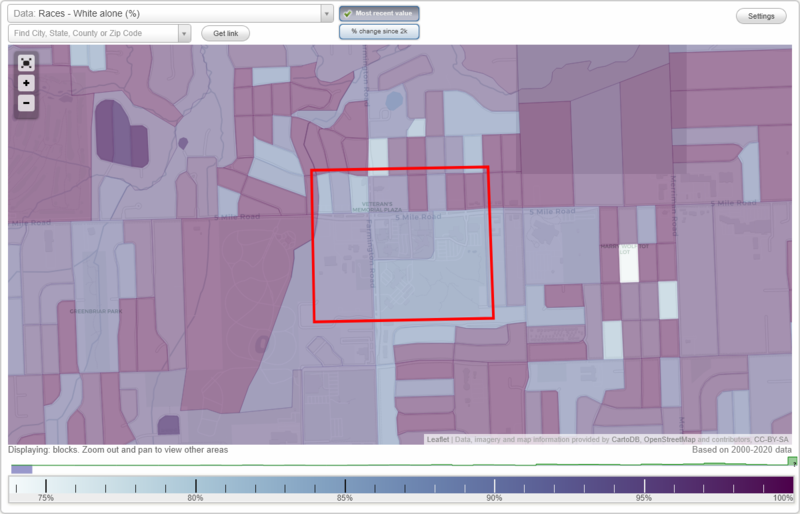
Area: 0.291 square miles
Population: 821
Population density:
| Downtown Livonia (Livonia Civic Center): | 2,824 people per square mile |
| Livonia: | 2,626 people per square mile |

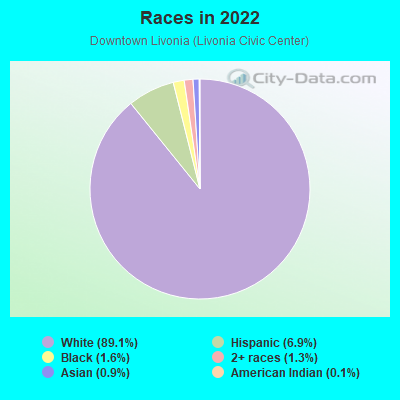
- 79689.1%White
- 626.9%Hispanic or Latino
- 141.6%Black
- 121.3%Two or more races
- 80.9%Asian
- 10.1%American Indian
Median household income in 2022:
| Downtown Livonia (Livonia Civic Center): | $103,645 |
| Livonia: | $92,125 |
Distribution of median household income
![Distribution of median household income]()
- 4Less than $10,000
- 45$10,000 to $19,999
- 18$20,000 to $29,999
- 26$30,000 to $39,999
- 47$40,000 to $49,999
- 18$50,000 to $59,999
- 76$60,000 to $74,999
- 87$75,000 to $99,999
- 53$100,000 to $124,999
- 33$125,000 to $149,999
- 30$150,000 to $199,999
- 26$200,000 or more

Distribution of owner-occupied house/condo value
![Distribution of owner-occupied house/condo value]()
- 32$50,000 to $99,999
- 66$100,000 to $149,999
- 22$150,000 to $199,999
- 37$200,000 to $249,999
- 126$250,000 to $299,999
- 85$300,000 to $399,999
- 35$400,000 to $499,999
- 7$500,000 to $749,999

Distribution of rent paid by renters
![Distribution of rent paid by renters]()
- 2$600 to $699
- 3$700 to $799
- 26$900 to $999
- 23$1,000 to $1,249
- 20$1,250 to $1,499
- 4$1,500 to $1,999

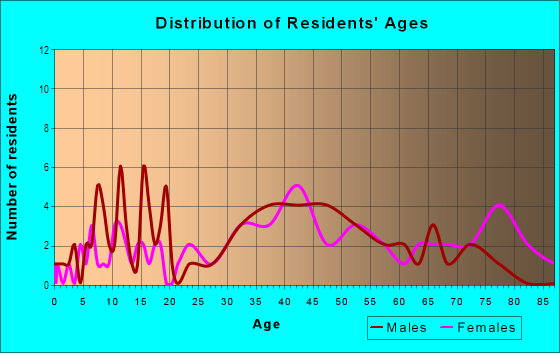
| Males: | 344 |
| Females: | 476 |
Males:
| This neighborhood: | 51.4 years |
| Whole city: | 42.2 years |
| This neighborhood: | 45.0 years |
| Whole city: | 46.5 years |
Average household size:
| Downtown Livonia (Livonia Civic Center): | 2.3 people |
| Livonia: | 2.4 people |
Percentage of family households:
| Downtown Livonia (Livonia Civic Center): | 31.5% |
| Livonia: | 44.1% |
| Here: | 39.9% |
| Livonia: | 50.1% |
Percentage of married-couple families with children (among all households):
| Downtown Livonia (Livonia Civic Center): | 23.4% |
| Livonia: | 33.5% |
Percentage of single-mother households (among all households):
| Downtown Livonia (Livonia Civic Center): | 5.6% |
| Livonia: | 6.6% |
Percentage of never married males 15 years old and over:
Percentage of never married females 15 years old and over:
| Downtown Livonia (Livonia Civic Center): | 10.4% |
| Livonia: | 16.7% |
Percentage of never married females 15 years old and over:
| Downtown Livonia (Livonia Civic Center): | 17.6% |
| city: | 12.0% |
Percentage of people that speak English not well or not at all:
| Downtown Livonia (Livonia Civic Center): | 0.4% |
| Livonia: | 1.4% |
Percentage of people born in this state:
Percentage of people born in another U.S. state:
Percentage of native residents but born outside the U.S.:
Percentage of foreign born residents:
| Here: | 81.9% |
| Livonia: | 78.1% |
Percentage of people born in another U.S. state:
| Downtown Livonia (Livonia Civic Center): | 11.3% |
| Livonia: | 13.0% |
Percentage of native residents but born outside the U.S.:
| Here: | 2.9% |
| city: | 0.4% |
Percentage of foreign born residents:
| Here: | 5.0% |
| Livonia: | 8.4% |
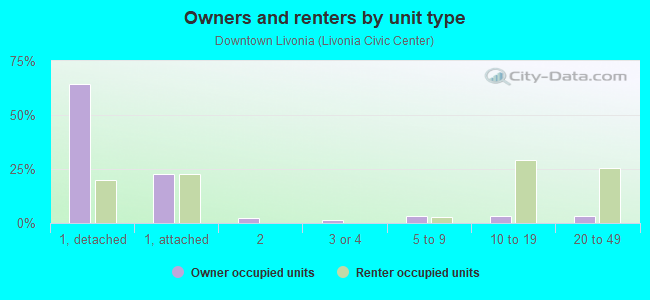
Owner-occupied
Renter-occupied

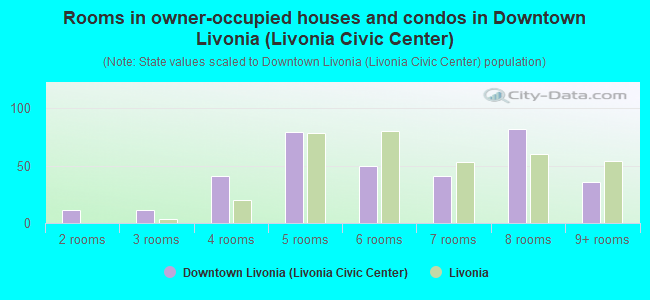
- Rooms in owner-occupied houses and condos in Downtown Livonia <
> - 01 room
- 112 rooms
- 113 rooms
- 414 rooms
- 795 rooms
- 506 rooms
- 417 rooms
- 828 rooms
- 369+ rooms
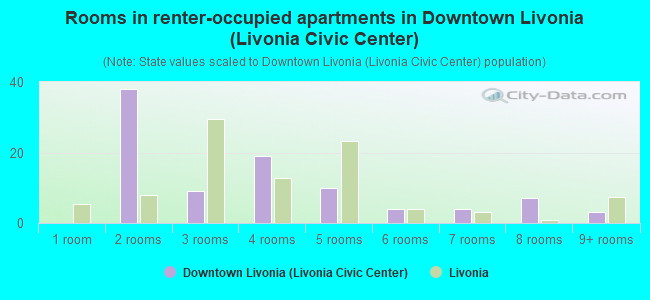
- Rooms in renter-occupied apartments in Downtown Livonia <
> - 01 room
- 382 rooms
- 93 rooms
- 194 rooms
- 105 rooms
- 46 rooms
- 47 rooms
- 78 rooms
- 39+ rooms
Owner-occupied
Renter-occupied
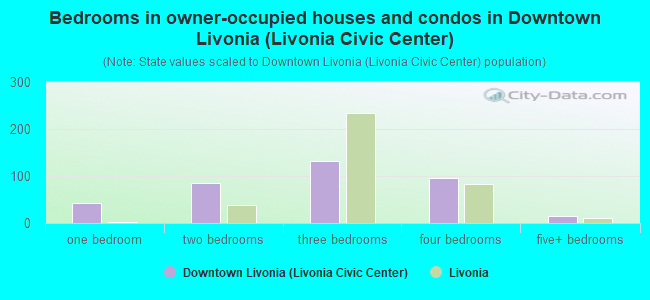
- Bedrooms in owner-occupied houses and condos in Downtown Livonia <
> - 1no bedroom
- 421 bedroom
- 852 bedrooms
- 1323 bedrooms
- 964 bedrooms
- 155+ bedrooms
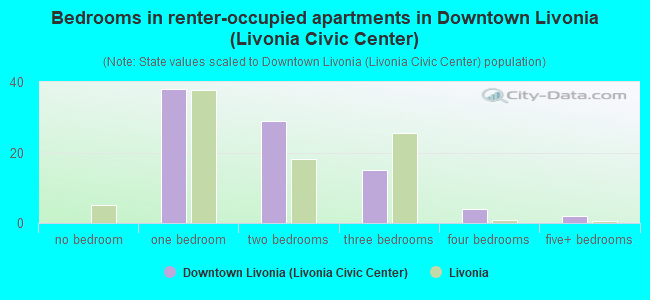
- Bedrooms in renter-occupied apartments in Downtown Livonia <
> - 0no bedroom
- 381 bedroom
- 292 bedrooms
- 153 bedrooms
- 44 bedrooms
- 25+ bedrooms
Average number of cars or other vehicles available in houses/condos:
Average number of cars or other vehicles available in apartments:
| This neighborhood: | 1.8 |
| Livonia: | 2.0 |
Average number of cars or other vehicles available in apartments:
| Here: | |
| city: |
Percentage of units with a mortgage:
| Downtown Livonia (Livonia Civic Center): | 63.9% |
| Livonia: | 60.8% |
Average estimated value of detached houses in 2022 (60.0% of all units):
| Downtown Livonia (Livonia Civic Center): | $302,945 |
| Livonia: | $291,361 |
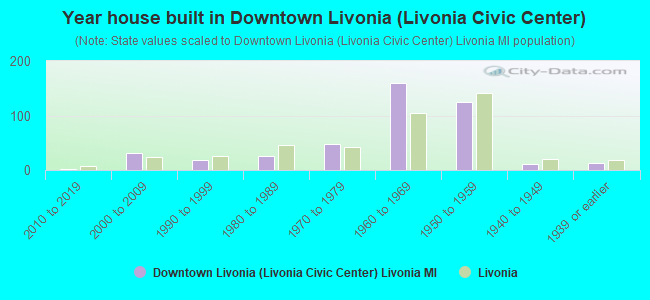
- Year house built in Downtown Livonia <
> - 02020 or later
- 22010 to 2019
- 312000 to 2009
- 191990 to 1999
- 251980 to 1989
- 471970 to 1979
- 1591960 to 1969
- 1251950 to 1959
- 111940 to 1949
- 121939 or earlier
City-data.com crime index for city in 2020 (higher means more crime):
| City: | 122.1 |
| U.S. average: | 219.5 |
Travel time to work (commute)
![Travel time to work (commute)]()
- 12Less than 5 minutes
- 515 to 9 minutes
- 7310 to 14 minutes
- 9015 to 19 minutes
- 5020 to 24 minutes
- 5725 to 29 minutes
- 6230 to 34 minutes
- 2235 to 39 minutes
- 1640 to 44 minutes
- 3645 to 59 minutes
- 860 to 89 minutes
- 390 or more minutes

Means of transportation to work
![Means of transportation to work]()
- 70.3%275Drove a car alone
- 7.7%30Carpooled
- 2.0%8Bus
- 0.5%2Walked
- 1.0%4Other means
- 20.0%78Worked at home

Time leaving home to go to work
![Time leaving home to go to work]()
- 2112:00 a.m. to 4:59 a.m.
- 75:00 a.m. to 5:29 a.m.
- 195:30 a.m. to 5:59 a.m.
- 256:00 a.m. to 6:29 a.m.
- 406:30 a.m. to 6:59 a.m.
- 757:00 a.m. to 7:29 a.m.
- 807:30 a.m. to 7:59 a.m.
- 478:00 a.m. to 8:29 a.m.
- 278:30 a.m. to 8:59 a.m.
- 339:00 a.m. to 9:59 a.m.
- 1010:00 a.m. to 10:59 a.m.
- 411:00 a.m. to 11:59 a.m.
- 3112:00 p.m. to 3:59 p.m.
- 344:00 p.m. to 11:59 p.m.

Occupations of males:
- Percentage of males in management occupations (except farmers):
Here: 8.1% city: 12.8%
- Percentage of males in business and financial operations occupations:
Here: 5.6% city: 6.2%
- Percentage of males in computer and mathematical occupations:
Here: 2.8% city: 6.7%
- Percentage of males in architecture and engineering occupations:
Here: 1.3% city: 8.4%
- Percentage of males in community and social services occupations:
Here: 2.2% city: 1.0%
- Percentage of males in education, training, and library occupations:
Here: 5.1% city: 3.2%
- Percentage of males in arts, design, entertainment, sports, and media occupations:
Here: 5.3% city: 2.5%
- Percentage of males in healthcare practitioners and technical occupations:
Here: 9.9% city: 2.3%
- Percentage of males in service occupations:
Here: 5.2% city: 11.5%
- Percentage of males in sales and office occupations:
Here: 19.8% city: 15.7%
- Percentage of males in construction, extraction, and maintenance occupations:
Here: 15.2% city: 7.2%
- Percentage of males in production occupations:
Here: 5.0% city: 8.0%
- Percentage of males in transportation occupations:
Here: 5.3% city: 4.8%
- Percentage of males in material moving occupations:
Here: 4.7% city: 3.4%
Occupations of females:
- Percentage of females in management occupations (except farmers):
Here: 8.2% city: 11.2%
- Percentage of females in business and financial operations occupations:
Here: 12.8% city: 7.4%
- Percentage of females in computer and mathematical occupations:
Here: 1.5% city: 2.4%
- Percentage of females in architecture and engineering occupations:
Here: 1.3% city: 2.2%
- Percentage of females in life, physical, and social science occupations:
Here: 1.8% city: 0.9%
- Percentage of females in community and social services occupations:
Here: 3.8% city: 2.5%
- Percentage of females in healthcare practitioners and technical occupations:
Here: 32.6% city: 12.3%
- Percentage of females in service occupations:
Here: 17.6% city: 14.3%
- Percentage of females in sales and office occupations:
Here: 12.8% city: 29.2%
- Percentage of females in transportation occupations:
Here: 4.8% city: 0.9%
- Percentage of females in material moving occupations:
Here: 3.4% city: 1.1%
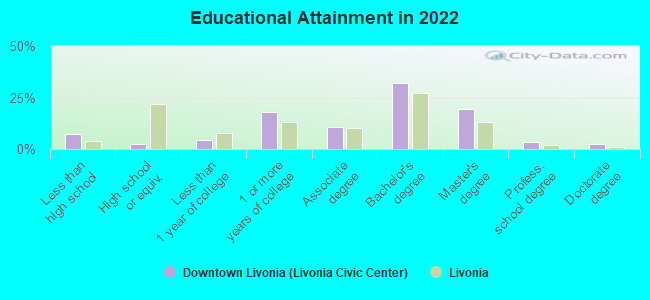
Education in this neighborhood (subdivision or community):
- Percentage of people 3 years and older in K-12 schools:
Downtown Livonia (Livonia Civic Center): 22.6% Livonia: 13.6%
- Percentage of people 3 years and older in undergraduate colleges:
Downtown Livonia (Livonia Civic Center): 6.0% Livonia: 4.0%
- Percentage of people 3 years and older in grad. or professional schools:
Downtown Livonia (Livonia Civic Center): 2.4% Livonia: 1.7%
- Percentage of students K-12 enrolled in private schools:
Downtown Livonia (Livonia Civic Center): 30.9% Livonia: 13.5%
Percentage of population below poverty level:
| Downtown Livonia (Livonia Civic Center): | 4.2% |
| Livonia: | 4.6% |
Median year owner moved in (as recorded in 2022):
| Downtown Livonia (Livonia Civic Center): | 2006 |
| Livonia: | 2008 |
Percentage of married-couple families with both working:
| Downtown Livonia (Livonia Civic Center): | 134.6% |
| Livonia: | 74.3% |
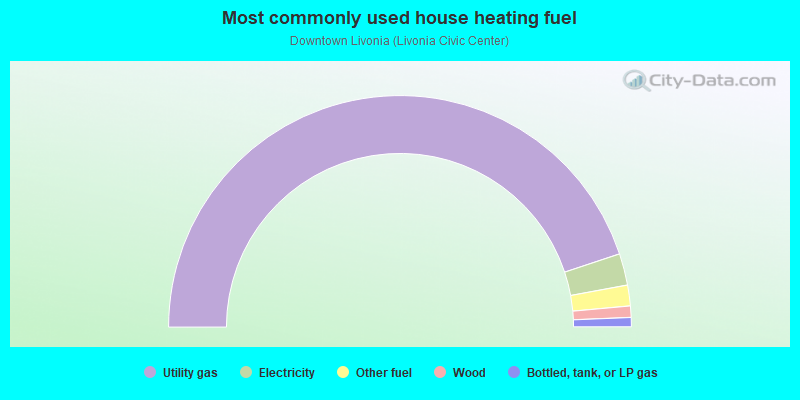
- 89.7%Utility gas
- 4.4%Electricity
- 2.9%Other fuel
- 1.6%Wood
- 1.3%Bottled, tank, or LP gas
Roads and streets:
5 Mile Rd
Length: 1.48 miles
Direction: E-W
Direction: E-W
Farmington Rd
Length: 0.75 miles
Direction: N-S
Address range: 14665 to 15499
Direction: N-S
Address range: 14665 to 15499
Roycroft (Roycroft St)
Length: 0.74 miles
Direction: E-W
Address range: 32700 to 33749
Direction: E-W
Address range: 32700 to 33749
Brookfield St
Length: 0.44 miles
Direction: N-S
Address range: 14801 to 15499
Direction: N-S
Address range: 14801 to 15499
Civic Center Dr
Length: 0.38 miles
Directions: E-W, N-S, SW-NE
Directions: E-W, N-S, SW-NE
Library Dr
Length: 0.24 miles
Directions: E-W, N-S, SE-NW, SW-NE
Directions: E-W, N-S, SE-NW, SW-NE
Jamison St
Length: 0.17 miles
Direction: E-W
Direction: E-W
Edington St
Length: 0.15 miles
Direction: N-S
Address range: 15200 to 15499
Direction: N-S
Address range: 15200 to 15499
Shadyside St
Length: 0.14 miles
Direction: N-S
Direction: N-S
Shadyside
Length: 0.14 miles
Direction: N-S
Address range: 15200 to 15499
Direction: N-S
Address range: 15200 to 15499
Surrey St
Length: 0.13 miles
Direction: N-S
Address range: 15300 to 15599
Direction: N-S
Address range: 15300 to 15599
Loveland (Loveland St)
Length: 0.12 miles
Direction: N-S
Address range: 15300 to 15499
Direction: N-S
Address range: 15300 to 15499
Woodring (Woodring St)
Length: 0.12 miles
Direction: N-S
Address range: 15300 to 15471
Direction: N-S
Address range: 15300 to 15471
Mayfield St (Mayfield)
Length: 0.12 miles
Direction: N-S
Address range: 15300 to 15499
Direction: N-S
Address range: 15300 to 15499
Westmore Ave
Length: 0.06 miles
Direction: N-S
Direction: N-S
Westmore (Westmore St)
Length: 0.06 miles
Directions: E-W, N-S, SW-NE
Address range: 15300 to 15499
Directions: E-W, N-S, SW-NE
Address range: 15300 to 15499
Luther Ln
Length: 0.05 miles
Direction: E-W
Address range: 330 to 33699
Direction: E-W
Address range: 330 to 33699
Meadowbrook St
Length: 0.04 miles
Direction: E-W
Address range: 32700 to 32799
Direction: E-W
Address range: 32700 to 32799
Other features:
Barlow Drn
Length: 0.14 miles
Direction: N-S
Direction: N-S