Estimated zip code population in 2022: 37,178 Zip code population in 2010: 38,642 Zip code population in 2000: 40,556
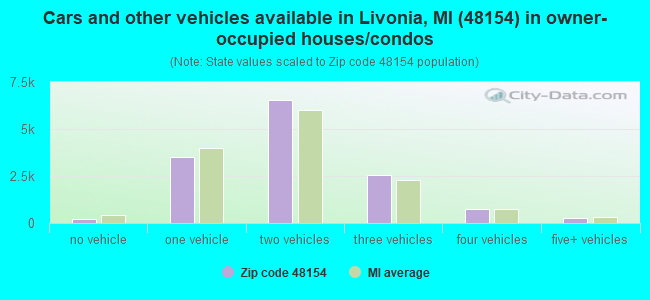
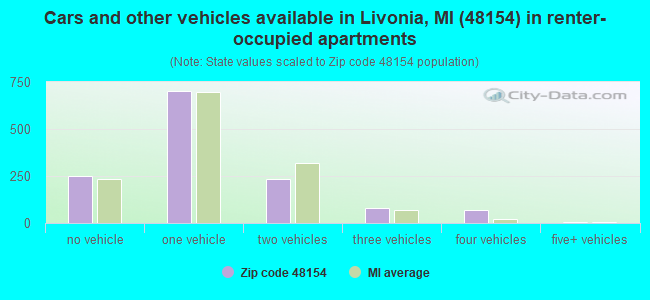
Houses and condos: 15,430 Renter-occupied apartments: 1,338
% of renters here:
9%
State:
27%
March 2022 cost of living index in zip code 48154: 96.4 (near average, U.S. average is 100)
Land area: 11.6 sq. mi. Water area: 0.0 sq. mi.
Population density: 3,201 people per square mile
(average).
OSM Map
General Map
Google Map
MSN Map
OSM Map
General Map
Google Map
MSN Map
OSM Map
General Map
Google Map
MSN Map
OSM Map
General Map
Google Map
MSN Map
Please wait while loading the map...
Real estate property taxes paid for housing units in 2022:
This zip code:
1.3% ($3,945)
Michigan:
1.2% ($2,746)
Median real estate property taxes paid for housing units with mortgages in 2022: $4,048 (1.3%) Median real estate property taxes paid for housing units with no mortgage in 2022: $3,832 (1.3%)
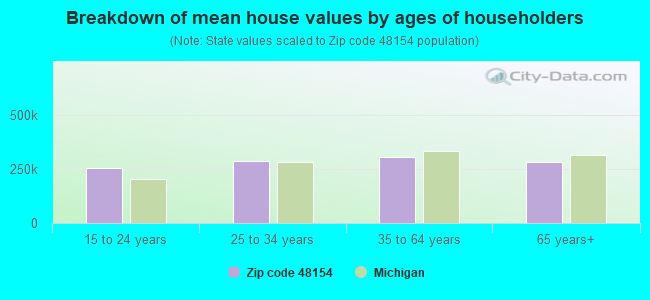
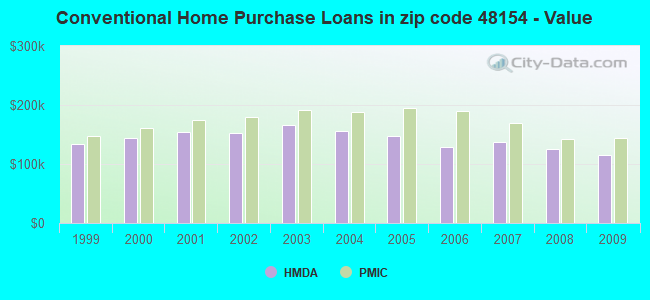
Estimated median house/condo value in 2022: $302,287
48154:
$302,287
Michigan:
$224,400
According to our research of Michigan and other state lists, there were 21 registered sex offenders living in 48154 zip code as of April 27, 2024. The ratio of all residents to sex offenders in zip code 48154 is 1,824 to 1. The ratio of registered sex offenders to all residents in this zip code is much lower than the state average.
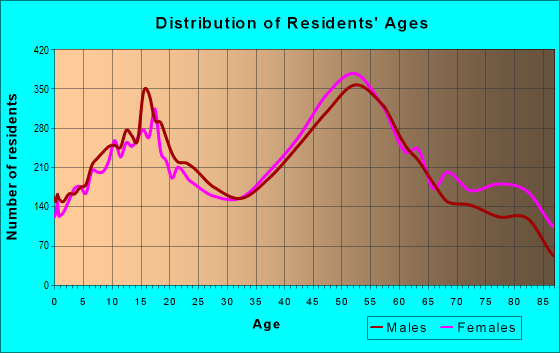
Median resident age:
This zip code:
47.4 years
Michigan median age:
40.3 years
Average household size:
This zip code:
2.4 people
Michigan:
2.4 people
Averages for the 2020 tax year for zip code 48154, filed in 2021:
Average Adjusted Gross Income (AGI) in 2020: $74,172 (Individual Income Tax Returns)
Here:
$74,172
State:
$68,945
Salary/wage: $66,829 (reported on 75.7% of returns)
Here:
$66,829
State:
$57,142
(% of AGI for various income ranges: 953.5% for AGIs below $25k, 3059.6% for AGIs $25k-50k, 5863.3% for AGIs $50k-75k, 8727.6% for AGIs $75k-100k, 16873.1% for AGIs $100k-200k, 57277.8% for AGIs over 200k)
Taxable interest for individuals: $1,169 (reported on 45.4% of returns)
This zip code:
$1,169
Michigan:
$1,630
(% of AGI for various income ranges: 32.9% for AGIs below $25k, 36.8% for AGIs $25k-50k, 83.6% for AGIs $50k-75k, 99.8% for AGIs $75k-100k, 125.2% for AGIs $100k-200k, 591.9% for AGIs over 200k)
Ordinary dividends: $4,095 (reported on 29.5% of returns)
Here:
$4,095
State:
$6,972
(% of AGI for various income ranges: 50.6% for AGIs below $25k, 86.7% for AGIs $25k-50k, 136.4% for AGIs $50k-75k, 196.2% for AGIs $75k-100k, 297.2% for AGIs $100k-200k, 2134.1% for AGIs over 200k)
Net capital gain/loss in AGI: +$7,179 (reported on 25.9% of returns)
Here:
+$7,179
State:
+$20,064
(% of AGI for various income ranges: 15.1% for AGIs below $25k, 53.3% for AGIs $25k-50k, 112.1% for AGIs $50k-75k, 198.6% for AGIs $75k-100k, 448.8% for AGIs $100k-200k, 6413.0% for AGIs over 200k)
Profit/loss from business: +$11,066 (reported on 13.1% of returns)
Here:
+$11,066
State:
+$11,172
(% of AGI for various income ranges: 72.1% for AGIs below $25k, 138.4% for AGIs $25k-50k, 156.3% for AGIs $50k-75k, 235.2% for AGIs $75k-100k, 292.2% for AGIs $100k-200k, 2777.8% for AGIs over 200k)
Taxable individual retirement arrangement distribution: $20,915 (reported on 15.0% of returns)
48154:
$20,915
Michigan:
$19,803
(% of AGI for various income ranges: 103.3% for AGIs below $25k, 221.2% for AGIs $25k-50k, 352.5% for AGIs $50k-75k, 559.9% for AGIs $75k-100k, 873.3% for AGIs $100k-200k, 4438.5% for AGIs over 200k)
Self-employed (Keogh) retirement plans: $17,688 (reported on 0.4% of returns)
48154:
$17,688
Michigan:
$25,132
(% of AGI for various income ranges: 9.3% for AGIs $25k-50k, 15.9% for AGIs $100k-200k, 253.3% for AGIs over 200k)
Total itemized deductions: $26,017 (reported on 8.4% of returns)
Here:
$26,017
State:
$34,117
(% of AGI for various income ranges: 63.4% for AGIs below $25k, 134.4% for AGIs $25k-50k, 340.8% for AGIs $50k-75k, 490.2% for AGIs $75k-100k, 547.7% for AGIs $100k-200k, 2665.6% for AGIs over 200k)
Charity contributions: $7,313 (reported on 6.5% of returns)
Here:
$7,313
State:
$13,548
(% of AGI for various income ranges: 3.6% for AGIs below $25k, 18.7% for AGIs $25k-50k, 46.4% for AGIs $50k-75k, 79.3% for AGIs $75k-100k, 141.6% for AGIs $100k-200k, 999.6% for AGIs over 200k)
Taxes paid: $7,622 (reported on 8.3% of returns)
48154:
$7,622
State:
$7,972
(% of AGI for various income ranges: 10.6% for AGIs below $25k, 27.3% for AGIs $25k-50k, 96.0% for AGIs $50k-75k, 154.7% for AGIs $75k-100k, 188.7% for AGIs $100k-200k, 605.6% for AGIs over 200k)
Earned income credit: $1,655 (reported on 5.9% of returns)
Here:
$1,655
State:
$2,251
(% of AGI for various income ranges: 32.9% for AGIs below $25k, 30.4% for AGIs $25k-50k, 0.7% for AGIs $50k-75k)
Percentage of individuals using paid preparers for their 2020 taxes: 91.6%
Here:
92%
State:
93%
(% for various income ranges: 89.9% for AGIs below $25k, 91.8% for AGIs $25k-50k, 92.4% for AGIs $50k-75k, 91.9% for AGIs $75k-100k, 92.7% for AGIs $100k-200k, 92.4% for AGIs over 200k)
Averages for the 2012 tax year for zip code 48154, filed in 2013:
Average Adjusted Gross Income (AGI) in 2012: $59,611 (Individual Income Tax Returns)
Here:
$59,611
State:
$55,609
Salary/wage: $54,406 (reported on 78.0% of returns)
Here:
$54,406
State:
$46,782
(% of AGI for various income ranges: 62.8% for AGIs below $25k, 63.7% for AGIs $25k-50k, 66.5% for AGIs $50k-75k, 70.1% for AGIs $75k-100k, 79.5% for AGIs $100k-200k, 63.3% for AGIs over 200k)
Taxable interest for individuals: $1,063 (reported on 50.5% of returns)
This zip code:
$1,063
Michigan:
$1,491
(% of AGI for various income ranges: 2.1% for AGIs below $25k, 1.4% for AGIs $25k-50k, 1.0% for AGIs $50k-75k, 0.8% for AGIs $75k-100k, 0.6% for AGIs $100k-200k, 0.7% for AGIs over 200k)
Ordinary dividends: $3,331 (reported on 31.9% of returns)
Here:
$3,331
State:
$6,225
(% of AGI for various income ranges: 3.2% for AGIs below $25k, 2.0% for AGIs $25k-50k, 2.0% for AGIs $50k-75k, 1.5% for AGIs $75k-100k, 1.3% for AGIs $100k-200k, 2.7% for AGIs over 200k)
Net capital gain/loss in AGI: +$2,109 (reported on 23.7% of returns)
Here:
+$2,109
State:
+$9,326
(% of AGI for various income ranges: 0.3% for AGIs $50k-75k, 0.5% for AGIs $75k-100k, 0.6% for AGIs $100k-200k, 5.2% for AGIs over 200k)
Profit/loss from business: +$11,401 (reported on 12.0% of returns)
Here:
+$11,401
State:
+$11,523
(% of AGI for various income ranges: 5.1% for AGIs below $25k, 2.4% for AGIs $25k-50k, 1.9% for AGIs $50k-75k, 2.0% for AGIs $75k-100k, 1.8% for AGIs $100k-200k, 3.6% for AGIs over 200k)
Taxable individual retirement arrangement distribution: $14,219 (reported on 16.9% of returns)
48154:
$14,219
Michigan:
$15,298
(% of AGI for various income ranges: 6.1% for AGIs below $25k, 4.5% for AGIs $25k-50k, 4.1% for AGIs $50k-75k, 4.5% for AGIs $75k-100k, 3.3% for AGIs $100k-200k, 3.9% for AGIs over 200k)
Self-employment retirement plans: $13,775 (reported on 0.4% of returns)
48154:
$13,775
Michigan:
$20,834
(% of AGI for various income ranges: 0.2% for AGIs $50k-75k, 0.4% for AGIs over 200k)
Total itemized deductions: $18,717 (19% of AGI, reported on 40.8% of returns)
Here:
$18,717
State:
$21,628
Here:
19.5% of AGI
State:
18.4% of AGI
(% of AGI for various income ranges: 12.7% for AGIs below $25k, 11.6% for AGIs $25k-50k, 13.3% for AGIs $50k-75k, 12.9% for AGIs $75k-100k, 13.1% for AGIs $100k-200k, 12.3% for AGIs over 200k)
Charity contributions: $2,824 (reported on 36.1% of returns)
Here:
$2,824
State:
$4,225
(% of AGI for various income ranges: 1.1% for AGIs below $25k, 1.3% for AGIs $25k-50k, 1.8% for AGIs $50k-75k, 1.6% for AGIs $75k-100k, 1.9% for AGIs $100k-200k, 1.7% for AGIs over 200k)
Taxes paid: $7,110 (reported on 40.7% of returns)
48154:
$7,110
State:
$8,327
(% of AGI for various income ranges: 2.7% for AGIs below $25k, 3.4% for AGIs $25k-50k, 4.4% for AGIs $50k-75k, 4.9% for AGIs $75k-100k, 5.6% for AGIs $100k-200k, 5.6% for AGIs over 200k)
Earned income credit: $1,660 (reported on 7.1% of returns)
Here:
$1,660
State:
$2,306
(% of AGI for various income ranges: 2.3% for AGIs below $25k, 0.5% for AGIs $25k-50k)
Percentage of individuals using paid preparers for their 2012 taxes: 53.7%
Here:
54%
State:
57%
(% for various income ranges: 48.1% for AGIs below $25k, 55.6% for AGIs $25k-50k, 58.6% for AGIs $50k-75k, 56.8% for AGIs $75k-100k, 54.8% for AGIs $100k-200k, 67.5% for AGIs over 200k)
Averages for the 2004 tax year for zip code 48154, filed in 2005:
Average Adjusted Gross Income (AGI) in 2004: $54,549 (Individual Income Tax Returns)
Here:
$54,549
State:
$48,204
Salary/wage: $51,791 (reported on 80.2% of returns)
Here:
$51,791
State:
$42,791
(% of AGI for various income ranges: 83.5% for AGIs below $10k, 55.0% for AGIs $10k-25k, 63.9% for AGIs $25k-50k, 73.2% for AGIs $50k-75k, 81.3% for AGIs $75k-100k, 80.9% for AGIs over 100k)
Taxable interest for individuals: $1,506 (reported on 69.3% of returns)
This zip code:
$1,506
Michigan:
$1,725
(% of AGI for various income ranges: 7.5% for AGIs below $10k, 5.7% for AGIs $10k-25k, 2.9% for AGIs $25k-50k, 1.9% for AGIs $50k-75k, 1.3% for AGIs $75k-100k, 1.3% for AGIs over 100k)
Taxable dividends: $2,278 (reported on 41.7% of returns)
Here:
$2,278
State:
$3,420
(% of AGI for various income ranges: 5.8% for AGIs below $10k, 3.9% for AGIs $10k-25k, 2.3% for AGIs $25k-50k, 2.0% for AGIs $50k-75k, 1.2% for AGIs $75k-100k, 1.4% for AGIs over 100k)
Net capital gain/loss: +$2,575 (reported on 31.2% of returns)
Here:
+$2,575
State:
+$8,532
(% of AGI for various income ranges: -4.7% for AGIs below $10k, -0.2% for AGIs $10k-25k, 0.5% for AGIs $25k-50k, 0.5% for AGIs $50k-75k, 0.7% for AGIs $75k-100k, 3.1% for AGIs over 100k)
Profit/loss from business: +$10,259 (reported on 11.3% of returns)
Here:
+$10,259
State:
+$9,547
(% of AGI for various income ranges: 4.2% for AGIs below $10k, 4.1% for AGIs $10k-25k, 2.9% for AGIs $25k-50k, 2.2% for AGIs $50k-75k, 1.6% for AGIs $75k-100k, 1.8% for AGIs over 100k)
IRA payment deduction: $3,188 (reported on 2.7% of returns)
48154:
$3,188
Michigan:
$2,875
(% of AGI for various income ranges: 0.4% for AGIs below $10k, 0.3% for AGIs $10k-25k, 0.3% for AGIs $25k-50k, 0.2% for AGIs $50k-75k, 0.1% for AGIs $75k-100k, 0.1% for AGIs over 100k)
Self-employed pension: $10,870 (reported on 0.7% of returns)
Here:
$10,870
Michigan:
$13,826
(% of AGI for various income ranges: 0.1% for AGIs $25k-50k, 0.1% for AGIs $50k-75k, 0.1% for AGIs $75k-100k, 0.2% for AGIs over 100k)
Total itemized deductions: $17,415 (21% of AGI, reported on 49.4% of returns)
Here:
$17,415
State:
$18,509
Here:
20.8% of AGI
State:
20.7% of AGI
(% of AGI for various income ranges: 16.0% for AGIs below $10k, 14.8% for AGIs $10k-25k, 15.8% for AGIs $25k-50k, 17.5% for AGIs $50k-75k, 17.1% for AGIs $75k-100k, 14.3% for AGIs over 100k)
Charity contributions deductions: $2,549 (3% of AGI, reported on 46.6% of returns)
Here:
$2,549
State:
$3,365
Here:
3.0% of AGI
State:
3.6% of AGI
(% of AGI for various income ranges: 0.8% for AGIs below $10k, 1.5% for AGIs $10k-25k, 1.9% for AGIs $25k-50k, 2.3% for AGIs $50k-75k, 2.3% for AGIs $75k-100k, 2.3% for AGIs over 100k)
Total tax: $7,439 (reported on 82.2% of returns)
48154:
$7,439
State:
$7,691
(% of AGI for various income ranges: 2.3% for AGIs below $10k, 4.6% for AGIs $10k-25k, 7.5% for AGIs $25k-50k, 8.9% for AGIs $50k-75k, 10.0% for AGIs $75k-100k, 15.2% for AGIs over 100k)
Earned income credit: $1,192 (reported on 3.8% of returns)
Here:
$1,192
State:
$1,737
Percentage of individuals using paid preparers for their 2004 taxes: 54.5%
Here:
54%
State:
60%
(% for various income ranges: 44.7% for AGIs below $10k, 55.8% for AGIs $10k-25k, 59.5% for AGIs $25k-50k, 57.7% for AGIs $50k-75k, 54.7% for AGIs $75k-100k, 55.9% for AGIs over 100k)
Likely homosexual households (counted as self-reported same-sex unmarried-partner households)
Lesbian couples: 0.1% of all households
Gay men: 0.2% of all households
Household received Food Stamps/SNAP in the past 12 months: 448 Household did not receive Food Stamps/SNAP in the past 12 months: 14,460
Women who had a birth in the past 12 months: 297 (253 now married, 47 unmarried) Women who did not have a birth in the past 12 months: 6,822 (3,138 now married, 3,674 unmarried)
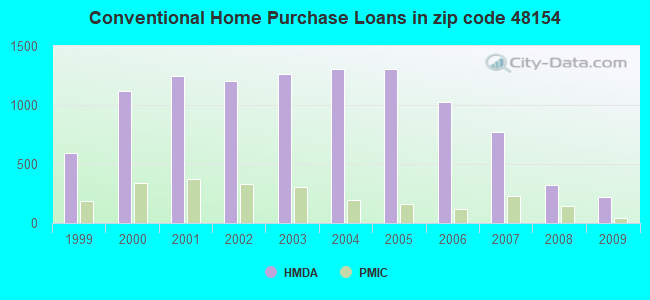
Housing units in zip code 48154 with a mortgage: 8,272 (905 second mortgage, 823 both second mortgage and home equity loan) Houses without a mortgage: 311
Median monthly owner costs for units with a mortgage: $1,639 Median monthly owner costs for units without a mortgage: $657
Residents with income below the poverty level in 2022:
This zip code:
3.0%
Whole state:
13.4%
Residents with income below 50% of the poverty level in 2022:
This zip code:
1.4%
Whole state:
6.9%
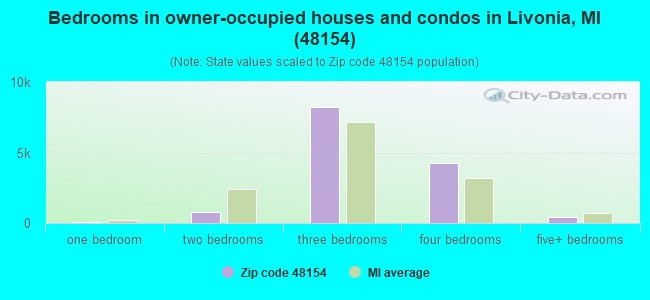
Median number of rooms in houses and condos:
Here:
6.8
State:
6.5
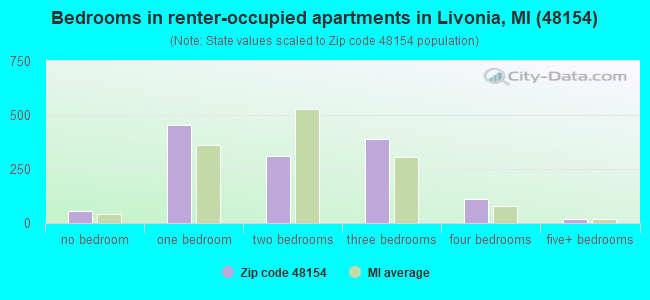
Median number of rooms in apartments:
Here:
4.3
State:
4.3
Notable locations in this zip code not listed on our city pages
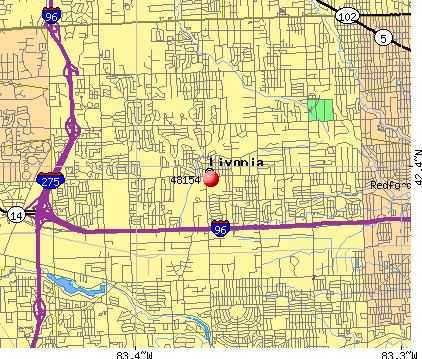
Notable locations in zip code 48154: Idylwyld Golf Club (A), Burton Hollow Surf Club (B), Wayne County District Courthouse (C), Henry Ford Medical Center - Livonia (D), Botsford Family Health Center (E), Oakwood Healthcare Center - Livonia (F), Livonia Civic Center (G), Livonia Civic Center Library (H), Livonia Fire and Rescue Station 1 Headquarters (I). Display/hide their locations on the map
Shopping Centers: Mid-Five Center Shopping Center (1), Merri-Five Center Shopping Center (2), Livonia Shopping Center (3), Livonia Plaza Shopping Center (4), Newburgh Plaza Shopping Center (5), The New Five Village Shopping Center (6). Display/hide their locations on the map
Churches in zip code 48154 include: Holy Trinity Church (A), Saint Timothy Church (B), Ascension Church (C), Bethany Church (D). Display/hide their locations on the map
Parks in zip code 48154 include: Algonquin Park (1), Buckingham Park (2), Castle Gardens Park (3), Compton Park (4), Henry Ford Field (5), Kingsbury Park (6), Greenwood Park (7), Blue Grass Park (8), Tiffany Park (9). Display/hide their locations on the map
5,090 married couples with children.
1,126 single-parent households (368 men, 758 women).
91.8% of residents of 48154 zip code speak English at home.
1.2% of residents speak Spanish at home (80% very well, 13% well, 7% not well).
4.3% of residents speak other Indo-European language at home (77% very well, 12% well, 10% not well, 1% not at all).
0.8% of residents speak Asian or Pacific Island language at home (68% very well, 19% well, 12% not well, 2% not at all).
1.9% of residents speak other language at home (69% very well, 16% well, 15% not well).
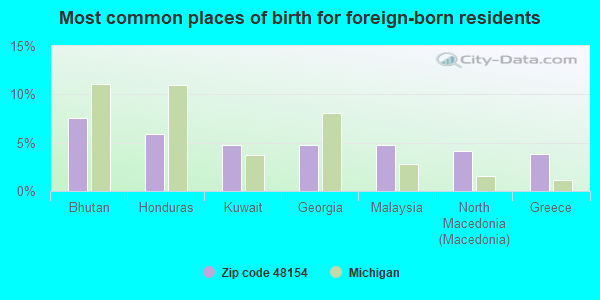
Foreign born population: 2,393 (6.4%) (74.3% of them are naturalized citizens)
Major facilities with environmental interests located in this zip code:
5 & INKSTER AMOCO (27430 FIVE MILE ROAD in LIVONIA, MI)
AIR MINOR (AIRS/AFS) (Integrated Compliance Information System) - ICIS-05-2001-0421, FORMAL ENFORCEMENT ACTION (Resource Conservation and Recovery Act (tracking hazardous waste)) Business SIC classification: AUTOMOTIVE REPAIR SHOPS Organizations: ZONER JARVIS L (CONTACT/OPERATOR)
Alternative names: AMOCO OIL CO BELLE CREEK
ADAMS ELEMENTARY SCHOOL (28201 LYNDON STREET in LIVONIA, MI)
(National Center for Education Statistics) - STATE ID-00020 Organizations: LIVONIA PUBLIC SCHOOLS (SCHOOL DISTRICT)
FROST MIDDLE SCHOOL (14041 STARK ROAD in LIVONIA, MI)
(National Center for Education Statistics) - STATE ID-03229 Organizations: LIVONIA PUBLIC SCHOOLS (SCHOOL DISTRICT)
AMOCO OIL CO 5756 BINGHAMS STANDARD (36375 5 MILE in LIVONIA, MI)
(Resource Conservation and Recovery Act (tracking hazardous waste)) Organizations: AMOCO OIL COMPANY (CONTACT/OWNER)
AMOCO OIL CO 9581 (29255 5 MILE RD in LIVONIA, MI)
(Resource Conservation and Recovery Act (tracking hazardous waste))
ATOMA INTERNATIONAL OF AMERICA (19700 HAGGERTY ROAD in LIVONIA, MI)
(Resource Conservation and Recovery Act (tracking hazardous waste)) TRI REPORTER (Tracking of toxic chemicals releasing facilities) Alternative names: ATOMA INTERIOR SYSTEMS ENGINEERING DIV
CENTURY CAR WASH (36235 FIVE MILE RD in LIVONIA, MI)
(Resource Conservation and Recovery Act (tracking hazardous waste)) Organizations: DAVID LOUISELLE (CONTACT/OWNER)
ARGUS CORP (15115 SPANICH CT in LIVONIA, MI)
(Resource Conservation and Recovery Act (tracking hazardous waste))
FEDERAL EXPRESS (NEWBERG LAKE in LIVONIA, MI)
(Resource Conservation and Recovery Act (tracking hazardous waste)) Alternative names: FEDERAL EXPRESS (E)
EPI PRINTERS (13305 WAYNE RD in LIVONIA, MI)
Small Quantity Generators, between 100 kg and 1000 kg of hazardous waste/month (Resource Conservation and Recovery Act (tracking hazardous waste)) Business NAICS classification: QUICK PRINTING. Organizations: PATRIZK J KOLODZIEJCZAK (CONTACT/OPERATOR)
A R KRAMER INC (15986 MIDDLEBELT RD in LIVONIA, MI)
Small Quantity Generators, between 100 kg and 1000 kg of hazardous waste/month (Resource Conservation and Recovery Act (tracking hazardous waste)) - notification Organizations: ARTHUR KRAMER (CONTACT/OWNER)
FARANSO AUTOMOTIVE INC (36251 5 MILE RD in LIVONIA, MI)
Conditionally Exempt Small Quantity Generators, less than 100 kg/month of hazardous waste (Resource Conservation and Recovery Act (tracking hazardous waste)) Business NAICS classification: GENERAL AUTOMOTIVE REPAIR. Organizations: ROBERT J. FARANSO (CONTACT/OPERATOR)
Alternative names: LIVONIA CAR CARE
GLAMOUR CLEANERS (31244 5 MILE RD in LIVONIA, MI)
Conditionally Exempt Small Quantity Generators, less than 100 kg/month of hazardous waste (Resource Conservation and Recovery Act (tracking hazardous waste)) - notification Organizations: RISTOVSKI ZLATKO (CONTACT/OWNER)
Housing units lacking complete plumbing facilities: 0.5% Housing units lacking complete kitchen facilities: 0.6%
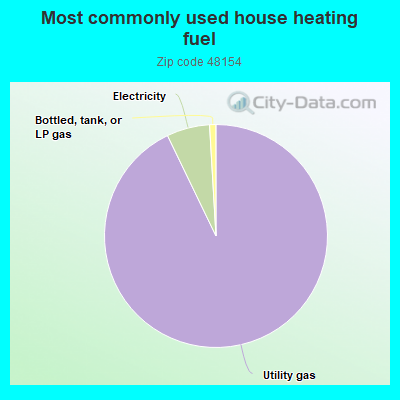
92.2%Utility gas
6.2%Electricity
0.9%Bottled, tank, or LP gas
Population in 1990: 43,007.
Place of birth for U.S.-born residents:
This state: 30,053
Northeast: 805
Midwest: 1,598
South: 1,343
West: 748
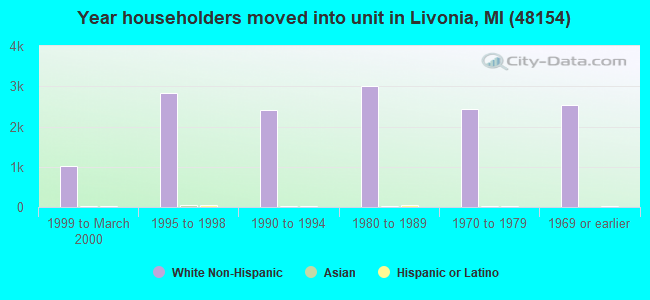
72% of the 48154 zip code residents lived in the same house 5 years ago. Out of people who lived in different houses, 72% lived in this county. Out of people who lived in different counties, 50% lived in Michigan.
91% of the 48154 zip code residents lived in the same house 1 year ago. Out of people who lived in different houses, 47% moved from this county. Out of people who lived in different houses, 28% moved from different county within same state. Out of people who lived in different houses, 20% moved from different state. Out of people who lived in different houses, 7% moved from abroad.
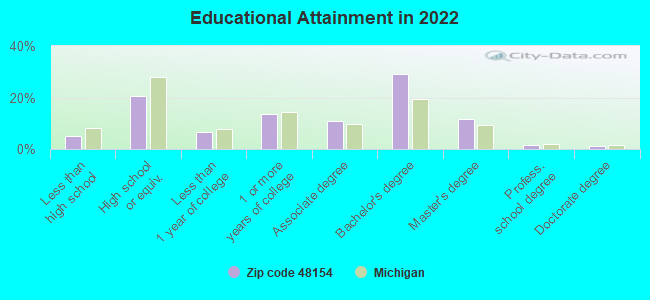
Private vs. public school enrollment:
Students in private schools in grades 1 to 8 (elementary and middle school): 386
Here:
12.5%
Michigan:
12.4%
Students in private schools in grades 9 to 12 (high school): 332
Here:
20.2%
Michigan:
9.8%
Students in private undergraduate colleges: 388
Here:
20.6%
Michigan:
14.9%
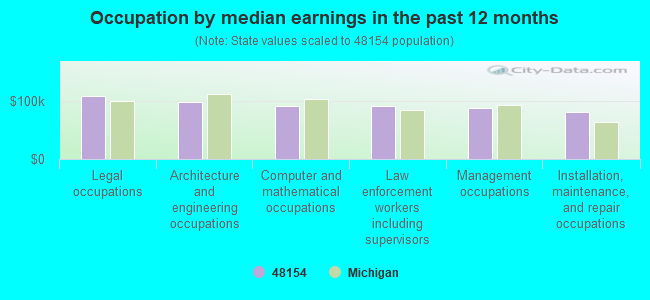
Occupation by median earnings in the past 12 months ($)
108,601Legal occupations
98,502Architecture and engineering occupations
92,377Computer and mathematical occupations
91,664Law enforcement workers including supervisors
89,170Management occupations
81,492Installation, maintenance, and repair occupations
Companies with federal contracts located in this zip code (LIVONIA, MI):
IOCAD ENGINEERING SERVICES (14137 FARMINGTON ROAD; small business) : $1,481,480 in 2 contractsin 2000
$1,469,000 with Federal Emergency Management Agency (disused code: now 7022) for Vocational/Technical. Signed on 2000-09-15. Completion date: 2001-09-15.
$12,480 with Navy for Architect - Engineer Services (including landscaping, interior layout, and designing). Taking place in DC. Signed on 2000-10-01. Completion date: 2001-09-28.
LARKIN & ASSOCIATES (15728 FARMINGTON ROAD; small business) : $813,078 in 19 contractsfrom 2000 to 2006
Contracts for Expert Witness, Other Management Support Services, Other Research and Development -- Basic Research (R&D), Lectures For Training, and moreby Offices, Boards and Divisions (includes Attorney General, Deputy Attorney General, etc.), Navy Signed by year:2000: $100,000; 2001: $162,330; 2002: $372,821; 2003: $19,787; 2004: $21,832; 2005: $92,319; 2006: $43,989.
Biggest contracts:
$177,200 with Offices, Boards and Divisions (includes Attorney General, Deputy Attorney General, etc.) for Expert Witness. Signed on 2002-12-15. Completion date: 2003-09-15.
$167,000, same as above.Signed on 2002-05-15. Completion date: 2002-09-15.
$137,000, same as above.Signed on 2001-03-15. Completion date: 2001-09-15.
$100,000, same as above.Signed on 2000-11-15. Completion date: 2001-09-15.
FLUID RECYCLING SERVICES COMPA (37623 PEMBROOKE; small business) : $702,150 in 5 contractsfrom 2000 to 2004
Contracts for Maintenance, Repair and Rebuilding of Equipment -- Service and Trade Equipment by Air Force Signed by year:2000: $275,000; 2001: $300,000; 2002: $0; 2003: $0; 2004: $127,150; 2005: $0; 2006: $0.
Biggest contracts:
$300,000 with Air Force for Maintenance, Repair and Rebuilding of Equipment -- Service and Trade Equipment. Taking place in OK. Signed on 2001-09-25. Completion date: 2002-09-30.
$275,000, same as above.Signed on 2000-09-11. Completion date: 2001-09-30.
$64,150, same as above.Signed on 2004-11-30. Completion date: 2005-01-31.
$63,000, same as above.Signed on 2004-11-02. Completion date: 2004-11-30.
BISCO INDUSTRIES (14800 FARMINGTON RD # 101; small business)
$1,580 with Navy for Screws. Taking place in MD. Signed on 2005-01-28. Completion date: 2005-05-11.
AMERICAN EAGLE PROPERTY MAINTA (14453 ARDEN; small business)
-$2,970 with Navy for Snow Removal/Salt Service (also spreading aggregate or other snow melting material). Taking place in NY. Signed on 2005-09-07. Completion date: 2005-09-30.
Top industries in this zip code by the number of employees in 2005:
Health Care and Social Assistance: Nursing Care Facilities (100-249 employees: 4 establishments, 50-99 employees: 1 establishment, 10-19 employees: 1 establishment)
Professional, Scientific, and Technical Services: Process, Physical Distribution, and Logistics Consulting Services (500-999: 1, 5-9: 1)
2002 - 2018 National Fire Incident Reporting System (NFIRS) incidents
Based on the data from the years 2002 - 2018 the average number of fires per year is 48. The highest number of reported fire incidents - 80 took place in 2002, and the least - 0 in 2006. The data has a declining trend.
When looking into fire subcategories, the most incidents belonged to: Outside Fires (31.5%), and Mobile Property/Vehicle Fires (30.1%).
Fire incident types reported to NFIRS in Zip Code 48154
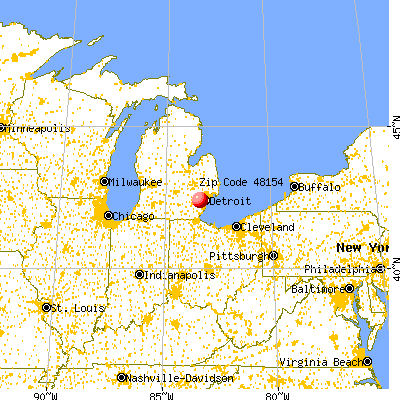


 Nearest zip codes: 48150, 48152, 48185, 48336, 48335, 48240.
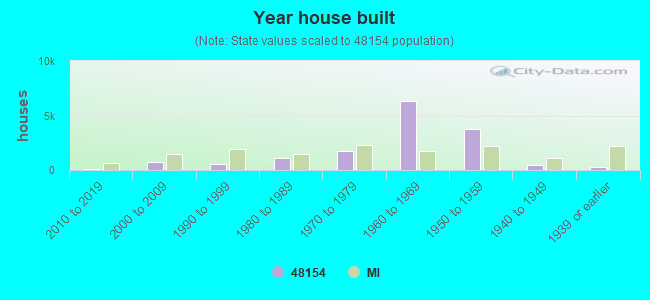


 Based on the data from the years 2002 - 2018 the average number of fires per year is 48. The highest number of reported fire incidents - 80 took place in 2002, and the least - 0 in 2006. The data has a declining trend.
 When looking into fire subcategories, the most incidents belonged to: Outside Fires (31.5%), and Mobile Property/Vehicle Fires (30.1%).